Article

Genetic Diversity in Three Sinipercine Fishes Based on Mitochondrial D-Loop and COX1 Sequences

1
College of Fisheries, Chinese Perch Research Center, Huazhong Agricultural University, Wuhan 430070, China
2
Pearl River Fisheries Research Institute, Chinese Academy of Fishery Sciences, Guangzhou 510380, China
3
Hubei Aquaculture Technology Extension Center (Hubei Aquatic Breeds Introduction and Breeding Center), Wuhan 430061, China
*
Author to whom correspondence should be addressed.
Fishes 2025, 10(6), 264; https://doi.org/10.3390/fishes10060264
Submission received: 16 March 2025 / Revised: 23 April 2025 / Accepted: 19 May 2025 / Published: 3 June 2025
(This article belongs to the Section Taxonomy, Evolution, and Biogeography)

Abstract

Mandarin fish (Siniperca chuatsi), golden mandarin fish (Siniperca scherzeri), and Coreoperca whiteheadi are three important aquaculture species in China facing several threats to their production. Genetic diversity was assessed by sequencing the mitochondrial D-loop and cox1 regions in 207 individuals across nine populations. The genetic diversity analysis, based on the concatenated sequences, revealed that the total haplotype diversity was high across all sinipercine fish populations. Population differentiation analysis revealed that most genetic variation was within populations: 74.5% in S. chuatsi (p < 0.001) and 83.0% in S. scherzeri (p < 0.001). All five S. chuatsi populations showed moderate and significant genetic differentiation, and moderate genetic differentiation was observed between the Beijiang and Wujiang populations in S. scherzeri. Phylogenetic and nested clade analysis indicated that artificially bred and wild S. chuatsi populations shared haplotypes, and close phylogenetic relationships were observed between the Beijiang and Dongjiang populations in S. scherzeri. These findings could be useful for the conservation management, artificial breeding, and hybridization of these three sinipercine fish species.
Key Contribution: This study investigated the genetic diversity and population structure of three sinipercine fish species (S. chuatsi, S. scherzeri, and C. whiteheadi) through mitochondrial DNA analysis (D-loop and cox1). Key findings include shared haplotypes between wild and farmed S. chuatsi, closer phylogenetic relationships between certain S. scherzeri populations, and potential gene flow. These findings provide valuable insights for developing effective conservation strategies and sustainable aquaculture practices for these economically important species.

1. Introduction

Genetic diversity is an essential component of biodiversity [1]. Research into the genetic diversity of species not only aids in our understanding of germplasm resources but also provides scientific solutions for species conservation and utilization [2]. Furthermore, such research has significant implications for selective breeding and genetic improvement [3]. Key issues for developing management strategies include genetic diversity, population genetic structure, and gene flow [4,5]. The genetic structure of populations is shaped by the interplay of ecological and genetic factors. Population genetic structure refers to the distribution of genetic variation within and among populations, shaped by evolutionary processes such as genetic drift, migration, mutation, and selection. It is distinct from genetic diversity, which quantifies the variability of alleles within a population, and gene flow, which describes the movement of genetic material between populations [6]. Investigating population genetic structure and gene flow is essential for understanding genetic characteristics and population dynamics, providing critical insights for conservation planning for rare and endangered species with restricted geographical distributions [7].
Mitochondrial DNA (mtDNA) serves as an excellent candidate marker, proving suitable for studies of population genetics and molecular systematics [8]. The mitochondrial D-loop region has been shown to have more variable sequences than other regions of mtDNA [9]. Cox1, also known as cytochrome oxidase subunit I, has a moderate rate of evolution [10]. The mitochondrial genome is maternally inherited [11]. Consequently, genetic diversity and population structure studies in fish species have integrated the results of analyses based on the mtDNA D-loop and cox1 genes [12,13,14,15]. The sinipercine subfamily, including species such as Siniperca chuatsi, Siniperca scherzeri, and Coreoperca whiteheadi, is important both ecologically and economically in East Asia. Previous genetic studies have focused on mitochondrial DNA to understand their diversity and phylogenetic relationships. The complete mitochondrial genome of Siniperca obscura (16,492 bp) was sequenced, providing insights into the species’ phylogeny [16]. Combined analyses of mitochondrial and microsatellite markers in S. scherzeri revealed distinct evolutionary lineages with significant regional differentiation, providing valuable insights for conservation and breeding programs [17]. Furthermore, the mitochondrial genome of a hybrid between S. chuatsi and S. kneri was sequenced, offering valuable insights into the genetic mechanisms underlying hybridization in Sinipercinae [18].
The aquaculture industry has developed rapidly in recent years [19]. Unfortunately, the accelerated intensification of aquaculture production has simultaneously compromised both natural resource sustainability and genetic diversity conservation. [20]. Mandarin fish (Siniperca chuatsi), a member of the Sinipercinae, is native to China and is one of the most important freshwater economic fishes in the country [21]. It is also distributed in Vietnam, Japan, the Korean peninsula, and the Russian Far East [22,23]. Due to its rapid growth and high meat quality, S. chuatsi has been cultured in many provinces in China [24]. However, artificiality bred populations typically exhibit reduced genetic diversity due to selective breeding for commercially desirable traits, including accelerated growth rates, enhanced meat production, and improved resistance to both pathogens and environmental stressors. [25,26,27]. The golden mandarin fish (S. scherzeri) and C. whiteheadi, both members of the subfamily Sinipercinae, are widely distributed freshwater species native to China, and are also found in Vietnam and the Korean peninsula [22,23]. S. scherzeri is often crossed with S. chuatsi because of its various important economic traits, such as acceptance of minced fish and resistance to environmental stress [28]. However, the natural resources of the other two sinipercine species have declined dramatically in recent years due to anthropogenic interference and overexploitation [17]. Thus, the analysis of genetic diversity among the three sinipercine species, particularly for S. chuatsi and S. scherzeri, is crucial not only for understanding their evolutionary history but also for informing long-term resource management and sustainable use strategies.
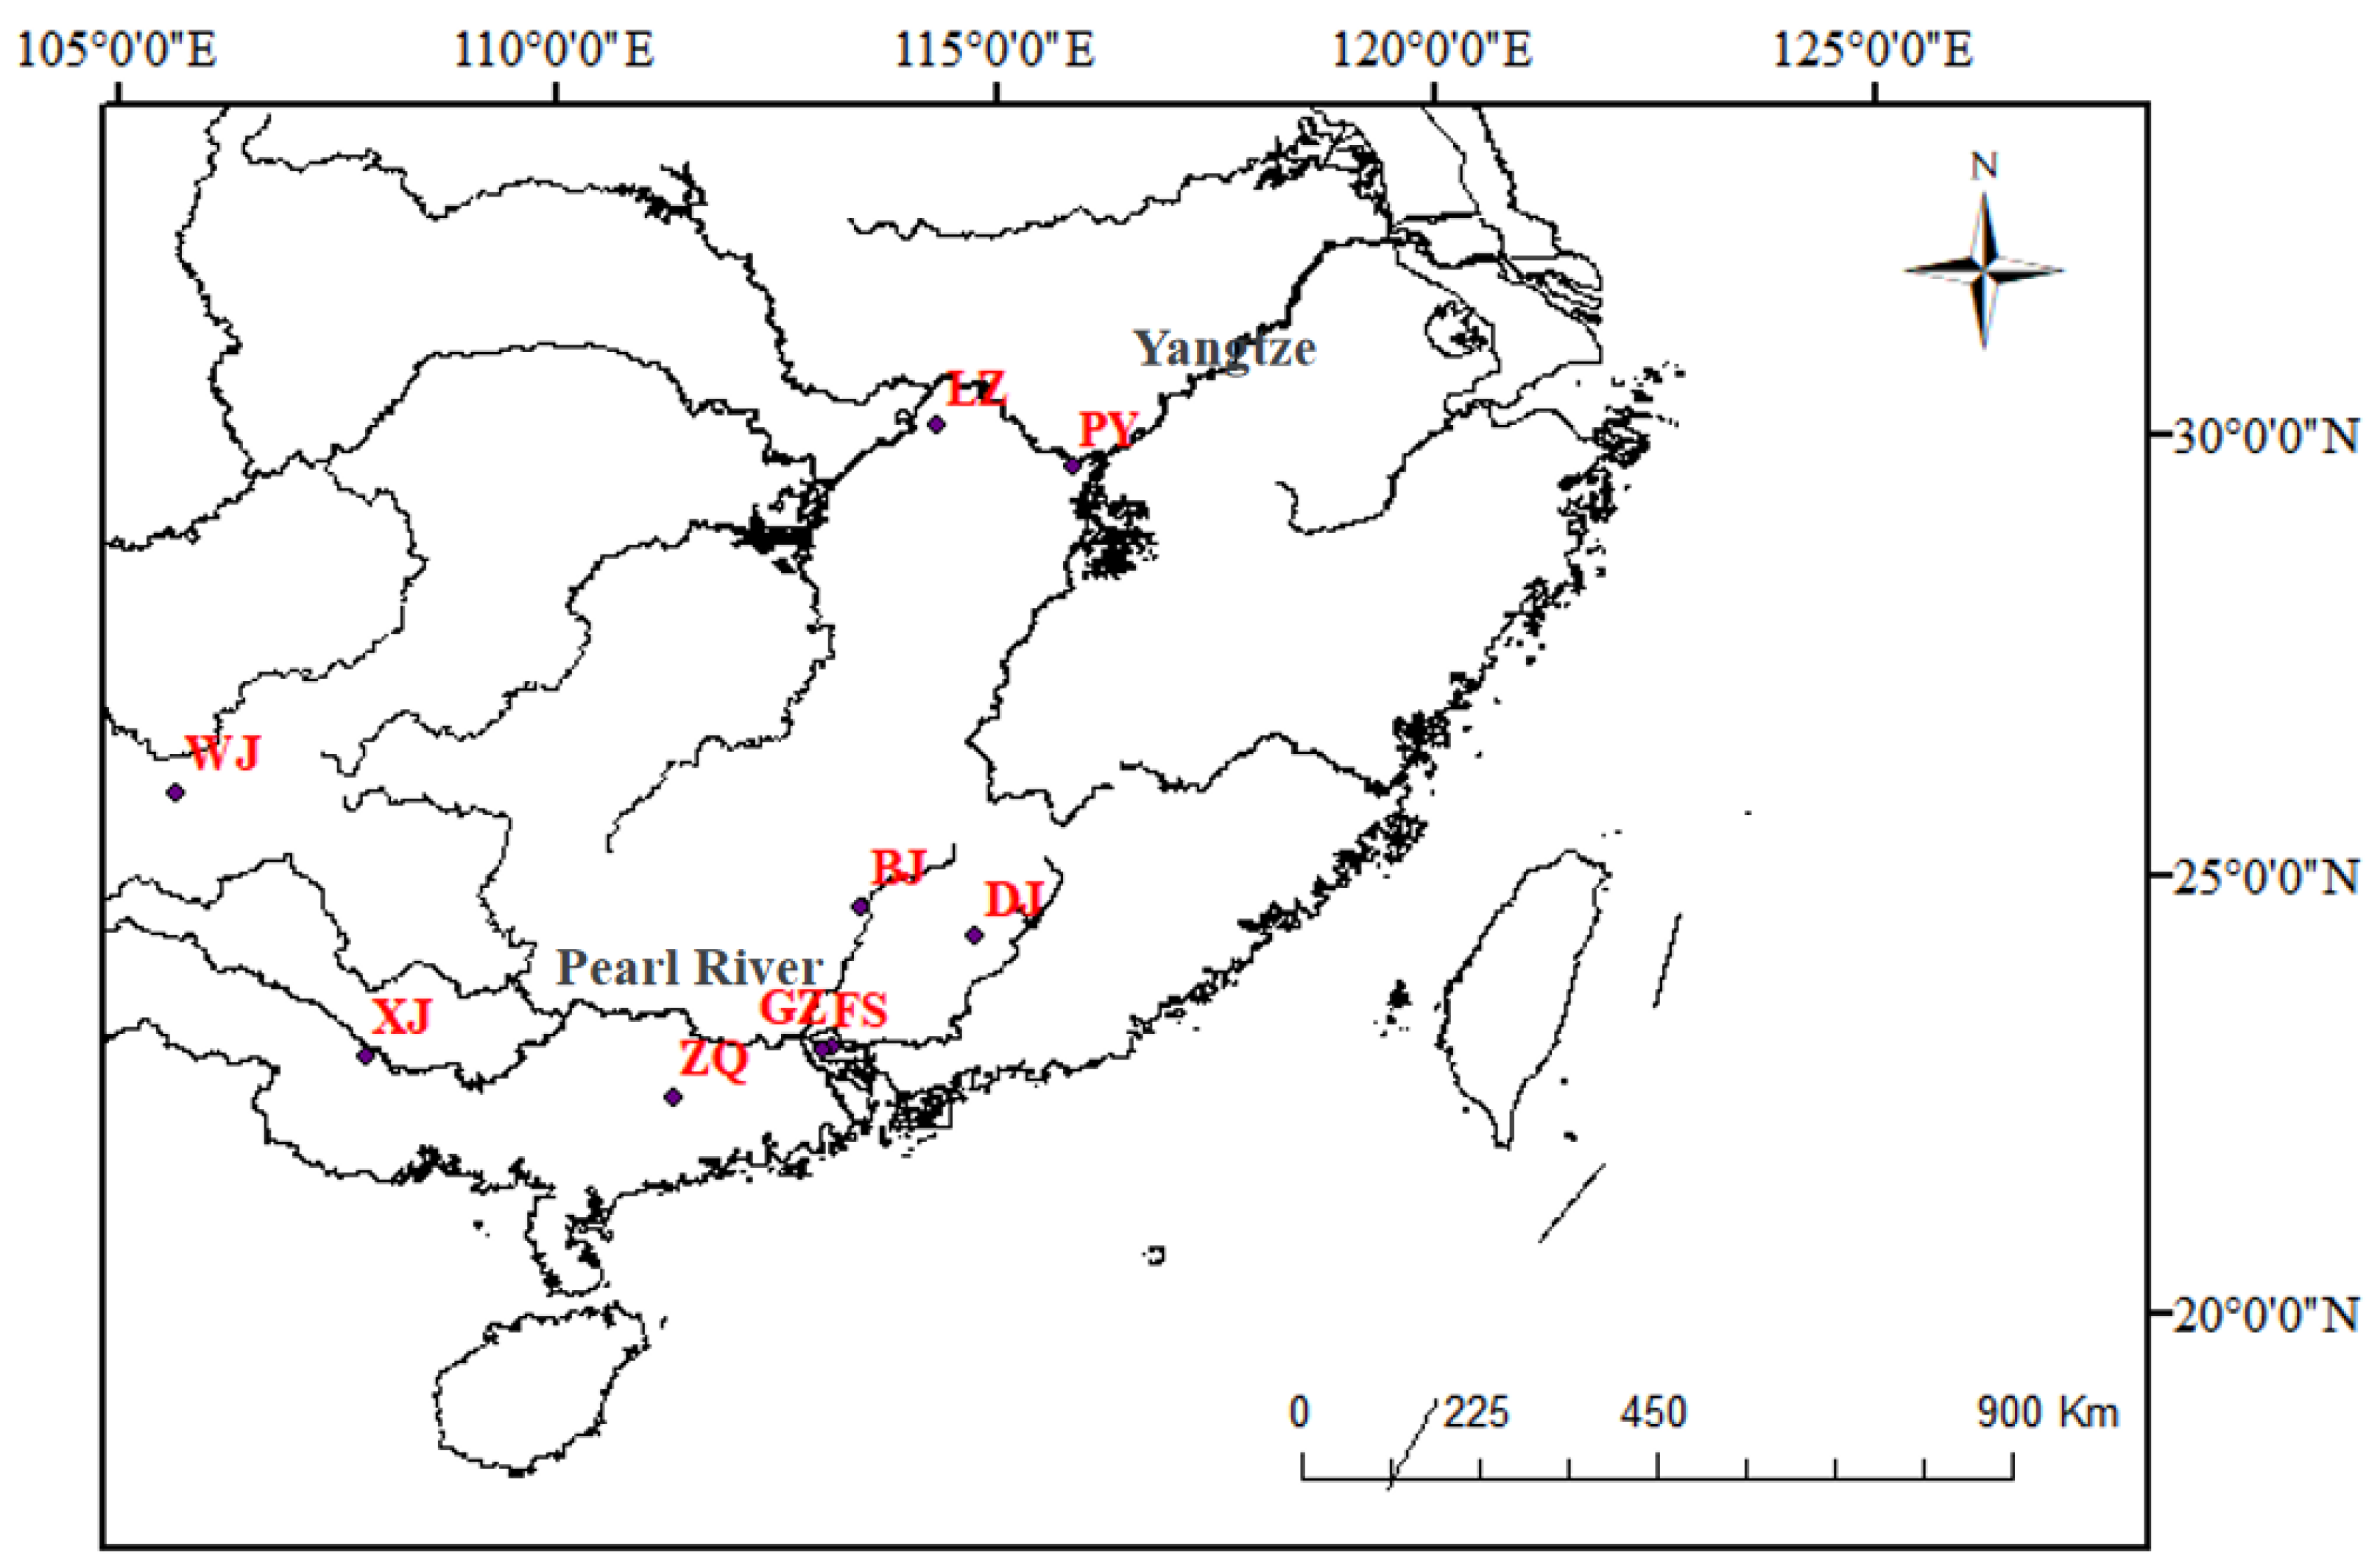
In this study, we aimed to analyze the population genetic structure of S. chuatsi and S. scherzeri in China. To achieve this, we examined the population subdivision and genetic variability of S. chuatsi across five populations and S. scherzeri across three populations using the D-loop region and the cox1 gene. Additionally, we characterized the phylogenetic relationships within S. chuatsi populations and assessed the relationships between S. chuatsi, the wild species S. scherzeri, and C. whiteheadi. The results of this study provide valuable insights for the conservation and sustainable management of S. chuatsi resources and supporting artificial hybridization efforts among these economically important fish species.

2. Materials and Methods

2.1. Sample Collection and DNA Extraction

Sampling was conducted between 2015 and 2018 using nets operated by local fishermen. Fin clips were collected from the specimens and preserved in 75% ethanol. The species of fish were identified based on morphological characters [29]. A total of 207 individuals, including 107 S. chuatsi specimens (five populations: three cultured and two wild), 93 S. scherzeri specimens (three wild populations), and 7 C. whiteheadi specimens (one wild population), were sampled (Figure 1 and Table 1). These nine populations included Wujiang River (WJ), Liangzi Lake (LZ), and Poyang Lake (PY) (all wild), three tributaries of the Pearl River (Dongjiang, Xijiang, and Beijiang) (all wild), and Guangdong Province (Guangzhou, Zhaoqing, and Foshan) (all cultured) (Figure 1). The cultured fish were obtained from commercial fish farms, where they were maintained as part of a controlled aquaculture system.
Total DNA from each sample was stored in 95% ethanol at −80 °C. DNA was extracted using a genomic DNA Kit (Tiangen, Beijing, China).

2.2. PCR and Sequencing

The mitochondrial D-loop (NC_058042.1) region was amplified using the following primers: PercF: 5′-GCATTCAAGTACATTAATCTTTTA-3′ and PercR: 5′-TTTATTCAAAATCCTTTCCACC-3′. Cox1 (NC_015822.1) was amplified using the following primers: SSCF: 5′-CAGAAGTTTACATTTTAATTCTTC-3′ and SSCR: 5′-AGGGTGTATCCTGTGAACAGG-3′. PCR was performed separately for each primer pair in a total reaction volume of 40 µL with the following components: 20 μL of 2× PCR buffer for KOD-FX neo (TOYOBO, Shanghai, China), 8 μL of dNTPs, 0.8 μL of KOD-FX neo Taq polymerase (TOYOBO, Shanghai, China), 1 μL of template DNA, 2 μL of each primer, and 6.2 μL of ddH2O. The PCR procedure was as follows: initial denaturation at 94 °C for 3 min, followed by 35 cycles of 94 °C for 30 s, annealing at 55 °C for 30 s, and 72 °C for 1 min, and a final extension at 72 °C for 5 min. The amplified products were purified with a TIANGEN DNA kit (Tiangen, Beijing, China) and sequenced using an ABI 3130 DNA sequencer by Sangon Biotech (Shanghai, China).

2.3. Data Analysis

The D-loop and cox1 sequences were manually edited using DNAstar Lasergene v7.1 (DNASTAR, Madison, WI, USA) [30] and aligned with Clustal X v2.0 (Conway Institute, Dublin, Ireland) [31]. The sequences were concatenated to integrate information from both regions for further analyses, providing higher resolution for evaluating genetic structure. Nucleotide composition and nucleotide saturation were tested using MEGA X v10.2 (Penn State University, State College, PA, USA) [32]. Genetic diversity indices, including the number of polymorphic sites (S), haplotype number (H), haplotype diversity (Hd), nucleotide diversity (π), and the average number of nucleotide differences (K), were calculated using DnaSP v5.0 (Universitat de Barcelona, Barcelona, Spain) [33]. These indices were determined separately for the D-loop and cox1 regions, as shown in Table 1, to compare the contribution of each region to genetic variation. Additionally, indices were calculated for the concatenated mtDNA sequences to provide a comprehensive assessment of genetic diversity.
Pairwise genetic differentiation (Fst) values were calculated using the concatenated mtDNA sequences, which integrate information from both the D-loop and cox1 regions. This approach allowed for a more robust evaluation of genetic differentiation among populations. Genetic distances were calculated using the Kimura 2-parameter (K2P) model, selected based on its widespread use for fish mitochondrial markers [34], and confirmed through model testing in MEGA X, which identified K2P as the best fit for our data (lowest BIC score). This combined approach enabled a thorough evaluation of genetic structure and diversity from different perspectives, leveraging both individual and population level concatenated sequence data.
Phylogenetic relationships based on haplotype data were reconstructed using the neighbor-joining (NJ) method, maximum likelihood (ML) method, Bayesian inference (BI), and median-joining (MJ) network analyses. These phylogenetic analyses were performed to evaluate whether all methods supported the same topology. Three C. whiteheadi haplotypes were used as the outgroup. The Kimura 2-parameter and HKY models were used for the NJ and ML analyses, respectively, in MEGA X. Bootstrapping analysis was performed with 1000 replicates. The best-fitting nucleotide substitution model for concatenated sequences was determined in Phylosuite v1.2.2 (Institute of Zoology, Chinese Academy of Sciences, Beijing, China) according to Bayesian information criterion (BIC) scores: HKY+F+I+G4 [35,36]. Bayesian inference (BI) analysis was implemented using MrBayes v3.2.7 (Stockholm University, Stockholm, Sweden) [37]. Two runs were conducted with four chains for 2,000,000 generations. A haplotype network was constructed by the median-joining method [38] using PopART v1.7 (University of Otago, Dunedin, New Zealand) [39]. The sample locations along rivers or lakes were built in ArcMap v10.2 (Esri, Redlands, CA, USA) [40].

3. Results

3.1. Mitochondrial DNA (mtDNA) Sequence Data and Genetic Diversity

The mitochondrial DNA (mtDNA) D-loop and cox1 regions were amplified from 207 individuals, generating fragments of 502 bp and 489 bp after trimming. These fragments were concatenated into a single mtDNA sequence of 991 bp for further analysis. Substitution saturation analysis indicated that the concatenated sequences had not reached saturation, as genetic distance and nucleotide substitution rates maintained a linear relationship, ensuring their suitability for phylogenetic and population genetic studies. Of the five S. chuatsi populations, 97 variable sites were detected, 4 of which were singletons, and 93 were parsimony-informative. Of the three S. scherzeri populations, 111 variable sites were detected, 14 of which were singletons, and 97 were parsimony-informative. Additionally, eight variable sites were detected, seven of which were singletons, and one was parsimony-informative in C. whiteheadi.
A total of 57 haplotypes were observed in the concatenated D-loop+cox1 sequences, including 23 haplotypes across five S. chuatsi populations, 31 haplotypes across three S. scherzeri populations, and 3 haplotypes across one C. whiteheadi population (Table 1). All S. scherzeri population data indicated that the D-loop has higher genetic diversity than cox1 sequences; the same was the case for S. chuatsi and C. whiteheadi populations. Among the 23 concatenated mtDNA haplotypes of S. chuatsi, only 4 haplotypes were shared among populations. The total haplotype diversity was 0.823, and the highest and lowest levels were observed in GZ (Hd = 0.775) and FS (Hd = 0.510), respectively. The total nucleotide diversity was 0.01745, and the highest and lowest levels were observed in GZ (π = 0.0317) and LZ (π = 0.00069), respectively. Both haplotype diversity and nucleotide diversity were higher in the WJ population (Hd = 0.941, π = 0.0188) than in the BJ and DJ populations (Hd = 0.846 and 0.697; π = 0.00305 and 0.00381) (Table 1). Haplotype data showed that BJ and DJ populations shared six haplotypes, while no haplotypes were shared with the WJ population. This result indicated higher genetic similarity between the BJ and DJ populations and genetic differentiation of the WJ population, likely due to geographical separation (Table 1).
The average number of nucleotide differences (K values) was calculated based on the concatenated D-loop+cox1 sequences to assess genetic variability within populations. For S. chuatsi, K values ranged from 0.667 in the LZ population to 30.460 in the GZ population, indicating that the GZ population exhibited significantly higher genetic diversity compared to LZ. Similarly, for S. scherzeri, the WJ population displayed the highest K value (K = 20.34), whereas the BJ (K = 3.31) and DJ (K = 4.13) populations showed comparatively low values. These results were consistent with the observed patterns of haplotype and nucleotide diversity, where WJ exhibited the greatest genetic variability. For C. whiteheadi, K values were relatively low across all samples (K = 2.48), reflecting its limited sample size and restricted distribution. Overall, the findings indicate that populations with larger sample sizes and distribution across more diverse habitats exhibited higher genetic diversity, while those with smaller sample sizes and more isolated populations showed reduced genetic variation.

3.2. Population Genetic Structure

The Kimura 2-parameter (K2P) distances were small within in the five S. chuatsi populations (ranging from 0.006 to 0.107 based on the D-loop and 0.001 to 0.077 based on cox1). In the three S. scherzeri populations, the genetic distance ranged from 0.005 to 0.065 based on the D-loop and from 0.001 to 0.037 based on cox1 (Table 2). For the concatenated mtDNA sequences, the pairwise FST values between S. chuatsi populations varied from 0.111 (ZQ and GZ) to 0.456 (FS and LZ) (Table 3). The pairwise FST values within BJ, WJ, and DJ of S. scherzeri ranged from 0.102 to 0.200 (Table 4). In the S. chuatsi populations, estimated gene flow was highest between ZQ and GZ (Nm = 4.01) and was lowest between FS and LZ (Nm = 0.60) (Table 2). In S. chuatsi populations, the estimated gene flow between ZQ and GZ was the highest (Nm = 4.01), and that between FS and PY was the lowest (Nm = 0.79) (Table 5). High gene flow was inferred among three S. scherzeri populations (Nm > 1) (Table 6). Inferred gene flow patterns for other groups are presented in Table 2. These findings collectively indicated that substantial genetic differences exist between populations of both S. chuatsi and S. scherzeri.
An AMOVA analysis of S. chuatsi quantified genetic partitioning among groups and among populations within groups based on the concatenated mtDNA sequences (Table 7) and indicated that most genetic variation was within populations (74.51%, p < 0.001). Group 1 included GZ, FS, and ZQ, while Group 2 included LZ and PY; 19.47% of the variation was observed among populations within groups, and 6.01% was observed among groups. The AMOVA results for S. scherzeri indicated that most genetic variation was within populations (82.94%, p < 0.001) and 17.06% was among populations (Table 8).

3.3. Phylogenetic Relationships Among Haplotypes

In phylogenetic analyses, bifurcating haplotype trees obtained with different methods (NJ, ML, and BI analyses) were essentially identical, and most nodes had high bootstrap support (>70% or posterior probability > 0.9) (Figure 2). The best-fit molecular model of mutation for BI analyses was HKY+F+G based on the concatenated mtDNA sequences. The reconstructed tree showed that two deep clades could be identified with three C. whiteheadi haplotypes as the outgroup (Figure 2). Branches with bootstrap support below 50% were collapsed into polytomies to avoid over-interpretation of weakly supported relationships. The upper branch included most S. scherzeri haplotypes and two S. chuatsi haplotypes (S. c. Hap4 and 7). The lower branch included most S. chuatsi haplotypes and four S. scherzeri haplotypes (S. s. Hap14–17). BJ was close to the DJ population and shared six haplotypes (S. s. Hap1–5 and 7) within S. scherzeri. In the concatenated mtDNA sequence tree, the haplotypes within S. chuatsi were admixed, and four haplotypes were shared (S. s. Hap1, 4, 9, and 18) (Figure 2).
The median-joining networks for the S. chuatsi (Figure 3) and S. scherzeri populations (Figure 4) shared relationship similar to those of the reconstructed tree analysis. Hap9 was the most common haplotype among the S. chuatsi populations in the obtained network (Figure 3). In addition, all haplotypes of the S. scherzeri populations (Figure 4) clustered into two major lineages (Ⅰ and Ⅱ): lineage Ⅰ included the BJ and DJ populations, and lineage Ⅱ included only the WJ population.

4. Discussion

Despite its nutritional and economic importance, S. chuatsi genetic resources and artificial hybridization with other sinipercine fishes have only rarely been reported [41,42]. In this study, we aimed to measure the genetic diversity and population structure of S. chuatsi, S. scherzeri, and C. whiteheadi to aid senetic resource management and artificial hybridization.
Haplotype diversity (Hd) and nucleotide diversity (π) are two important indicators of genetic diversity among species or populations [43]. We analyzed data from the D-loop region and cox1 sequences in 207 sinipercine fishes (107 S. chuatsi, 93 S. scherzeri, and 7 C. whiteheadi). In most of the sampled populations, the D-loop region exhibited more haplotypes than the cox1 sequences, with the exception of the LZ population. The higher genetic diversity observed in the D-loop region compared to cox1 is consistent with the results of previous studies that documented greater variation in the D-loop region [14,44]. Many researchers have used concatenated sequences in analyses to improve the reliability of the results [13,36]. We thus used concatenated sequences of the D-loop region and cox1 to further understand genetic diversity and population structure. The five 
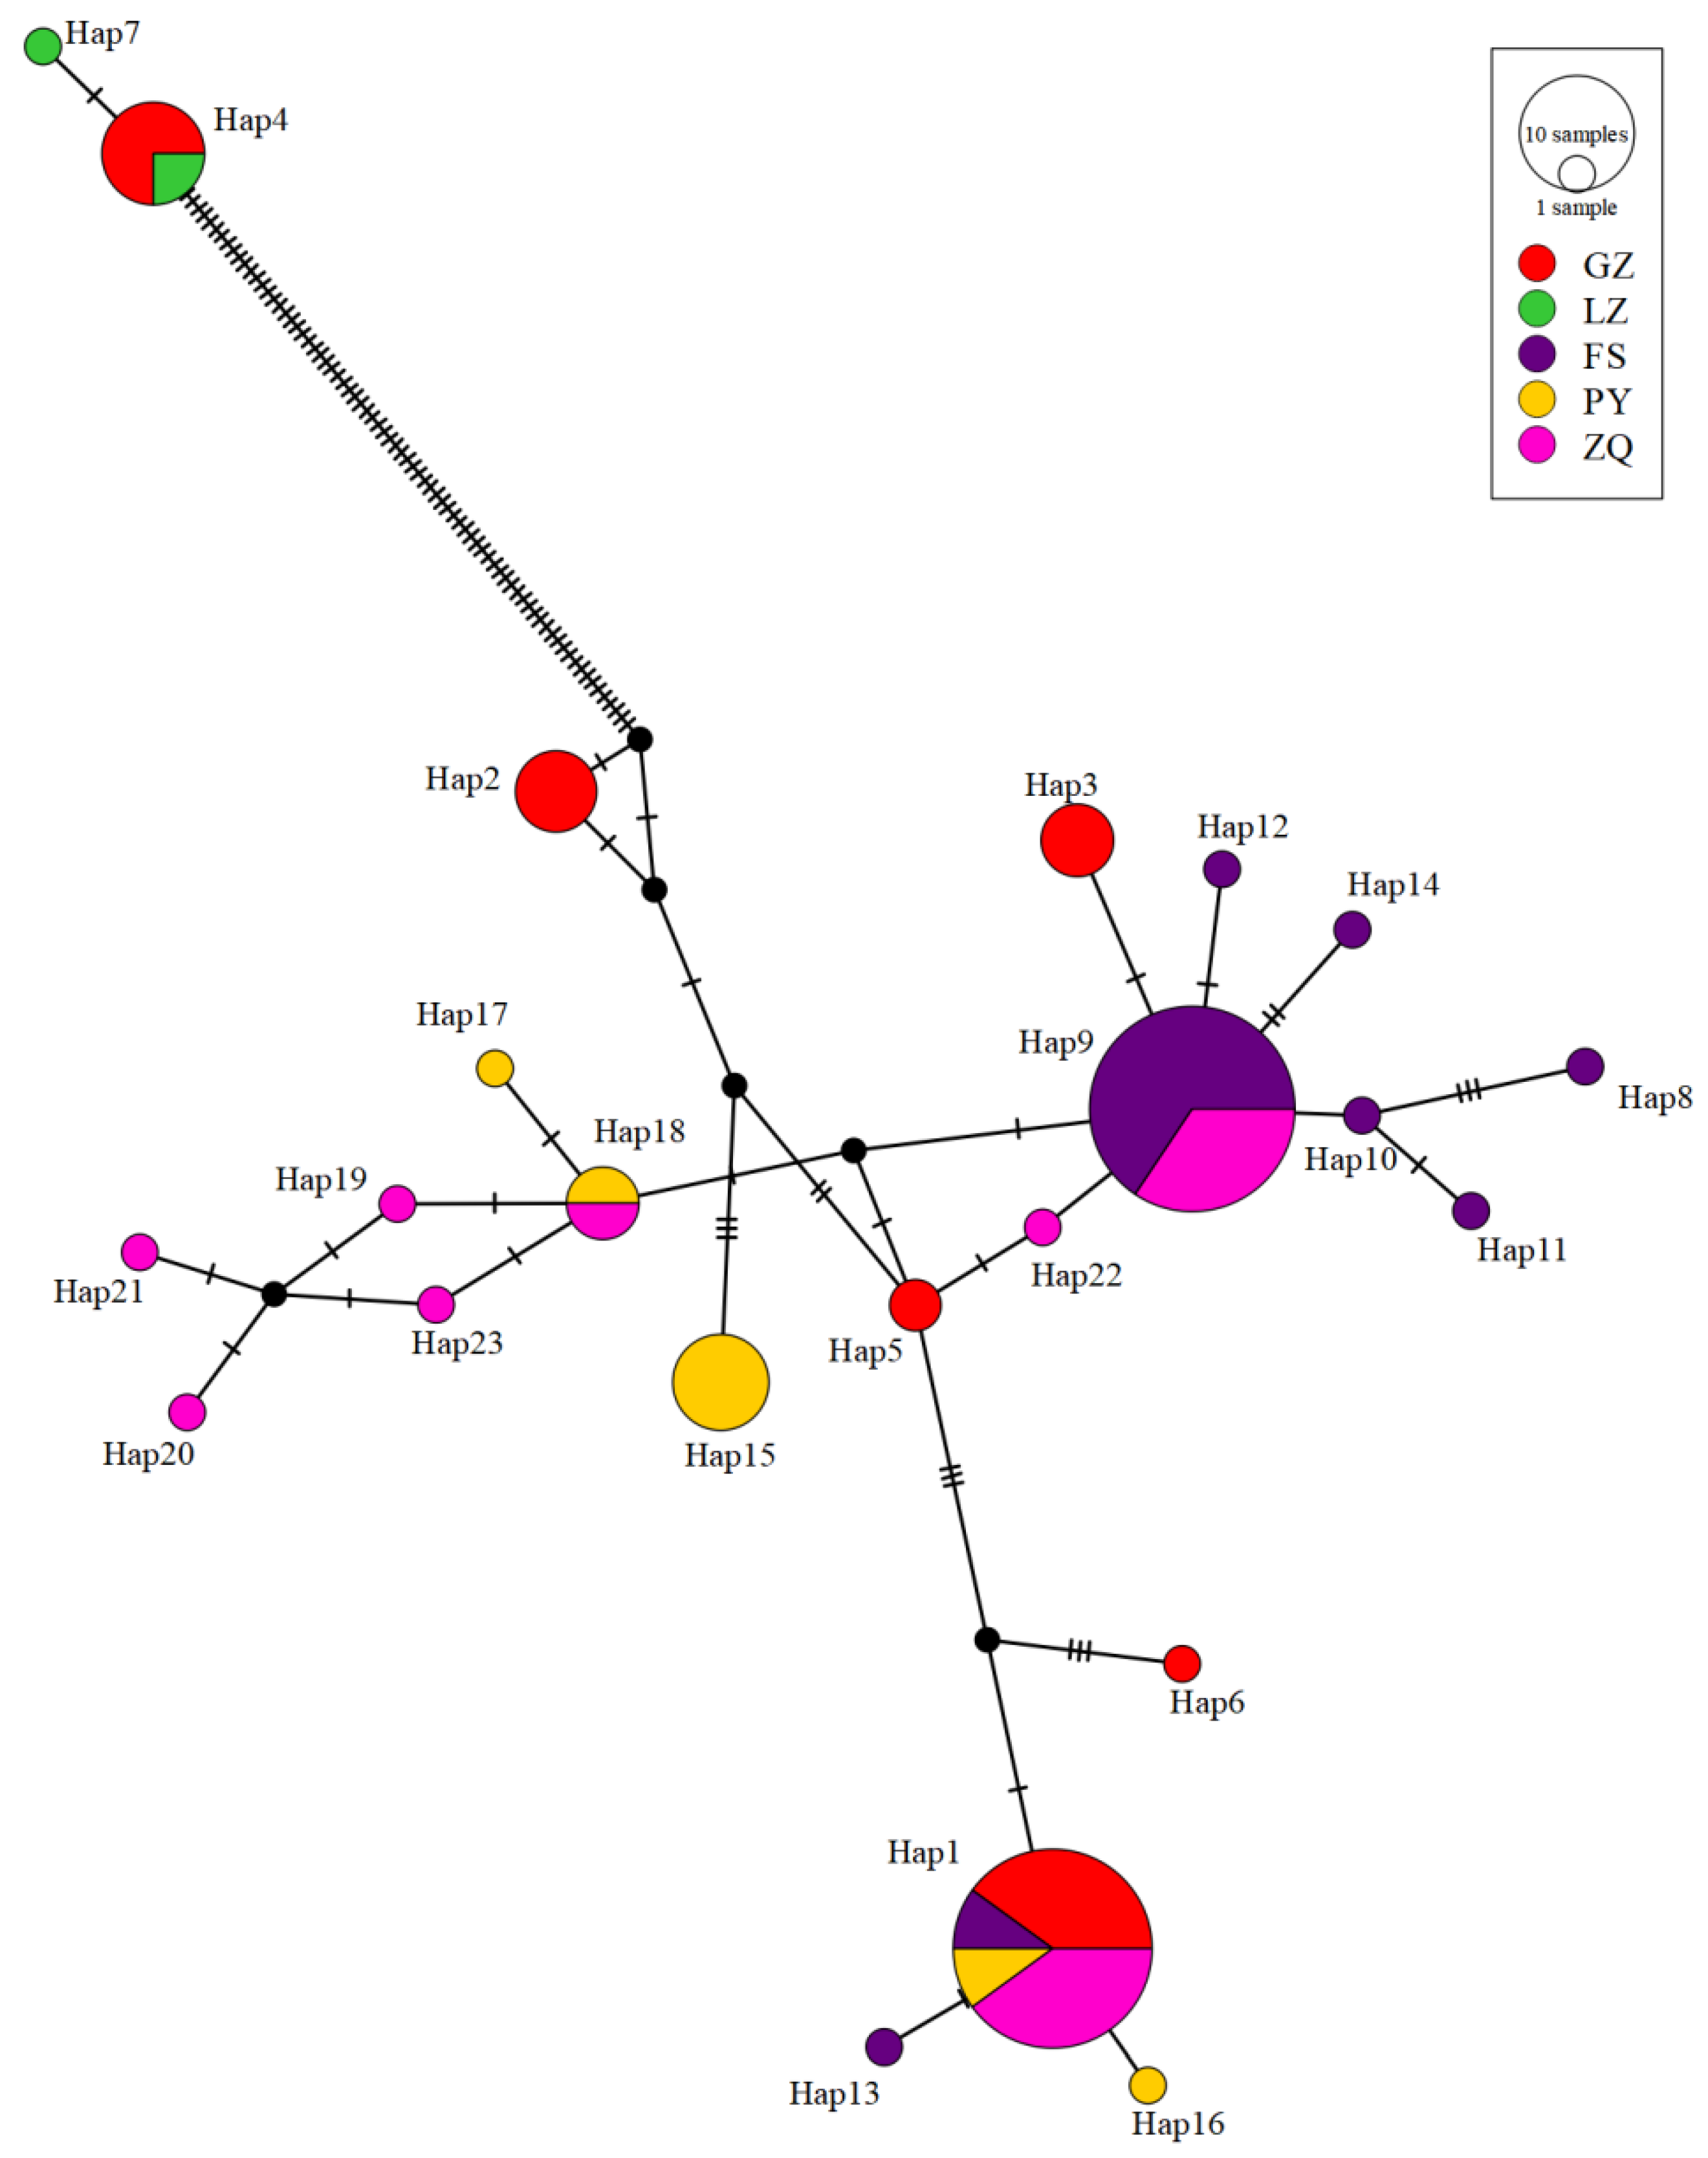
S. chuatsi populations, namely GZ, FS, ZQ, LZ, and PY, all had a high diversity of haplotypes (Hd > 0.5), indicating substantial genetic variation. However, the FS, ZQ, and LZ populations exhibited lower nucleotide diversity (π < 0.005) compared to the GZ and PY populations, reflecting lesser nucleotide variation. Similar results were obtained for the BJ and DJ populations of S. scherzeri and C. whiteheadi. This observation is consistent with the results of previous studies of sinipercine fishes [17,
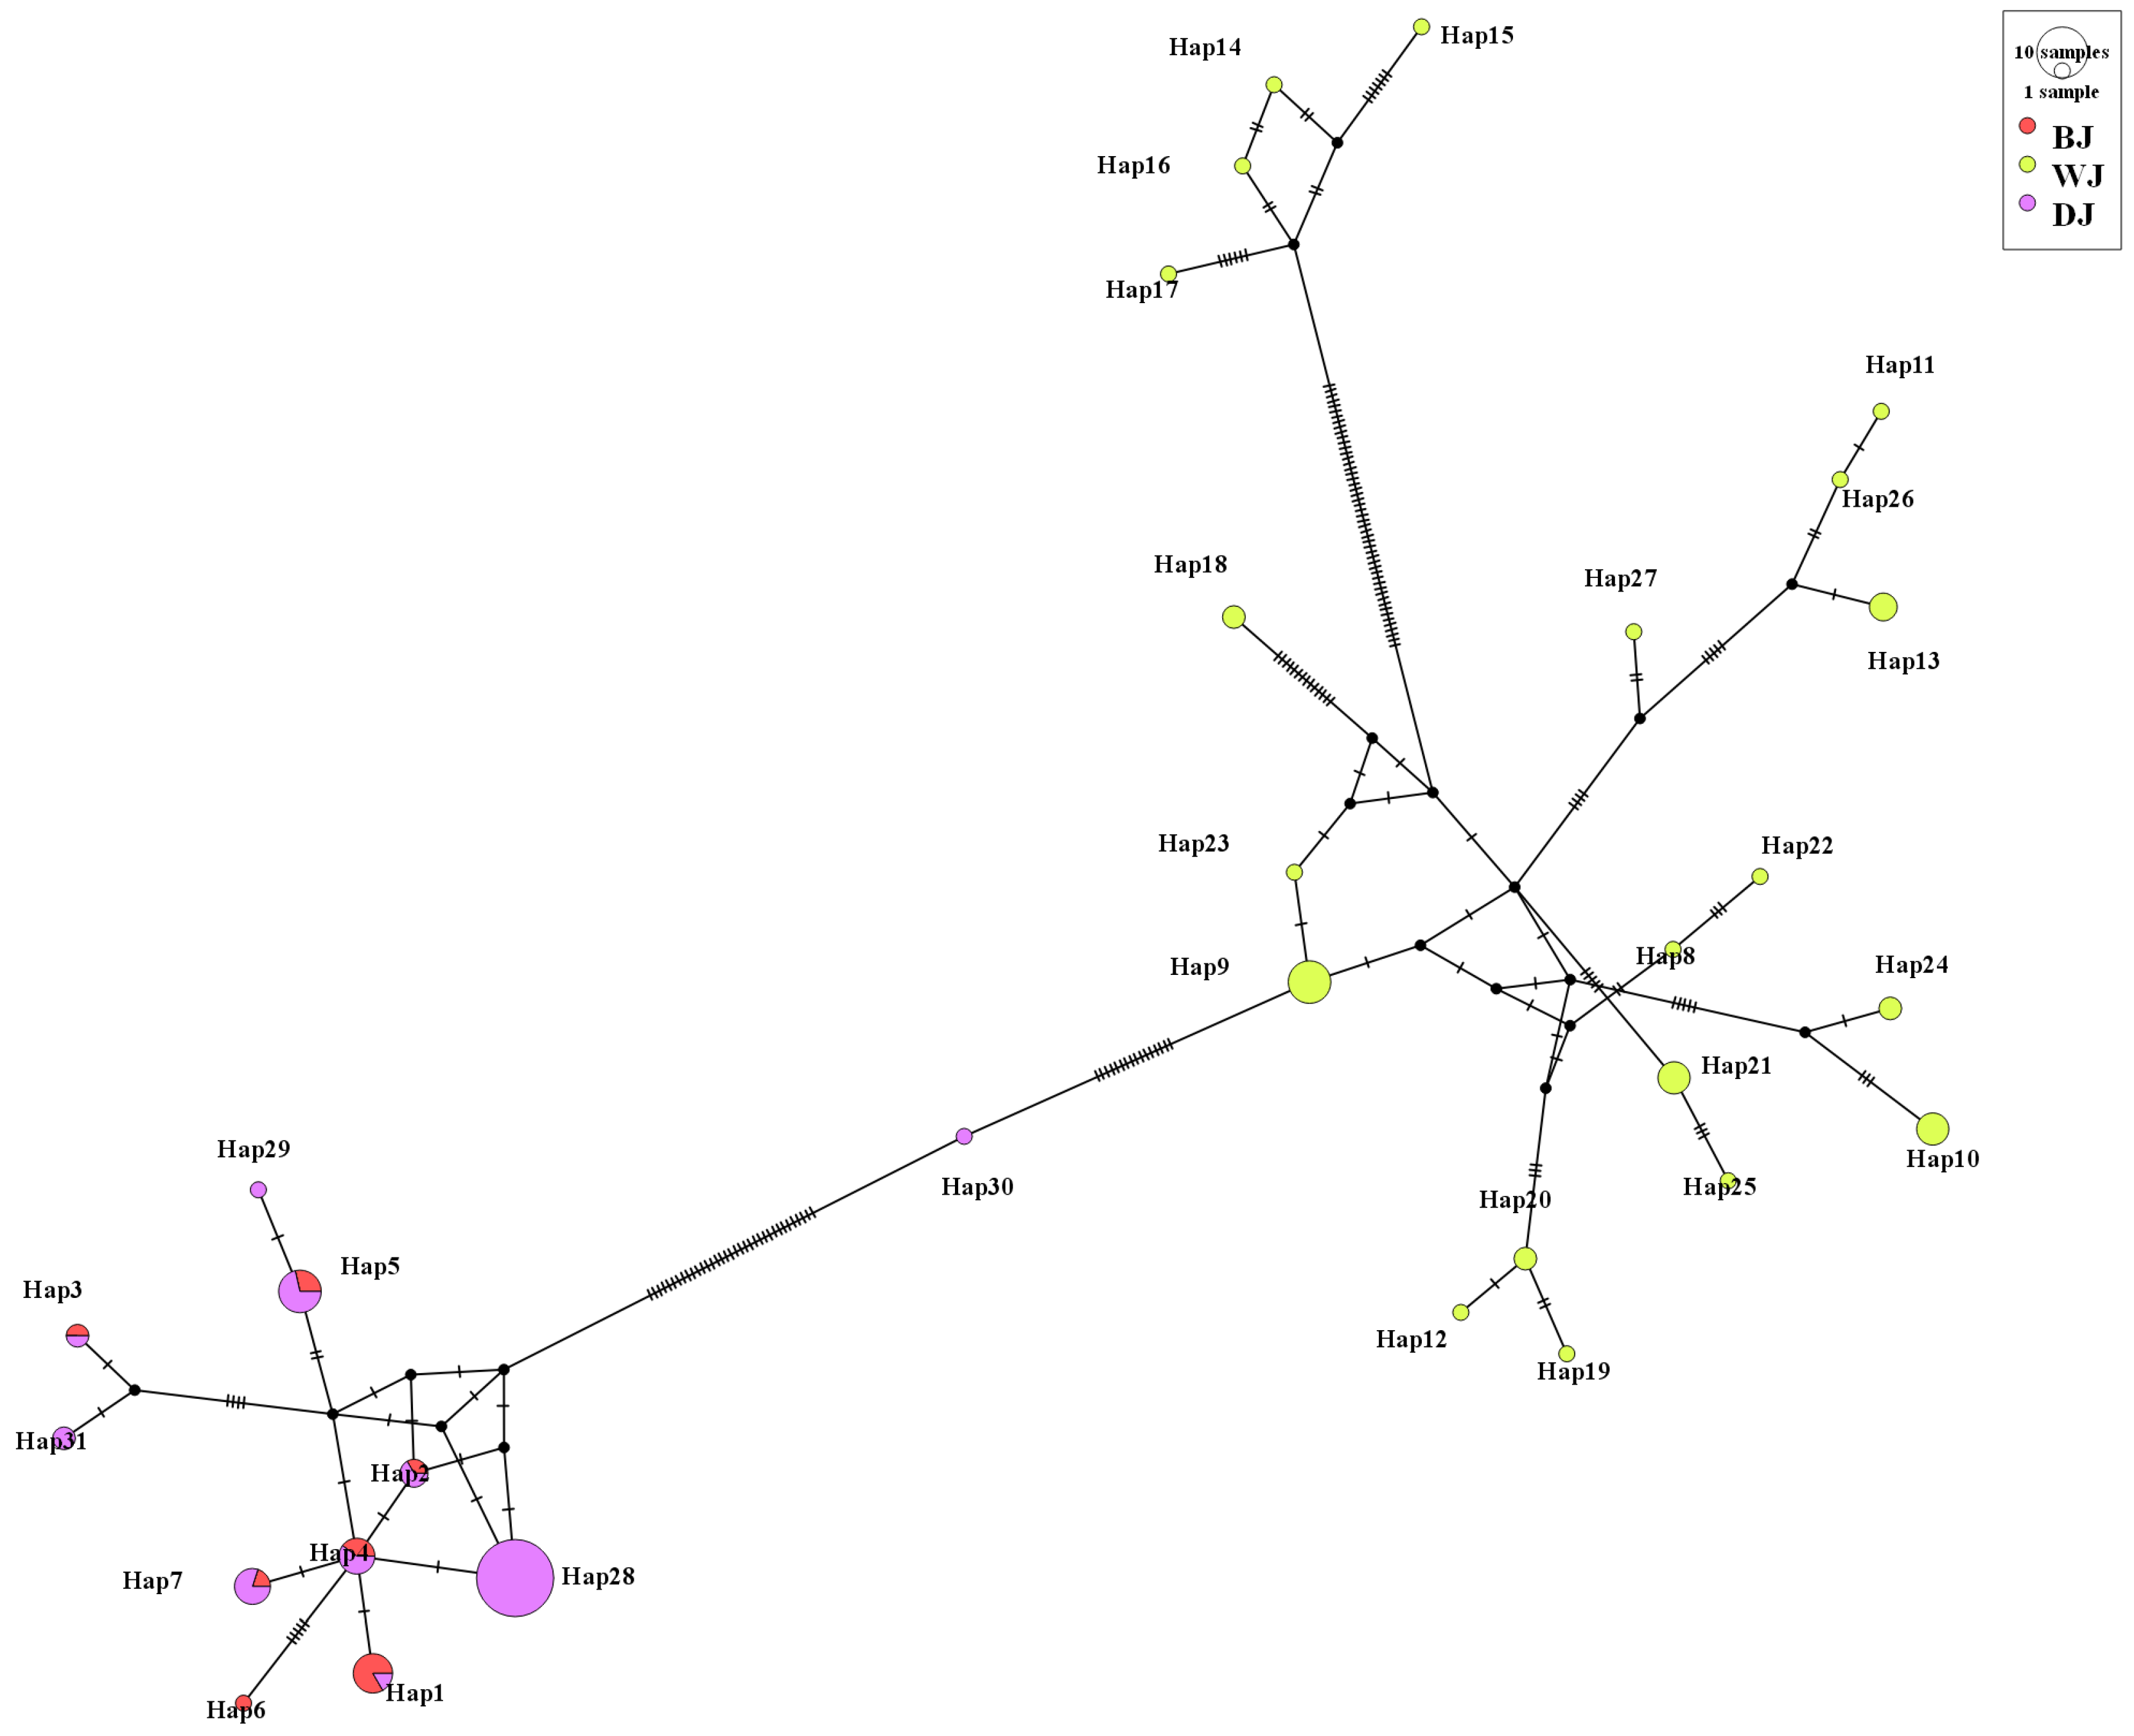
45]. Genetic diversity is important for selective breeding for market traits and is responsive to the influence of genetic bottlenecks, geographical isolation, and artificial selection. For domesticated animals, we need to be cautious about captive breeding because if we mate offspring indiscriminately, genetic diversity will become limited, and after many generations, genetic diversity can be depleted, resulting in inbreeding. FS cultured populations have lower genetic diversity than wild populations, which might stem from the tendency to have a limited number of broodstock in captive breeding. There is thus a need to improve the genetic management of these species. Compared to the BJ and DJ populations, the WJ population showed high haplotype diversity and high nucleotide diversity. The WJ population’s higher genetic diversity likely reflects lower anthropogenic pressure and greater habitat connectivity compared to those in other watersheds.
Genetic distance analysis indicated that the LZ population was genetically distinct from the other S. chuatsi populations. This could be attributed to the small sample size from LZ, as obtaining samples from this area proved difficult, highlighting the scarcity of wild S. chuatsi in this region. As a result, the sample size for certain populations, such as the S. chuatsi wild group from LZ, was relatively small. Future studies should aim to include a larger and more balanced sample size, especially from regions with limited access.
In addition, the genetic distance was far lower between BJ and DJ than between WJ and S. scherzeri, which indicated that the BJ and DJ populations showed slight genetic differentiation. Another limitation of our study is that the geographic coverage is somewhat restricted, as sampling was concentrated in specific regions. Furthermore, we examined mtDNA variation, but did not examine nuclear markers. A broader sampling approach that includes populations from a wider range of environmental conditions and geographical locations would likely provide a more comprehensive understanding of the genetic diversity of these species. Temporal coverage is also a factor; future research should consider sampling over multiple seasons to account for temporal variations in genetic diversity of samples.
FST can be used to estimate gene exchange and genetic differentiation between populations [46]. FST, an important population differentiation index, revealed significant genetic differentiation between most S. chuatsi and S. scherzeri populations. According to Wright [46], genetic differentiation between populations is high when 0.15 < FST < 0.25. Similarly, significant genetic differentiation has been reported in many fish species, reinforcing the point that watershed isolation drives divergence more strongly than geographic distance alone [47,48,49,50]. Geographical isolation, dwindling wild resources, and the effects of captive breeding could result in a higher FST of FS and two wild populations, PY and LZ. The FST of FS and GZ was higher, while the FST of ZQ was lower than the other captively bred stocks. This may be related to the ZQ stock’s diverse sources and lack of population management, which could cause issues in genetic improvement. The observed genetic diversity in captive populations may be influenced by multiple factors, including artificial selection practices and potentially random genetic drift. While our current dataset cannot definitively quantify their relative contributions, we acknowledge that genetic drift may play a non-negligible role, particularly in smaller breeding populations. This important consideration warrants further investigation in future studies.
The estimated gene flow was high among most S. chuatsi populations (Nm > 1) (Table 3); three wild S. scherzeri populations also showed high gene flow (Nm > 1) (Table 4). Nm is inversely proportional to FST and proportional to genetic diversity. The GZ and ZQ cultured populations had small FST (0.111) and high Nm (4.01). These two populations are close in proximity and have access to a greater quantity of wild resources. The farms’ wild supplementary parents might be from the same resource population, which means that these distinct groups might share genetic heritage. Gene flow between the S. scherzeri neighboring wild populations BJ and DJ is not limited, according to an analysis of FST and estimated gene flow.
Based on the phylogenetic analysis and haplotype network in S. chuatsi, four haplotypes were shared between cultured and wild populations, especially in ZQ. The shared haplotypes between cultured and wild populations suggest either recent wild broodstock use or limited genetic divergence under culture. This finding is consistent with the results of AMOVA analysis and FST. Possible anthropogenic explanations for shared haplotypes include the occasional introduction of wild broodstock into farms, commercial trade facilitating genetic mixing between regions, and habitat degradation in source watersheds promoting genetic drift that reduces haplotype diversity in wild populations subsequently used for aquaculture. Phylogenetic and haplotype network analyses of S. scherzeri revealed two distinct clades among the three populations. BJ and DJ shared six common haplotypes, while WJ had none, likely because WJ occupies a different watershed.
These findings highlight the need for improved management of wild Siniperca stocks, including regulations on translocations between watersheds to preserve natural genetic structure. For aquaculture, our results suggest that maintaining genetic diversity in farmed populations requires controlled breeding strategies and periodic genetic monitoring. This study provides a foundation for developing science-based conservation and farming practices for these economically important species.

5. Conclusions

Our findings underscore the importance of preserving genetic diversity to maintain the adaptive potential of sinipercine species. Future research should focus on expanding sampling efforts, incorporating additional genetic markers, and refining conservation strategies to enhance the genetic resources available for sustainable breeding and long-term species viability.

Author Contributions

Conceptualization, X.-F.L., Y.D.; methodology, M.L., X.-F.L., K.L., M.Z.; software, M.L., X.-F.L., K.L., M.Z., J.G.; validation, M.L., X.-F.L., K.L., M.Z., J.G.; formal analysis, M.L., X.-F.L.; investigation, M.L., X.-F.L., K.L., M.Z., J.G., Y.D., Y.K., Q.Z.; resources, X.-F.L., K.L., M.Z., J.G., Y.D., Y.K., Q.Z.; data curation, M.L., X.-F.L.; writing—original draft preparation, M.L., X.-F.L., K.L., M.Z.; writing—review and editing, M.L., X.-F.L., K.L., M.Z., J.G., Y.D., Y.K., Q.Z.; visualization, M.L., X.-F.L., K.L.; supervision, X.-F.L., J.G., Y.D.; project administration, M.L., X.-F.L., K.L., J.G.; funding acquisition, M.L., X.-F.L. All authors have read and agreed to the published version of the manuscript.

Funding

This work was supported by the Fundamental Research Funds for the Central Universities (2662024SCPY009), the Rural Revitalization Strategy Special Provincial Organization and Implementation Project Funds (2023SBH00001), the National Freshwater Genetic Resource Center (FGRC18537), and the China-ASEAN Maritime Cooperation Fund (CAMC-2018F).

Institutional Review Board Statement

The animal experiments were performed under an animal ethics approval granted by the Huazhong Agricultural University. The methods used in this study were conducted in accordance with Laboratory Animal Management Principles of China, and our sampling procedures did not affect the survival of studies species (code: HZAUFI-2020-0039; date: 5 December 2020).

Informed Consent Statement

Not applicable. This study did not involve human participants.

Data Availability Statement

The novel DNA sequences presented in this study have been submitted to GenBank under accession numbers PV599870-PV599926.

Conflicts of Interest

Author Yaqi Dou was employed by the company Hubei Aquaculture Technology Extension Center (Hubei Aquatic Breeds Introduction and Breeding Cen-9 ter). The remaining authors declare that this research was conducted in the absence of any commercial or financial relationships that could be construed as a potential conflicts of interest.

References

  1. Norse, E.A.; Rosenbaum, K.L.; Wilcove, D.S.; Wilcox, B.A. Conserving biological diversity in our national forests. J. For. 1986, 84, 123–130. [Google Scholar]
  2. Allendorf, F.W.; Utter, F.M. Population genetics. Fish Physiol. 1979, 8, 407–454. [Google Scholar]
  3. Pimm, S.L.; Jenkins, C.N.; Abell, R.; Brooks, T.M.; Gittleman, J.L.; Joppa, L.N.; Raven, P.H.; Roberts, C.M.; Sexton, J.O. The biodiversity of species and their rates of extinction, distribution, and protection. Science 2014, 344, 1246752. [Google Scholar] [CrossRef] [PubMed]
  4. Chan, J.; Li, W.; Hu, X.; Liu, Y.; Xu, Q. Genetic diversity and population structure analysis of Qinghai-Tibetan plateau schizothoracine fish (Gymnocypris dobula) based on mtDNA D-loop sequences. Biochem. Syst. Ecol. 2016, 69, 152–160. [Google Scholar] [CrossRef]
  5. Zhang, J.; Jiao, T.; Zhao, S. Genetic diversity in the mitochondrial DNA D-loop region of global swine (Sus scrofa) populations. Biochem. Biophys. Res. Commun. 2016, 473, 814–820. [Google Scholar] [CrossRef]
  6. Papetti, C.; Pujolar, J.M.; Mezzavilla, M.; Mesa, M.L.; Rock, J.; Zane, L.; Patarnello, T. Population genetic structure and gene flow patterns between populations of the Antarctic icefish Chionodraco rastrospinosus. J. Biogeogr. 2012, 39, 1361–1372. [Google Scholar] [CrossRef]
  7. Cheng, J.; Kao, H.; Dong, S. Population genetic structure and gene flow of rare and endangered Tetraena mongolica Maxim. revealed by reduced representation sequencing. BMC Plant Biol. 2020, 20, 391. [Google Scholar] [CrossRef]
  8. Cann, R.L.; Brown, W.M.; Wilson, A.C. Polymorphic sites and the mechanism of evolution in human mitochondrial DNA. Genetics 1984, 106, 479–499. [Google Scholar] [CrossRef]
  9. Harrison, R.G. Animal mitochondrial DNA as a genetic marker in population and evolutionary biology. Trends Ecol. Evol. 1989, 4, 6–11. [Google Scholar] [CrossRef]
  10. Timón-Gómez, A.; Nývltová, E.; Abriata, L.A.; Vila, A.J.; Hosler, J.; Barrientos, A. Mitochondrial cytochrome c oxidase biogenesis: Recent developments. Semin. Cell Dev. Biol. 2018, 76, 163–178. [Google Scholar] [CrossRef]
  11. Vrijenhoek, R. DNA primers for amplification of mitochondrial cytochrome c oxidase subunit I from diverse metazoan invertebrates. Mol. Mar. Biol. Biotechnol. 1994, 3, 294–299. [Google Scholar]
  12. Hashem, S.; Kawai, K.; Fatsi, P.S.K.; Kodama, A.; Saito, H. Genetic relationships of cichlid fishes from Lake Malawi based on mitochondrial DNA sequences. Limnology 2020, 21, 151–163. [Google Scholar] [CrossRef]
  13. Men, Q.; Xue, G.; Mu, D.; Hu, Q.; Huang, M. Mitochondrial DNA markers reveal high genetic diversity and strong genetic differentiation in populations of Dendrolimus kikuchii Matsumura (Lepidoptera: Lasiocampidae). PLoS ONE 2017, 12, e0179706. [Google Scholar] [CrossRef] [PubMed]
  14. Qin, Y.-J.; Buahom, N.; Krosch, M.N.; Du, Y.; Wu, Y.; Malacrida, A.R.; Deng, Y.-L.; Liu, J.-Q.; Jiang, X.-L.; Li, Z.-H. Genetic diversity and population structure in Bactrocera correcta (Diptera: Tephritidae) inferred from mtDNA cox1 and microsatellite markers. Sci. Rep. 2016, 6, 38476. [Google Scholar] [CrossRef]
  15. Sharma, R.; Kishore, A.; Mukesh, M.; Ahlawat, S.; Maitra, A.; Pandey, A.K.; Tantia, M.S. Genetic diversity and relationship of Indian cattle inferred from microsatellite and mitochondrial DNA markers. BMC Genet. 2015, 16, 73. [Google Scholar] [CrossRef]
  16. Chen, D.-X.; Li, Y.; Bin, S.Y.; Wang, K.; Chu, W.-Y.; Zhang, J.-S. The phylogenetic placement of Siniperca obscura based on complete mitochondrial DNA sequence. Mitochondrial DNA Part A 2013, 24, 158–165. [Google Scholar]
  17. Li, C.; Liang, X.; Du, Y.; Zheng, H.; Yang, M.; Huang, W. Genetic population structure in Siniperca scherzeri (Perciformes: Siniperca) in China inferred from mitochondrial DNA sequences and microsatellite loci. Biochem. Syst. Ecol. 2013, 50, 168–176. [Google Scholar]
  18. Yang, M.; Guo, W.; Liang, X.; Zhu, K.; Lv, L.; Tian, C. The complete mitochondrial genome of the hybrid of Siniperca chuatsi (♀) × Siniperca kneri (♂). Mitochondrial DNA Part A 2014, 25, 189–190. [Google Scholar]
  19. Subasinghe, R.; Soto, D.; Jia, J. Global aquaculture and its role in sustainable development. Rev. Aquac. 2009, 1, 2–9. [Google Scholar] [CrossRef]
  20. Brune, D.; Schwartz, G.; Eversole, A.; Collier, J.; Schwedler, T. Intensification of pond aquaculture and high rate photosynthetic systems. Aquacult. Eng. 2003, 28, 65–86. [Google Scholar] [CrossRef]
  21. Zhang, C.; Zhao, Y. Study on the resource of mandarin fish and its rational utilization in China. Bull. Biol. 1999, 34, 9–11. [Google Scholar]
  22. Kottelat, M. Freshwater fishes of Northern Vietnam: A preliminary check-list of the fishes known or expected to occur in northern Vietnam with comments on systematics and nomenclature. In Freshwater Fishes of Northern Vietnam; WorldFish Center: Penang, Malaysia, 2001. [Google Scholar]
  23. Li, S. Geographical distribution of the Sinipercine fishes. Chin. J. Zool. 1991, 26, 40–44. [Google Scholar]
  24. Xiao, Y.; Wang, X. Artificial propagation and culture of Chinese perch. Chin. J. Zool. 1983, 18, 14–16. [Google Scholar]
  25. Allentoft, M.E.; O’Brien, J. Global amphibian declines, loss of genetic diversity and fitness: A review. Diversity 2010, 2, 47–71. [Google Scholar] [CrossRef]
  26. Groeneveld, L.F.; Lenstra, J.A.; Eding, H.; Toro, M.A.; Scherf, B.; Pilling, D.; Negrini, R.; Finlay, E.K.; Jianlin, H.; Groeneveld, E.; et al. Genetic diversity in farm animals—A review. Anim. Genet. 2010, 41, 6–31. [Google Scholar] [CrossRef]
  27. Nyunja, C.; Maina, J.; Amimo, J.; Kibegwa, F.; Harper, D.; Jun, J. Stock structure delineation of the African catfish (Clarius gariepinus) in selected populations in Kenya using mitochondrial DNA (dloop). J. Aquac. Res. Dev. 2017, 8, 485. [Google Scholar] [CrossRef]
  28. Liu, L.; Liang, X.F.; Fang, J. The optimal stocking density for hybrid of Siniperca chuatsi (♀) × Siniperca scherzeri (♂) mandarin fish fed minced prey fish. Aquac. Res. 2017, 48, 1342–1345. [Google Scholar] [CrossRef]
  29. Li, M.D. Ichthyology, 2nd ed.; Ocean Press: Beijing, China, 2011. [Google Scholar]
  30. Burland, T.G. DNASTAR’s Lasergene sequence analysis software. In Bioinformatics Methods and Protocols; Misener, S., Krawetz, S.A., Eds.; Springer: New York, NY, USA, 2000; pp. 71–91. [Google Scholar]
  31. Larkin, M.A.; Blackshields, G.; Brown, N.P.; Chenna, R.; McGettigan, P.A.; McWilliam, H.; Valentin, F.; Wallace, I.M.; Wilm, A.; Lopez, R.; et al. Clustal W and Clustal X version 2.0. Bioinformatics 2007, 23, 2947–2948. [Google Scholar] [CrossRef]
  32. Kumar, S.; Stecher, G.; Li, M.; Knyaz, C.; Tamura, K. MEGA X: Molecular evolutionary genetics analysis across computing platforms. Mol. Biol. Evol. 2018, 35, 1547–1549. [Google Scholar] [CrossRef]
  33. Librado, P.; Rozas, J. DnaSP v5: A software for comprehensive analysis of DNA polymorphism data. Bioinformatics 2009, 25, 1451–1452. [Google Scholar] [CrossRef]
  34. Excoffier, L.; Lischer, H.E. Arlequin suite ver 3.5: A new series of programs to perform population genetics analyses under Linux and Windows. Mol. Ecol. Resour. 2010, 10, 564–567. [Google Scholar] [CrossRef] [PubMed]
  35. Kalyaanamoorthy, S.; Minh, B.Q.; Wong, T.K.; von Haeseler, A.; Jermiin, L.S. ModelFinder: Fast model selection for accurate phylogenetic estimates. Nat. Methods 2017, 14, 587–589. [Google Scholar] [CrossRef] [PubMed]
  36. Zhang, D.; Gao, F.; Jakovlić, I.; Zou, H.; Zhang, J.; Li, W.X.; Wang, G.T. PhyloSuite: An integrated and scalable desktop platform for streamlined molecular sequence data management and evolutionary phylogenetics studies. Mol. Ecol. Resour. 2020, 20, 348–355. [Google Scholar] [CrossRef] [PubMed]
  37. Ronquist, F.; Teslenko, M.; Mark, P.; Ayres, D.L.; Darling, A.; Höhna, S.; Larget, B.; Liu, L.; Suchard, M.A.; Huelsenbeck, J.P. MrBayes 3.2: Efficient Bayesian phylogenetic inference and model choice across a large model space. Syst. Biol. 2012, 61, 539–542. [Google Scholar] [CrossRef]
  38. Bandelt, H.-J.; Forster, P.; Röhl, A. Median-joining networks for inferring intraspecific phylogenies. Mol. Biol. Evol. 1999, 16, 37–48. [Google Scholar] [CrossRef]
  39. Leigh, J.W.; Bryant, D. POPART: Full-feature software for haplotype network construction. Methods Ecol. Evol. 2015, 6, 1110–1116. [Google Scholar] [CrossRef]
  40. Johnston, K.; Ver Hoef, J.M.; Krivoruchko, K.; Lucas, N. Using ArcGIS Geostatistical Analyst; Esri Press: Redlands, CA, USA, 2001; Volume 380. [Google Scholar]
  41. Guo, W.; Yang, M.; Liang, X.; Lv, L.; Xiao, T.; Tian, C. The complete mitochondrial genome of the hybrid of Siniperca chuatsi (♀) × Siniperca scherzeri (♂). Mitochondrial DNA Part A 2016, 27, 1094–1095. [Google Scholar] [CrossRef]
  42. Mei, Q.L.; Liu, Z.; Zhang, X.; Xie, D.Z.; Zhang, J.; Zeng, G.; Lu, S. Analysis of genetic diversity between protospecies and cultured populations of Siniperca chuatsi based on microsatellite markers. Genom. Appl. Biol. 2010, 29, 266–272. [Google Scholar]
  43. Spielman, D.; Brook, B.W.; Frankham, R. Most species are not driven to extinction before genetic factors impact them. Proc. Natl. Acad. Sci. USA 2004, 101, 15261–15264. [Google Scholar] [CrossRef]
  44. Zhang, Q.; Sun, C.; Zhu, Y.; Xu, N.; Liu, H. Genetic diversity and structure of the round-tailed paradise fish (Macropodus ocellatus): Implications for population management. Glob. Ecol. Conserv. 2020, 21, e00876. [Google Scholar] [CrossRef]
  45. Tian, C.; Yang, M.; Liang, X.-F.; Cao, L.; Zheng, H.; Zhao, C.; Zhu, C.; Zhu, K.; Yuan, Y. Population genetic structure of Siniperca chuatsi in the middle reach of the Yangtze River inferred from mitochondrial DNA and microsatellite loci. Mitochondrial DNA 2015, 26, 61–67. [Google Scholar] [CrossRef] [PubMed]
  46. Wright, S. Evolution and the Genetics of Populations, Volume 4: Variability Within and Among Natural Populations; University of Chicago Press: Chicago, IL, USA, 1984; Volume 4. [Google Scholar]
  47. Wang, S.-Y.; Luo, J.; Murphy, R.W.; Wu, S.-F.; Zhu, C.-L.; Gao, Y.; Zhang, Y.-P. Origin of Chinese goldfish and sequential loss of genetic diversity accompanies new breeds. PLoS ONE 2013, 8, e59571. [Google Scholar] [CrossRef] [PubMed]
  48. Cao, L.; Liang, X.-F.; Tang, W.; Zhao, J. Phylogeography of Coreoperca whiteheadi (Perciformes: Coreoperca) in China based on mitochondrial and nuclear gene sequences. Biochem. Syst. Ecol. 2013, 50, 223–231. [Google Scholar] [CrossRef]
  49. Yang, J.Q.; Hsu, K.C.; Liu, Z.Z.; Su, L.W.; Kuo, P.H.; Tang, W.Q.; Zhou, Z.C.; Liu, D.; Bao, B.L.; Lin, H.D. The population history of Garra orientalis (Teleostei: Cyprinidae) using mitochondrial DNA and microsatellite data with approximate Bayesian computation. BMC Evol. Biol. 2016, 16, 73. [Google Scholar] [CrossRef]
  50. Berrebi, P.; Barucchi, V.C.; Splendiani, A.; Muracciole, S.; Sabatini, A.; Palmas, F.; Tougard, C.; Arculeo, M.; Marić, S. Brown trout (Salmo trutta L.) high genetic diversity around the Tyrrhenian Sea as revealed by nuclear and mitochondrial markers. Hydrobiologia 2019, 826, 209–231. [Google Scholar] [CrossRef]
Figure 1. Geographical locations of 9 sampling sites for S. chuatsi, S. scherzeri, and C. whiteheadi. Note: GZ (Guangzhou), FS (Foshan), ZQ (Zhaoqing), LZ (Liangxilin), PY (Poyanghu), BJ (Beijing), WJ (Wujiang), DJ (Dongliang), and XJ (Xijiang).
Fishes 10 00264 g001
Figure 2. Combined phylogenetic trees reconstructed based on the concatenated mtDNA sequences. NJ and ML bootstrap values, and Bayesian posterior probabilities are indicated near models. Note: Phylogenetic tree reconstructed using neighbor-joining (NJ), maximum likelihood (ML), and Bayesian inference (BI) methods. Numbers at nodes represent bootstrap values (NJ/ML) and posterior probabilities (BI) (only values >50% or >0.9 shown). Three C. whiteheadi haplotypes were used as outgroup.
Fishes 10 00264 g002
Figure 3. Median-joining network of 23 concatenated haplotypes from 5 S. chuatsi populations in China. The sizes of circles and nodes were proportional to haplotype frequency. Black circles represent intermediate haplotypes not observed.
Fishes 10 00264 g003
Figure 4. Median-joining network of 31 concatenated haplotypes from 3 S. scherzeri populations in China. The sizes of circles and nodes were proportional to haplotype frequency. Black circles represent intermediate haplotypes not observed.
Fishes 10 00264 g004
Table 1. Locations and genetic diversity of S. chuatsi, S. scherzeri, and C. whiteheadi samples in China: N = number of samples sequenced; S = number of polymorphic sites; H = number of haplotypes; Hd = haplotype diversity; π = nucleotide diversity; K = average number of nucleotide differences.
PopulationSample
Locations
Species-CategoryND-Loop Sequencecox1 SequenceD-Loop+cox1 Sequence
SHHdπKSHHdπKSHHdπK
Guangzhou (GZ)GuangzhouS. chuatsi-cultured305260.7750.0378018.6373540.5590.0252111.8238760.7750.0316630.460
Foshan (FS)FoshanS. chuatsi-cultured301260.4550.003611.782240.3030.000780.3681480.5100.002232.149
Zhaoqing (ZQ)ZhaoqingS. chuatsi-cultured30970.6940.006583.253120.5150.001100.5151080.7200.003913.768
Liangzihu (LZ)WuhanS. chuatsi-wild3-1---120.6670.001420.667120.6670.000690.667
Poyanghu (PY)JiujiangS. chuatsi-wild141250.7250.010325.099120.3630.000770.3631350.7250.005675.462
Total 10760190.8050.0220110.8493770.6060.012665.94097230.8230.0174516.789
Beijiang (BJ)ShaoguanS. scherzeri-wild131160.8210.004292.538540.4230.001560.7691670.8460.003053.308
Wujiang (WJ)An’shunS. scherzeri-wild3781190.9400.0304117.88115140.9040.005642.78195200.9410.0188420.344
Dongjiang (DJ)HeyuanS. scherzeri-wild434480.6780.006323.735340.3290.000790.39047100.6970.003814.125
Total 9379270.9080.0358117.65632190.7500.01839.036111310.9170.0280926.693
Xijiang (XJ)NanningC. whiteheadi-wild7630.6670.003831.905220.2860.001160.571839.6670.002502.476
Table 2. Kimura 2-parameter genetic distance based on D-loop (above diagonal) and cox1 (below diagonal).
BJWJDJGZLZFSPYZQXJ
BJ 0.065 0.005 0.089 0.060 0.094 0.096 0.096 0.180
WJ0.035 0.063 0.080 0.021 0.095 0.094 0.095 0.182
DJ0.001 0.035 0.090 0.057 0.097 0.097 0.099 0.181
GZ0.086 0.065 0.085 0.085 0.028 0.0300.028 0.181
LZ0.033 0.004 0.033 0.065 0.106 0.105 0.107 0.183
FS0.099 0.081 0.098 0.020 0.080 0.011 0.006 0.179
PY0.096 0.078 0.095 0.018 0.077 0.004 0.011 0.181
ZQ0.096 0.078 0.095 0.018 0.077 0.004 0.001 0.181
XJ0.189 0.202 0.189 0.183 0.202 0.178 0.175 0.175
Table 3. Pairwise FST (below diagonal) and significance of corresponding p-values (above diagonal) of S. chuatsi based on the concatenated mtDNA sequences.
FSZQLZPYGZ
FS ++++
ZQ0.125 +++
LZ0.456 0.294 +
PY0.388 0.202 0.292 +
GZ0.331 0.111 0.1440.177
Note: + p ≤ 0.05; − p > 0.05.
Table 4. Pairwise FST (below diagonal) and significance of corresponding p-values (above diagonal) of S. scherzeri based on the concatenated mtDNA sequences.
WJBJDJ
WJ ++
BJ0.102 +
DJ0.183 0.200
Note: + p ≤ 0.05.
Table 5. Estimated Nm of S. chuatsi based on the concatenated mtDNA sequences.
FSZQLZPYGZ
FS
ZQ3.500
LZ1.011 1.201
PY0.789 1.975 1.212
GZ1.0114.0052.972 2.325
Note: Nm = 0.5 × (1 − FST)/FST.
Table 6. Nm of S. scherzeri based on the concatenated mtDNA sequences.
WJBJ
WJ
BJ4.402
DJ2.232 2.000
Note: Nm = 0.5 × (1 − FST)/FST.
Table 7. AMOVA results for hypothetical groups of S. chuatsi populations based on the concatenated mtDNA sequences.
Source of Variation d.f.Sum of SquaresVariance ComponentsPercentage of VariationFixation Indices
Among groups12.4330.02726 Va6.0FCT = 0.06015
Among populations within groups36.7450.08826 Vb19.5FST = 0.25489 **
Within populations10234.4480.33772 Vc74.5FSC = 0.20720 **
Total10643.6260.45325
Note: **, p < 0.001.
Table 8. AMOVA results for hypothetical groups of S. scherzeri populations based on the concatenated mtDNA sequences.
Source of Variation d.f.Sum of SquaresVariance ComponentsPercentage of Variation
Among population25.5540.08376 Va17.06
Within populations9036.6510.40723 Vb82.94
Total9242.2040.49099
Note: FST = 0.17059, p < 0.001.
Disclaimer/Publisher’s Note: The statements, opinions and data contained in all publications are solely those of the individual author(s) and contributor(s) and not of MDPI and/or the editor(s). MDPI and/or the editor(s) disclaim responsibility for any injury to people or property resulting from any ideas, methods, instructions or products referred to in the content.

