Article

Ageing Mediterranean Bluefin Tuna: A Comparative Study Between Dorsal Fin Spines and Vertebrae

by
Niki Milatou
* and
Persefoni Megalofonou
Department of Biology, National and Kapodistrian University of Athens, Panepistimiopolis, Ilissia, 15784 Athens, Greece
*
Author to whom correspondence should be addressed.
Fishes 2025, 10(6), 260; https://doi.org/10.3390/fishes10060260
Submission received: 26 April 2025 / Revised: 18 May 2025 / Accepted: 29 May 2025 / Published: 2 June 2025

Abstract

This study estimated the age and growth of reared Atlantic bluefin tuna by analyzing two calcified structures: the caudal vertebrae and the dorsal fin spines. The aim was to compare the two ageing methods. A total of 613 dorsal fin spines and 613 vertebrae were aged, with each pair of calcified structures derived from the same individual fish. The age of each fish was determined from the number of visible growth bands on the structures. The estimated ages ranged from 4 to 20 years for dorsal fin spines and from 5 to 17 years for caudal vertebrae. Both calcified structures were demonstrated to be suitable for ageing bluefin tuna. The percent agreement between the two methods was high in medium-sized fish but lower in larger fish. Additionally, the results showed a tendency to estimate fewer years in vertebrae than in dorsal fin spines for fish older than 11 years. For the samples where no bias was found between the two ageing methods (N = 215), the von Bertalanffy growth model was fitted to the mean lengths at estimated ages, with the growth parameters determined as follows: L = 372.3 cm, k = 0.075 yr−1, and t0 = −1.292 yr. This research makes a novel contribution to the field by conducting a direct, large-scale comparison of age estimates derived from two different calcified structures, addressing a notable gap in the literature and offering critical insights into the consistency and reliability of ageing methods used in stock assessment.
Key Contribution: This study provides a direct comparison of age estimates derived from dorsal fin spines and caudal vertebrae in Atlantic bluefin tuna, highlighting their respective advantages across different size classes. Caudal vertebrae yield more reliable age estimates in younger and medium-sized individuals, whereas dorsal fin spines are more suitable for ageing older and larger fish. These findings enhance the precision of age estimation, thereby supporting more robust stock assessments and sustainable fishery management.

1. Introduction

Age information is critical in fishery management as it forms the basis for growth models used in stock assessment [1,2,3,4,5]. Although Atlantic bluefin tuna (Thunnus thynnus) has been studied for many years, particularly regarding age and growth, there is limited work that directly compares age estimations from different calcified structures [6,7,8]. Several studies have used otoliths, vertebrae, and dorsal fin spines for age determination, but only one study compares the first two structures [9]. Additionally, Rodríguez-Marín et al. [8] compared age estimates from otoliths and dorsal fin spines from Atlantic bluefin tuna. Previous comparisons between vertebrae and dorsal fin spines from this species have shown a tendency to estimate one year less in vertebrae than in dorsal fin spines for fish older than 10 years [10]. Furthermore, a report on the direct ageing of Atlantic bluefin tuna [11] indicated that age interpretation becomes increasingly difficult from age 10 onwards when using the whole vertebra method. This issue also occurs when using dorsal fin spine sections, though the method remains useful for older fish [11]. Otolith sections can be used across the entire age range, but age interpretation is challenging during the first five years of a bluefin tuna’s life [11]. Despite these challenges, none of these calcified structures can be excluded from routine ageing as limitations in sampling due to specific fisheries, fish processing, or market constraints may prevent the use of certain structures [11]. Consequently, there remains a need for additional comparative studies on the calcified structures of Atlantic bluefin tuna [8,11]. Comparing ages obtained from different calcified structures of the same fish does not validate age estimation but provides a measure of agreement, helping to assess the level of confidence in the interpretation [3].
One of the primary challenges in age and growth estimation is selecting the most suitable structure for ageing the fish. For young Atlantic bluefin tuna, up to two or three years old, the dorsal fin spine method provides accurate results as the translucent and opaque bands are easy to read. However, for older fish, the central area of the dorsal spine begins to be reabsorbed, leading to the loss of bands [12,13,14]. For these fish, a reference table with translucent band diameters is needed to estimate the age of the first visible band [10,14,15].
Vertebrae have been widely used in previous studies to estimate the age of wild Atlantic bluefin tuna as annual growth bands are typically well-defined on the inner surface of the vertebral conus [9,10]. However, this method is generally considered accurate for fish up to 10 years old [10]. One of the key limitations of this method is the difficulty in distinguishing the crowded growth bands at the outer margin of the vertebrae in larger specimens; the ridges become less pronounced, and the grooves are very narrow [16]. Compared to other calcified structures (e.g., dorsal fin spines, otoliths), vertebrae offer more accurate and reliable age estimates in younger individuals. In small and medium-sized fish, the growth bands in the vertebrae tend to be more distinct and less affected by resorption (as in dorsal fin spines) or early-life interpretation difficulties (as in otoliths), making them particularly suitable for estimating age during the early life stages [14,16].
The main objectives of this study were to estimate the age and growth of reared Atlantic bluefin tuna using two calcified structures—caudal vertebrae and dorsal fin spines—and to compare the two ageing methods. This study makes a novel contribution to the field by conducting a direct, large-scale comparison of age estimates derived from these two calcified structures. By addressing a significant gap in the existing literature, this approach provides valuable insights into the consistency and reliability of ageing methods used in stock assessment. Furthermore, the study focuses specifically on reared Atlantic bluefin tuna, a population that has received less attention than wild stocks in age validation studies. Through examining growth and age estimation in reared individuals, the study offers new perspectives on the applicability and consistency of ageing techniques in aquaculture settings, where access to certain structures may be limited due to processing constraints. Additionally, this research highlights the limitations and practical challenges associated with each structure, offering guidance on selecting appropriate methods under varying sampling conditions. These findings have important implications for standardizing ageing protocols and enhancing the accuracy of age-based assessments for both wild and reared Atlantic bluefin tuna populations.

2. Materials and Methods
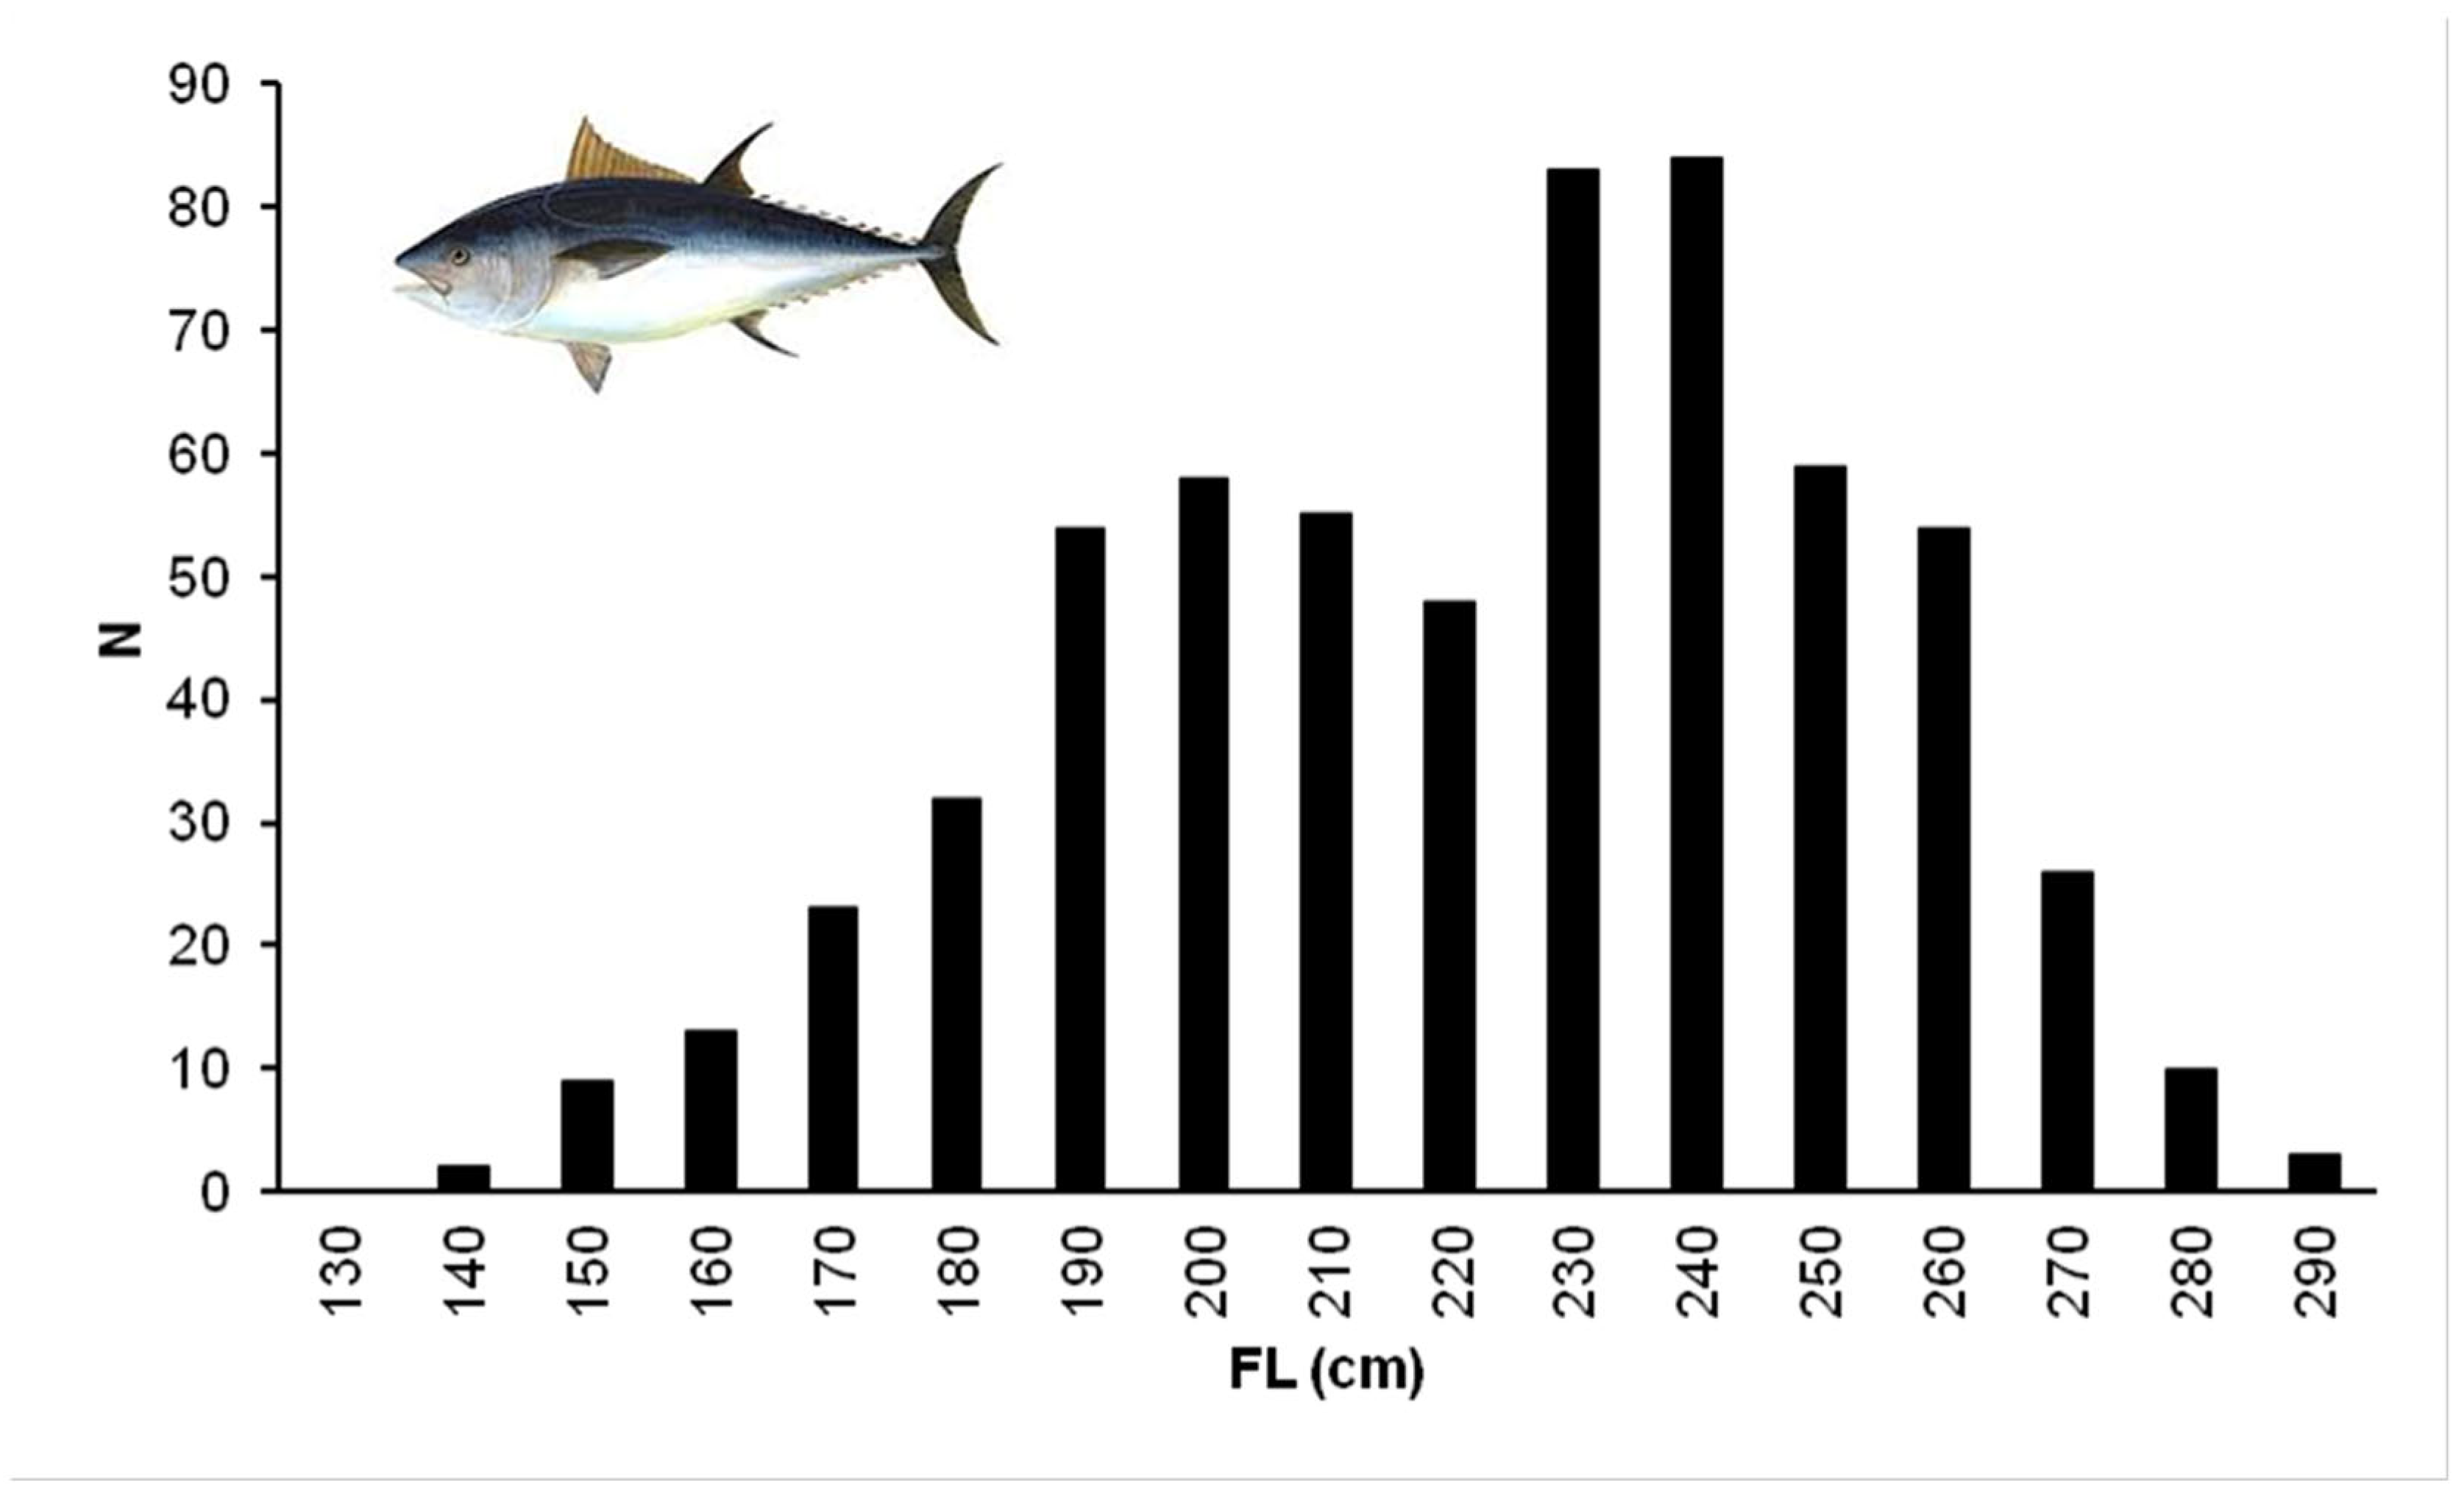
2.1. Sampling

During the period from 2007 to 2011, samples of Atlantic bluefin tuna (Thunnus thynnus) were collected from a Greek tuna farm in the Ionian Sea. Farming conditions were described thoroughly in previous studies [16,17]. For each specimen, straight fork length (FL, cm) and round weight (RW, kg) were measured after bleeding. Length measurements were taken to the nearest centimeter (cm), and weight was measured to the nearest kilogram (kg). In addition, the first dorsal fin spine and the 35th and 36th caudal vertebrae were collected from each fish. Dorsal fin spines and vertebrae were preserved dry in plastic bags and refrigerated until they were analyzed.

2.2. Measurements of the Calcified Structures

Measurements were taken using a caliper after the calcified structures had been air-dried for 24 h. The largest radius of the vertebral cone was calculated by measuring its largest diameter (and dividing by two) to the nearest mm (Figure 1A). Since both vertebrae were available in most of the specimens, the anterior surface of the 35th was used preferentially for measurement and interpretation [16]. For each dorsal fin spine, the maximum radius was calculated by measuring its maximum diameter (and dividing by two) to the nearest mm (Figure 1B). The relationship between the straight fork length (FL, cm) of the fish and the radius (R, mm) of each calcified structure was tested using linear regression analysis.

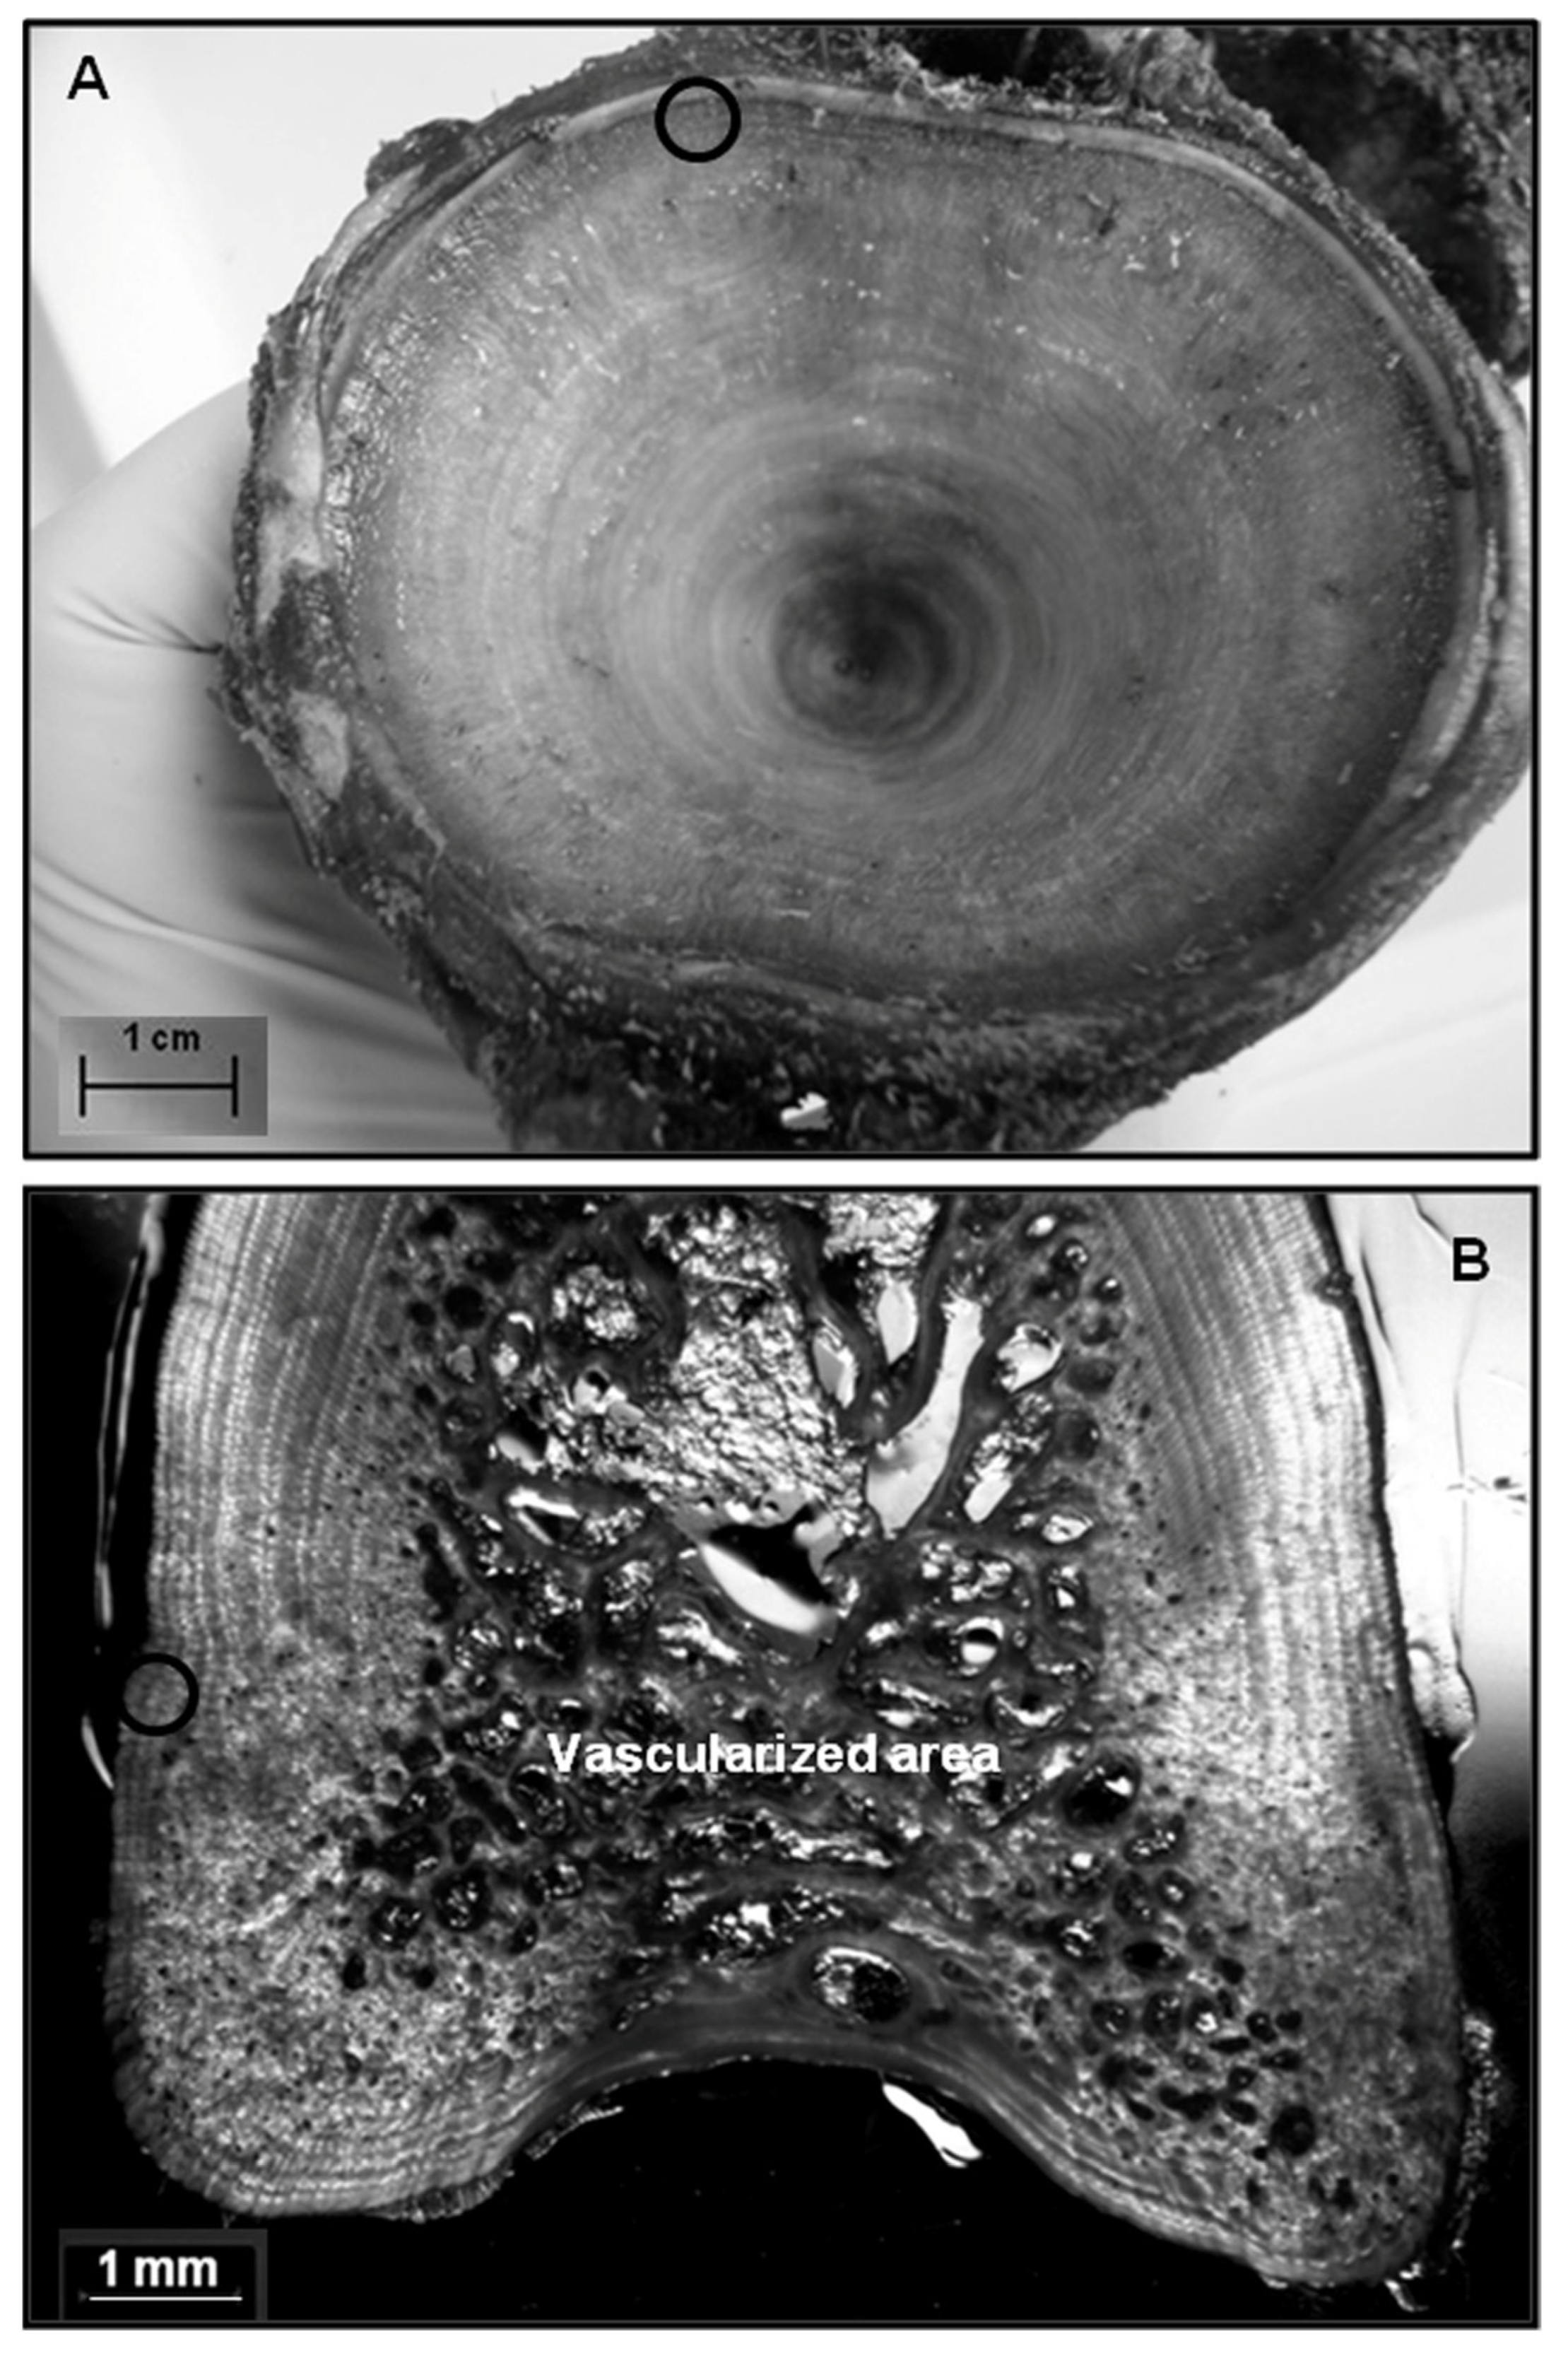
2.3. Ageing Procedure Using Dorsal Fin Spines

Three serial cross-sections, 0.7 mm thick, were obtained from each dorsal fin spine near the condyle base [18] using a low-speed saw (IsoMet, Buehler Ltd., Lake Bluff, IL, USA) with diamond wafering blades. The sections were mounted in synthetic resin (Eukitt Mounting Medium, ORSAtec GmbH, Rastatt, Germany) on glass slides and viewed under transmitted light using a Nikon SMZ-2T (Nikon Instruments Inc., Melville, NY, USA) binocular stereo microscope connected to a digital camera (INFINITYlite, Lumenera, Teledyne Lumenera, Ottawa, ON, Canada). An image analyzer (Image Analysis Pro Plus 6.0, Media Cybernetics, Rockville, MD, USA) was used for the ageing procedure. The interpretation of the growth bands was based on the identification of narrow translucent and wider opaque bands, which are assumed to indicate periods of varying growth rates. These growth patterns may be related to seasonal changes or environmental factors, such as food availability (Figure 1B). A single translucent band (or tight cluster of bands) (Figure 2B) and the associated opaque band together were assumed to represent one year of growth [15,19]. Bands were counted if they were continuous around the perimeter of the section [19]. Age was adjusted according to the capture date and the assumed birthdate of June 1st, which aligns with the typical spawning period of Atlantic bluefin tuna [11]. The edge type of the spine sections was also evaluated and considered to be either translucent or opaque when the outermost band was more than half the perimeter of the dorsal fin spine section [12].
In the present study, to address the problem of vascularization and to estimate the accurate position and number of initial translucent bands that were not visible, the values of Ri, derived from a related study estimating the age of Atlantic bluefin tuna in the central Mediterranean Sea [18], were used. For all dorsal fin spine sections, the radius of each translucent band was calculated using the following formula: Ri = DiD/2, where Ri is the radius of the translucent band i in mm, D is the diameter of the dorsal fin spine, and Di is the distance from the outside edge of the translucent band i to the opposite edge of the cross-section [15]. Once the age of the first inner visible translucent band was estimated, the final age was calculated by adding the number of translucent bands estimated to be within the vascularized area and the number counted between the vascularized area and the edge of the spine [14]. The ageing procedure was thoroughly described in a previous study that used the first dorsal fin spine to estimate the age of reared Atlantic bluefin tuna in the Mediterranean Sea [14].
Three readings of each dorsal fin spine (N = 613) were conducted independently at monthly intervals. Dorsal fin spines were excluded from the analysis if the three readings provided different annuli counts. When two of the readings agreed, and the third differed by one ring only, the age was derived from the two similar readings. Dorsal fin spines were never read simultaneously, and the reader never had prior access to information on size or date of capture during the age estimation process.

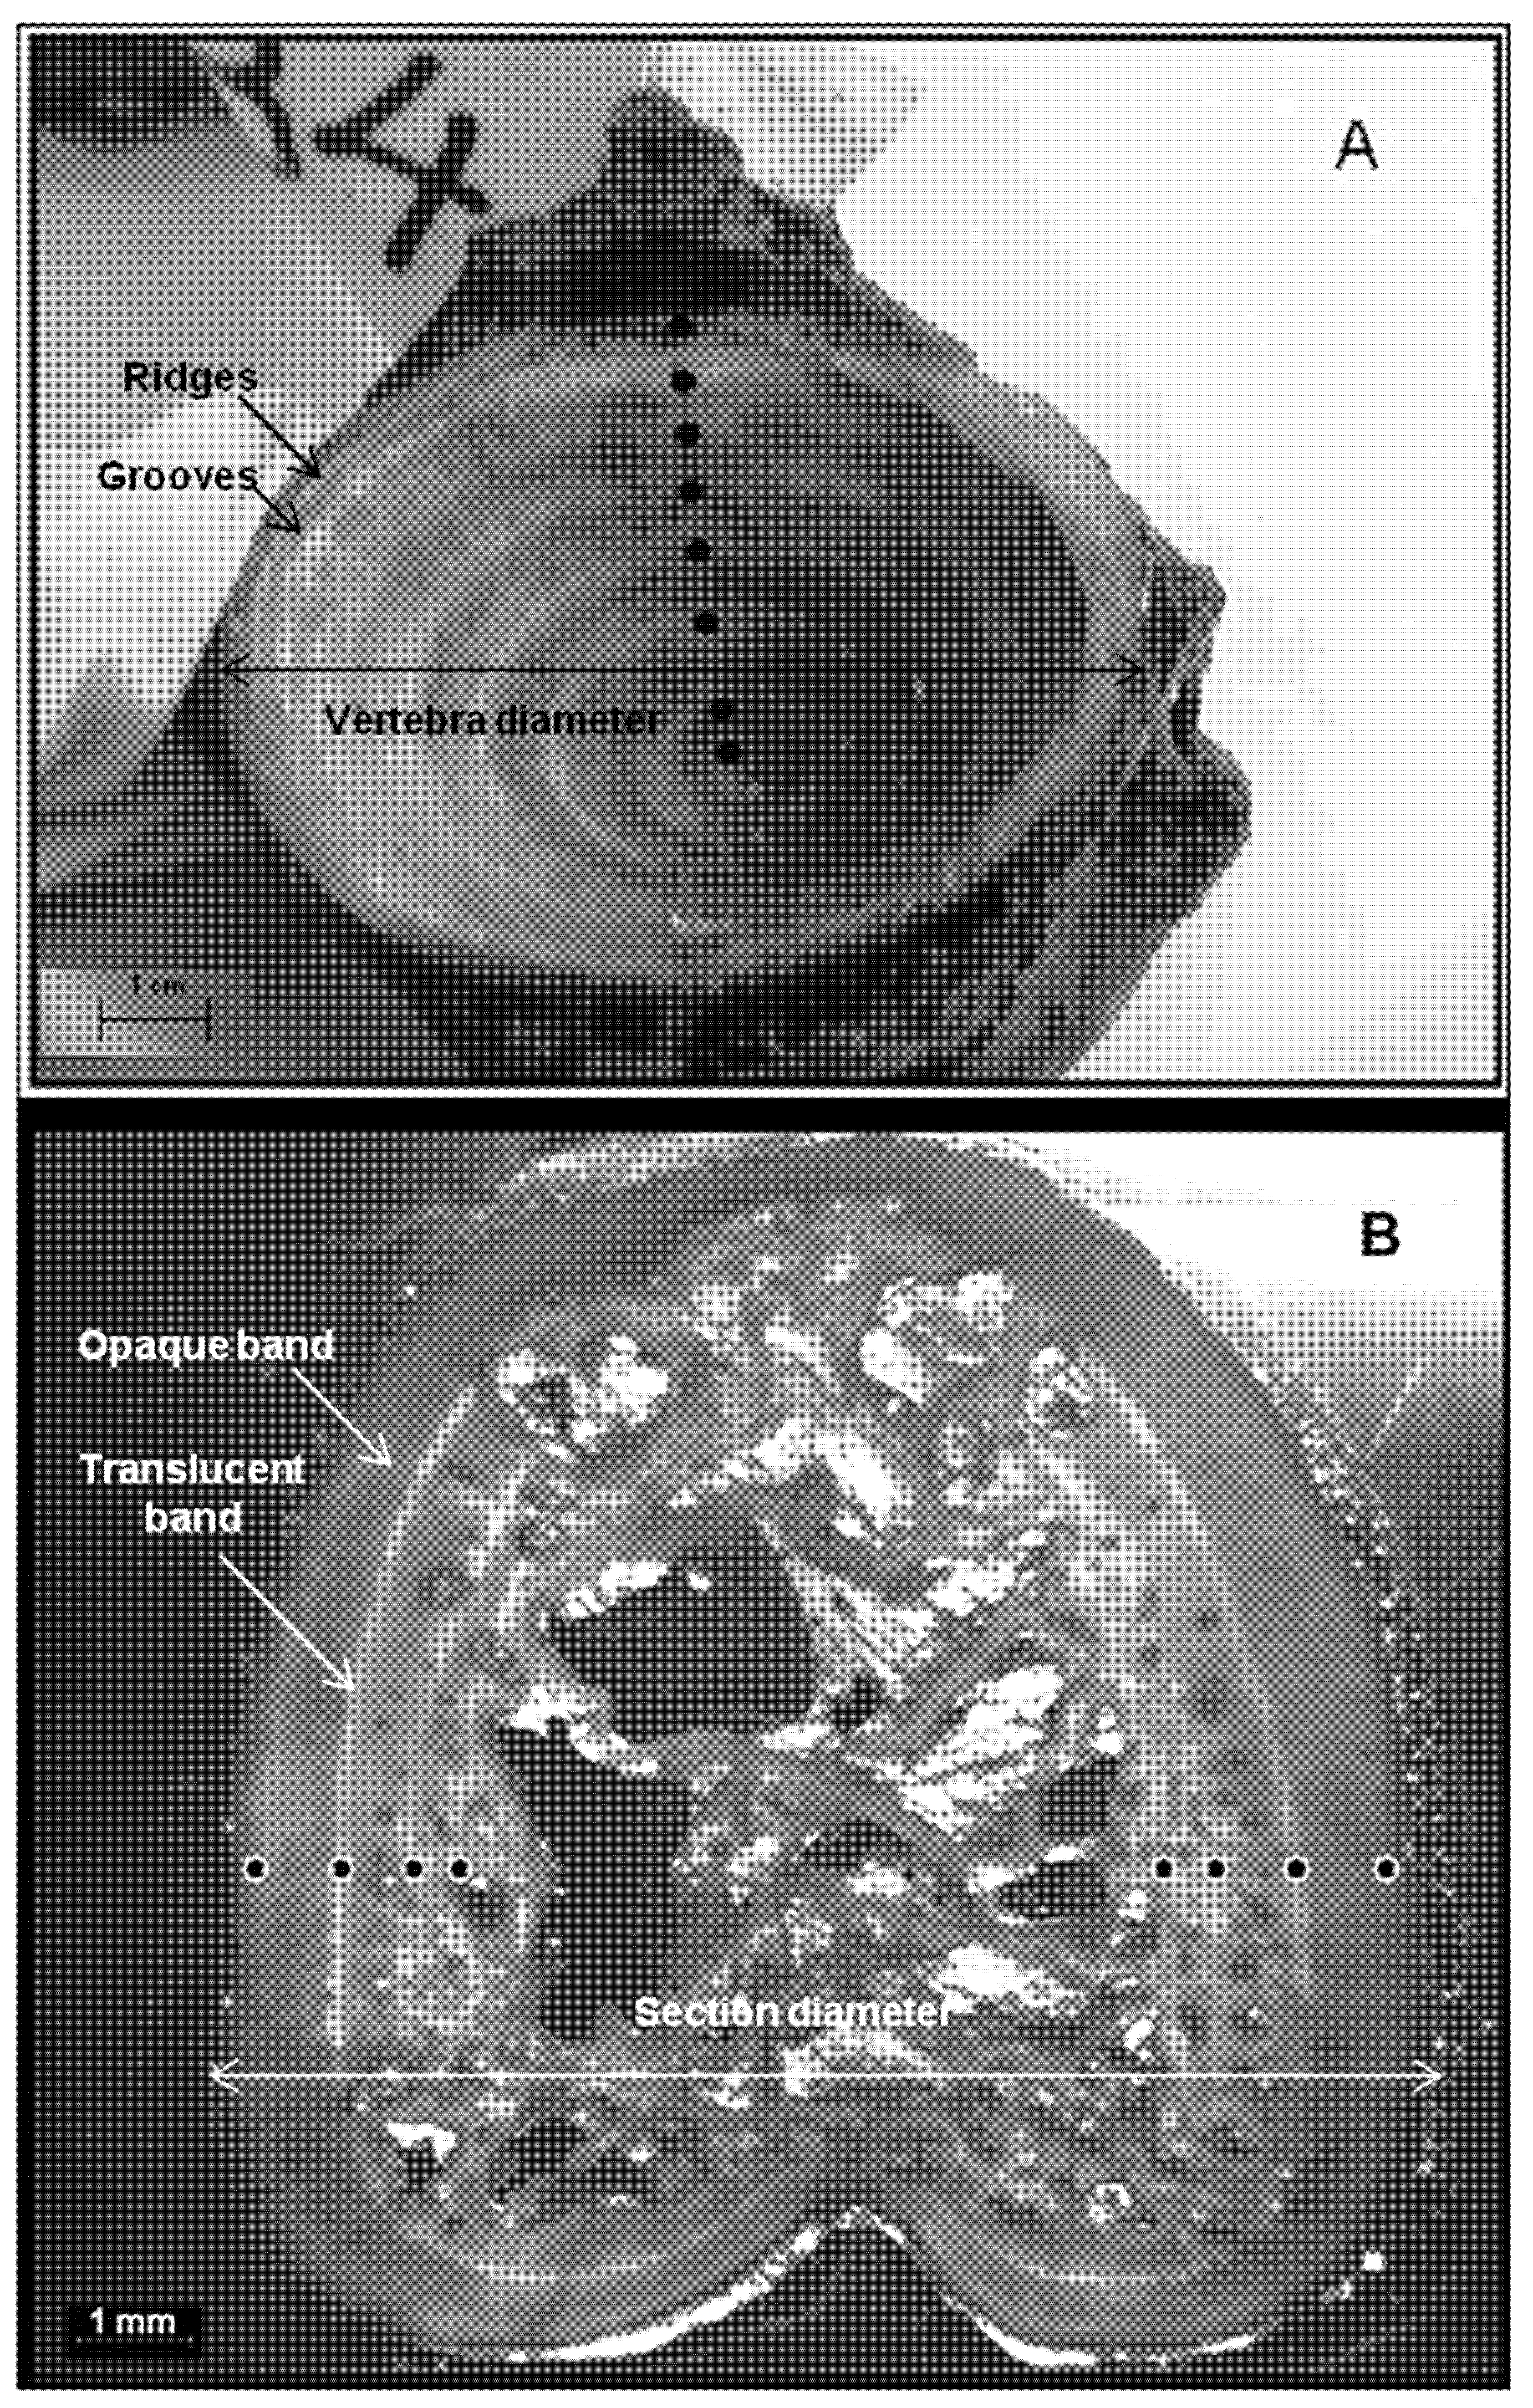
2.4. Ageing Procedure Using Vertebrae

The 35th and 36th caudal vertebrae were used to estimate the age of the fish. To obtain these vertebrae, a transverse cut was made at the caudal area between the 4th and the 5th finlets. The 35th vertebra was the first vertebra in the sectioned part and was separated along with the 36th vertebra from the rest of the caudal vertebrae. After they were cleaned and stripped of any tissue, they were left to dry for at least two months.
As both vertebrae were available in most samples, the anterior surface of the 35th vertebra was primarily used for interpretation. However, both the anterior and posterior surfaces were used when interpreting the annual growth bands was challenging. Age was estimated by counting the annual growth bands observed on the inner surface of the cone-shaped structures of whole vertebrae (Figure 1A). One annulus was interpreted as one ridge and one groove [20]. In some samples, multiple narrow within-year ridges, grooves, or lines may form (Figure 2A). These samples may be difficult to read, and the annuli must be interpreted by studying all the features and structures together [20]. The ageing procedure was thoroughly described in a previous study that used the 35th and 36th caudal vertebrae to estimate the age of reared Atlantic bluefin tuna in the Mediterranean Sea [16].
Three readings of each vertebra (N = 613) were conducted independently at weekly intervals. Vertebrae were excluded from the analysis if the three readings provided different annuli counts. When two of the readings agreed, and the third differed by one annulus only, the age was derived from the two similar readings. Vertebrae were never read simultaneously, and the reader never had prior access to information on the size of the fish or the date of capture during age estimation.

2.5. Precision of Age Estimations

The Average Percent Error (APE) and the Coefficient of Variation (CV) were calculated to assess the reproducibility of age estimations across the readings [21,22].

2.6. Estimation of Growth Parameters

For the samples with no age bias between the two ageing methods, the von Bertalanffy growth model was applied to fit the mean lengths at estimated ages, and the growth parameters were determined using the following function, which represents the von Bertalanffy growth model: Lt = L[1−ek(tt0)], where Lt is the fish fork length at age t in cm, L is the asymptotic length in cm, k is the growth coefficient in yr−1, and t0 is the theoretical age in years when the fish has zero length. Due to the lack of young fish in our sample, the mean back-calculated lengths for ages 1 to 3 were taken from a previous study [14].
The phi-prime index (Φ′) was used to compare the bluefin tuna growth parameters with those estimated in previous studies and was calculated using the following formula: Φ′ = lnk + 2lnL [23].

2.7. Statistical Analysis

Descriptive statistics were obtained for all parameters, both measured and calculated. Age estimations were also tested for normality (using the Shapiro–Wilk test) and homogeneity of variance (using Levene’s test). Student’s t-test was used to compare the mean age estimates between the two calcified structures when the variables followed a normal distribution. The non-parametric Mann–Whitney test was used when the variables were not normally distributed to assess statistical differences between the two ageing methods. Additionally, paired t-tests and Wilcoxon signed-rank tests were used to detect statistical differences in age estimations per size class between the dorsal fin spines and the vertebrae. The significance level was set at p ≤ 0.05 (two-tailed) for all tests. All statistical analyses and graphs were performed using Statgraphics Centurion XVII and Microsoft Excel (version X, Microsoft Corporation).

3. Results

3.1. Size Measurements and Relationships

The fork lengths of the 613 bluefin tuna reared in sea cages ranged from 135 to 284 cm, with a mean value of 218 ± 31 cm, while their round weights ranged from 43 to 475 kg, with a mean value of 220 ± 94 kg. The length frequency distribution is presented in Figure 3.
A significant positive linear relationship (R = 0.903) was found between the dorsal fin spine radius and fork length. The obtained equation was FL = 9.837 + 29.368R (R2 = 0.815; Ν = 613; p < 0.05). Additionally, a significant positive linear relationship (R = 0.953) was found between the vertebral cone radius and fork length. The obtained equation was FL = 60.655 + 5.426R (R2 = 0.907; Ν = 613; p < 0.05).

3.2. Age Estimations and Precision

Age estimations from dorsal fin spines and vertebrae were obtained from a total of 613 specimens. Both calcified structures were considered readable. Estimated ages for dorsal fin spines ranged from 4 to 20 years (Figure 4). Age group 8 was the most abundant (12.6%), while age group 19 (0.2%) had the fewest samples. Estimated ages for vertebrae ranged from 5 to 17 years (Figure 4). Age group 12 was the most abundant (14.2%), while age group 5 (0.5%) had the fewest samples. For both calcified structures, the mean lengths at all age classes are given in Table 1. For the dorsal fin spines, the mean values of the APE and CV were 2.9% and 3.7%, respectively, while for the vertebrae, the mean values of the APE and CV were 1.9% and 2.5%, respectively.

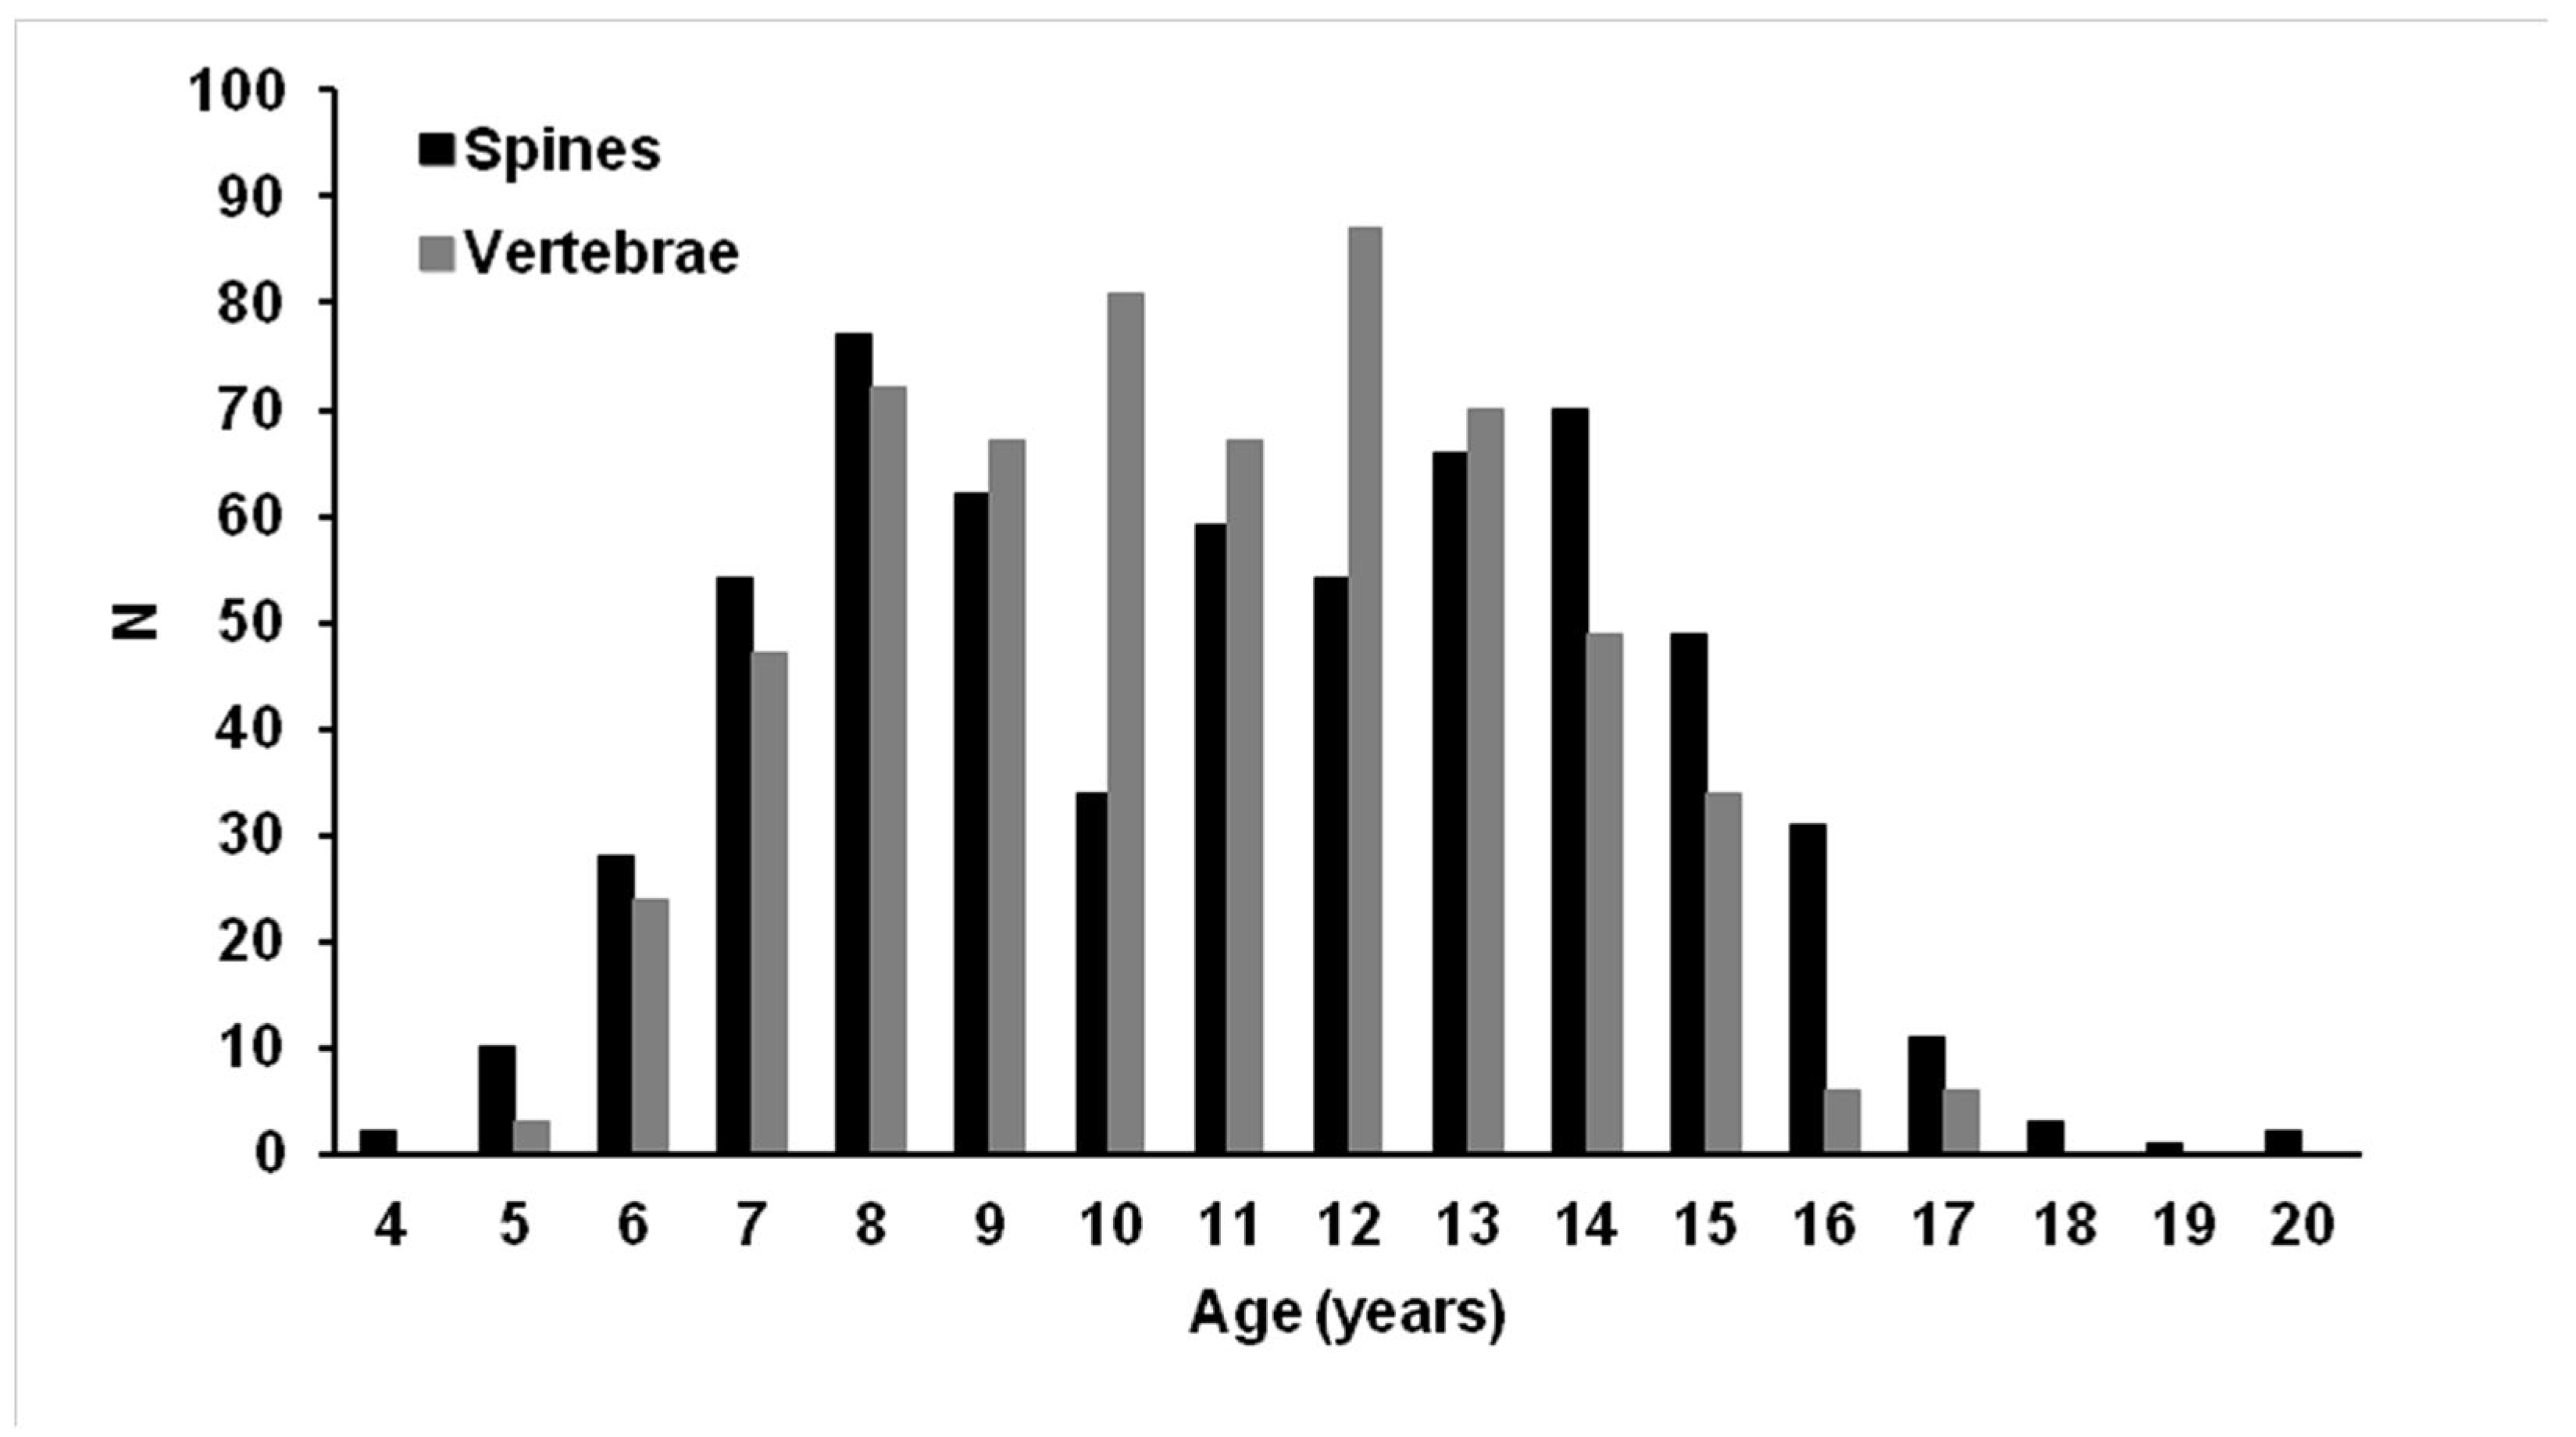
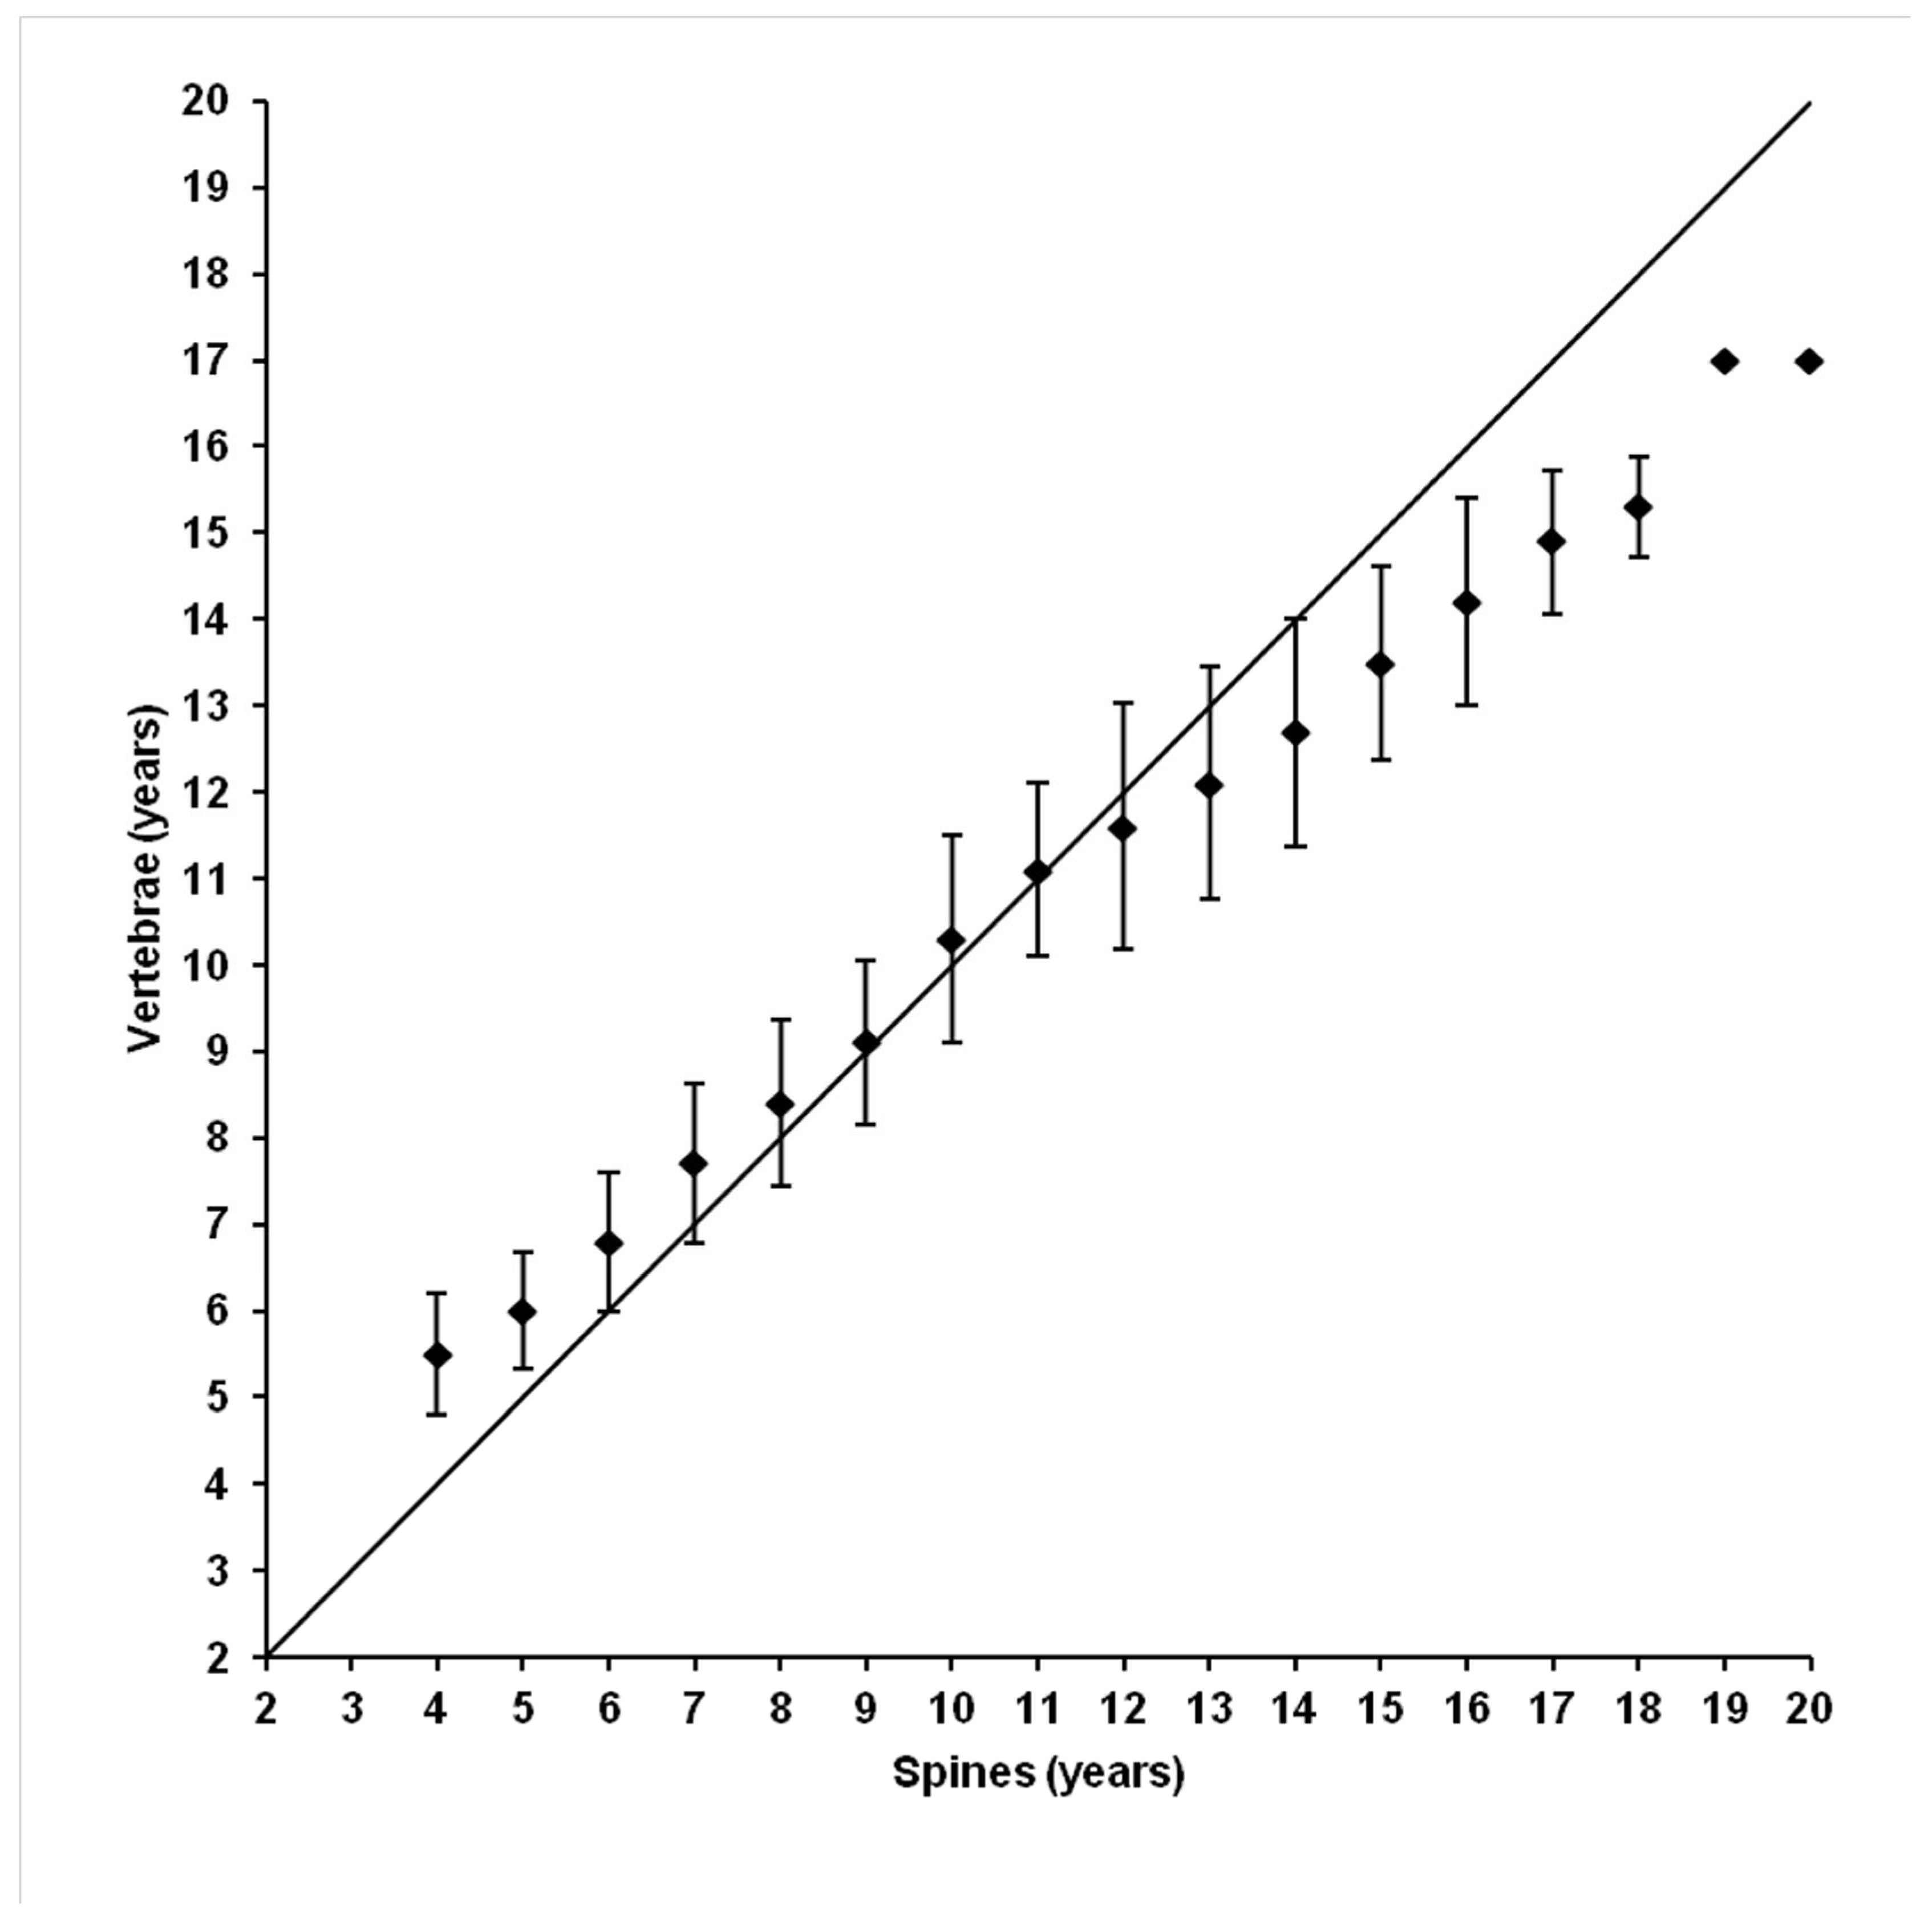
3.3. Ageing Comparison Between the Two Calcified Structures

The ageing comparison analysis between the two calcified structures (Ν = 613) showed that the rate of absolute agreement was 35.1% (Ν = 215), while the percentages of one, two, and three years’ difference were 34.3%, 18.9%, and 11.7%, respectively (Table 2). Additionally, comparing the two ageing methods per size class, we observed that the agreement rate was higher in medium fish (47.6%; FL < 200 cm) than in large fish (29.6%; FL ≥ 200 cm) (Table 2). It was also found that there were no significant differences (p > 0.05) between the age estimations of the two structures in medium fish, whereas significant differences (p < 0.05) were observed in large fish. Moreover, the age bias plot between the dorsal fin spines and the vertebrae showed good agreement in younger specimens, with ages being slightly overestimated when using vertebrae. However, for fish older than 11 years, vertebrae tended to provide lower age estimates compared to dorsal fin spines (Figure 5).
A significant linear relationship was found between the number of annual bands in dorsal fin spines (ABS) and the number of annual bands in vertebrae (ABV) of the same fish. The correlation coefficient of 0.90 indicated a strong relationship between the variables. The equation obtained was the following: ABV = 2.63 + 0.73ABS.
The comparison of the mean lengths at age derived from the age estimations of the dorsal fin spines and vertebrae showed no significant differences (p > 0.05) in 53.8% of the age classes, except for the ages 7, 11, 13, 14, 15, and 17 (Table 1). For the samples that presented no bias between the two ageing methods (N = 215), the von Bertalanffy growth model was fitted to mean lengths at estimated ages, and the growth equation was determined: Lt = 372.3[1−e(−0.075)(t+1.292)] (Figure 6). The mean lengths at the first three ages were derived from a related study that estimated the age of Atlantic bluefin tuna in the central Mediterranean [14]. The phi-prime (Φ′) index, calculated using the von Bertalanffy parameters L and k, was found to be 9.249.

4. Discussion

4.1. Methodological Limitations, Accuracy of Age Estimation Techniques, and Validation Methods

Although there has been a lot of effort to estimate the age and growth of Atlantic bluefin tuna in the Atlantic Ocean and the Mediterranean Sea, using different techniques and methods (Table 3), there is a general lack of agreement among studies on the age and growth estimation of Atlantic bluefin tuna [1,5,6,8,9,10,12,13,16,18,24,25,26,27,28,29,30,31,32,33].
As for dorsal fin spines, previous studies have revealed that, in young individuals, it is easy to find all the translucent and opaque bands formed on the dorsal fin spine. However, in fish over two years old, the central area of the dorsal fin spine begins to reabsorb, and consequently, the bands disappear [12,15,18,26,34]. Similarly, in this study, the process of nucleus vascularization was observed. Generally, the process of vascularization increases with age (Figure 2B). This limitation has been emphasized in several studies, which have noted that the vascularization process in older fish is a critical factor for age estimation bias [35]. As for vertebrae, previous studies have reported the difficulty in distinguishing between the closely spaced growth bands on the outer margin of the vertebra [10,11]. This issue becomes severe in fish aged 8 years and older [9]. This probably constitutes the major disadvantage of the vertebra method. It is likely to underestimate the age of older fish. In this study, this issue becomes severe at the age of 10 and onwards (Figure 2A). This is the reason why the age estimates of the two methods in medium-sized fish did not give significant differences, contrary to the large-sized fish that did. Likewise, Rodríguez-Marín et al. [10] reported that there was almost no bias between both structures in ages from 6 to 11 years. Since the agreement rate for the two ageing methods was higher in medium-sized (47.6%) than in large-sized (29.6%) fish, it seems that the age estimation is more accurate for medium-sized fish than for large ones. This finding is consistent with other studies, such as those of Campana [3], which emphasize that medium-sized specimens aged 6–12 years old often yield more reliable estimates due to clearer band differentiation. According to the existing bibliography, the dorsal fin spine method is preferred for estimating the age of larger individuals, while the vertebra method is commonly used for smaller and medium-sized fish [10,14,16]. Generally, there is a tendency to underestimate the age in vertebrae compared to dorsal fin spines in specimens older than 10 years [10,14,16]. However, for accurate age estimation, it is crucial to validate these methods.
In fact, validation studies confirming the periodicity of growth bands are essential for ensuring the accuracy of age estimation [3]. To date, the accuracy of age estimates for Atlantic bluefin tuna has been validated using bomb radiocarbon dating [36] and by evaluating the periodicity of otolith annulus formation [37]. Nevertheless, age estimates from dorsal fin spines and vertebrae have not been directly validated, leaving the problem of ageing unresolved. Few ageing studies have used indirect validation methods, such as marginal increment analysis and the dorsal fin spine edge type analysis [12,18,24,34] (Table 3).
Table 3. Summary of ageing methods used by various authors to demonstrate the periodicity of growth bands on calcified structures (O, otoliths; S, dorsal fin spines; V, vertebrae) of the Atlantic bluefin tuna. The Coefficient of Variation (CV) and Average Percent Error (APE) are also provided.
AuthorsYearSampling AreaStockWild/RearedCalcified StructureCalcified Structure ComparisonValidation (Yes/No)Validation MethodCV (%)APE (%)
Sella [38]1929Atlantic Ocean, Mediterranean SeaeasternWildV-No---
Mather & Schuck [39]1960Atlantic OceanwesternWildV-No---
Rodríguez-Roda [40]1964Atlantic OceaneasternWildV-YesTag-recovery data--
Caddy et al. [41]1976Atlantic OceanwesternWildO-No---
Butler et al. [42]1977Atlantic OceanwesternWildO-No---
Farrugio [43]1980Mediterranean SeaeasternWildV-No---
Lee et al. [9]1983Atlantic OceanwesternWildO, VO, VYesTag-recovery data--
Compeán-Jimenez & Bard [34]1983Atlantic Ocean,
Mediterranean Sea
easternWildS-No---
Hattour [44]1984Mediterranean SeaeasternWildO-No---
Cort [15]1991Atlantic OceaneasternWildS-No---
Olafsdóttir & Ingimundardóttir [45] 2000Atlantic OceaneasternWildV-No---
Megalofonou & de Metrio [18]2000Mediterranean SeaeasternWildS-YesMarginal Increment Analysis--
Farrugia & Rodriguez-Cabello [27]2001Mediterranean SeaeasternWildS-No---
El-Kebir et al. [26]2002Mediterranean SeaeasternWildS-No---
Megalofonou et al. [46]2003Mediterranean SeaeasternWildO-No---
Rodríguez-Marín et al. [47]2004Atlantic OceaneasternWildS-No---
La Mesa et al. [48]2005Mediterranean SeaeasternWildO-No-0.030.02
Rodríguez-Marín et al. [10]2006Atlantic OceaneasternWildS, VS, VNo-6.2-
Megalofonou [30]2006Mediterranean SeaeasternWildO-No-5.26-
Neilson & Campana [36]2008Atlantic OceanwesternWildO-YesBomb radiocarbon0.12-
Santamaria et al. [33]2009Mediterranean SeaeasternWildS-No---
Secor et al. [49]2009Atlantic OceanwesternWildO-No---
Restrepo et al. [31]2010Atlantic OceanwesternWildO-No---
Landa et al. [29]2011Atlantic Ocean, Mediterranean SeaeasternWildS-No---
Rodríguez-Marín et al. [50]2013Atlantic Ocean, Mediterranean SeaeasternWildO, SO, SYesBomb radiocarbonS: 2.4–8.5
O: 4.6–10.4
-
Milatou & Megalofonou [16]2014Mediterranean SeaeasternRearedV-No-2.461.89
Cort et al. [15]2014Atlantic Ocean, Mediterranean Seaeastern, westernWild, RearedS-YesLmax, Tag-recovery data, first dorsal fin spine analysis, marginal increment analysis--
Luque et al. [12]2014Atlantic Ocean, Mediterranean SeaeasternWildS-YesEdge type, marginal increment analysis3.1–8.32.2–5.8
Santamaria et al. [13]2015Mediterranean SeaeasternWild, RearedS-No---
Siskey et al. [37]2016Atlantic OceanwesternWildO-YesPeriodicity of strodium--
Rodríguez-Marín et al. [24]2022Atlantic Ocean,eastern, westernWildO, SO, SNo 118
Milatou & Megalofonou [14]2023Mediterranean SeaeasternRearedS-No-3.732.87

4.2. Seasonal Formation of Growth Bands in Dorsal Fin Spines and Vertebrae

The formation of the annual bands depends on several causes including migration, reproduction, the quantity of food, and environmental parameters. In young fish, it was observed that the opaque bands are much wider than the translucent bands. As bluefin tuna grow, the opaque bands become progressively narrower, whereas the translucent bands remain approximately the same. According to the existing bibliography, the translucent bands are laid down from November to May and opaque growth bands from June to October [11,12,15,32]. As for the vertebrae, it is assumed that the ridges begin to form around the end of the feeding season in November. Grooves are probably formed in spring and summer [9]. The identification of an entire annual pattern in edge band formation was not possible in this study since the harvesting of the bluefin tuna occurred only during winter months. In these months (December, January, and February) the translucent bands observed at the edge of the dorsal fin spine section had the highest frequency (94.9%). So, it seems that translucent bands are formed during the winter months. Similarly, Luque et al. [12] reported that the highest frequency of translucent bands at the edge of the dorsal fin spine section increased gradually during winter months until January and then decreased gradually. Moreover, this study confirms that the ridges in vertebrae form during the winter months.
Additionally, Milatou & Megalofonou [14] indicated that the opaque band deposited during the rearing period (6 or 18 months) was noticeably wider than those formed while the fish were in the wild. This observation suggests that aquaculture conditions—such as constant food availability and the absence of migration—can significantly influence growth dynamics and the structure of calcified tissues, particularly in dorsal fin spines. These differences underscore the need to consider rearing effects when interpreting growth band patterns in reared specimens. However, it should be emphasized that the rearing period is relatively short (6 or 18 months), during which almost all growth rings have already formed while the fish are still in the wild. Therefore, rearing conditions are unlikely to affect the final outcome in age estimation as the primary growth rings that determine age have already formed prior to the fish entering the farm. While rearing conditions may influence other aspects of development, such as body weight, they are not considered to play a role in the accuracy of age estimates in this case.

4.3. Precision of Age Estimates

According to recent studies, measures of precision, such as Average Percent Error (APE) and the Coefficient of Variation (CV), are used widely, even though the CV is used more often (57%) than the APE. The CV is statistically more accurate and flexible compared to the APE [3,21,51]. Testing the precision of age estimations showed that the values of precision indices were acceptable and consistent with those reported in the existing literature. In fact, the CV and APE values were found to be lower than the recommended reference value of 5% established for many fishes of moderate longevity and reading complexity [3].

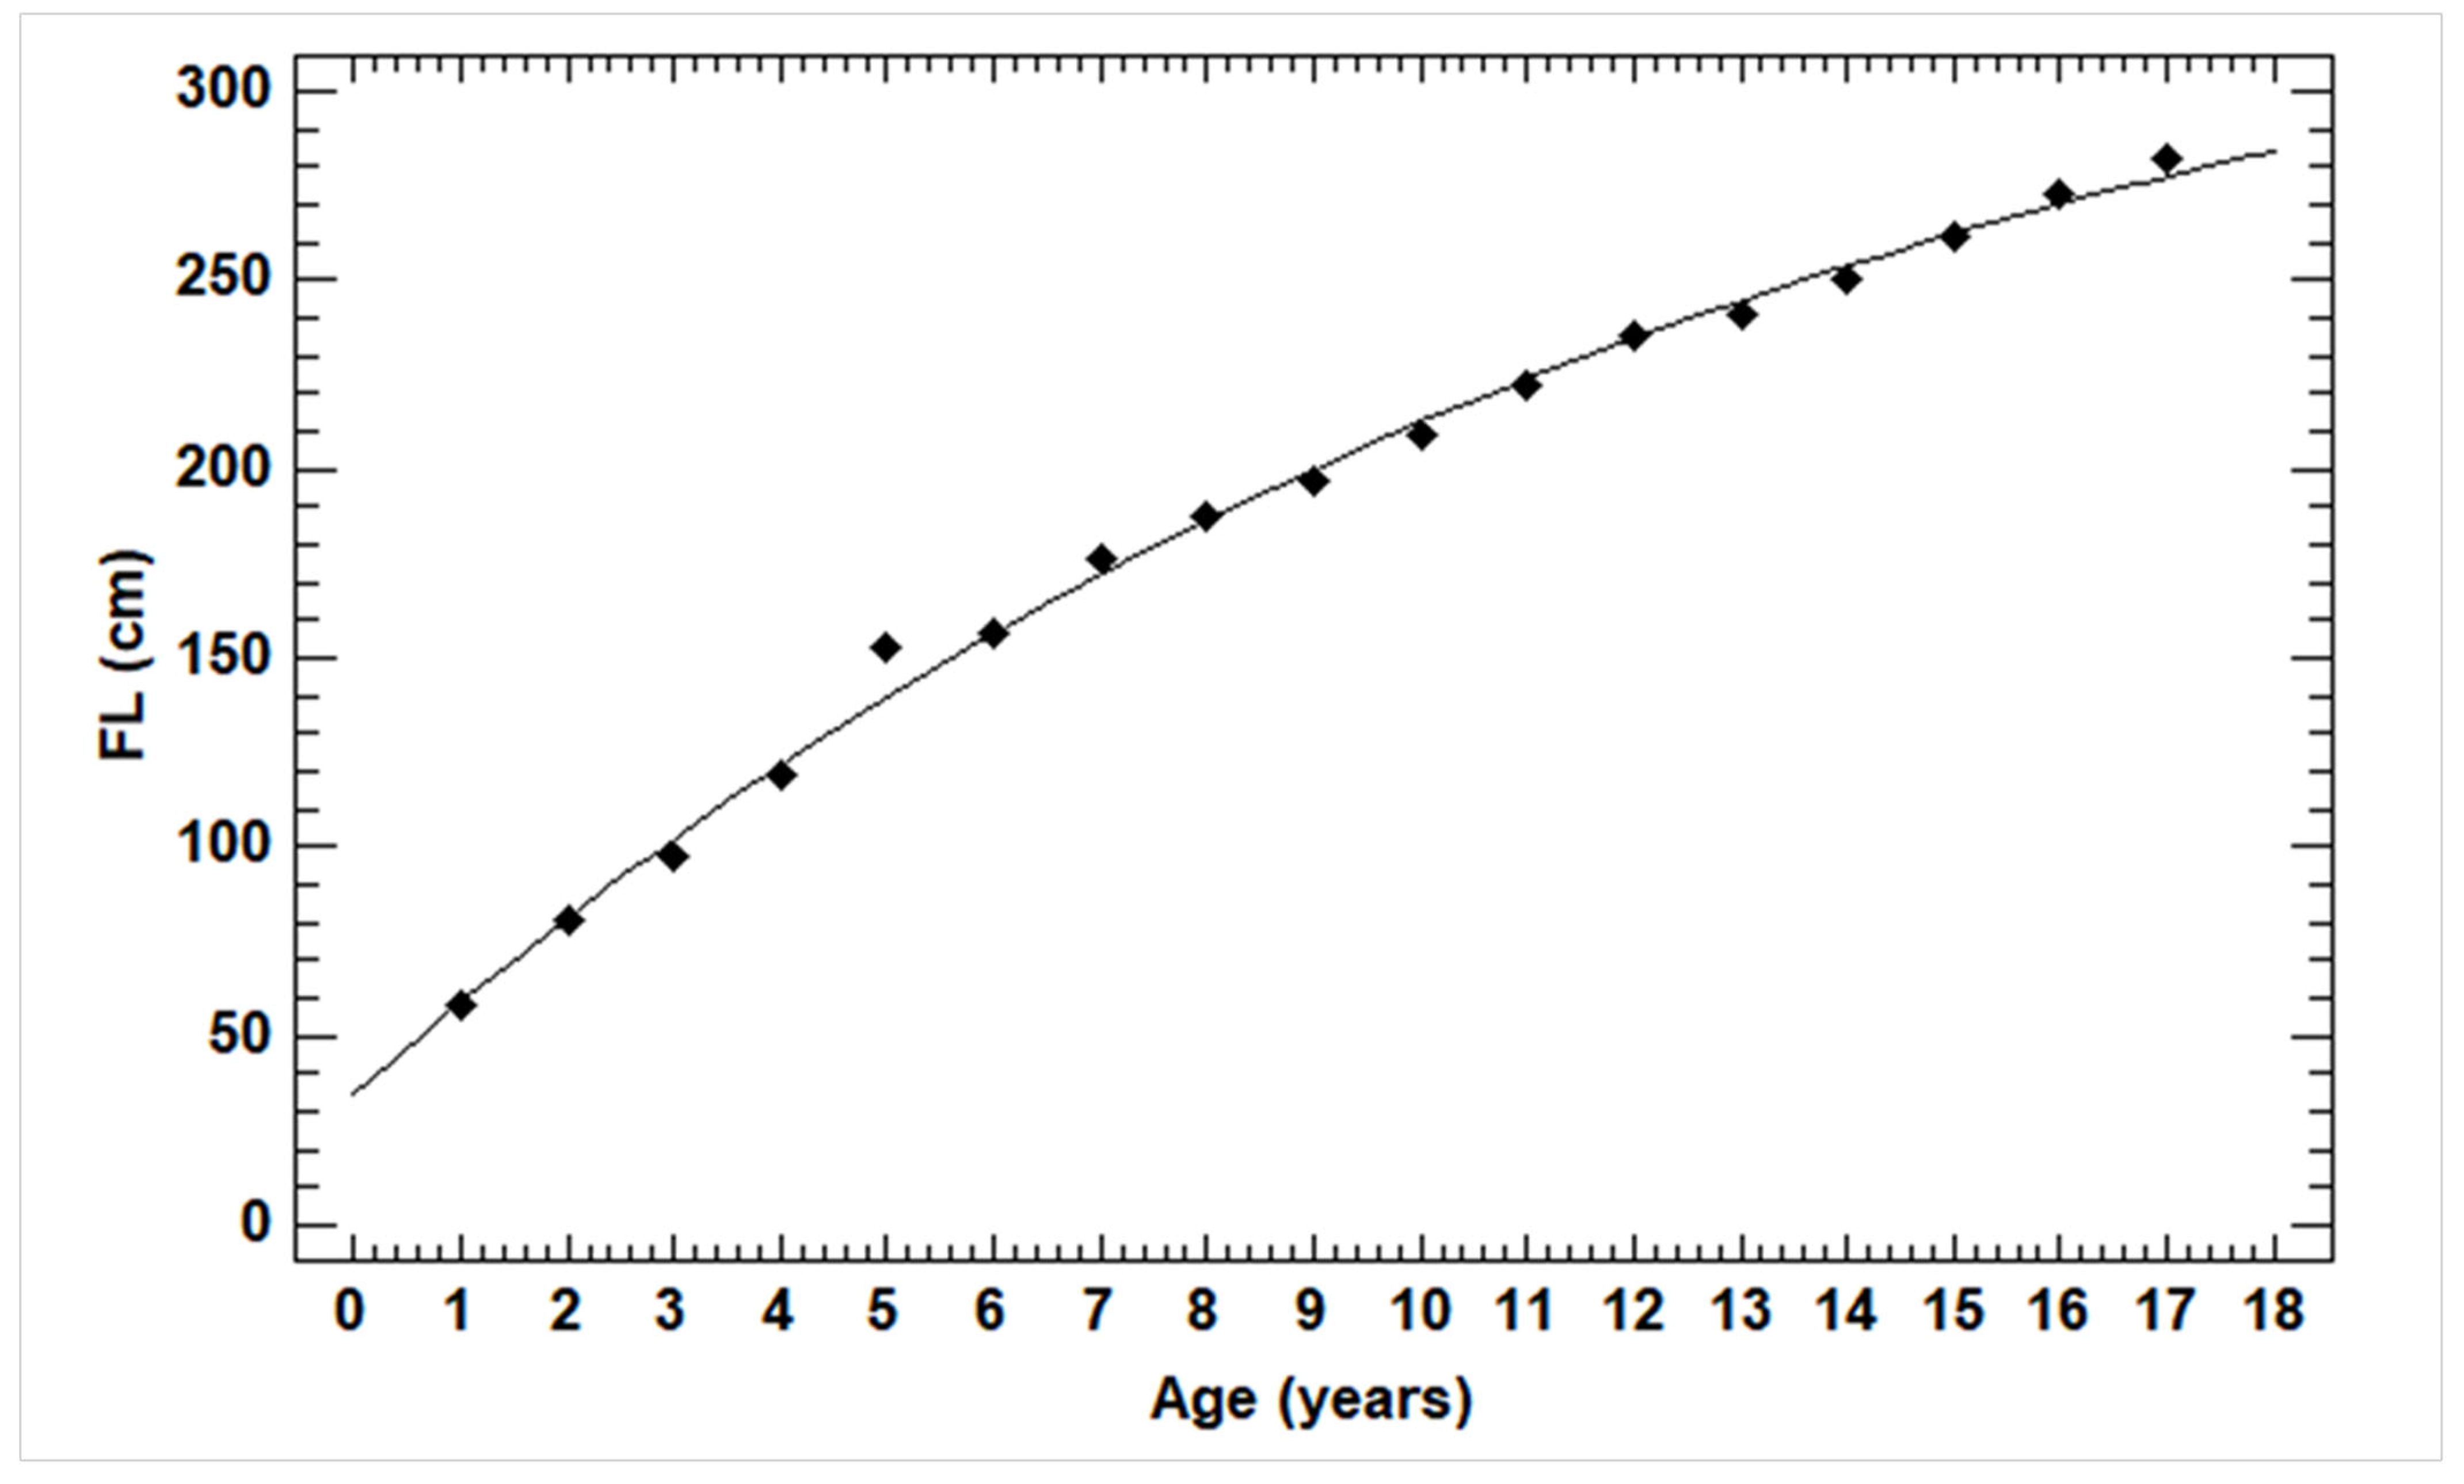
4.4. Growth Estimation and the Relationship Between Fish Size and Calcified Structures

Although there were no significant differences in mean lengths at age between the two ageing methods, some differences were identified per age group. Specifically, from the age 5 to 9 years, the dorsal fin spine method showed higher mean lengths than the vertebra method, while from the age of 10 to 17 years, adverse results were found. The estimation of von Bertalanffy growth parameters gave intermediate asymptotic length values and high values of k. The phi-prime (Φ′) tends to be normally and narrowly distributed among different populations of the same species [5]. These results are explained by the relative lack of large fish in our samples and by the distinctiveness of each calcified structure. It is known that the lack of data from small and large specimens may have an impact on growth estimations. Age underestimation can lead to a higher asymptotic length and a lower value of k, while age overestimation can lead to the opposite results. It is a fact that the limitations of each ageing method stem from physiological processes—such as vascularization in dorsal fin spines and the difficulty in distinguishing closely spaced growth bands in vertebrae—as well as from the absence of data on small or large individuals, which can significantly affect the accuracy of growth parameter estimates. As Tuset et al. [35] highlighted, the accuracy of growth estimations depends on the availability of fish across a broad size range, which is often lacking in tuna studies due to commercial fisheries typically targeting specific age classes.
A basic assumption in growth studies using calcified structures is that fish size and the size of the calcified structure are closely related throughout the entire life cycle, which means that the growth band on the calcified structure can be related to a time scale [4]. Several authors have found a significant relationship between the calcified structure radius and fork length, even in giant bluefin tuna [9,10,34,52]. Likewise, in the present study, significant relationships were found between the radius of the calcified structures and the fork length of the fish.

4.5. Impacts of Including Back-Calculated Juvenile Ages on Growth Parameter Estimation

To improve the accuracy of growth parameter estimation, back-calculated age data for ages 1 to 3 were incorporated into the von Bertalanffy model. These data originated from a previous study conducted on the same sample set, in which dorsal fin spines were used for age estimation [14]. Juvenile fish are typically underrepresented in farm-based samples, which often lead to the inadequate characterization of the early growth phase. By including these early age classes, the model is better able to capture the initial rapid growth of Atlantic bluefin tuna and provide more biologically realistic estimates of growth parameters.
In particular, the presence of young ages reduces the risk of overestimating the asymptotic length (L) and mitigates the distortion of the growth coefficient (k) and theoretical age at length zero (t0). A sensitivity analysis confirmed that excluding ages 1 to 3 resulted in inflated L and highly negative t0 values, suggesting a poorer model fit. Therefore, the inclusion of early age data is essential for producing a robust and meaningful growth curve, particularly in studies where the sampling of young individuals is limited.

4.6. Implications for Stock Assessment and Fishery Management

The results of this study have important implications for the assessment and management of Atlantic bluefin tuna stocks, particularly in the Mediterranean Sea, where most individuals are destined for fattening operations. Accurate age estimation is a key component in understanding growth patterns, maturity schedules, and population structure—elements that underpin sustainable catch limits and stock status evaluations. By refining ageing methods, particularly in medium to large individuals, this study offers a more reliable means of estimating the age structure of bluefin tuna stocks.
Our findings reinforce previous observations regarding age-related biases in both dorsal fin spines and vertebrae, specifically the underestimation of age in older individuals. These limitations highlight the need to carefully select the appropriate structure based on fish size and to interpret age data in the context of structural characteristics. Importantly, the better agreement observed between methods in medium-sized fish suggests that this size class provides the most reliable age estimates, which is critical for monitoring juvenile populations and managing both wild stocks and reared fish.
Structure-specific biases in age estimation, particularly the underestimation observed in older individuals, may also have important implications for stock assessment outputs. Such biases can lead to the underrepresentation of older, more fecund individuals in the estimated age structure, ultimately affecting key management metrics such as spawning stock biomass (SSB) and fishing mortality-at-age (F-at-age). Failure to account for these effects can result in overly optimistic estimates of stock productivity, potentially compromising the sustainability of management strategies. Recognizing and adjusting for these biases is therefore essential for improving the accuracy of assessment models and ensuring precautionary fishery management.
Additionally, the seasonal formation of growth bands, predominantly during the winter months, could improve the resolution of age estimates when combined with edge-type analysis. This seasonal pattern may offer new opportunities to refine the temporal accuracy of age assignments, especially when precise timing of annulus formation is needed for growth or recruitment studies.
These insights also underscore the importance of validation. While ageing using otoliths has been validated through methods such as bomb radiocarbon dating, the direct validation of dorsal fin spines and vertebrae remains limited. Incorporating indirect validation techniques, such as marginal increment analysis, will be essential in improving confidence in age data derived from these more accessible structures. Moreover, with an understanding of the factors influencing growth and maturation (e.g., environmental parameters, migration, and feeding conditions), fishery managers will be better equipped to design conservation measures that promote sustainable harvesting and the long-term viability of bluefin tuna stocks in the Mediterranean.
Given the aforementioned limitations and uncertainties, particularly in validation and structural bias, complementary modeling approaches—such as integrated or Bayesian frameworks—may help reduce bias in stock assessment outputs by incorporating uncertainty and additional biological information.
Finally, the practical availability of dorsal fin spines—particularly in commercial settings where otolith extraction is often not feasible—makes this method especially valuable for routine monitoring and fishery data collection. These findings are particularly valuable for regional fishery management organizations such as ICCAT, which often require reliable age data for stock assessments in fisheries where traditional otolith sampling is logistically or economically unfeasible. By offering alternative aging methods, this work supports more informed and inclusive management decisions across data-limited contexts. Overall, the study contributes to ongoing efforts to enhance the precision of age estimation and supports more robust and informed fishery management for this high-value species.

5. Conclusions

Age data are fundamental to effective fishery management, forming the basis of growth models used in stock assessment. Although Atlantic bluefin tuna has been extensively studied, direct comparisons of age estimates derived from different calcified structures remain limited.
This study compared age estimates obtained from dorsal fin spines and caudal vertebrae. Both structures yielded reliable age data overall; however, challenges emerged in ageing older individuals. After age 10, the clarity of growth bands in both structures declined, complicating interpretation. Dorsal fin spines remained more effective in older fish, whereas vertebrae showed increasing difficulty, likely due to the crowding of bands at the outermost edge.
In older specimens, resorption of the central area in dorsal fin spines and tightly packed annuli in vertebrae contributed to underestimation. Consequently, significant differences between the two methods were observed in large fish (FL > 200 cm), while medium-sized fish (FL ≤ 200 cm) exhibited stronger agreement.
Precision metrics such as the Average Percent Error (APE) and Coefficient of Variation (CV) confirmed that both methods provide consistent and reproducible estimates. Notably, the vertebra method showed slightly lower error rates, and the precision values aligned with those reported in the literature.
For the samples where there was no bias between the two methods, the von Bertalanffy growth model was applied. The growth parameters indicated an intermediate asymptotic length and a high growth coefficient. These findings are likely influenced by the dominance of medium-sized fish in the sample, as well as the structural differences in the growth patterns observed between the two calcified structures.
Future research should expand age comparisons across multiple calcified structures and geographical areas and include validation studies to confirm the periodicity of band formation. This will enhance the accuracy and consistency of age estimates for Atlantic bluefin tuna.
In summary, both dorsal fin spines and caudal vertebrae are suitable for age estimation, with their respective strengths depending on the fish’s size and age. Specifically, vertebrae are particularly suitable for younger and medium-sized fish, where growth bands are more distinct. However, as fish age, the growth bands in vertebrae become increasingly crowded at the outermost edge, making it difficult to distinguish individual bands, which can lead to age underestimation. Dorsal fin spines are generally reliable for ageing larger fish, although the early growth rings may become obscured due to vascularization. Age estimation is most accurate in young and medium-sized fish, where both methods show higher consistency. These findings emphasize the importance of selecting the appropriate structure based on fish size and age for more accurate age determination. The continued refinement of ageing methods and incorporation of validation techniques will lead to improved age data, supporting more accurate stock assessments and sustainable fishery management.

Author Contributions

N.M.: Writing—original draft preparation, conceptualization, visualization, methodology, formal analysis, resources, data curation, investigation. P.M.: Conceptualization, supervision, resources, writing—reviewing and editing. All authors have read and agreed to the published version of the manuscript.

Funding

This research received no external funding.

Institutional Review Board Statement

Ethical review and approval were waived for this study because it did not involve any experiments on animals.

Data Availability Statement

The original contributions presented in this study are included in the article. Further inquiries can be directed to the corresponding author(s).

Acknowledgments

This study is part of a PhD thesis conducted at the Department of Biology, National and Kapodistrian University of Athens. We would like to express our thanks to A. Tzoumas and to the Greek and Japanese fishermen for their assistance on board.

Conflicts of Interest

The authors declare that they have no known competing financial interests or personal relationships that could have appeared to influence the work reported in this paper.

References

  1. Ailloud, L.E.; Lauretta, M.V.; Hanke, A.R.; Golet, W.J.; Allman, R.J.; Siskey, M.R.; Secor, D.H.; Hoenig, J.M. Improving growth estimates for Western Atlantic bluefin tuna using an integrated modeling approach. Fish. Res. 2017, 191, 17–24. [Google Scholar] [CrossRef]
  2. Cailliet, G.M.; Andrews, A.H.; Bourton, E.J.; Watters, D.L.; Kline, D.E.; Ferry, L.A. Age determination and validation studies of marine fishes: Do deep-dwellers live longer? Exp. Gerontol. 2001, 36, 739–764. [Google Scholar] [CrossRef]
  3. Campana, S.E. Accuracy, precision and quality control in age determination, including a review of the use and abuse of age validation methods. J. Fish Biol. 2001, 59, 197–242. [Google Scholar] [CrossRef]
  4. Casselman, J.M. Determination of age and growth. In The Biology of Fish Growth; Weatherley, A.H., Gill, H.S., Eds.; Academic Press: London, UK, 1989; pp. 209–242. [Google Scholar]
  5. Murua, H.; Rodríguez-Marín, E.; Neilson, J.D.; Farley, J.H.; Juan-Jordá, M.J. Fast versus slow growing tuna species: Age, growth, and implications for population dynamics and fisheries management. Rev. Fish Biol. Fish. 2017, 27, 733–773. [Google Scholar] [CrossRef]
  6. Mather, F.J.; Mason, J.M.; Jones, A.C. Historical Document: Life History and Fisheries of Atlantic Bluefin Tuna; NOAA Tech. Memo.; NMFS-SEFSC-370; U.S. Department of Commerce, National Oceanic and Atmospheric Administration, National Marine Fisheries Service: Silver Spring, MD, USA, 1995; Miami; 165p. [Google Scholar]
  7. Clay, D. Atlantic bluefin tuna (Thunnus thynnus): A review. Int.-Am. Trop. Tuna Comm. Spec. Rep. 1991, 7, 89–180. [Google Scholar]
  8. Rodríguez-Marín, E.; Quelle, P.; Ruiz, M.; Busawon, D.; Golet, W.; Dalton, A.; Hanke, A. Updated Comparison of Age Estimates from Paired Calcified Structures from Atlantic Bluefin Tuna. SCRS/2016/134. Available online: https://digital.csic.es/handle/10261/326835 (accessed on 15 May 2025).
  9. Lee, D.W.; Prince, E.D.; Crow, M.E. Interpretation of growth bands on vertebrae and otoliths of Atlantic bluefin tuna, Thunnus thynnus. NOAA Tech. Rep. NMFS 1983, 8, 61–69. [Google Scholar]
  10. Rodríguez-Marín, E.; Olafsdottir, D.; Valeiras, J.; Ruiz, M.; Chosson-Pampoulie, V.; Rodríguez Cabello, C. Ageing comparison from vertebrae and spines of bluefin tuna (Thunnus thynnus) coming from the same specimen. Collect. Vol. Sci. Pap. ICCAT 2006, 59, 868–876. [Google Scholar]
  11. Rodríguez-Marín, E.; Clear, N.; Cort, J.L.; Megalofonou, P.; Neilson, J.D.; Neves Dos Santos, M.; Olafsdottir, D.; Rodriguez-Cabello, C.; Ruiz, M.; Valeiras, J. Report of the 2006 ICCAT workshop for bluefin tuna direct ageing. Collect. Vol. Sci. Pap. ICCAT 2007, 60, 1349–1392. [Google Scholar]
  12. Luque, P.L.; Rodríguez-Marín, E.; Landa, J.; Ruiz, M.; Quelle, P.; Marcias, D.; Ortiz de Urbina, J.M. Direct ageing of Thunnus thynnus from the east Atlantic Ocean and western Mediterranean Sea using dorsal fin spines. J. Fish Biol. 2014, 84, 1876–1903. [Google Scholar] [CrossRef]
  13. Santamaria, N.; Bello, G.; Pousis, C.; Vassallo-Agius, R.; de la Gándara, F.; Corriero, A. Fin Spine Bone Resorption in Atlantic Bluefin Tuna, Thunnus thynnus, and Comparison between Wild and Captive-Reared Specimens. PLoS ONE 2015, 10, e0121924. [Google Scholar] [CrossRef]
  14. Milatou, N.; Megalofonou, P. Direct Ageing and Growth using Dorsal Fin Spines of Bluefin Tuna Thunnus thynnus (Scombridae) Reared in Sea Cages and a Comparison with Wild Populations. J. Ichthyol. 2023, 63, 479–492. [Google Scholar] [CrossRef]
  15. Cort, J.L. Age and growth of the bluefin tuna (Thunnus thynnus) of the NorthEast Atlantic. Collect. Vol. Sci. Pap. ICCAT 1991, 35, 213–230. [Google Scholar]
  16. Milatou, N.; Megalofonou, P. Age structure and growth of bluefin tuna (Thunnus thynnus, L.) in the capture-based aquaculture in the Mediterranean Sea. Aquaculture 2014, 424–425, 35–44. [Google Scholar] [CrossRef]
  17. Milatou, N.; Dassenakis, M.; Megalofonou, P. Mercury concentrations in reared Atlantic bluefin tuna and risk assessment for the consumers: To eat or not to eat? Food Chem. 2020, 331, 127267. [Google Scholar] [CrossRef] [PubMed]
  18. Megalofonou, P.; De Metrio, G. Age estimation and annulus-formation in dorsal spines of juvenile bluefin tuna, Thunnus thynnus, from the Mediterranean Sea. J. Mar. Biol. Assoc. UK 2000, 80, 753–754. [Google Scholar] [CrossRef]
  19. Megalofonou, P. Age and growth of Mediterranean albacore. J. Fish Biol. 2000, 57, 700–715. [Google Scholar] [CrossRef]
  20. Berry, F.H.; Lee, D.W.; Bertolino, A.R. Age estimates in Atlantic bluefin tuna—An objective examination and an intuitive analyses of rhythmic markings in vertebrae and in otoliths. Collect. Vol. Sci. Pap. ICCAT 1977, 6, 305–317. [Google Scholar]
  21. Beamish, R.J.; Fournier, D.A. A method of comparing the precision of a set of age determinations. Can. J. Fish. Aquat. Sci. 1981, 38, 982–983. [Google Scholar] [CrossRef]
  22. Chang, W.Y.B. A statistical method for evaluating the reproducibility of age determination. Can. J. Fish. Aquat. Sci. 1982, 39, 1208–1210. [Google Scholar] [CrossRef]
  23. Sparre, P. Computer Programs for Fish Stock Assessment: Length-Based Fish Stock Assessment (LFSA); Food and Agriculture Organization of the United Nations: Charlottesville, VA, USA, 1987; Volume 101. [Google Scholar]
  24. Rodríguez-Marín, E.; Busawon, D.; Luque, P.L.; Castillo, I.; Stewart, N.; Krusic-Golub, K.; Parejo, A.; Hanke, A. Timing of Increment Formation in Atlantic Bluefin Tuna (Thunnus thynnus) Otoliths. Fishes 2022, 7, 227. [Google Scholar] [CrossRef]
  25. Cort, J.L.; Arregui, I.; Estruch, V.D.; Deguara, S. Validation of the growth equation applicable to the eastern Atlantic bluefin tuna Thunnus thynnus (L.), using Lmax, tag-recapture, and first dorsal spine analysis. Rev. Fish. Sci. Aquac. 2014, 22, 239–255. [Google Scholar] [CrossRef]
  26. El-Kebir, N.K.; Rodríguez-Cabello, C.; Tawil, Y. Age estimation of bluefin tuna (Thunnus thynnus, L.) caught in traps in Libyan waters based in dorsal spine reading. Collect. Vol. Sci. Pap. ICCAT 2002, 54, 641–648. [Google Scholar]
  27. Farrugia, A.; Rodríguez-Cabello, C. Preliminary study on the age estimation of bluefin tuna (Thunnus thynnus, L.) around the Maltese Islands. Collect. Vol. Sci. Pap. ICCAT 2001, 52, 771–775. [Google Scholar]
  28. Itoh, T.; Shiina, Y.; Tsuji, S.; Endo, F.; Tezuka, N. Otolith daily increment formation in laboratory reared larval and juvenile bluefin tuna Thunnus thynnus. J. Fish. Sci. 2000, 66, 834–839. [Google Scholar] [CrossRef]
  29. Landa, J.; Rodríguez-Marín, E.; Lastra, P.; Ruiz, M.; Quelle, P. Growth of bluefin tuna (Thunnus thynnus) in the North-eastern Atlantic and Mediterranean based on back-calculation of dorsal spine annuli. Fish. Res. 2011, 170, 190–198. [Google Scholar] [CrossRef]
  30. Megalofonou, P. Comparison of otolith growth and morphology with somatic growth and age in young-of-the-year bluefin tuna. J. Fish Biol. 2006, 68, 1867–1878. [Google Scholar] [CrossRef]
  31. Restrepo, V.R.; Diaz, G.A.; Walter, J.F.; Neilson, J.D.; Campana, S.E.; Secor, D.; Wingate, R.L. Updated estimate of the growth curve of Western Atlantic bluefin tuna. Aquat. Living Resour. 2010, 23, 335–342. [Google Scholar] [CrossRef]
  32. Rodríguez-Marín, E.; Di Natale, A.; Quelle, P.; Ruiz, M.; Allman, R.; Bellodi, A.; Busawon, D.; Farley, J.; Garibaldi, F.; Ishihara, T.; et al. Report of the age calibration exchange within the Atlantic Wide Research Programme for bluefin tuna (GBYP) Collect. Vol. Sci. Pap. ICCAT 2015, 71, 1174–1214. [Google Scholar]
  33. Santamaria, N.; Bello, G.; Corriero, A.; Deflorio, M.; Vassalo-Agius, R.; Bök, T.; De Metrio, G. Age and growth of Atlantic bluefin tuna, Thunnus thynnus, (Osteichthyes: Thunnidae), in the Mediterranean Sea. J. Appl. Ichthyol. 2009, 25, 38–45. [Google Scholar] [CrossRef]
  34. Compeán-Jiménez, G.; Bard, F.X. Growth increments on dorsal spines of eastern Atlantic bluefin tuna (Thunnus thynnus, L.) and their possible relation to migrations patterns. NOAA Tech. Rep. NMFS 1983, 8, 77–86. [Google Scholar]
  35. Tuset, V.M.; González, M.S.; García, A. Age estimation of Atlantic bluefin tuna from the Mediterranean Sea using calcified structures. Fish. Sci. 2008, 74, 573–585. [Google Scholar]
  36. Neilson, J.D.; Campana, S.E. A validated description of age and growth of western Atlantic bluefin tuna (Thunnus thynus). Can. J. Fish. Aquat. Sci. 2008, 65, 1523–1527. [Google Scholar] [CrossRef]
  37. Siskey, M.R.; Wilberg, M.J.; Allman, R.J.; Barnett, B.K.; Secor, D.H. Forty years of fishing: Changes in age structure and stock mixing in northwestern Atlantic bluefin tuna (Thunnus thynnus) associated with size-selective and long-term exploitation. ICES J. Mar. Sci. 2016, 73, 2518–2528. [Google Scholar] [CrossRef]
  38. Sella, M. Migrations and Habitat of the Tuna (Thunnus thynnus), Studied by Method of the Hooks, with Observations on Growth, on the Operation of the Fisheries, Etc.; Van Campen, W.G., Translator; U.S. Department of the Interior Fish and Wildlife Service: Washington, DC, USA, 1929; SSRF No. 76; 20p. [Google Scholar]
  39. Mather, F.J.; Schuck, H.A. Growth of bluefin tuna of the western North Atlantic. Fish. Bull. 1960, 61, 39–52. [Google Scholar]
  40. Rodríguez-Roda, J. Movimientos Migratorios del Atún, Thunnus thynnus (L.), Deducidos por Nuestraspropias “Marcaciones” en Aguas Españolas; Publicaciones Técnicas de la Junta de Estudios de Pesca, Dirección General de Pesca Marítima: Madrid, Spain, 1964; Volume 3, pp. 279–304. [Google Scholar]
  41. Caddy, J.F.; Dickson, C.A.; Butler, M.J.A. Age and growth of giant bluefin tuna (Thunnus thynnus) taken in Canadian waters in 1975. Fish. Res. Board Can. Manuscr. Rep. Ser. 1976, 1395, 17. [Google Scholar]
  42. Butler, M.J.A.; Caddy, J.F.; Dickson, C.A.; Hunt, J.J.; Burnett, C.D. Apparent age and growth based on otolith analysis, of giant bluefin tuna, (Thunnus thynnus) in the 1975–1976 Canadian catch. Collect. Vol. Sci. Pap. ICCAT 1977, 6, 318–330. [Google Scholar]
  43. Farrugio, H. Age et croissance du thon rouge (Thunnus thynnus) dans la pecherie francaise de surface en Mediterranee. Cybium 1980, 3, 45–59. [Google Scholar]
  44. Hattour, A. Analyse de l’âge, de la croissance et des captures des thons rouges (Thunnus thynnus) et des thonines (Euthynnus alletteratus) pêchés dans les eaux tunisiennes. Bull. Inst. Nat. Scient. Tech. Océanogr. Pêc. Sal. 1984, 11, 5–39. [Google Scholar]
  45. Ólafsdóttir, D.; Ingimundardóttir, T. Preliminary report on experimental fisheries and biological research on bluefin tuna (Thunnus thynnus) within the Islandic EEZ in 1996-98. ICCAT Sci. Pap. 2000, 51, 827–838. [Google Scholar]
  46. Megalofonou, P.; Platis, K.; De Metrio, G.; Santamaria, N. Age estimation of juvenile bluefin tuna, Thunnus thynnus, from the Mediterranean Sea. Cah. Options Méditerr. 2003, 60, 123–125. [Google Scholar]
  47. Rodríguez-Marín, E.; Landa, J.; Ruiz, M.; Godoy, D.; Rodríguez-Cabello, C. Age estimation of adult bluefin tuna (Thunnus thynnus) from dorsal spine reading. Collect. Vol. Sci. Pap. ICCAT 2004, 56, 1168–1174. [Google Scholar]
  48. La Mesa, M.; Sinopoli, M.; Andaloro, F. Age and growth rate of juvenile bluefin tuna Thunnus Thynnus from the Mediterranean Sea (Sicily, Italy). Sci. Mar. 2005, 69, 241–249. [Google Scholar] [CrossRef]
  49. Secor, D.H.; Wingate, R.L.; Neilson, J.D.; Rooker, J.R.; Campana, S.E. Growth of Atlantic bluefin tuna: Direct age estimates. Collect. Vol. Sci. Pap. ICCAT 2009, 64, 405–416. [Google Scholar]
  50. Rodríguez-Marín, E.; Luque, P.L.; Busawon, D.; Campana, S.; Golet, W.; Koob, E.; Neilson, J.; Quelle, P.; Ruiz, M. An Attempt of Validation of Atlantic Bluefin Tuna (Thunnus thynnus) Ageing Using Dorsal Fin Spines. SCRS/2013/081. Available online: https://digital.csic.es/handle/10261/326831 (accessed on 15 May 2025).
  51. Campana, S.E.; Annand, M.C.; MC Millan, I. Graphical and Statistical Methods for Determining the Consistency of Age Determinations. Trans. Am. Fish. Soc. 1995, 124, 131–138. [Google Scholar] [CrossRef]
  52. Foreman, T. Estimates of age and growth, and an assessment of ageing techniques, for northern bluefin tuna, Thunnus thynnus, in the Pacific Ocean. IATTC Bull. 1996, 21, 2. [Google Scholar]
Figure 1. (A) Caudal vertebra of a reared Atlantic bluefin tuna aged 8 years. The points represent the annual growth bands (ridges) and the line how the vertebra diameter was measured. (B) Dorsal fin spine section image from a reared Atlantic bluefin tuna aged 8 years. The points reflect translucent bands counted as annuli and the line how the section diameter was measured. Both calcified structures came from the same fish.
Fishes 10 00260 g001
Figure 2. (A) The black point reflects the closely spaced growth bands on the outer margin of a caudal vertebra. (B) The black point reflects the closely spaced growth bands on the outer margin of a dorsal fin spine section. Both calcified structures came from the same fish.
Fishes 10 00260 g002
Figure 3. Fork length (FL) frequency distribution of reared Atlantic bluefin tuna from the Greek bluefin tuna farm for the period 2007–2011.
Fishes 10 00260 g003
Figure 4. Age-frequency distributions of reared Atlantic bluefin tuna based on counting annuli from dorsal fin spines and vertebrae from the same fish.
Fishes 10 00260 g004
Figure 5. Bias comparison between vertebrae and dorsal fin spines from reared Atlantic bluefin tuna in the Mediterranean Sea.
Fishes 10 00260 g005
Figure 6. Von Bertalanffy growth curve for the reared Atlantic bluefin tuna samples shows no bias between the two ageing methods.
Fishes 10 00260 g006
Table 1. Comparison of mean lengths at age estimated from dorsal fin spines and vertebrae from 613 reared Atlantic bluefin tuna.
Mean FL (cm)
Estimated AgeSpinesVertebraeStudent Testp-Value
4141.0
5162.7146.70.640.5901
6165.8158.11.890.0717
7183.1173.33.600.0008 *
8190.4187.21.660.1486
9197.9197.70.080.9334
10211.3214.3−1.870.0700
11222.7226.3−2.670.0099 *
12232.2234.3−1.720.0915
13236.5242.2−2.770.0073 *
14242.1251.7−4.120.0001 *
15249.5259.4−4.490.0000 *
16255.2262.7−1.970.1057
17256.7269.5−3.630.0151 *
18250.0
19255.0
20273.5
* Statistically significant difference.
Table 2. Comparison of ageing results between the dorsal fin spines and vertebrae from 613 reared Atlantic bluefin tuna in the Mediterranean Sea.
Annual Band Difference (ABD) 0 −1 −2 −3
Medium BFTN8974206
%47.60 39.5710.692.14
Large BFTN1261369668
%29.5831.9322.5315.96
All samplesN21521011672
%35.0734.2618.9211.75
ABD Number of spine annual bands—number of vertebra annual bands. Medium, FL < 200 cm; large, FL ≥ 200 cm.
Disclaimer/Publisher’s Note: The statements, opinions and data contained in all publications are solely those of the individual author(s) and contributor(s) and not of MDPI and/or the editor(s). MDPI and/or the editor(s) disclaim responsibility for any injury to people or property resulting from any ideas, methods, instructions or products referred to in the content.

