Article

Typology of Fishing Grounds for Communal Fisheries Business in Korea: A Statistical Approach

Fisheries Policy Research Department, Korea Maritime Institute, 26 Haeyang-ro, 301 Beon-gil, Yeongdo-gu, Busan 49111, Republic of Korea
*
Author to whom correspondence should be addressed.
Fishes 2025, 10(4), 187; https://doi.org/10.3390/fishes10040187
Submission received: 14 March 2025 / Revised: 13 April 2025 / Accepted: 17 April 2025 / Published: 19 April 2025
(This article belongs to the Section Fishery Economics, Policy, and Management)

Abstract

This study statistically classifies Korea’s communal fishing grounds (Maeul-Eojang) to inform tailored fisheries policy. We applied principal component analysis (PCA) to reduce 17 socio-economic and demographic indicators into five core factors, followed by K-means clustering to derive distinct types. The methodology was validated using Kaiser–Meyer–Olkin and Bartlett’s tests. Five communal fishery types were identified, ranging from well-managed, high-income communities to those in severe decline. The results show that about half of fishing communities fall into a “post-fishery” type with diminishing membership and income, while a quarter maintain robust fisheries through diversification. The typology is compared with previous fishing village classifications, and we discuss policy recommendations for each type—including co-management, tourism support, and targeted aid for declining communities. This research provides an empirical foundation for improving communal fisheries governance and sustaining coastal livelihoods.
Key Contribution: This study provides a comprehensive statistical typology of communal fishing grounds in Korea, identifying five distinct types based on socioeconomic and operational characteristics. The findings offer a data-driven framework for targeted fisheries management policies, ensuring sustainable development and resilience of coastal fishing communities.

1. Introduction

Communal fisheries (Maeul-Eoeop) are a traditional form of community-based fishery in Korea, where a local fishing village cooperative collectively manages and harvests marine resources in an exclusive nearshore area [1,2]. These communal fishing grounds (Maeul-Eojang) form the foundation of coastal fishing communities, both economically and socially [3,4]. In 2021, there were 2044 fishing village cooperatives with 108,754 members managing approximately 3182 licensed communal fishing grounds granted by the government [5,6]. These areas, typically located in tidal flats and coastal bays, serve as critical habitats for shellfish, seaweed, and other sedentary organisms and are managed under exclusive user rights. Annual production from communal fishing grounds is around 60,000 tons of seafood, with an estimated market value of 190 billion KRW, underscoring their role in supporting local economies and food security [3,7].
Despite their importance, communal fisheries in Korea are facing serious challenges. Production has declined from about 100,000 tons in the early 1990s to 60,000 tons in 2021—a reduction of nearly 40% [3]. This decrease threatens the economic base of coastal fishing communities. Additionally, rapid aging and outmigration have reduced the number of active fishers from approximately 250,000 in the early 2000s to fewer than 100,000 today [3,4]. Barriers to cooperative entry, such as high membership fees and strict residency requirements, hinder the inflow of younger generations. As a result, many cooperatives are short of labor and are turning to outsourcing or leasing their fishing grounds—practices that challenge the communal nature of these systems. Furthermore, conflicts with recreational users (e.g., mudflat collectors), marine environmental degradation, and resource depletion have placed additional stress on these already vulnerable communities [3,8,9].
To revitalize these communities, there is increasing emphasis on improving the use and governance of communal fishing grounds. Recent policy dialogues have emphasized the need for a systematic survey and database of communal fisheries, as existing data are fragmented across government statistics and cooperative reports [3,6,7,9]. A typological analysis of communal fishing grounds can illuminate structural diversity and enable tailored policy interventions [1,10].
Several prior studies have attempted to classify fishing village cooperatives using various criteria. The National Federation of Fisheries Cooperatives (NFFC) categorized fishing villages by development level, occupational form, and geographic type through a scoring framework [6]. Choi et al. (2009) identified six types of fishing communities, including experience-tourism-based and declining types, based on socio-economic indicators [11]. Ahn and Lee (2021) extended this work by incorporating variables such as population change, cooperative income, tourism engagement, and resource characteristics to define six further categories, including “self-reliant”, “growth-oriented”, and “vulnerable” types [1].
However, these studies have focused primarily on the fishing village cooperative (Eochongye) as the unit of analysis, rather than the fishing ground itself and often relied on single-year snapshots or qualitative descriptors. Furthermore, they did not fully reflect newer elements of fisheries governance such as environmental stewardship or public interest functions (e.g., marine pest removal, seeding, coastal cleanups) [9,12].
This study addresses these gaps by conducting a statistical typology directly at the communal fishing ground (Maeul-Eojang) level, incorporating multi-dimensional indicators—including demographic structure, production change, cooperative activity, and environmental engagement—based on time-series data from 2015 to 2020 [3,7,9].
The objective of this study is to: 1. Identify and classify distinct types of communal fishing grounds using principal component and cluster analysis; 2. Compare the resulting typologies with those found in prior literature and institutional classifications; and 3. Derive differentiated policy recommendations based on the characteristics of each type [1,9,10,12].
By offering an empirically grounded typology and linking it to policy needs, this research contributes to sustainable fisheries development and the long-term resilience of Korea’s coastal fishing communities [1,2,13].

2. Materials and Methods
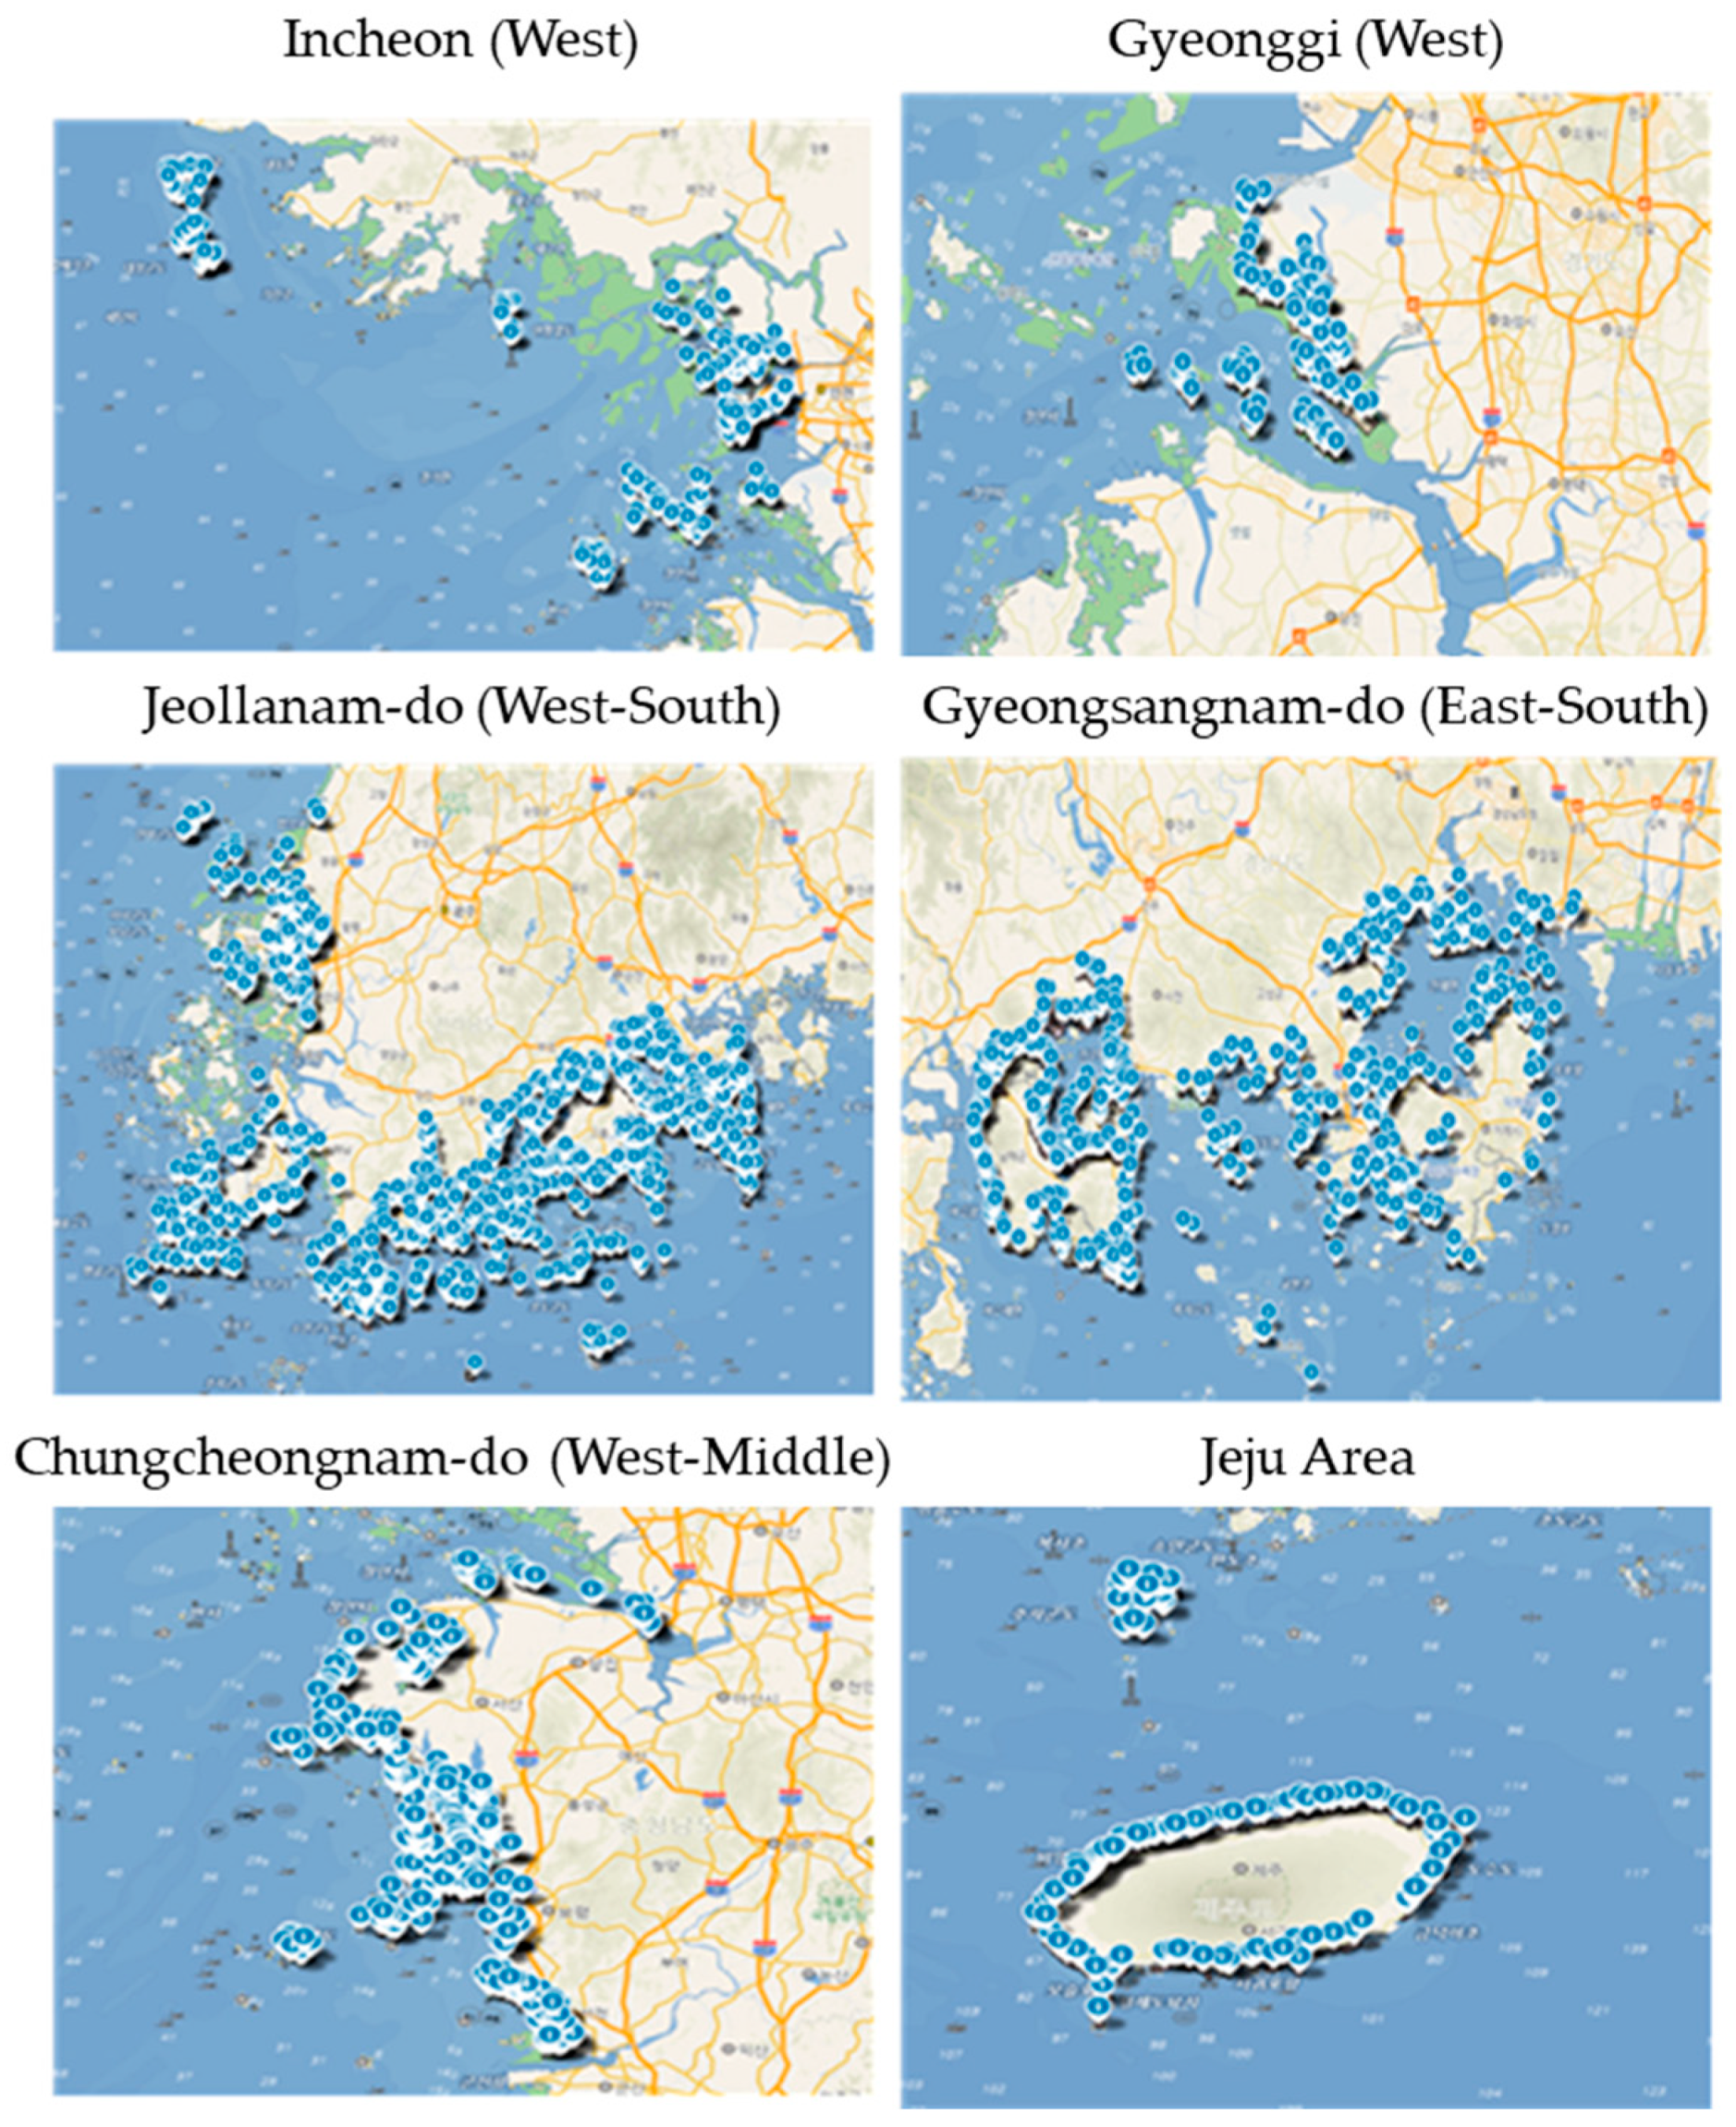
2.1. Study Area

This study encompasses the communal fishing grounds across the entire coastline of South Korea, including the Yellow Sea (west coast), South Sea (southern coast), East Sea (east coast), and Jeju Island [9]. As shown in Figure 1, communal fishing grounds are typically located in nearshore areas adjacent to fishing villages, often within a certain water depth from the shore as defined by law [14,15]. The environmental characteristics vary by region [5]. On the west coast, extensive tidal flats and shallow waters are common; many communal fisheries there focus on shellfish (e.g., clams, cockles) and seaweed (laver), taking advantage of the large tidal ranges. The south coast, with its numerous islands and indented bays, supports diverse communal fisheries, including oyster and seaweed farming, pen shell and abalone gathering, etc. The east coast is steeper with fewer tidal flats, so communal fisheries are fewer in number; those that exist tend to focus on seaweed (kelp, sea mustard) or coastal trap fisheries. Jeju Island’s communal fisheries are unique, as most coastal villages operate communal diving fisheries (led by women divers, Haenyeo) for abalone, sea cucumber, turban shells, and seaweeds—virtually the entire island coastline is partitioned into communal fishing zones [3,9,12]. Overall, nearly all coastal counties have at least one communal fishing ground; only areas occupied by port facilities or public beaches lack them. For the purpose of analysis, each fishing village cooperative holding a communal fishing license is treated as one observation (unit) representing the fishing ground and its managing community. This provides a nationwide coverage of ~2000 units, ensuring that regional diversity is captured in the dataset [3].

2.2. Data Collection and Variable Selection

The empirical analysis for the typology of communal fisheries was conducted in three major steps: data compilation and variable selection; reduction and transformation of variables through statistical analysis; and the derivation of cluster groups based on similarity in the extracted variables. This typological classification process serves as a critical tool for understanding the underlying patterns across communal fisheries, ultimately supporting evidence-based policy interventions tailored to each community type [1].
The primary data source was the “Fishing Village Fraternity Classification and Status” dataset provided by the National Federation of Fisheries Cooperatives (NFFC) for the years 2015 and 2020. This dataset has also been frequently utilized in previous research on communal fisheries typologies and policy design, thus validating its reliability and relevance for the current study [6,10,11].
To enhance analytical focus, the dataset was filtered to include only fishing village cooperatives that held licensed communal fishing grounds. This yielded 1427 valid samples nationwide. By selecting only communities actively operating communal fisheries, we ensured that the typology reflects actual field-level characteristics rather than general coastal settlements [9].
From the dataset, 17 variables were extracted to represent three essential dimensions: (1) Demographic structure, (2) Economic characteristics, and (3) Public-interest engagement. These variables reflect whether a communal fishery is viable in terms of population dynamics, productivity and profitability, and engagement in conservation and community welfare. Both objective administrative data and subjective survey-based scores were used. Variables originally collected on a three-point scale through NFFC field surveys were retained as-is, while others were normalized using a five-point scoring system [3,6,16].
The variable selection and processing followed this rationale:
  • Demographic variables capture the size, age structure, and change dynamics of the cooperative membership and regional population.
  • Economic variables describe the financial condition, resource availability, and production scale of the fishery operation.
  • Public-interest variables assess environmental stewardship and community support activities.
The final variables and their characteristics are shown below (Table 1):
The analytical framework involved performing factor analysis to reduce redundancy and extract composite indicators from the 17 selected variables. These indicators were subsequently used for clustering, thus enabling the identification of statistically meaningful groupings of communal fisheries [13,16].
The overall methodology was structured as follows: First, data were collected from NFFC’s classification reports for the years 2015 and 2020, focusing on key indicators reflecting demographic trends, fishery economics, and public contribution roles. Seventeen quantitative and qualitative indicators were then selected from the original database and scored using a standardized format. Next, principal component analysis (PCA) was conducted to extract core factors that could summarize multidimensional attributes and reduce collinearity across variables. The resulting factor scores were calculated for each cooperative. Finally, cluster analysis was conducted using the factor scores to classify communal fisheries into empirically distinct types. This typological grouping forms the foundation for policy suggestions tailored to the characteristics and development stage of each group [1,3,6,10].
This sequential approach allowed the research to translate complex field data into structured classifications, supporting more precise diagnoses and targeted support strategies for Korea’s communal fisheries sector.

2.3. Statistical Methods

2.3.1. Principal Component Analysis

To reduce the dimensionality of the dataset and identify underlying factors, we performed principal component analysis (PCA) on the 17 standardized variables derived from NFFC’s 2020 and 2015 classification data. Prior to PCA, we verified the suitability of the data using the Kaiser–Meyer–Olkin (KMO) test and Bartlett’s test of sphericity. The overall KMO measure was found to be 0.751, exceeding the threshold of 0.6 for acceptable sampling adequacy. Bartlett’s test was highly significant (χ2 p < 0.001), confirming the data’s suitability for factor analysis [16].
We used PCA with varimax rotation and Kaiser normalization. Five principal components with eigenvalues greater than 1.0 were extracted, explaining a total of 68.4% of the variance. These components were interpreted based on their loading structure and named accordingly:
  • Factor 1: Fishery Management and Eco-Tourism Participation—This factor captures the level of engagement in environmental management programs, such as marine pest removal, fish seeding, coastal clean-up, and community participation in eco-tourism. It reflects proactive stewardship of marine resources linked to tourism-based income diversification.
  • Factor 2: Production and Income Performance—This factor reflects the income-generating performance of fisheries, as measured by average income, income growth rate, production value, and the presence of full-time fishing members. It represents the economic viability of the cooperative.
  • Factor 3: Cooperative Composition and Resource Size—This factor is associated with the structural aspects of a cooperative, such as total membership, proportion of elderly members, village population, and size of fishing ground. It describes the underlying demographic and physical scale of the fishery.
  • Factor 4: Membership Dynamics and Youth Participation—This factor highlights active transitions in community composition, especially the share of younger members and membership growth, indicating generational renewal and organizational vitality.
  • Factor 5: Alternative Economic Foundation—This factor relates to non-fishery income, availability of welfare facilities, and reliance on auxiliary income sources. It reflects the resilience of communities through diversification away from traditional fisheries.
These extracted factors serve as composite indicators, summarizing the characteristics of each fishing community. For each cooperative, we calculated factor scores, which were later used in the cluster analysis (Table 2).

2.3.2. Cluster Analysis

Using the factor scores derived from the PCA, a K-means cluster analysis was conducted to classify communal fisheries into homogeneous types. Preliminary hierarchical clustering and dendrogram inspection supported the selection of five clusters based on interpretability and silhouette analysis (average silhouette coefficient = 0.62) [16,17] (Table 3).
The identified clusters were:
  • Management-Tourism Type—Communities with high participation in fishery resource management and eco-tourism programs. They utilize their ecological engagement to support tourism-based income, balancing conservation with diversification.
  • Self-Reliant Type—These cooperatives are economically robust, with high average income, production, and full-time fisher ratio. Their operations are stable and self-sustaining.
  • Sustainable Type—Communities with strong structural foundations (size and resources), but aging populations. Their sustainability depends on demographic renewal and gradual adaptation.
  • Growth-Oriented Type—Characterized by dynamic changes, including rising youth participation and expanding memberships. These communities show promising growth potential.
  • Post-Fishery (Declining) Type—Cooperatives with weak engagement in fisheries, often relying on non-fishery income. They show signs of industrial and demographic decline.
To verify the validity of the clustering, we conducted an ANOVA test on the factor scores. The analysis confirmed statistically significant differences across all five clusters (p < 0.001) for each factor. The F-statistics for each factor—Fishery Management (21.12), Production-Income (43.87), Composition-Structure (18.44), Demographic Dynamics (39.66), and Alternative Economy (27.53)—demonstrated that the between-cluster variation was much greater than the within-cluster variation. This statistical evidence supports the distinctiveness and interpretability of each cluster type [17,18].
These findings validate the robustness of the five-cluster typology. Each cluster represents a distinct strategy or condition of communal fisheries, providing a solid basis for targeted policy design and localized intervention planning [1,9,18].

3. Results

3.1. Overview of Factor Scores

The PCA yielded five principal components that effectively reduced the dimensionality of the original 17 variables into interpretable latent constructs. Each factor summarized distinct aspects of communal fisheries. Factor 1 captured high loadings for marine pest removal, coastal cleanup, fish seeding, and eco-tourism activities. This reflected a community’s active participation in managing and conserving their fishing grounds while also developing tourism-based alternative income sources. Communities with high scores here were often engaged in co-management programs and experiential tourism, such as mudflat ecotours or seasonal festivals.
Factor 2 reflected the productivity and financial performance of the fisheries. Strongly associated variables included average household income, its growth over five years, production levels, and the proportion of full-time fishers. This factor highlighted economically resilient communities actively engaged in fishery production.
Factor 3 comprised variables related to the structural composition of the cooperatives, such as total membership, population size, elderly population ratio, and fishing ground area. High scores on this factor indicated large, established cooperatives with extensive fishing areas and aging demographics.
Factor 4 emphasized intergenerational renewal and demographic change. It included positive loadings for the proportion of young members (under 50 years) and membership growth rate. Communities scoring high on this factor demonstrated demographic vitality and potential for long-term sustainability.
Factor 5 was oriented around alternative economic foundations, including the presence of welfare facilities and non-fishery income. This included tourism-related income, pensions, or other locally generated revenue not directly tied to fishery activities. Higher scores on this factor were observed in communities that diversified beyond traditional fishing.
The communalities for key variables exceeded 0.70, confirming the strong explanatory power of the retained components. For instance, tourism activity (0.99), average household income (0.86), and cooperative membership (0.74) were all well represented by the extracted factors.

3.2. Cluster Typology of Communal Fisheries

The K-means cluster analysis classified communal fisheries into five statistically and substantively distinct groups, based on the five PCA factor scores. ANOVA results confirmed significant differences in factor means across clusters (p < 0.001 for all five factors), supporting the internal validity of the typology [12,16,18]. While this confirms results reported in Section 2.3, the present section expands on their interpretation.
Each cluster represents a group of fishing communities with similar characteristics across the five PCA factors. The five clusters were interpreted and labeled as follows: Type A—“Management/Experience-Oriented”, Type B—“Fishery Self-Reliant”, Type C—“Sustainable”, Type D—“Growth-Oriented”, and Type E—“Post-fishery (Declining)”. These labels reflect the defining attributes of each group (Table 4).
Cluster Type A: Management/Experience-Oriented—Communities in this cluster have very high scores on the Alternative Economy factor (Factor 5), indicating active involvement in resource enhancement, ecotourism, or educational experiences. They typically run well-organized community-based resource management programs and host many visitors. Their Regional Development (Factor 1) and Fishery Capacity (Factor 2) scores are around average, suggesting moderate size and fishing effort. Income (Factor 3) is not especially high or low. These areas are often known as model cases of co-management or have won awards for community-based tourism.
Cluster Type B: Fishery Self-Reliant—This group features high Fishery Capacity (Factor 2) and large membership (Factor 3), meaning they have relatively large fishing grounds, more boats per capita, and a strong base of full-time fishers. They rely primarily on fishing and aquaculture for income, with less engagement in tourism (Factor 5 is low). Many are traditional fishing villages in remote areas that maintain the classic communal work-and-share system.
Cluster Type C: Sustainable—Communities classified as “sustainable” exhibit balanced characteristics. They score moderately to slightly above average on most factors. Notably, their Income factor is above average, yet their Alternative Economy factor is not as high as Type A, and Fishery Capacity is not as high as Type B. This suggests that Type C villages have found a sustainable equilibrium.
Cluster Type D: Growth-Oriented—This cluster is characterized by very high Regional Change (Factor 4) and above-average Fishery Capacity (Factor 2), combined with high Income (Factor 3). These are communities undergoing rapid growth or development—for example, fishing villages near expanding urban areas or those that have successfully specialized in lucrative aquaculture.
Cluster Type E: Post-fishery (Declining)—This is the largest cluster, comprising about 50% of the communities. Unfortunately, it is defined by negative extremes: significantly below-average scores on Income, Fishery Capacity, and Regional Change. These are the most vulnerable, declining fishing communities, many of which have experienced drastic drops in membership and catches.

3.3. Regional Distribution and Policy Implications

An in-depth analysis of the regional distribution of communal fishery types reveals distinct spatial patterns (Table 5). Most regions, with the exception of major tourism and metropolitan-adjacent areas like Busan, Jeonbuk, Jeju, and Chungcheong, are dominated by the Post-fishery (Declining) type. In Gyeongsangbuk-do and Gyeongsangnam-do, 71.5% and 64.9% of communal fisheries, respectively, fall under the Declining category, indicating a severe risk of community collapse and resource abandonment.
In contrast, Jeju shows a relatively high proportion of Sustainable types (49.0%), while Busan, Jeonnam, Jeonbuk, and Chungcheong regions exhibit stronger representations of the Self-Reliant type. Management/Experience-Oriented communities are most prevalent in Jeonbuk (45.2%), and relatively high proportions (around 20%) are also observed in Gangwon and Jeju.
Growth-Oriented communities remain scarce across all provinces, typically around 10% or lower. Only in select areas, such as parts of Jeonnam, Busan, and Gangwon, does this type reach noticeable proportions. Across most regions, this type remains the least represented, suggesting that proactive policy intervention is necessary to encourage regeneration, attract youth, and promote industrial revitalization in fisheries.
These findings underscore the need for regionally differentiated strategies. Declining communities require targeted revitalization, aging support, and new labor inflows. Self-Reliant types need marketing and logistics infrastructure. Sustainable types offer models for resilience and should be supported to maintain balance. Management/Experience-Oriented and Growth-Oriented types should receive investments in tourism and innovation to reinforce their trajectories. This typology provides a policy-relevant lens to align regional development efforts with the current realities of Korea’s communal fisheries.

4. Discussion

4.1. Tailored Strategies for Communal Fisheries Types

The identification of five distinct communal fishery types enables targeted policy recommendations tailored to the needs and potentials of each category. Each type presents a unique trajectory and challenge, demanding finely tuned interventions:
  • Type A (Management/Experience-Oriented): These communities combine fisheries with tourism and are actively engaged in co-management and environmental stewardship. Policy support should focus on reinforcing their role as regional models of sustainable fisheries. This can be achieved through targeted subsidies for eco-friendly tourism infrastructure, capacity-building programs in marine conservation and tourism operation, and marketing support for branding local experiences. Special attention should be given to avoiding ecological overuse; thus, implementing carrying capacity assessments and rotational resource use systems is essential. Furthermore, these communities can serve as mentors for Type E or Type B communities, sharing best practices through inter-village networks.
  • Type B (Fishery Self-Reliant): Dominated by traditional fishing practices, these villages require enhanced productivity and modernization. Introducing efficient fishing gear and aquaculture systems, supporting product diversification, and facilitating access to urban markets are critical steps. Additionally, technical support in processing, hygiene control, and cold chain logistics should be integrated into cooperative-level interventions. Youth engagement policies are vital—such as subsidies for gear purchase, cooperative membership fees, or housing support—to revitalize the aging workforce and ensure long-term sustainability. Local fisheries management committees could also be strengthened to support knowledge transfer between older and younger generations.
  • Type C (Sustainable): As balanced and stable communities, they act as the backbone of Korea’s coastal fishery economy. Policies here should prioritize long-term stability over rapid transformation. Maintenance grants for physical infrastructure (ports, storage), periodic check-ins on governance, and mild incentives for small-scale innovation projects can prevent stagnation. Caution is needed to prevent complacency; thus, proactive monitoring of demographic and economic signals is recommended to preempt transitions toward decline. These communities should also be included in regional partnership programs to facilitate collaborative problem-solving across similar mid-tier cooperatives.
  • Type D (Growth-Oriented): These are dynamic and potentially scalable communities experiencing demographic renewal and economic expansion. Their development hinges on removing regulatory friction, such as simplifying licensing processes and supporting farm expansion in compliance with environmental rules. Infrastructure investments—including road access, docking facilities, or logistics centers—should be prioritized. Strategic conflict mediation systems are also needed, as internal or external disputes may arise during growth. Finally, these communities are optimal pilot sites for national youth fisher programs and technical R&D dissemination. Additional policy efforts could support business incubators or innovation hubs in such locations to catalyze entrepreneurship.
  • Type E (Post-fishery/Declining): This cluster is at risk of collapse, calling for a dual strategy of recovery and transition. In resource-rich but labor-poor communities, policies could institutionalize collaborative harvesting with neighboring cooperatives or professional divers through lease models. For severely aged communities, phased license retirement, pension schemes, or cooperative consolidation programs may be necessary. Select sites could be designated for ecosystem restoration, with parallel support for eco-tourism conversion. Robust social safety nets, retraining pathways, and targeted youth entrepreneurship grants will be essential to support both exit and renewal. Strategic planning tools such as feasibility assessments and regional transition roadmaps should be developed in conjunction with local governments.
To operationalize these proposals, national and local governments should adopt typology-based planning frameworks. Assigning categories to all cooperatives and tailoring funds accordingly could optimize resource allocation. Additionally, codifying this system within a legal framework—such as a dedicated Village Fishing Grounds Management Act—would provide the structural backing for sustained governance and adaptive planning. In tandem, a centralized data platform regularly updated with socio-economic and environmental metrics would be instrumental for tracking progress and adjusting interventions in real time.

4.2. Limitations and Future Research

This study, while grounded in robust statistical analysis and policy relevance, is not without limitations. First, it utilizes data from a single year (2020), providing only a snapshot of the status of communal fisheries. As such, it does not capture the dynamics of community transition over time. A future study applying time-series or panel data could reveal how and why communities shift between different types—whether toward decline or renewal—and identify the driving forces behind such movements [3,9].
Second, the dataset lacks ecological and environmental indicators, such as fish stock conditions, habitat degradation, or climate vulnerability. These are critical to evaluating the true sustainability and resilience of communal fisheries. Integrating these ecological variables would help differentiate communities not only by social and economic outcomes, but also by environmental performance [2,8].
Third, the analysis did not consider spatial interactions between neighboring communities. In reality, fisheries-related decisions, environmental degradation, and socio-economic trends in one community often influence or spill over into adjacent areas. Future studies should incorporate spatial clustering or geographic modeling approaches to capture such interdependencies [18].
Fourth, intra-cluster variation remains significant. While our statistical method groups communities with similar profiles, it is clear that local governance, community norms, and leadership quality also matter greatly. A complementary qualitative case study approach would help uncover these context-specific differences and deepen our understanding of community resilience mechanisms [1,13].
Fifth, to enhance policy applicability, a diagnostic toolkit or typology-based decision support system should be developed. This might include a scorecard method based on our factor analysis, allowing local governments to self-assess and classify their fishing villages. Such tools can enable early warning of decline, identify areas needing intervention, and highlight emerging best practices [3,16].
Lastly, the Korean communal fisheries system can be compared with similar arrangements globally—such as Japan’s gyogyo-ken system, co-management in the Philippines or Indonesia, or indigenous fishery governance in Oceania. Comparative typology research would enable broader theoretical development and practical knowledge exchange. Such collaboration could lead to a global framework for classifying and managing small-scale, community-based fisheries [2,10].
By addressing these limitations through methodological innovation, richer data collection, and international research cooperation, future studies can offer even more precise and actionable insights for the sustainable governance of communal fisheries.

5. Conclusions

This study provides a comprehensive statistical typology of Korea’s communal fisheries, offering empirical insights into the diverse conditions and trajectories of fishing village cooperatives. Using principal component analysis (PCA) and K-means clustering [15], we identified five distinctive types of communal fishing grounds: (A) Management/Experience-Oriented, (B) Fishery Self-Reliant, (C) Sustainable, (D) Growth-Oriented, and (E) Post-fishery (Declining). This approach employed PCA for data dimensionality reduction and multivariate cluster analysis using SPSS Statistics Version 26.0 and R version 4.2.1 to empirically distinguish fishery community types based on 17 indicators spanning socio-economic, demographic, and environmental domains.
These types, derived through principal component and K-means cluster analysis, span a spectrum of community conditions—from actively managed, tourism-integrated cooperatives to those facing severe demographic and economic decline. This methodological foundation, consistent with established practices in fisheries and community typology research [1,16], ensures that the classification is both statistically robust and policy-relevant. Our analysis reveals that approximately 44% of communal fishing units fall under the Post-fishery (Type E) category, highlighting an urgent need for intervention. In contrast, about 25% of communities (Types A and D) exhibit potential for growth or innovation through tourism or specialized aquaculture, while another 15–20% (Types B and C) maintain relatively stable socio-economic structures based on traditional or balanced fisheries.
This typology not only quantifies patterns suggested in previous qualitative studies—such as those by Choi et al. and Ahn and Lee [1,11]—but also enhances policy relevance by offering an operational framework for differentiated governance. Importantly, it validates earlier categorizations by institutions, such as the National Federation of Fisheries Cooperatives (Suhyup) and academic researchers [1,6], while adding depth through empirical data integration and factor-based clustering. The five-factor model—capturing dimensions such as regional change, income capacity, alternative economy, fishery operations, and demographic structure—provides a nuanced foundation for understanding each community’s strengths and vulnerabilities.
The policy implications of our findings are significant. First, the inadequacy of a “one-size-fits-all” strategy is evident: while tourism and branding support may be effective in Type A, such interventions would likely fail in Type E, where aging and depopulation are the primary constraints. Therefore, we emphasize the need for typology-based policy design, as supported by frameworks advocating differentiated governance approaches in fisheries and rural development policy [3,9,18]. Tailored interventions—ranging from eco-tourism development and infrastructure enhancement (Types A and D), capacity building and market linkage (Type B), to social safety nets and ecological restoration (Type E)—can ensure more efficient and equitable resource allocation.
We also propose institutional innovations to support such approaches. These recommendations are consistent with policy proposals from recent Korean government documents and international best practices calling for tailored legal and administrative systems for community-based fisheries management, including dedicated governance frameworks and performance-based licensing systems [13,17]. These include the development of a specialized legal framework—tentatively titled the “Village Fisheries Management Act”—to codify the roles and responsibilities of communal fishery units, facilitate co-management, and enable resource-sharing or license consolidation where needed. Similar approaches can be observed in international precedents such as Japan’s “Fisheries Cooperative Association Law” and the Philippines’ “Fisheries Code of 1998”, both of which formalize local governance mechanisms and empower community-based management within national legal systems [2,10]. Adopting such a tailored legislative approach in Korea would align the country with the best global practices and strengthen legal clarity and administrative coordination in managing communal fisheries.
Additionally, we recommend establishing a national-level database system for the continuous monitoring of socio-economic and environmental indicators, enabling adaptive management and evidence-based policy adjustment. Specifically, such a system should prioritize indicators across three categories: (1) demographic and workforce indicators (e.g., number of cooperative members, age distribution, and youth participation rates), (2) economic indicators (e.g., seafood production volumes, household income, cooperative revenues, and asset changes), and (3) ecological/environmental metrics (e.g., resource stock status, biodiversity indices, and participation in habitat restoration efforts). This database would build on and standardize datasets, such as Suhyup’s village classification reports, which were a key resource in this study [6,19], and be supplemented by Ministry of Oceans and Fisheries monitoring tools, local surveys, and GIS-linked spatial data where applicable.
From a methodological perspective, this study demonstrates how multivariate statistical techniques—specifically, principal component analysis (PCA) and K-means clustering using SPSS and R software—can be effectively applied to typologically classify small-scale fisheries systems [16]. These tools are widely endorsed in fisheries typology research for their ability to extract latent structures and form statistically meaningful groupings, and their application here has enabled a nuanced understanding of community heterogeneity and resilience dynamics. By translating rich datasets into actionable classifications, we provide a baseline for future research on transitions in community type, infrastructure investment needs, and regional planning frameworks, including labor-force sustainability and spatial policy targeting. As suggested in the limitations section, future work should incorporate time-series data, ecological indicators (such as biodiversity indices and stock-assessment data), and spatial interactions (including geographic clustering and inter-community resource flows) to enrich this typology. Such enhancements would enable dynamic tracking of community transitions over time and provide insights into the mechanisms driving resilience or decline. Methodologies such as panel data regression, spatial autocorrelation modeling, or time-series clustering could be employed to detect temporal shifts and geographic spillovers in communal fishery conditions. Moreover, comparative studies with similar co-managed fisheries abroad—such as Japan’s gyogyo-ken [10] or Southeast Asia’s community-based marine-protected areas—could broaden the theoretical and policy applications of this research.
In conclusion, the typology presented in this study functions as both a diagnostic and a roadmap. It clarifies where Korea’s communal fisheries stand today, and, more importantly, where they could go with appropriate policy guidance. Given that communal fisheries are not just economic assets but also social institutions deeply embedded in local identity and heritage, sustaining them is crucial for the resilience and prosperity of Korea’s coastal communities. Through tailored, data-informed management, the country can chart a path toward inclusive and adaptive governance of its marine commons.

Author Contributions

Conceptualization, J.E.A.; Data curation, J.E.A. and C.M.M.; Formal analysis, J.E.A.; Investigation, J.E.A.; Methodology, J.E.A. and C.M.M.; Supervision, C.M.M.; Writing—original draft, J.E.A.; Writing—review and editing, C.M.M. All authors have read and agreed to the published version of the manuscript.

Funding

This research was funded by the Korea Maritime Institute (Research Report 2023-06).

Institutional Review Board Statement

Not applicable.

Informed Consent Statement

Not applicable.

Data Availability Statement

Data are contained within the article.

Conflicts of Interest

The authors declare no conflicts of interest. The funders had no role in the design of the study; in the collection, analyses, or interpretation of data; in the writing of the manuscript; or in the decision to publish the results.

Abbreviations

The following abbreviations are used in this manuscript:
ANOVAAnalysis of Variance
KMOKaiser–Meyer–Olkin Test
KOSISKorean Statistical Information Service
NFFCNational Federation of Fisheries Cooperatives
PCAPrincipal Component Analysis

References

  1. Ahn, B.C.; Lee, J.S. A Research on Categorizing the Fishing Village Fraternity and Comparing the Characteristics by Type. J. Fish. Bus. Adm. 2021, 52, 83–99. [Google Scholar] [CrossRef]
  2. Ostrom, E. Governing the Commons: Evolution of Institutions for Collective Action; Cambridge University Press: New York, NY, USA, 1990. [Google Scholar]
  3. Kim, S.H.; Kim, B.; Ryu, K.; Jeong, J. Survey on the Status of Communal Fisheries and Institutional Improvement Research; Ministry of Oceans and Fisheries: Sejong, Republic of Korea, 2022. [Google Scholar]
  4. Kwon, H.J. A Study on the Improvement of Fishing Village Management in Gyeongbuk Province; Gyeongbuk Development Institute: Daegu, Republic of Korea, 2017. [Google Scholar]
  5. National Federation of Fisheries Cooperatives. 2022 Survey on the Status of Fishing Village Cooperatives; National Federation of Fisheries Cooperatives: Seoul, Republic of Korea, 2022. [Google Scholar]
  6. National Federation of Fisheries Cooperatives. Fishing Village Fraternity Classification and Status (2010–2020); National Federation of Fisheries Cooperatives: Seoul, Republic of Korea, 2020. [Google Scholar]
  7. Korean Statistical Information Service (KOSIS), Fisheries Statistics. Available online: https://kosis.kr (accessed on 16 April 2023).
  8. Chungcheongnam-do. Potential Evaluation of Blue Carbon in Coastal Areas; Provincial Government Report; Chungcheongnam-do, Republic of Korea, 2018. [Google Scholar]
  9. Ma, C.M.; An, J.E.; Choi, S. A Study on Improving the Use and Management of Fishing Grounds for Communal Fisheries Business; Korea Maritime Institute: Busan, Republic of Korea, 2023. [Google Scholar]
  10. An, J.E.; Park, S.H.; Jung, H.G. A Study on the Emergence of Sustainable Supply Chains and Response Types of Korean Seafood Exporters. J. Korea Trade 2024, 28, 61–82. [Google Scholar] [CrossRef]
  11. Choi, S.R.; Oh, C.R. Economic Valuation of the Ecosystem Services in Seocheon Intertidal Mudflats. Environ. Resour. Econ. Rev. 2018, 27, 233–260. [Google Scholar] [CrossRef]
  12. Ryu, J.G.; Park, S.W.; Ko, D.H.; Yoon, Y.J. Study on the Revitalization of the Social Economy in Fisheries and Fishing Communities; Korea Maritime Institute: Busan, Republic of Korea, 2019. [Google Scholar]
  13. Kang, Y. Formation Process of Self-Governing Institutions in the Common-Pool Resources in Korea: Focus on Self-Management Fishery Policy. J. Gov. Stud. 2016, 22, 101–134. [Google Scholar] [CrossRef]
  14. Ma, C.M.; Lee, C.C.; Jeong, S.B.; Yoon, M.K.; Hwang, S.Y. Roadmap for Sustainable Mudflat Fisheries; Korea Maritime Institute: Busan, Republic of Korea, 2017. [Google Scholar]
  15. National Institute of Maritime Survey. Open Ocean Map. Available online: http://www.khoa.go.kr/oceanmap/main.do (accessed on 11 August 2023).
  16. Song, J.J. Statistical Analysis Methods for Writing Papers with SPSS/AMOS; 21C Books: Seoul, Republic of Korea, 2009. [Google Scholar]
  17. Shin, Y.M.; Jung, K.W. The Significance and Necessity of Reforming the Fishing Rights System as a Fisheries Management Tool. J. Fish. Mar. Sci. Educ. 2021, 33, 144–157. [Google Scholar] [CrossRef]
  18. Kim, J.C.; Lee, C.S. An Analysis of Fisheries Efficiency by Locational Characteristics in Aquaculture-Based Fishing Cooperatives in Goheung-Gun. J. Fish. Bus. Adm. 2021, 52, 23–46. [Google Scholar] [CrossRef]
  19. National Federation of Fisheries Cooperatives. Comprehensive Guide to Fishing Ground Management Regulations; National Federation of Fisheries Cooperatives: Seoul, Republic of Korea, 2008. [Google Scholar]
Figure 1. Locations of licensed communal fishing grounds in major regions.
Fishes 10 00187 g001
Table 1. Variables used for communal fishery typology analysis.
DomainVariableTypeDescription/Calculation Method
Demographic StructureTotal cooperative members (2020)5-pointAbsolute value in 2020
Membership change rate (2015–2020)5-point(2020–2015)/2015
Ratio aged 71+ (2020)5-pointMembers aged 71+/total members
Ratio aged ≤ 50 (2020)5-pointMembers aged ≤ 50/total members
Total village population (2020)5-pointRegional population data from Statistics Korea (KOSIS)
Economic CharacteristicsAvg. household income (2020)5-pointMean income per household
Income growth rate (2015–2020)5-point(2020–2015)/2015
Full-time fisher ratio5-pointFull-time members/total members
Communal fishing ground area5-pointTotal licensed hectares
Dividend per member (2020)5-pointCooperative dividend/member
Total fishery production (2020)5-pointTotal seafood sales (₩)
Eco-tourism activity (2020)3-pointSurvey-based index (cooperative responses)
Non-fishery income (2020)3-pointPresence of non-fishery economic activities
Public InterestFish seeding program participation (2020)3-pointSurvey-based participation score
Marine pest removal activity (2020)3-pointSurvey-based participation score
Coastal cleanup effort (2020)3-pointSurvey-based participation score
Welfare infrastructure presence (2020)3-pointSurvey-based participation score
Note: Analysis of 2020 and 2015 NFFC data and regional statistics.
Table 2. Results of principal component analysis (PCA).
VariableFactor 1 Factor 2 Factor 3Factor 4 Factor 5
Marine pest removal0.7810.039−0.0040.0070.164
Coastal cleanup0.6810.0680.013−0.074−0.041
Fish seeding0.676−0.0370.191−0.102−0.100
Eco-tourism activity0.599−0.0280.0490.0870.004
Avg. income−0.0530.864−0.0020.059−0.126
Income growth rate−0.0340.7930.010−0.1040.003
Production volume 0.1180.6050.1120.3510.053
% aged 71+0.023−0.1370.8040.1570.030
Cooperative members0.0420.0460.7440.476−0.036
Village population0.1920.0220.654−0.068−0.161
Fishery area0.0100.1870.531−0.1770.228
% aged ≤50−0.0870.2410.0660.6560.059
Membership growth rate−0.052−0.113−0.0080.5710.065
Welfare facilities−0.203−0.116−0.087−0.4330.422
Non-fishery income0.2110.048−0.0390.1720.799
% full-time members0.1750.340−0.134−0.007−0.401
Note: PCA with varimax rotation, Kaiser normalization.
Table 3. Cluster analysis results based on factor scores.
Cluster TypeFactor 1 Factor 2 Factor 3Factor 4 Factor 5Count
Management-Tourism2.373.662.021.622.24151
Self-Reliant1.463.811.301.582.05380
Sustainable1.841.982.271.941.63150
Growth-Oriented1.383.751.492.892.04119
Post-Fishery1.541.701.211.592.05627
Table 4. Summary of five cluster types of communal fisheries.
Cluster Type (Label)Proportion of CasesKey Characteristics (Factor Profile)Notable Features and Examples
A. Management/Experience-Oriented~15%F5 (Tourism/Alt. Economy) very high; F1, F2 around avg; F3 avg.Active co-management, tourism, and experience programs; moderate size and income. Example: Coastal village with annual mudflat festival and resource enhancement projects.
B.
Fishery Self-Reliant
~10%F2 (Fishery Cap.) high; F3 slightly high (large membership); F5 low; F3 moderate-low.Traditional fishing-focused communities, many full-time fishers, minimal tourism. Example: Remote island village reliant on seaweed and shellfish harvest for income.
C.
Sustainable
~10–15%Balanced: All factor scores near or slightly above average; F3 (Income) moderately high.Steady communities with diversified but local activities, maintaining stability. Example: Village with small aquaculture, some tourism, stable membership, and income.
D.
Growth-Oriented
~5–10%F4 (Reg. Change) very high; F2 high; F3 high; F1 and F5 variable.Growing communities with new population/economic influx, often near urban areas or specialized in high-value aquaculture. Example: Semi-urban fishing village developing abalone aquaculture park, attracting young workers.
E.
Post-fishery (Declining)
~50%F3 (Income) low; F2 low; F4 low (negative); F5 low; F1 low.Aging, shrinking communities with minimal fishing activity remaining; many members retired or cooperative nearly defunct. Example: Distant island with only elderly fishers, communal tidal flat largely unused or leased out.
Note: Analysis of 2020 and 2015 NFFC data and regional statistics.
Table 5. Regional distribution of communal fishery types.
RegionTotal Cluster 1Cluster 2Cluster 3 Cluster 4Cluster 5
Nationwide1427151380150119627
Gangwon6415200227
Gyeongin5811621119
Gyeongnam39616832416257
Gyeongbuk12312155388
Busan19212122
Jeonnam540471873589182
Jeonbuk311413112
Jeju9620547321
Chungcheong100143916229
Disclaimer/Publisher’s Note: The statements, opinions and data contained in all publications are solely those of the individual author(s) and contributor(s) and not of MDPI and/or the editor(s). MDPI and/or the editor(s) disclaim responsibility for any injury to people or property resulting from any ideas, methods, instructions or products referred to in the content.

