Article

UM-YOLOv10: Underwater Object Detection Algorithm for Marine Environment Based on YOLOv10 Model

1
College of Math and Computer Science, Guangdong Ocean University, Zhanjiang 524091, China
2
College of Electronic and Information Engineering, Guangdong Ocean University, Zhanjiang 524091, China
*
Author to whom correspondence should be addressed.
Fishes 2025, 10(4), 173; https://doi.org/10.3390/fishes10040173
Submission received: 11 March 2025 / Revised: 2 April 2025 / Accepted: 8 April 2025 / Published: 11 April 2025
(This article belongs to the Section Fishery Facilities, Equipment, and Information Technology)

Abstract

:
In order to address the challenges of a low detection accuracy, missed detections, and false detections in marine precious biological target detection within complex marine environments, this paper presents a novel residual attention module called R-AM. This module is integrated into the backbone network of the YOLOv10 model to improve the model’s focus on the detailed features of biological targets during feature extraction. Additionally, the introduction of a bidirectional feature pyramid with adaptive feature fusion in the neck network enhances the integration of semantic information from deep layers, and localization cues from shallow layers improve the model’s ability to distinguish targets from their environments. The experimental data showed that the improved YOLOv10 model achieved 92.89% at mAP@0.5, increasing by 1.31% compared to the original YOLOv10 model. Additionally, the mAP@0.5:0.95 was 77.13%, indicating a 3.71% improvement over the original YOLOv10 model. When compared to the Faster R-CNN, SSD, RetinaNet, YOLOv6, and YOLOv7 models, the enhanced model exhibited increases of 1.5%, 1.7%, 4.06%, 4.7%, and 1.42% in mAP@0.5, respectively. This demonstrates a high detection accuracy and robust stability in complex seabed environments, providing valuable technical support for the scientific management of marine resources in underwater ranches.
Key Contribution: This article proposes a residual attention mechanism module and enhances the YOLOv10 model using this module, resulting in improved model performance.

1. Introduction

Marine ranching refers to the intentional release of economically farmed marine organisms, such as fish, shrimp, shellfish, and algae, into their natural marine ecological environments. This practice can provide humans with a substantial source of high-quality protein, while ensuring the sustainable use of marine resources and promoting ecological balance in marine ecosystems. Object detection algorithms offer distinct advantages in identifying the distribution of underwater resources. These algorithms enable the real-time monitoring of species and quantities of organisms in marine pastures, which is essential for understanding the ecological balance, biodiversity, and resource management. Consequently, they are garnering increasing attention from researchers [1].
The application of object detection algorithms in marine ranch environments encounters a range of unique difficulties and challenges. On the one hand, seawater absorbs and scatters light, leading to reduced visibility. As the depth increases, the light intensity diminishes, and the degree of light attenuation varies across different wavelengths, which impacts image quality. In addition, traditional algorithms typically prioritize selecting candidate regions and then utilize methods such as SIFT [2], HOG [3], and others to search for key points in various scale spaces. By calculating the gradient histogram of local image blocks around the key points to describe their features, this method performs better when there are few candidate regions. When there are numerous candidate regions, the substantial computational workload increases the time complexity, diminishes the network’s feature extraction capability, and ultimately leads to a low detection accuracy. Therefore, it cannot be applied in underwater target detection scenarios of marine ranches that require high real-time accuracy.
Recently, convolutional neural network (CNN) object detection algorithms rooted in deep learning principles have demonstrated exceptional performance and accuracy in detecting objects in complex environments [4]. These algorithms are popularly utilized in various fields such as fisheries, aquaculture, and biometric recognition [5]. CNN-based targeting methods include two-stage and single-stage algorithms. The former first generates candidate target areas and then obtains the final detection results by performing classification and positional regression operations on the generated candidate areas. This approach is distinguished by a high degree of detection accuracy; however, the associated detection speed is notably slower. The Faster R-CNN [6] algorithm can be seen as a representative algorithm. Single-stage algorithms achieve end-to-end target detection by predicting the class and location of the targets directly at various positions and scales in the image. Examples of such algorithms include SSD [7] and the YOLO series [8,9,10], RetinaNet [11]. The single-stage algorithm does not require the generation of candidate regions before performing target classification and position correction operations. This significantly reduces its computational consumption compared to two-stage algorithms, resulting in better real-time performance. It can effectively meet the requirements of underwater target detection scenarios, which has led to increased research interest in the single-stage algorithm. Ge et al. proposed a cost-effective UGV-based inspection platform integrating LiDAR and a monocular camera for structural assessment. Utilizing ROS, the system employs a self-attention-enhanced YOLOv7 for damage segmentation and an improved KISS-ICP for point cloud odometry. Camera–LiDAR fusion enables accurate mapping, localization, and 3D visualization, with experimental results demonstrating its efficiency and robustness [12]. An advanced underwater object detection (UOD) framework based on YOLOv7 has been proposed, optimizing data preprocessing, feature fusion, and the loss function to enhance the accuracy of sonar image detection [13]. Ge et al. enhanced YOLOv10 for underwater object detection by incorporating a dual partial attention mechanism (DPAM), dual adaptive label assignment with sun glint removal (DALSM), and marine fusion loss (MFL). These improvements refined the feature extraction, mitigated sun glint interference, and enhanced bounding box localization, achieving a 3.04% increase in mean Average Precision (mAP) [14]. Wang proposed a LUO-YOLOX model with less parameters than the YOLOX model by incorporating Ghost-CSPDarknet and a simplified PANet, making it suitable for underwater unmanned aerial vehicle equipment. The model achieved an accuracy of 80.9% in the DUO dataset and 80.7% in the URPC2021 dataset [15]. Yi et al. incorporated the SENet, improving the FPN network to improve the YOLOv7 network to enhance the accuracy of detecting tiny objects underwater. This improved model achieved a mAP of 88.29% in the Brackish dataset [16]. Zhang et al. incorporated the BoT3 module into the YOLOv5 model’s neck network to improve its detection capability, resulting in a detection accuracy of 79.8% in the URPC dataset [17]. Liu et al. improved the YOLOv5s model by combining the Transformer self-attention and the coordinate attention mechanisms. This enhancement improved the model’s performance in extracting crucial features of underwater targets, resulting in a final accuracy of 82.9% in the RUIE2020 dataset [18]. Yu et al. constructed a network that integrates cross-transformation and an efficient squeezing excitation module to enhance the YOLOv7 model. They utilized the lightweight CARAFE operator to capture more semantic information. Additionally, they enhanced the model’s resistance to interference in underwater recognition by introducing a three-dimensional attention mechanism. As a result, the model achieved a final detection accuracy of 84.4% [19]. Wang et al. incorporated an attentional mechanism in the YOLOv5 model. This allowed it to prioritize both the prominent features and spatial information of objects, resulting in an improved model detection accuracy of 87.5% in the URPC dataset [20]. Zhao et al. integrated a symmetric feature pyramid attention module into the YOLOv4-tiny model to efficiently merge their features, resulting in a detection accuracy of 87.88% in the Brackish dataset [21]. In summary, current research generally focuses on simple underwater target detection methods. However, for complex and ever-changing underwater environments, the model’s capacity for generalization is inadequate, leaving considerable scope for enhancement in detection accuracy. Due to the influence of underwater optical and physical properties, quality problems such as color aberration, blurriness, and low contrast are common in images taken underwater. The aforementioned issues lead to the lack of complete texture information and distinguishable contour features in the images, which hinders the detection accuracy [22,23,24]. Additionally, marine creatures have slow movement speeds, and their protective colors blend in with the surrounding environment, making detection difficult. In the intricate seabed of marine ranches, the presence of multiple targets obstructing and overlapping each other increases the likelihood of missed and false detections. Therefore, constructing a high-precision underwater target detection model for low-quality images of marine environments and rare objects is a challenge in the industry.
To overcome the obstacles in detecting small underwater targets amidst the complex backgrounds of ocean pastures, this paper employs image enhancement techniques to rectify quality problems like color cast, low contrast, and blurring. A novel residual attention mechanism, which involves both attention to the channel and attention, is proposed to tackle the issues of missed and false detections in object detection algorithms. This approach aims to decrease missed detections and enhance the overall accuracy.
What follows is ann improved method for the underwater detection of marine biological targets to better address the above issues. The method is based on the latest YOLOv10 model; the main work of this study consists of the following:
(1)
Establishing a high-quality underwater biological image dataset after image enhancement;
(2)
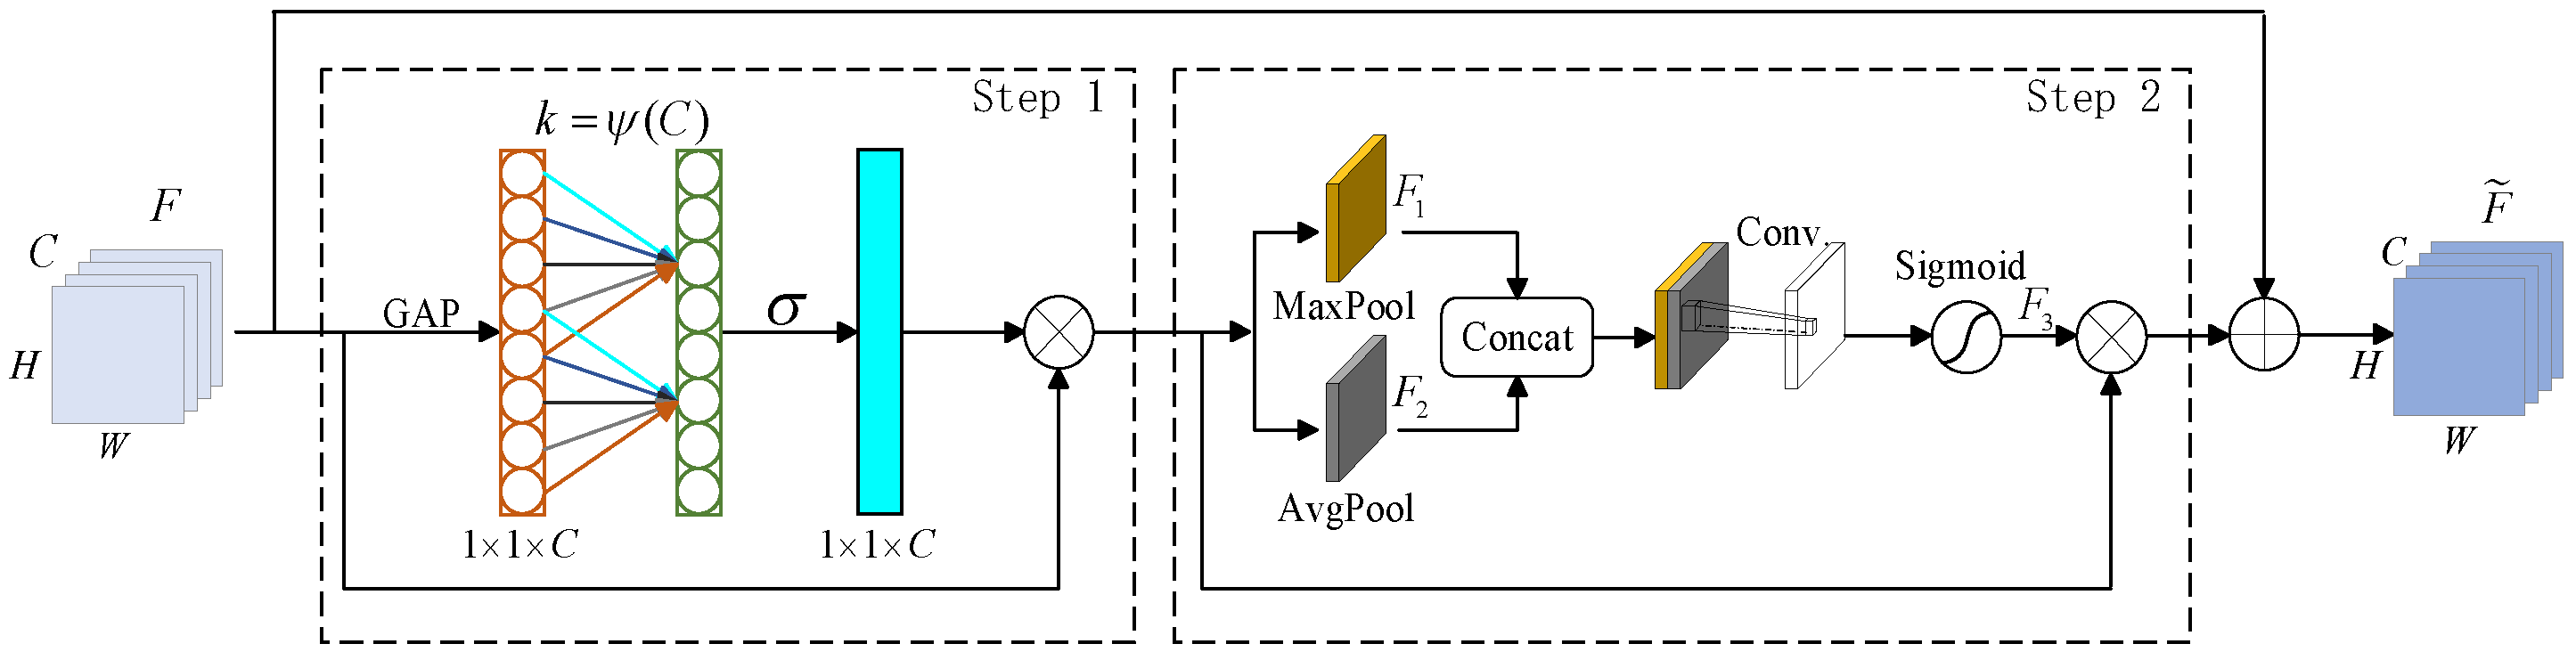
A novel residual attention mechanism module is proposed in this study;
(3)
Improving the YOLOv10 model by integrating an attention mechanism, a bidirectional feature pyramid, and a Focal Loss function;
(4)
The optimized YOLOv10 model is tested and validated against other mainstream target detection models.

2. Materials and Methods

2.1. Materials

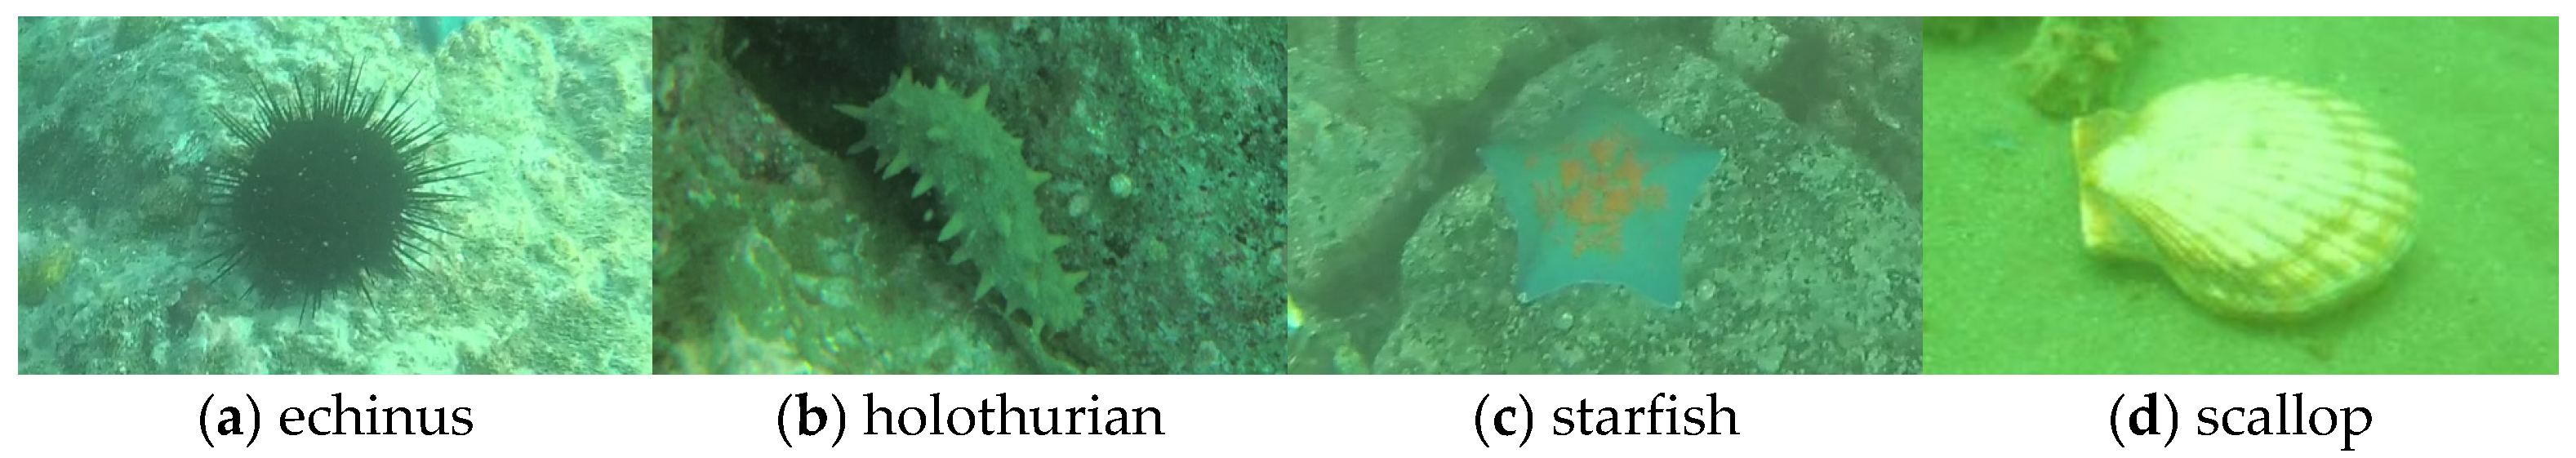
2.1.1. Image Data Source

In this study, the marine biological images are from the dataset of the China Underwater Robot Competition. For research convenience, this article selected a total of 7600 images from four categories of small marine target species, echinus, holothurian, scallop, and starfish, for experiments. Sample images of the dataset are shown in Figure 1.

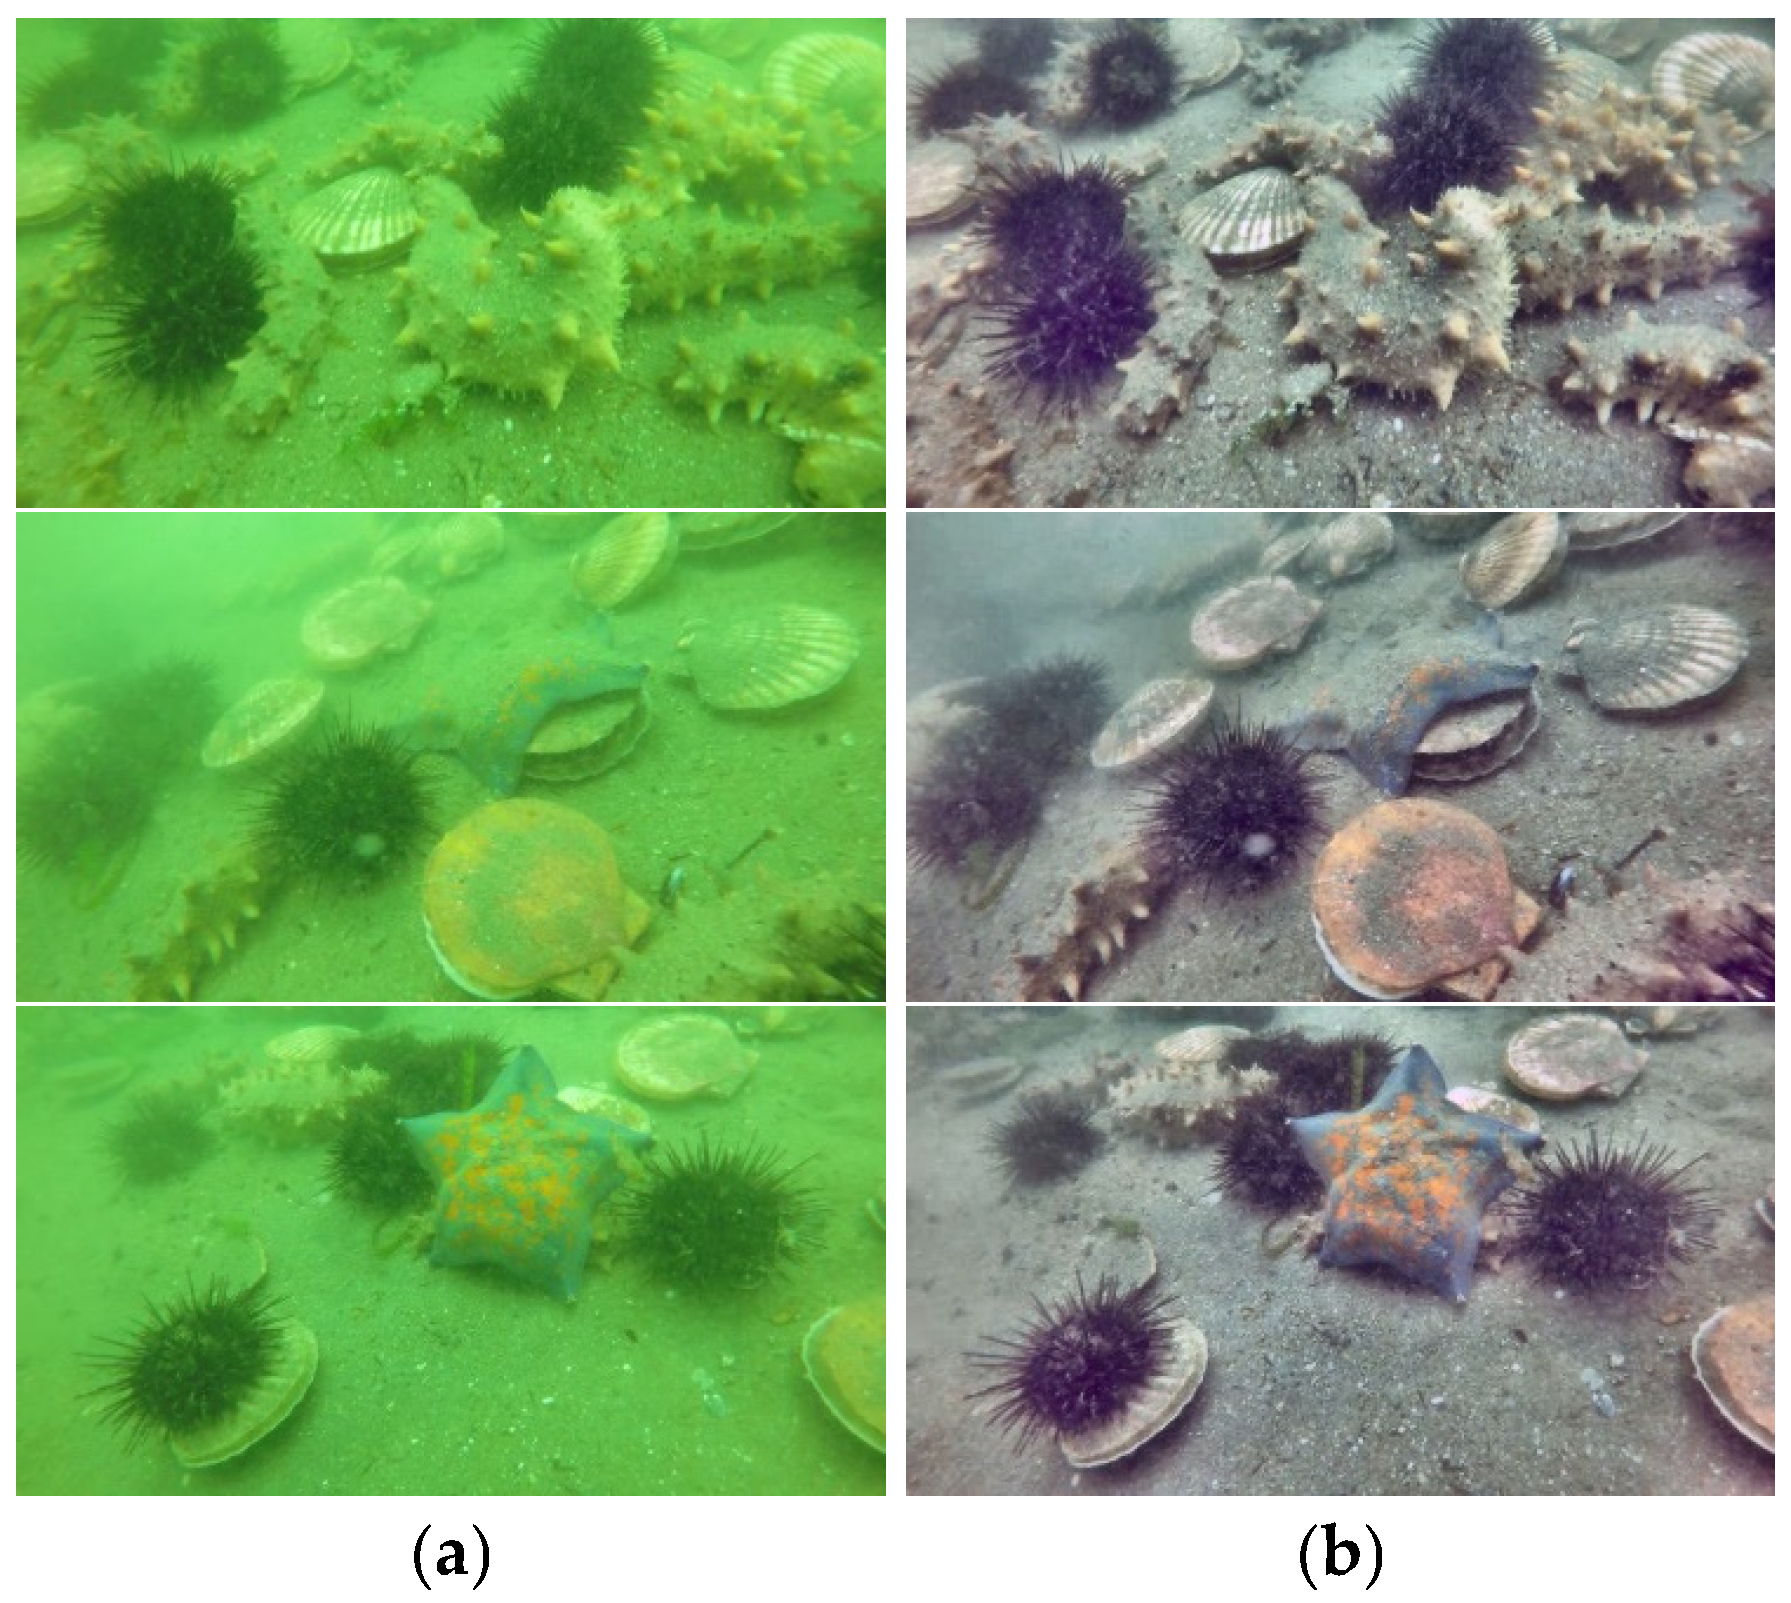
2.1.2. Images Enhancement and Dataset Production

From Figure 1, it is apparent that the images in the dataset face considerable underwater imaging difficulties such as low contrast and color bias. Those with color bias and low contrast problems are improved using the dynamic histogram equalization method, as shown in Formulas (1) and (2).
P D F ( i ) = n i N
C D F ( i ) = m = X 0 i P D F ( m )
where PDF represents the probability density function of the histogram, while CDF represents the cumulative distribution function. Here, i denotes the gray level of a specific sub-histogram within the interval [X0, XL−1], ni represents the pixel number of gray level i (i.e., the frequency of occurrence), while N represents the total quantity of pixels within the specified interval. Formula (2) leads to Formula (3), where XL−1X0 represents the new mapping interval.
G ( i ) = X 0 + ( X L 1 X 0 ) × C D F ( i )
Enhancement images are presented in Figure 2b, while Figure 2a consists of the original images. The enhanced image resolves issues related to color deviation and low contrast, providing a visually enhanced effect and rich detail information. This is beneficial for training the target detection model.
In this study, the enhanced underwater biological image data with image processing are named EUBID, and the original underwater biological images dataset is named OUBID. In a 7:2:1 ratio, the experiment separates the dataset into 3 parts: train (5320 photos), validation (1520 photos), and test (760 photos).

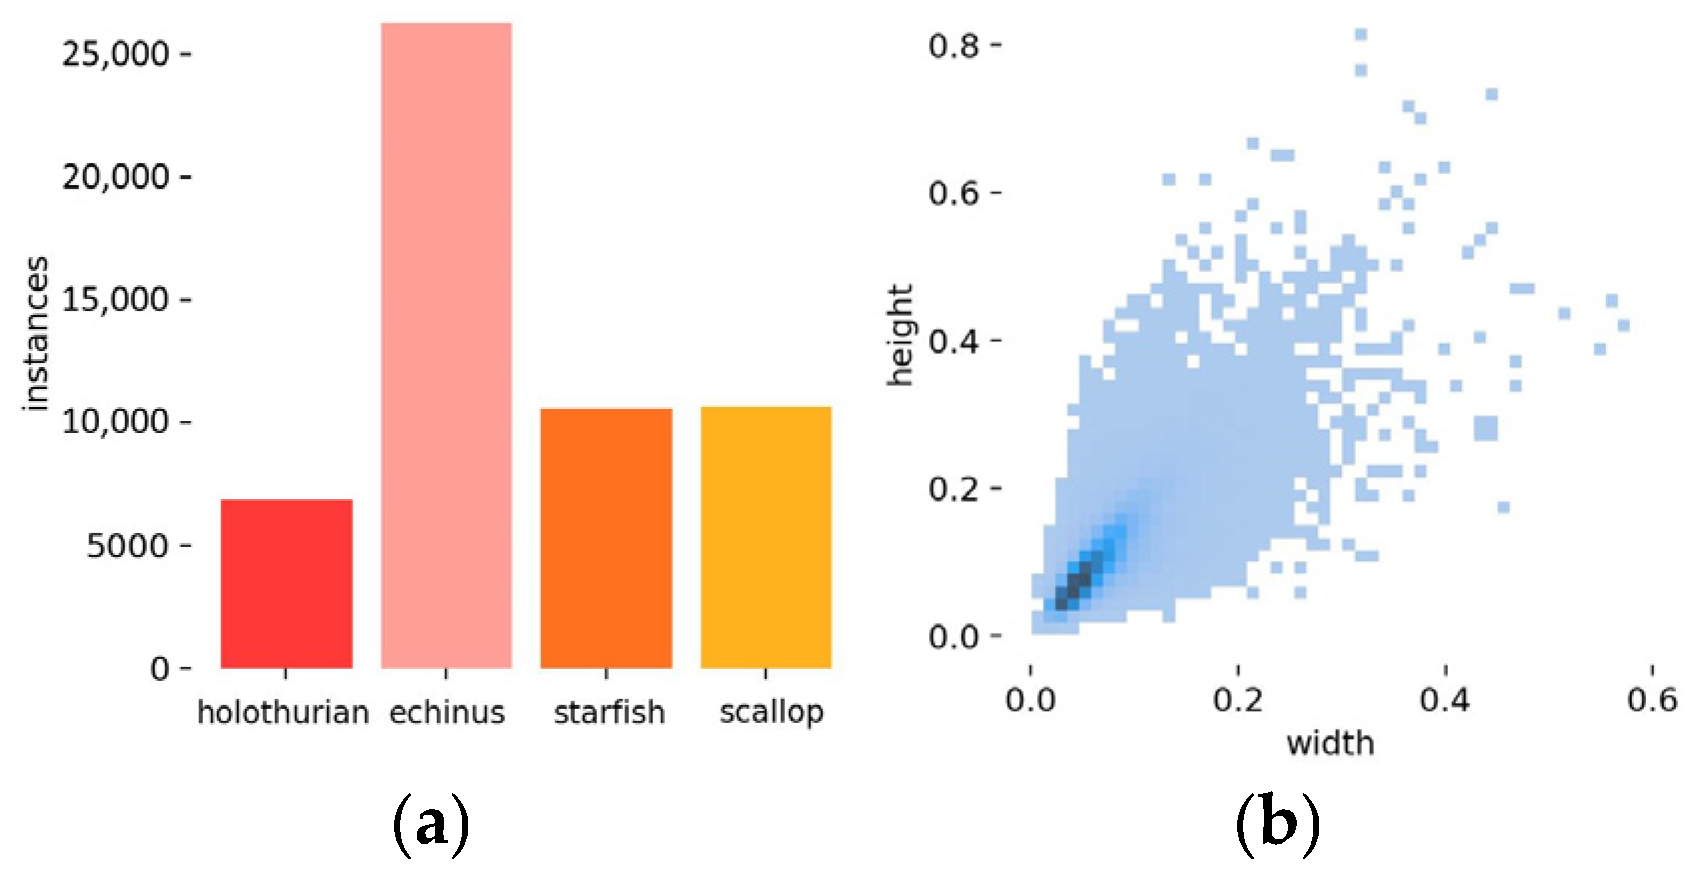
2.1.3. Dataset Statistical Analysis

The results of the EUBID dataset underwent statistical analysis as shown in Figure 3. From Figure 3a, it is apparent that there is a category imbalance issue in the dataset, in which the quantity of echinus-labeled instances is remarkably greater than the other three categories. Object detection often encounters the issue of category imbalance, particularly when certain categories contain significantly more data than others. This disparity can result in a suboptimal detection performance for minority classes. So, utilizing a suitable loss function can reduce the overwhelming influence of the majority class on the loss, thereby enhancing the learning capacity of the minority class. In addition, it is obvious that there are more instances of small targets in the dataset from Figure 3b, which also increases the difficulty of detecting the targets for the model.

2.2. Methods

2.2.1. YOLOv10 Network

The YOLOv10 model is more lightweight, accurate, and faster than the previous YOLO series models, utilizing the Mosaic method [25] to perform a splicing operation on the input image. It also incorporates an adaptive scaling method to increase the background complexity of the image, which helps to prevent overfitting when training. From YOLOv5, the YOLO series has enhanced backbone network feature extraction capabilities by using a C2f module. This modification is inspired by CSPNet [26] to reduce the computational consumption to enhance the operation speed. A major highlight of the YOLOv10 model is its elimination of Non-Maximum Suppression (NMS) during training. Traditional YOLO models utilize NMS to filter overlapping predictions, which can increase inference latency. In contrast, YOLOv10 removes the necessity for NMS by integrating a dual allocation strategy, resulting in a better performance.

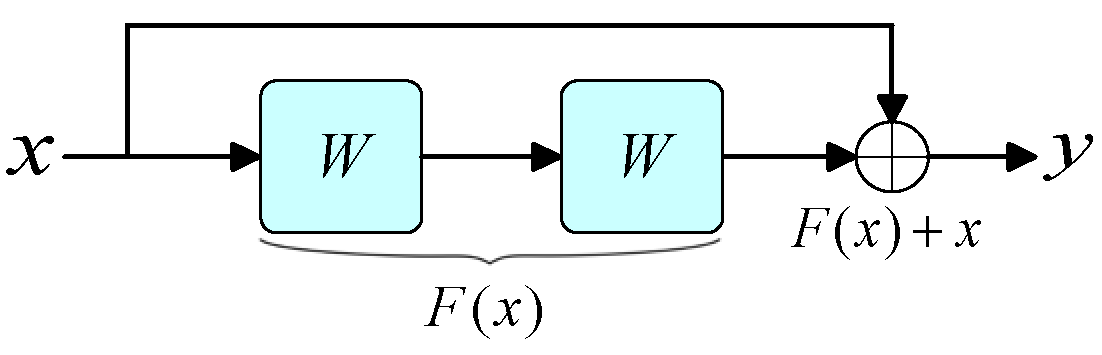
2.2.2. Residual Attention Mechanism

Attention mechanisms are often used to concentrate on specific areas of the image [27] to achieve a better performance. In 2015, Kaiming He and colleagues proposed residual networks [28], as shown in Figure 4.
And the formula is shown in (4), where x represents the input; y represents the output; F(⋅) denotes the residual function; θ(⋅) represents the activation function; and W represents the weights.
y = θ ( F ( x , W ) + x )
A new residual attention mechanism (R-AM), inspired by the basic residual block, was proposed. The R-AM module’s structure is shown in Figure 5, which combines attention in both the spatial and channel dimensions, forming a sequential structure from channels to space.
From the figure, Step 1 use global average pooling to generate channel attention weights through fully connected layers, which are used to enable weighted combinations of different channels in the feature map, which avoids reducing dimensionality, while extracting dependency relationships between channels.
In Step 1, where C covers the quantity of channels, H covers the height, and W covers the width of the input feature map F. GAP represents the global average pooling, and k is the kernel size. σ represents the sigmoid function, as shown in Formula (5), where z denotes the output of the node in the preceding layer. The expression for k is shown in Formula (6), where |d|odd represents the nearest odd distance from d, γ is 2, and b is 1.
σ = f ( z ) = 1 1 + e z
k = ψ ( C ) = log 2 ( C ) γ + b γ o d d
From the figure, Step 2 makes it easier to locate and weight areas of interest on the feature map more precisely, enhancing the accuracy by extracting more discriminative features. Maximum and average pooling are applied to F to gain the F1 and F2 features, respectively. F1 and F2 are subsequently combined and exposed to a convolution operation. The spatial attention weights F3 are obtained by normalizing the features acquired from convolution operations using the sigmoid function. Relevant expressions are shown in Formulas (7)–(10), where Conv(⋅) represents a 2D convolution operation, [,] denotes a Concat operation, and ⊗ signifies element-by-element multiplication.
F 1 = max H , W ( F )
F 2 = 1 H × W i = 1 H j = 1 W F i , j
F 3 = σ ( Conv ( [ F 1 , F 2 ] ) )
F ˜ = F F 3
In the Step 1 stage, R-AM first employs GAP to process the input feature map F along the channel dimension. This process yields the average value for each channel, effectively compressing the input feature map F into a feature map of dimensions 1 × 1 × C. The resulting feature map, after applying a 1D convolution kernel, undergoes a sigmoid activation function to generate normalized channel attention weights. Finally, these attention weights are multiplied with each channel of the original input feature map F to enhance significant feature channels, while suppressing less important ones. In the Step 2 stage, R-AM first applies max pooling and mean pooling to the enhanced features of the feature channels obtained in the Step 1 stage, respectively, to generate two spatial feature maps. It then performs feature fusion. Finally, normalized attention weights are derived using the sigmoid activation function, allowing for the enhancement of important regions and the suppression of irrelevant regions through element-wise multiplication. R-AM enhances the YOLOv10 model’s ability to focus on key information regarding underwater biological targets by employing a serial computation of channel and spatial attention, all while maintaining low computational costs. Unlike ECANet, which concentrates solely on the channel dimension, R-AM also incorporates the spatial dimension. In contrast to SAM, which focuses exclusively on spatial dimensions, R-AM further investigates significant regions within the channel dimension. Additionally, R-AM demonstrates a higher computational efficiency compared to self-attention. Overall, R-AM is a lightweight and effective attention mechanism that significantly improves the model’s feature representation capabilities in this study.

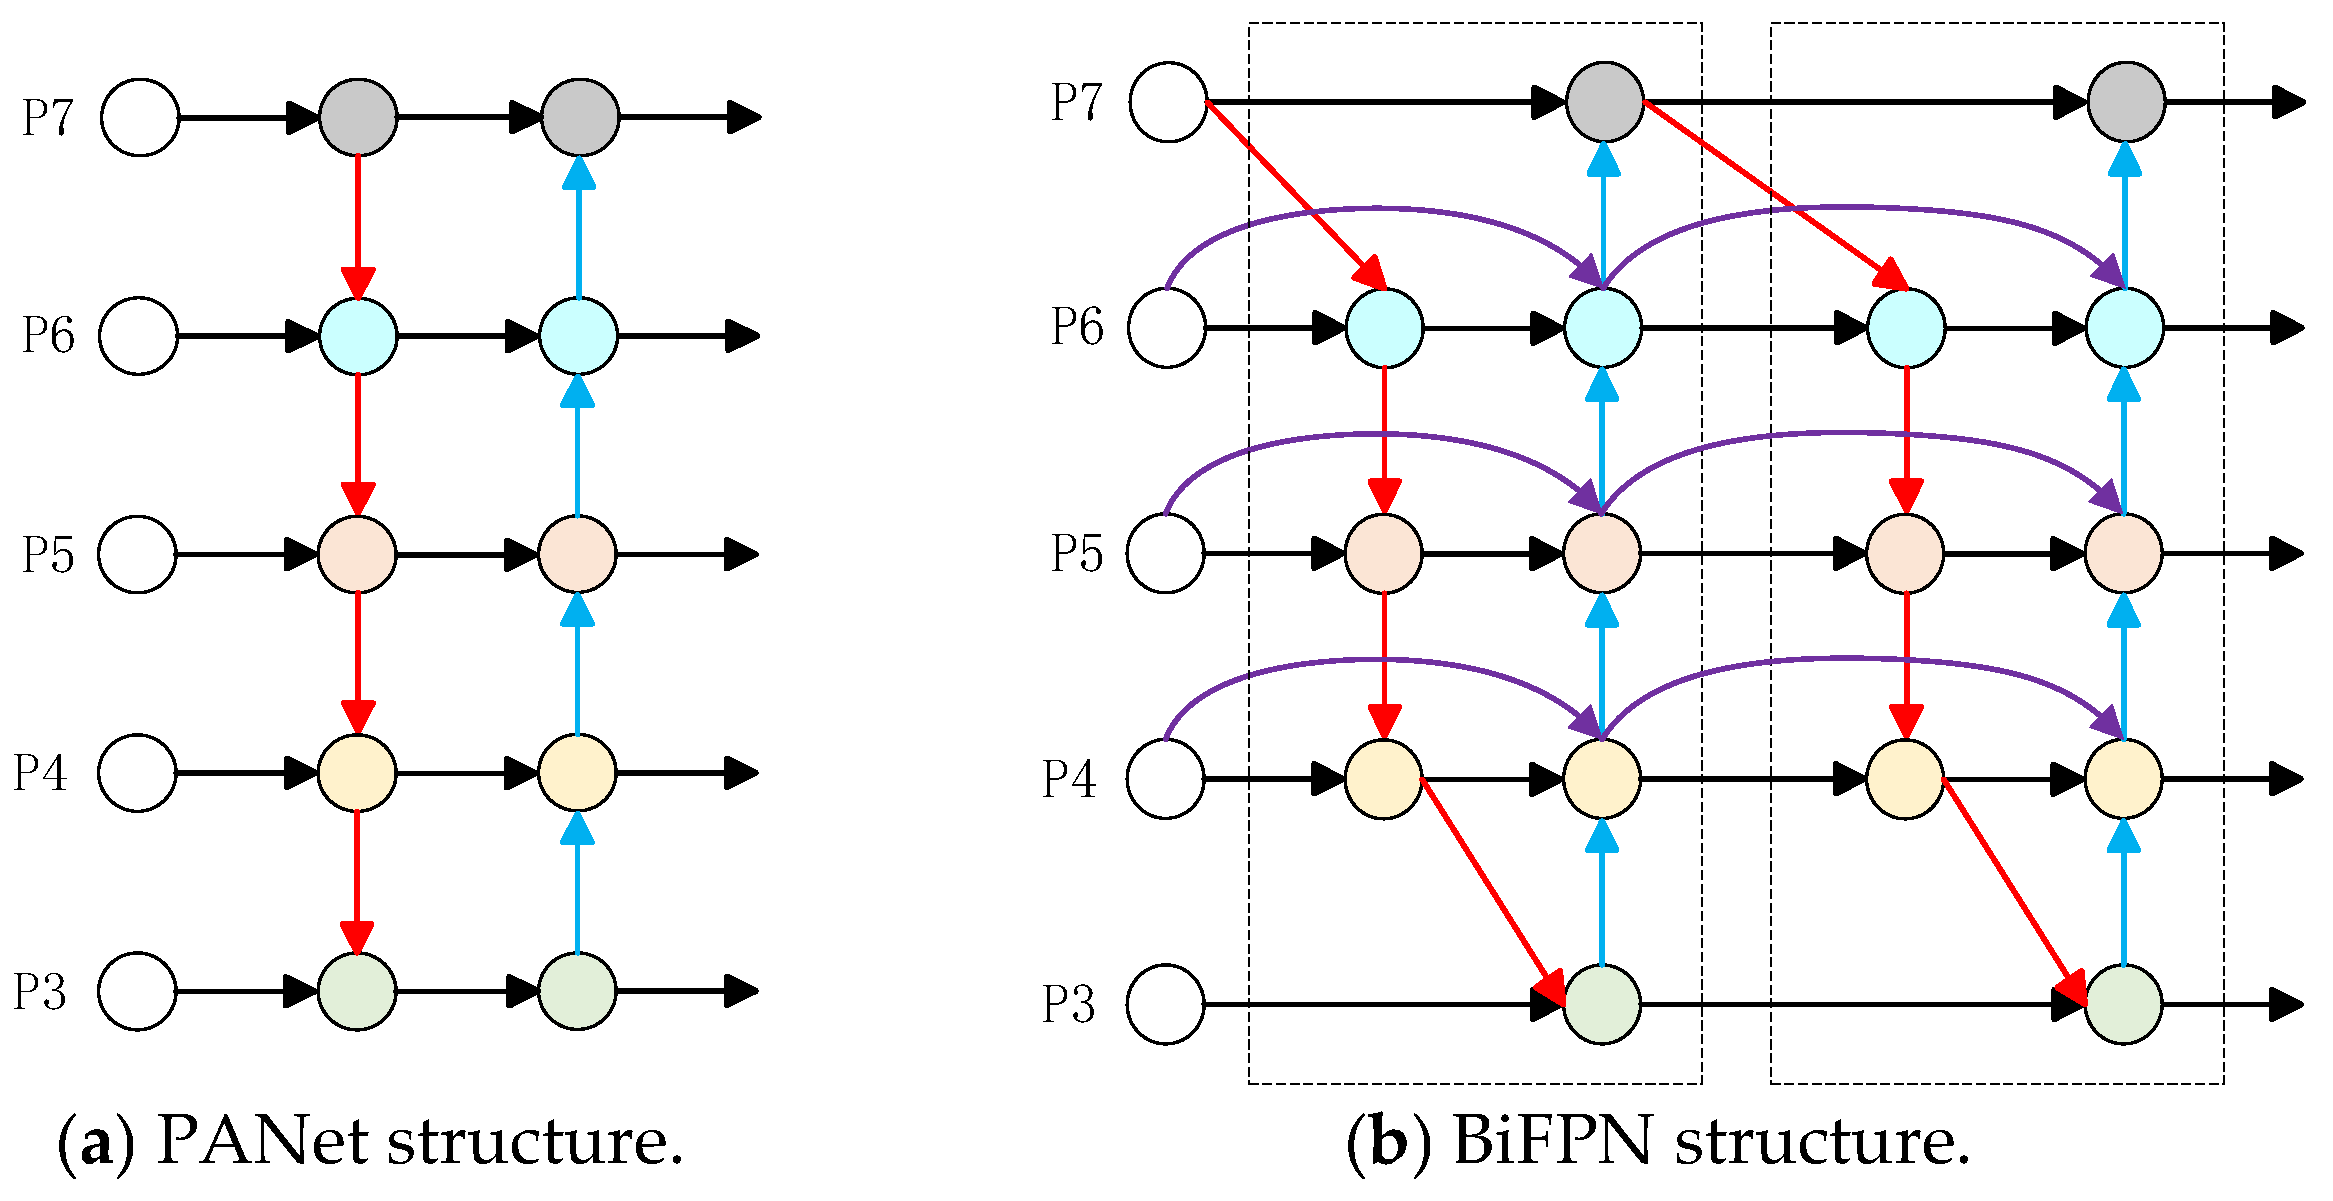
2.2.3. Bidirectional Feature Pyramid Network

The YOLOv10 model generates fused output features by performing upsampling and splicing operations on different features. However, it overlooks the unequal contribution of features at each level to the fused output features. A straightforward and effective bidirectional feature pyramid network (BiFPN) [29], illustrated in Figure 6b, is introduced into the YOLOv10 model to address this issue. And the PANet structure is illustrated in Figure 6a. The BiFPN network applies a bottom-up and top-down bi-directional cross-scale connectivity for improving the quality of multi-scale feature fusion. And it uses horizontal skip connections to connect the original output nodes and input nodes of the same feature. This allows features to be directly transmitted between different levels, preserving semantic information of deep and shallow features more effectively and integrating feature information from different levels without increasing costs.
Specifically, the adaptive feature fusion mechanism of the BiFPN dynamically adjusts the degree of feature fusion across different scales by learning a weighting parameter. In contrast to traditional feature pyramid networks (FPNs), which utilize fixed upsampling and downsampling operations, the BiFPN employs a weighted feature fusion approach. In this method, the feature maps from each layer are weighted and combined during both upsampling and downsampling, with the weights being learned through neural networks. This allows the network to automatically modify the influence of various feature levels based on the specific requirements of the task. The parameter optimization of the BiFPN primarily relies on gradient descent and backpropagation algorithms, which refine the weighted parameters using the loss function derived from the training data. Furthermore, utilizing the BiFPN structure multiple times can lead to a more profound feature fusion.

2.2.4. Focal Loss

The performance of YOLO models is also significantly affected by the loss function. Formula (11) shows the cross-entropy loss function, where p denotes the likelihood of the anticipated category.
L o s s = log p ,   p 0 log ( 1 p ) ,   p < 0
From Formula (11), it can be concluded that the larger the p-value for positive samples, the easier it is to classify it; the smaller the p-value for negative samples, the easier it is to classify it. However, a large quantity of simple samples leads to slow changes in the loss function, making optimization difficult. In addition, the balance of samples also has an obviously impact on the final results of the training model. The loss function tends to favor categories with large sample sizes when the samples are unbalanced, causing the model to pay insufficient attention to categories with small sample sizes. This leads to a model’s deterioration in overall recognition effectiveness. Therefore, the Focal Loss function [11] is utilized to improved model’s identification performance, replacing the cross-entropy loss function, defined as Formulas (12) and (13).
p t = p ,   p 0 1 p ,   p < 0
F o c a l L o s s = α t ( 1 p t ) γ log ( p t )
where αt represents a weighting factor used to keep positive and negative samples in balance; the focusing parameter γ determines the degree of change in the modulation factor (1 − pt)γ. It is hard to categorize samples when pt is a quite small value, and the modulation factor is close to 1 and does not affect the sample’s weights in the loss function. The larger the pt-value and the easier to classify, the modulation factor tends to zero, enhancing the training on samples that are difficult to classify by reducing sample weights in the loss function.

2.2.5. The Proposed Model

The underwater environment is often extremely complex; underwater target detection faces challenges such as the target object’s similarity to the environmental background and the visual distortion caused by the target’s distance, making it difficult to detect. To solve the aforementioned issues, an improved YOLOv10 model was proposed. The process is illustrated in Figure 7.
The optimized YOLOv10 model is indicated in Figure 8.

2.3. Experimental Environment Resource Configuration

This study utilizes devices on the AutoDL cloud server, with the parameters configured as shown in Table 1. The initial learning rate is 0.001, the number of training rounds (epochs) is 200, batch size is 64, and the training is carried out by the stochastic gradient descent method.

3. Results

3.1. Ablation Experiment

To assess how each of the study’s enhanced sections contributed to the improvement in model performance, the original YOLOv10 model was used as a baseline model. The evaluation metrics included mAP@0.5, mAP@0.5:0.95, P, R, and F1 scores. The ablation experiments used the EUBID dataset. The results are indicated in Table 2, where A represents the baseline model, B represents the R-AM module, C represents the BiFPN, and D represents Focal Loss.
From Table 2, the improved YOLOv10 model’s mAP@0.5 value increased from 91.58% to 92.89%, representing a 1.31 percentage point improvement; the mAP@0.5:0.95 increased from 73.42% to 77.13%, showing a 3.71 percentage point increase; the p value increased by 2.69%; the R value increased by 1.27%; and the F1-score increased by 1.95.
Figure 9 shows the visualizing process of training the optimized YOLOv10 model.
From Figure 9, it can be observed that the precision and recall curves gradually flatten out after 50 training epochs and reach a converged state. Both training and validation loss curves converge quickly and without significant fluctuations, indicating that the optimized model is neither overfitted nor underfitted while training. The detection accuracy metrics, specifically the curves of the mAP, quickly stabilize without obvious fluctuations, reaching a stable state after 100 training epochs. This suggests that the optimized model demonstrates strong robustness and learning capabilities.

3.2. The Impact of Image Enhancement on Model Performance

Comparative experiments were conducted on the OUBID and EUBID datasets. From Table 3, the YOLOv10 model performs better on the EUBID dataset, both before and after model optimization. The original YOLOv10 model’s mAP@0.5 improved by 0.84%, and the optimized model improved by 0.99%, indicating that the model training and learning were good with the EUBID dataset. The primary reason is that underwater images can be enhanced to improve their image quality. This enhancement addresses issues such as insufficient lighting, color cast, and low contrast, making the target clearer in a way that is beneficial for model detection.

3.3. The Impact of Different Attention Mechanisms

Different attention mechanisms were incorporated into the YOLOv10 model’s backbone network to conduct comparative experiments. Table 4 shows the model’s performance by adding ECANet, SAM, and R-AM attention mechanism modules, respectively. The results indicate that the R-AM module has the best performance improvement for the model. The mAP@0.5 has a 0.56 percentage point increase, the mAP@0.5:0.95 has a 1.51 percentage point increase, the p-value has a 0.57% increase, and the F1-score increased by 0.52. Furthermore, from Table 2, it is obvious that the incorporation of the R-AM module into the YOLOv10 model, which has been optimized by the BiFPN network and Focal Loss function, has resulted in a 0.46% increase at mAP@0.5, and the mAP@0.5:0.95 has a 1.35% increase. By comparing the results, it has been proven that the R-AM module proposed for improving the model’s detection performance is effective.

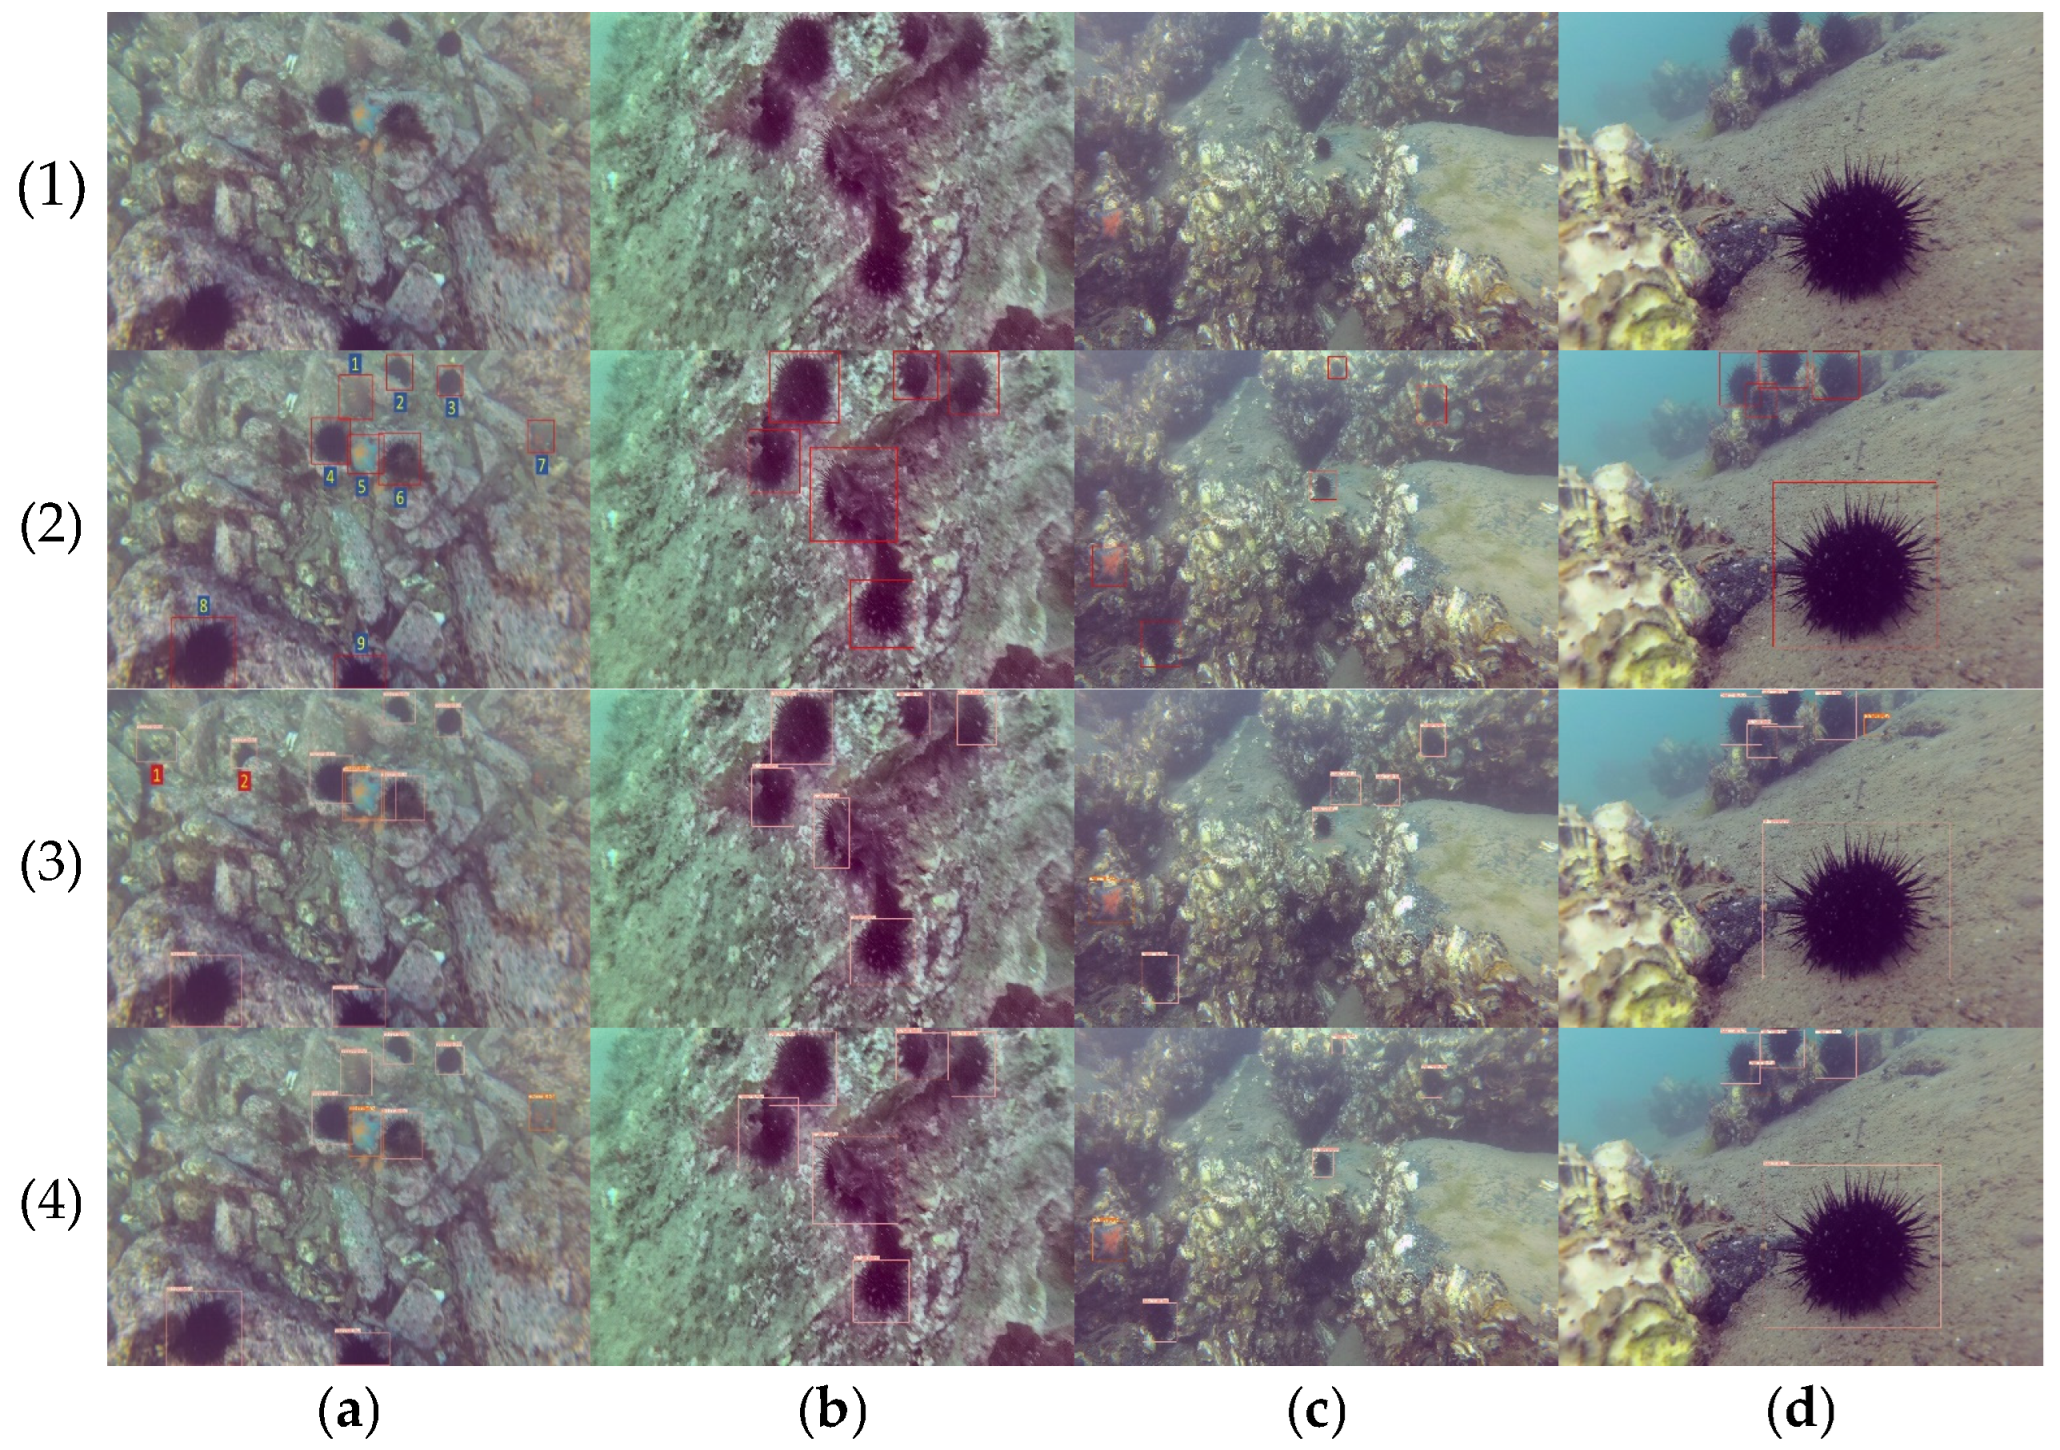
3.4. Comparison of Model Detection Effects

A comparison of the actual detection results on the EUBID dataset is shown in Figure 10, where (1) represents the input image, (2) represents the real labeled data, (3) represents the original YOLOv10 model detection result, and (4) represents the improved YOLOv10 model detection result. From Figure 10(a2), it is evident that targets 1 and 7 share similar colors with the background, which complicates detection. The unoptimized YOLOv10 model failed to detect these two targets; however, the optimized YOLOv10 model successfully identifies targets 1 and 7. This improvement indicates that the optimized model possesses a superior ability to differentiate target objects from the background environment compared to the original model. From Figure 10(a4), it is obvious that the optimized YOLOv10 model did not exhibit any missed or false detections, proving the effectiveness of the model optimization methods. Additionally, from Figure 10(a3), the original YOLOv10 model incorrectly identifies targets 1 and 2. This indicates that the original model failed to extract sufficient key features, leading to the misidentification of black blocks and stones with contour edges as sea urchins. In contrast, the optimized model successfully avoided this issue. More comparison images are also shown in Figure 10.
In order to more precisely demonstrate the accuracy of the optimized model in locating the target object and the attention paid to the feature extraction of the target object, the feature mapping is shown in Figure 11, where (1) represents the input image, (2) represents the real labeled data, (3) represents the heat map of the original YOLOv10 model, and (4) represents the heat map of the improved YOLOv10 model. From Figure 11(a3), the original YOLOv10 model is susceptible to the influence of environmental background when extracting features, leading to a diminished focus on the target object. However, the improved model is less susceptible to environmental background interference, and its focus on the target object is more concentrated and pure, as shown in Figure 11(a4). More comparison images are also shown in Figure 11.
In order to further evaluate the detection performance of the improved model in underwater environments, this study conducted tests using data collected under various underwater conditions. The results are presented in Figure 12, where (a) represents the lighting, (b) represents the depth, and (c) represents the turbidity. From the experimental results under various underwater conditions presented in Figure 12, it is evident that the improved model discussed in this paper demonstrates excellent detection performance. It can accurately identify target organisms across different lighting, depth, and turbidity conditions. Additionally, as shown in column (c), the model also performs well in detecting dense targets.

3.5. Comparison with Different Models

The optimized YOLOv10 model is compared with the mainstream target detection models Faster R-CNN, SSD, RetinaNet, YOLOv6, and YOLOv7 for experiments on the same device as well as the same dataset; the experimental results on the EUBID dataset are shown in Table 5. From the data presented in the table, it is clear that our method, referred to multiple key indicators, demonstrates a superior performance. Specifically, our method achieves an mAP@0.5 of 92.89%, a precision of 94.26%, a recall of 90.66%, and an F1-score of 92.42, all of which surpass the performance of the other models, indicating enhanced detection capabilities. Additionally, our method exhibits commendable performance in terms of FPS, achieving a rate of 63.8, which ranks just behind YOLOv10, which reaches 67.4 FPS, thereby underscoring its rapid inference speed. Furthermore, our method has a parameter size of only 8.8 M, significantly smaller than Faster R-CNN (102.5 M) and SSD (34.1 M), and is also more efficient than RetinaNet (19.8 M) and YOLOv6 (15.0 M), highlighting its high model efficiency. Consequently, our method strikes an optimal balance between model compactness and inference speed, while maintaining a high accuracy, establishing it as a well-rounded object detection model.
The mAP curves and loss curves of different target detection models during training are shown in Figure 13.
Table 5 and Figure 13 demonstrate that the optimized YOLOv10 model outperforms the compared models with regard to detection accuracy and the time required to reach a steady state during the training process, showcasing its sophistication and robustness.

4. Discussion

This study improves the YOLOv10 model by incorporating the R-AM module, BiFPN network, and Focal Loss function, resulting in a better detection performance for identifying underwater biological targets. Embedding the R-AM module in the YOLOv10 model enables efficient local communication through one-dimensional convolution, preventing the reduction of data dimensionality and efficiently gathering information about cross-channel interactions of underwater biological image features. On the other hand, it can more accurately locate the regions of interest in the feature map, which helps the model extract target features in complex environmental backgrounds. Integrating the BiFPN network into the YOLOv10 model weights and fuses feature information from various levels, emphasizing the crucial features and enhancing the model’s localization capability. In addition, the original YOLOv10 model tended to focus more on categories with a higher number of annotated instances, while neglecting other categories. However, the enhanced YOLOv10 model demonstrates a more balanced attention to all categories in the dataset, indicating that the Focal Loss function effectively mitigates class imbalance and boosts the model’s detection accuracy.
This study utilizes traditional image processing methods to improve the dataset’s image. Although the method is simple and fast, the improvement in image quality is limited. The next step is to use deep learning methods, such as adversarial generative networks, to enhance the images in the dataset and obtain higher-quality image data. While our model demonstrates strong performance in moderate turbidity levels, its accuracy diminishes in extremely murky water where visibility is nearly zero. In such cases, even high-quality optical methods encounter difficulties, indicating the necessity for multi-modal approaches, such as sonar or acoustic imaging, to enhance vision-based detection. Our model may struggle to detect very small or fast-moving marine organisms, particularly in high-resolution video streams. Motion blur and limitations in spatial resolution can impact detection accuracy. Improving temporal modeling, such as by incorporating optical flow-based motion estimation, could enhance performance in future iterations. It can also be integrated with underwater sensing technology, such as environmental sensors that measure temperature, salinity, turbidity, and dissolved oxygen. These sensors can be utilized to identify areas of biological activity and enhance the spatial prioritization of target detection. In addition, the optimized model has ab improved detection performance. However, it has increased the number of parameters and complexity by integrating various modules, which is not conducive to deployment on small terminal devices like underwater robots. Therefore, the team’s future work will focus on exploring lightweight processing techniques, such as pruning and distillation, for the model.

5. Conclusions

In order to improve the accuracy of underwater biological target detection and minimize false positives and missed detections, an improved YOLOv10-based model for underwater biological target detection was proposed in this study. Incorporating the R-AM module into the YOLOv10 model to pay more attention to the key features of the target object during feature extraction, the BiFPN network is introduced to execute effective fusion operations on the extracted features, and the Focal Loss function is utilized to mitigate the adverse effects of class imbalance. The results from experiments demonstrate that the improved YOLOv10 model effectively mitigates issues related to missed and false detections, enhances the accuracy of detecting underwater targets, and it meets technical requirements in the field of marine ranch biometric identification. This lays a theoretical foundation for smart marine ranch engineering.

Author Contributions

Conceptualization, J.W.; methodology, R.M.; software, R.M.; validation, J.W.; writing—original draft preparation, R.M.; writing—review and editing, J.W.; visualization, R.M.; funding acquisition, J.W. All authors have read and agreed to the published version of the manuscript.

Funding

This research was funded by the New Generation Information Technology Special Project in Key Fields of Ordinary Universities in Guangdong Province, grant number 2020ZDZX3008.

Institutional Review Board Statement

Not applicable.

Informed Consent Statement

Not applicable.

Data Availability Statement

The raw data supporting the conclusions of this article will be made available by the authors on request.

Conflicts of Interest

The authors declare that they have no known competing financial interests or personal relationships that could have appeared to influence the work reported in this paper.

Abbreviations

The following abbreviations are used in this manuscript:
UM-YOLOv10An underwater object detection algorithm for marine environment based on the YOLOv10 model
R-AMResidual attention module
BiFPNBidirectional feature pyramid network

References

  1. Lee, M.F.R.; Chen, Y.C. Artificial intelligence based object detection and tracking for a small underwater robot. Processes 2023, 11, 312. [Google Scholar] [CrossRef]
  2. Low, D.G. Distinctive image features from scale-invariant keypoints. J. Comput. Vis. 2004, 60, 91–110. [Google Scholar] [CrossRef]
  3. Dalal, N.; Triggs, B. Histograms of oriented gradients for human detection. In Proceedings of the Computer Vision and Pattern Recognition, (CVPR’05), San Diego, CA, USA, 20–26 June 2005; Volume 1, pp. 886–893. [Google Scholar] [CrossRef]
  4. Liu, H.; Ma, X.; Yu, Y.; Wang, L.; Hao, L. Application of deep learning-based object detection techniques in fish aquaculture: A review. J. Mar. Sci. Eng. 2023, 11, 867. [Google Scholar] [CrossRef]
  5. Wang, N.; Chen, T.; Liu, S.; Wang, R.; Karimi, H.R.; Lin, Y. Deep learning-based visual detection of marine organisms: A survey. Neurocomputing 2023, 532, 1–32. [Google Scholar] [CrossRef]
  6. Ren, S.; He, K.; Girshick, R.; Sun, J. Faster R-CNN: Towards real-time object detection with region proposal networks. IEEE Trans. Pattern Anal. Mach. Intell. 2016, 39, 1137–1149. [Google Scholar] [CrossRef]
  7. Liu, W.; Anguelov, D.; Erhan, D.; Szegedy, C.; Reed, S.; Fu, C.Y.; Berg, A.C. Ssd: Single shot multibox detector. In Proceedings of the Computer Vision–ECCV 2016: 14th European Conference, Amsterdam, The Netherlands, 11–14 October 2016; Proceedings 2016, Part I 14. pp. 21–37. [Google Scholar] [CrossRef]
  8. Li, C.; Li, L.; Jiang, H.; Weng, K.; Geng, Y.; Li, L.; Ke, Z.; Li, Q.; Cheng, M.; Nie, W. YOLOv6: A single-stage object detection framework for industrial applications. arXiv 2022, arXiv:2209.02976. [Google Scholar] [CrossRef]
  9. Wang, C.Y.; Bochkovskiy, A.; Liao, H.Y.M. YOLOv7: Trainable bag-of-freebies sets new state-of-the-art for real-time object detectors. In Proceedings of the IEEE/CVF Conference on Computer Vision and Pattern Recognition, Vancouver, BC, Canada, 17–24 June 2023; pp. 7464–7475. [Google Scholar] [CrossRef]
  10. Wang, A.; Chen, H.; Liu, L.; Chen, K.; Lin, Z.; Han, J.; Ding, G. Yolov10: Real-time end-to-end object detection. Adv. Neural Inf. Process. Syst. 2024, 37, 107984–108011. [Google Scholar]
  11. Ross, T.Y.; Dollár, G.K.H.P. Focal loss for dense object detection. In Proceedings of the IEEE Conference on Computer Vision and Pattern Recognition, Venice, Italy, 22–29 October 2017; pp. 2980–2988. [Google Scholar] [CrossRef]
  12. Ge, L.; Sadhu, A. Deep learning-enhanced smart ground robotic system for automated structural damage inspection and mapping. Autom. Constr. 2025, 170, 105951. [Google Scholar] [CrossRef]
  13. Ge, L.; Singh, P.; Sadhu, A. Advanced deep learning framework for underwater object detection with multibeam forward-looking sonar. Struct. Health Monit. 2024. [Google Scholar] [CrossRef]
  14. Sriram, S.; Aburvan, P.; Kaarthic, T.A.; Nivethitha, V.; Thangavel, M. Enhanced YOLOv10 Framework Featuring DPAM and DALSM for Real-Time Underwater Object Detection. IEEE Access 2025, 13, 8691–8708. [Google Scholar] [CrossRef]
  15. Wang, Z.; Chen, H.; Qin, H.; Chen, Q. Self-supervised pre-training joint framework: Assisting lightweight detection network for underwater object detection. J. Mar. Sci. Eng. 2023, 11, 604. [Google Scholar] [CrossRef]
  16. Yi, W.; Wang, B. Research on Underwater small target Detection Algorithm based on improved YOLOv7. IEEE Access 2023, 11, 66818–66827. [Google Scholar] [CrossRef]
  17. Zhang, J.; Zhang, J.; Zhou, K.; Zhang, Y.; Chen, H.; Yan, X. An improved YOLOv5-based underwater object-detection framework. Sensors 2023, 23, 3693. [Google Scholar] [CrossRef] [PubMed]
  18. Liu, K.; Peng, L.; Tang, S. Underwater object detection using TC-YOLO with attention mechanisms. Sensors 2023, 23, 2567. [Google Scholar] [CrossRef]
  19. Yu, G.; Cai, R.; Su, J.; Hou, M.; Deng, R. U-YOLOv7: A network for underwater organism detection. Ecol. Inform. 2023, 75, 102108. [Google Scholar] [CrossRef]
  20. Wang, X.; Xue, G.; Huang, S.; Liu, Y. Underwater object detection algorithm based on adding channel and spatial fusion attention mechanism. J. Mar. Sci. Eng. 2023, 11, 1116. [Google Scholar] [CrossRef]
  21. Zhao, S.; Zheng, J.; Sun, S.; Zhang, L. An improved YOLO algorithm for fast and accurate underwater object detection. Symmetry 2022, 14, 1669. [Google Scholar] [CrossRef]
  22. Zhang, Y.; Jiang, Q.; Liu, P.; Gao, S.; Pan, X.; Zhang, C. Underwater image enhancement using deep transfer learning based on a color restoration model. IEEE J. Ocean. Eng. 2023, 48, 489–514. [Google Scholar] [CrossRef]
  23. Chang, S.; Gao, F.; Zhang, Q. Underwater Image Enhancement Method Based on Improved GAN and Physical Model. Electronics 2023, 12, 2882. [Google Scholar] [CrossRef]
  24. Zhang, Y.; Chen, D.; Zhang, Y.; Shen, M.; Zhao, W. A two-stage network based on transformer and physical model for single underwater image enhancement. J. Mar. Sci. Eng. 2023, 11, 787. [Google Scholar] [CrossRef]
  25. Park, J. Bam: Bottleneck attention module. arXiv 2018, arXiv:1807.06514. [Google Scholar] [CrossRef]
  26. Wang, C.Y.; Liao, H.-Y.M.; Wu, Y.-H.; Chen, P.-Y.; Hsieh, J.-W.; Yeh, I.-H. CSPNet: A new backbone that can enhance learning capability of CNN. In Proceedings of the IEEE/CVF Conference on Computer Vision and Pattern Recognition Workshops, Seattle, WA, USA, 14–19 June 2020; pp. 390–391. [Google Scholar] [CrossRef]
  27. Brauwers, G.; Frasincar, F. A general survey on attention mechanisms in deep learning. IEEE Trans. Knowl. Data Eng. 2021, 35, 3279–3298. [Google Scholar] [CrossRef]
  28. Wang, R.; An, S.; Liu, W.; Li, L. Invertible residual blocks in deep learning networks. IEEE Trans. Neural Netw. Learn. Syst. 2023, 35, 10167–10173. [Google Scholar] [CrossRef]
  29. Tan, M.; Pang, R.; Le, Q.V. Efficientdet: Scalable and efficient object detection. In Proceedings of the IEEE/CVF Conference on Computer Vision and Pattern Recognition, Seattle, WA, USA, 13–19 June 2020; pp. 10781–10790. Available online: https://www.arxiv.org/abs/1911.09070v7 (accessed on 7 April 2025).
Figure 1. Sample images of the dataset.
Fishes 10 00173 g001
Figure 2. Enhancement effect comparison. (a) Original images. (b) Enhancement images.
Fishes 10 00173 g002
Figure 3. Dataset statistical analysis. (a) Instances statistics. (b) Normalizing the distribution of annotation box widths and heights.
Fishes 10 00173 g003
Figure 4. Basic residual block structure.
Fishes 10 00173 g004
Figure 5. R-AM structure.
Fishes 10 00173 g005
Figure 6. PANet and BiFPN structures.
Fishes 10 00173 g006
Figure 7. Detection process of underwater biological.
Fishes 10 00173 g007
Figure 8. Optimized YOLOv10 model structure.
Fishes 10 00173 g008aFishes 10 00173 g008b
Figure 9. Visualization process of training.
Fishes 10 00173 g009
Figure 10. Comparison of detection performance. (a) Multi category targets; (b) Obstructing and blurring targets; (c) Small targets; (d) Single clear targets.
Fishes 10 00173 g010
Figure 11. Comparison of feature maps in the model before and after optimization. (a) Obstructing and blurring targets; (b) Multi category targets; (c) Small targets; (d) Dense targets.
Fishes 10 00173 g011
Figure 12. Model detection results under different underwater conditions. (a) represents the lighting; (b) represents the depth; (c) represents the turbidity.
Fishes 10 00173 g012
Figure 13. The curves of different models.
Fishes 10 00173 g013
Table 1. Configuration parameters.
ConfigurationParameter
Operating systemUbuntu 22.04
FrameworkPyTorch 2.1.2
GPURTX 4090D (24 GB)
CPU18 vCPU AMD EPYC 9754 128-Core Processor
RAM60 GB
LanguagePython 3.10
Table 2. Ablation experiment results.
ModelmAP@0.5/%mAP@0.5:0.95/%P/%R/%F1-Score/*100
A91.5873.4291.5789.3990.47
A + B92.1474.9392.1489.8690.99
A + C91.7973.8090.4589.6490.04
A + D92.0274.8291.9689.6090.76
A + B + C92.2275.7291.8990.7791.33
A + B + D92.5675.9492.4390.9691.69
A + C + D92.4375.7893.2190.1791.66
A + B + C + D92.8977.1394.2690.6692.42
Table 3. Performance comparison of image enhancement.
DatasetModelmAP@0.5/%mAP@0.5:0.95/%P/%R/%
OUBIDYOLOv1090.7470.2190.3488.20
UM-YOLOv1091.9073.6591.6990.05
EUBIDYOLOv1091.5873.4291.5789.39
UM-YOLOv1092.8977.1394.2690.66
Table 4. Performance of incorporating different attention mechanisms.
ModelmAP@0.5/%mAP@0.5:0.95/%P/%R/%
YOLOv1091.5873.4291.5789.39
YOLOv10 + ECANet91.7574.2790.4589.64
YOLOv10 + SAM91.6373.6590.3189.03
YOLOv10 + SENet [16]88.6966.7588.1886.05
YOLOv10 + CAM [18]90.2270.2590.1188.19
YOLOv10 + SFPAM [21]89.8368.1688.9187.60
YOLOv10 + R-AM92.1474.9392.1489.86
Table 5. Performance of different models.
ModelmAP@0.5/%P/%R/%F1-Score/*100FPSParam./M
Faster R-CNN91.3992.4188.3990.367.5102.5
SSD91.1991.4389.3890.3944.834.1
RetinaNet88.8387.8288.1988.0019.319.8
YOLOv688.1985.9788.4287.1846.715.0
YOLOv791.4792.1989.6490.9058.236.9
YOLOv1091.5891.5789.3990.4767.47.2
Ours92.8994.2690.6692.4263.88.8
Disclaimer/Publisher’s Note: The statements, opinions and data contained in all publications are solely those of the individual author(s) and contributor(s) and not of MDPI and/or the editor(s). MDPI and/or the editor(s) disclaim responsibility for any injury to people or property resulting from any ideas, methods, instructions or products referred to in the content.

