Abstract
The nitrogen budget and the effects of varying densities of sea grape (Caulerpa lentillifera) on water quality and the growth performance of Asian seabass (Lates calcarifer) in a polyculture system were evaluated. Four treatments were tested, each stocked with 20 fish (average weight: ~20 g; density: 2.66 kg/m3). Treatment 1 (control) contained no sea grapes, while treatments 2, 3, and 4 included 100, 200, and 400 g of sea grapes, corresponding to 0, 667 g/m3, 1333 g/m3, and 2666 g/m3, respectively. Significant (p < 0.05) reductions in total ammonia nitrogen (TAN), total suspended solids (TSS), and turbidity were observed with increasing sea grape density; however, no significant differences (p > 0.05) were found among the three sea grape treatments. Higher sea grape densities increased nitrite (NO2–N) and nitrate (NO3–N) concentrations due to enhanced nitrification. Approximately 65% of the nitrogen input originated from feed, but only 47.78–48.96% was assimilated into fish biomass. Nitrogen losses included 1.17–1.46% via water exchange and final drainage, while 45.27–50.76% was likely retained in sediments, volatilized, or lost through denitrification. Sea grapes effectively absorbed total nitrogen (TN), demonstrating their potential as biofilters for improving water quality without compromising fish growth performance. The optimal density was 100 g of sea grapes per 2.66 kg/m3 of seabass biomass, offering a sustainable strategy to enhance productivity while mitigating environmental impacts.
Key Contribution:
This study provides five key insights into the role of sea grapes as a biofilter in a polyculture system with Asian seabass, emphasizing water quality enhancement, nitrogen budget dynamics, nitrification processes, optimal sea grape density, and implications for integrated multi-trophic aquaculture (IMTA). The findings offer valuable data for sustainable aquaculture, presenting a nature-based approach to improve water quality without compromising fish productivity. This research contributes to the advancement of eco-friendly aquaculture practices.
1. Introduction
The Asian seabass (Lates calcarifer), commonly known as barramundi, is one of the world’s most economically significant fish species. Its global trade value reached USD 3.5 billion in 2020 and is projected to nearly double to USD 7.9 billion by 2030 [1]. This growth is driven by strong demand in both domestic and international markets, supported by advancements in breeding techniques and the capacity for high-volume production [2,3,4,5].
Asian seabass is particularly important in Thailand and other countries across Asia [6]. Its aquaculture has expanded throughout Thailand, evolving into an intensive culture system. However, such systems often lead to poor water quality and rapid fluctuations in the aquatic environment during certain stages of cultivation. The nitrogen (N) budget is a critical factor in intensive aquaculture, especially for Asian seabass, due to the large volume of waste generated. Commercial fish feed typically contains 30–45% protein, especially for carnivorous species such as Asian seabass [7]. However, only 20–40% of the nitrogen in the feed is converted into fish biomass [8,9]. The remainder is released into the surrounding water and sediments, leading to the accumulation of harmful nitrogen compounds such as total ammonia nitrogen (TAN), nitrites (NO2–N), and nitrates (NO3–N), which can adversely affect fish health (e.g., stress, mortality) [10,11] and contribute to eutrophication [12].
In response to these challenges, many countries, including Thailand, have developed advanced aquaculture systems. The sea cage farming of Asian seabass began to gain momentum in the mid-2000s. Since then, innovations in cage design, construction, monitoring systems, and offshore farming standards have significantly improved aquaculture practices, alongside developments in larval production and rearing methods [13]. More recently, integrated multi-trophic aquaculture (IMTA) has received increasing attention as a sustainable strategy to mitigate the environmental impacts of aquaculture while providing both ecological and economic benefits [14,15]. IMTA systems aim to co-culture species from different trophic levels—such as fish and aquatic plants—so that waste from the fed species can serve as nutrients or energy sources for other components. This nutrient recycling enhances production efficiency, diversifies outputs, and improves economic returns [16,17,18].
Despite these advancements, gaps remain in optimizing water quality management and enhancing the sustainability of aquaculture systems. In this context, sea grapes (Caulerpa lentillifera) have emerged as a promising candidate for improving water quality and promoting sustainable aquaculture practices [19,20]. Sea grapes are capable of rapidly and efficiently absorbing nutrients from aquaculture wastewater, including water contaminated with heavy metals [21,22,23,24,25]. Several studies have evaluated the co-culture of sea grapes with aquaculture species, highlighting their possibility to enhance water quality and system sustainability. For example, Dobson et al. [26] demonstrated that sea grapes significantly reduced TAN levels in systems co-cultured with sandfish (Holothuria scabra) and Babylon snail (Babylonia areolata). Similarly, Ly et al. [27] reported that different densities of sea grapes effectively reduced TAN, NO2–N, NO3–N, and phosphate concentrations in polyculture systems with whiteleg shrimp (Litopenaeus vannamei). Anh et al. [20] further showed that sea grapes maintained optimal water quality and improved production efficiency when co-cultured with whiteleg shrimp at varying stocking densities.
However, limited studies have investigated the co-culture of Asian seabass and sea grapes, particularly with regard to total nitrogen (TN) budgets in evolving aquaculture systems. Therefore, the present study aimed to examine nitrogen input, utilization rates, and their impacts on water quality, growth performance, survival, and total yield under different sea grape densities. The objective was to generate reference data to support the development of polyculture models involving Asian seabass and sea grapes, contributing to the design of sustainable mixed-culture systems for marine environments.
2. Materials and Methods
2.1. Asian Seabass Fingerlings and Sea Grapes
A total of 400 Asian seabass fingerlings, each weighing approximately 10 g, were obtained from Issarapong Farm, Samut Songkhram Province, Thailand. They were transported to the Sriracha Fisheries Research Station, Faculty of Fisheries, Kasetsart University, Chonburi Province, Thailand, where they were reared in a 2.0 m3 concrete pond. The initial stocking density was 200 fish/m3 (2.0 kg/m3), following Cotou et al. [28]. This stocking density was chosen to ensure biological relevance, environmental sustainability, and comparability with previous studies. This approach aligns with the broader goal of developing sustainable aquaculture practices that are both environmentally friendly and economically viable.
The water salinity was gradually adjusted from 19 to 20 ppt to 30 to 32 ppt by increasing salinity by 2 ppt every two days. This was achieved by adding seawater filtered through a 25 µm filter cloth. The water volume was maintained at 1.0 m3 throughout. The pond was aerated continuously using eight air stones. Fingerlings were acclimated to experimental conditions for two weeks before the trial. During this period, they were fed a commercial pellet diet (Profeed 902 Fish Feed; Thai Union Feed Meal Ltd., Samut Sakhon Province, Thailand) containing a minimum of 42% protein, 8% fat, 3% fiber, and a maximum of 12% moisture. Feeding was performed twice daily at 09:00 a.m. and 4:00 p.m. at a rate of 3% of body weight.
Simultaneously, 60 kg of sea grapes was collected from the Royal Sea Farming and Aquaculture Demonstration Project Under the Initiatives of Her Majesty Queen Sirikit, Ban Laem District, Phetchaburi Province, Thailand. They were maintained in a 2.0 m3 concrete pond filled with filtered seawater (salinity 30–32 ppt) at the same location where the fingerlings were nursed, and were acclimated for two weeks before the experiment.
During the acclimation period, water quality parameters were measured daily between 07:00 and 08:00 a.m. to ensure optimal conditions for both species. Dissolved oxygen (DO) was maintained at ≥5 mg/L, suitable for seabass and sea grapes [20,29,30]. Water temperature (temp) was kept between 25 and 30 °C, within the suitable range for both species (optimal for sea grapes: 25.8–27.6 °C, depending on other factors) [20,30]. pH was maintained between 7.5 and 8.5, appropriate for marine aquaculture systems [29]. Alkalinity (ALK) was kept at 100–150 mg/L CaCO3 to ensure pH stability and adequate buffering capacity [29]. TAN concentrations were maintained below 0.5 mg/L to prevent toxicity, and NO2–N concentrations were kept below 0.1 mg/L to minimize stress and health risks [29,30,31]. Specific methods and instruments used for water quality analysis are described in Section 2.4.
2.2. Experimental Design
After acclimation, the initial weights of the fingerlings and sea grapes were recorded using a digital CST-CDR scale (CST Instruments (Thailand) Ltd., Bangkok, Thailand). The fish and algae were then introduced into 0.25 m3 (0.8 m diameter) fiberglass tanks, each containing 0.15 m3 of water. For each treatment, the stocking density was 20 fish per 0.15 m3, with individual fish weighing approximately 20 g, corresponding to 133 fish/m3 or 2.66 kg/m3. This density exceeds the recommended 2.0 kg/m3 [28] to evaluate the effectiveness of the sea grape treatments under higher-density conditions. An 80% water exchange was performed every three days to maintain optimal water quality, ensuring low levels of TAN and NO2–N, stable pH, and adequate DO—conditions essential for seabass growth and survival.
The experiment consisted of four treatments, each in triplicate. Treatment 1 served as the control (no sea grapes), while treatments 2, 3, and 4 involved co-culture with sea grapes at different biomass levels per tank, corresponding to densities of 667 g/m3, 1333 g/m3, and 2666 g/m3, respectively. Sea grapes were suspended in baskets within the tanks. Each tank was aerated using a single air stone (Figure 1). The experiment was conducted over 30 days. The selected sea grape stocking densities were intended to evaluate the effects of different biomass levels on fish growth, health, and water quality. The aim was to determine the optimal sea grape density for enhancing production efficiency while maintaining fish welfare. The details of each treatment are as follows:
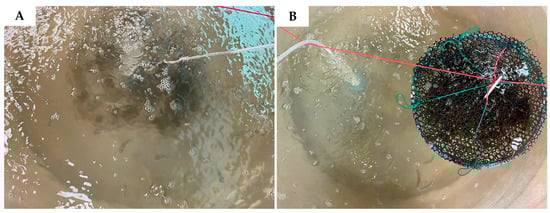
Figure 1.
Experimental setup showing (A) Asian seabass monoculture (control) and (B) co-culture with sea grapes at different densities (100 g, 200 g, 400 g), representing treatments 2, 3, and 4.
Treatment 1: Asian seabass monoculture (control);
Treatment 2: Asian seabass + Sea grape 100 g;
Treatment 3: Asian seabass + Sea grape 200 g;
Treatment 4: Asian seabass + Sea grape 400 g.
2.3. Feeding During the Experiment
Carnivorous fish such as Asian seabass require a protein-rich diet to support muscle development, tissue repair, and overall health. During the experiment, fish were fed the same commercial pellet feed used during acclimation (Profeed 902 Fish Feed; Thai Union Feed Meal Ltd., Samut Sakhon Province, Thailand), containing at least 42% protein, 8% fat, 3% fiber, and a maximum of 12% moisture. Feeding was conducted twice daily at 9:00 a.m. and 4:00 p.m., at a rate of 3% of body weight. To prevent cannibalism, fish were size-matched at the start of the experiment and provided with sufficient feed to ensure optimal growth.
2.4. Water Quality Measurement
Water quality parameters in each experimental tank were monitored daily to ensure suitable conditions for both seabass and sea grapes. Parameters measured included DO, temp, salinity, pH, TAN, NO2–N, NO3–N, ALK, total suspended solids (TSS), turbidity, total Kjeldahl nitrogen (TKN), and TN.
DO, temp, and pH were measured using a Rinko Profiler Multi-Parameter CTD Model ASTD 102 (JFE Advantech Co., Ltd., Tokyo, Japan). Salinity was measured using Ponsel Mesure-ODEON multi-parameter hand-held devices (Aqualabo Services SA, Champigny-sur-Marne, France). Turbidity was assessed using a Lovibond TB211-IR Turbidity Meter Kit (Tintometer GmbH, Dortmund, Germany). Samples for TAN, NO2–N, NO3–N, ALK, and TSS were collected and analyzed following APHA [31] standard methods. TKN was measured at the beginning and end of the experiment using APHA [32] guidelines. TN content in fish, sea grapes, feed, and water was analyzed at both time points using the persulfate digestion method, as described in APHA [31].
2.5. Sea Grape Biomass
The biomass increment (BI) and relative growth rate (RGR) of sea grapes were calculated using Equations (1)–(3), as recommended by Shokita et al. [33]:
BI (g) = (Final biomass − Initial biomass)
BI (%) = (Final biomass − Initial biomass)/Initial biomass × 100
RGR (% day−1) = [(log final weight) − (log initial weight)/cultured days] × 100
2.6. Nitrogen Budget Calculation
TN input was calculated from the TN content in the fish at the beginning of the experiment, the total feed provided, the water added during culture, and the initial biomass of sea grapes. TN losses were determined based on the TN content in fish at the end of the experiment, discharged water, residual material in the tanks, harvested sea grapes, and other potential loss sources such as sediment accumulation and nitrification-related processes.
2.7. Fish Growth Performance
Each fish was weighed every 10 days throughout the experiment to evaluate growth performance. The parameters assessed were weight gain (WG), average daily gain (ADG), specific growth rate in weight (SGRW), survival rate, production, and feed conversion ratio (FCR). These metrics were calculated using Equations (4)–(9), respectively:
WG (g) = Final − Initial weight
ADG (g day−1) = [(Final weight) − (Initial weight)]/Cultured days
SGRW (%g fish day−1) = [[(In final weight) − (In initial weight)]/Cultured days] × 100
Survival (%) = [(Final number/Initial number)] × 100
Production (g) = Total fish weight (kg m−3) − Initial fish weight (kg m−3)
FCR = Feed provided/Weight gain
In Equation (6), ln denotes the natural logarithm (base e, approximately 2.718), which accounts for the exponential growth pattern in fish, providing a more accurate estimation of specific growth rate.
2.8. Statistical Analysis
For all treatments, results were analyzed using a one-way analysis of variance (ANOVA) to evaluate the overall effect of the treatment, employing IBM SPSS Statistics version 26 (IBM Corp., Armonk, NY, USA). Duncan’s new multiple range test was conducted to identify significant differences between mean values at a significance level of p < 0.05. Results are presented as mean ± standard deviation.
3. Results
3.1. Water Quality Parameters
Among the treatments, no significant differences were observed in water quality parameters, except for TAN, NO2–N, NO3–N, TSS, and turbidity. TAN in treatment 1 (control) had the highest average value (1.20 ± 0.97 mg/L), which was significantly different (p < 0.05) from the other treatments. Treatments 2, 3, and 4 had average values of 0.76 ± 0.86 mg/L, 0.71 ± 0.75 mg/L, and 0.63 ± 0.65 mg/L, respectively. NO2–N in treatment 1 (control) had the lowest mean value (1.52 ± 1.37 mg/L), which was significantly different (p < 0.05) from treatments 2, 3, and 4, with mean values of 2.26 ± 1.22 mg/L, 2.30 ± 1.16 mg/L, and 2.25 ± 1.11 mg/L, respectively. Similarly, the lowest mean NO3–N value (1.30 ± 1.62 mg/L) was recorded in treatment 1 (control), significantly differing (p < 0.05) from treatments 2, 3, and 4, which had mean values of 1.83 ± 0.70 mg/L, 1.75 ± 0.65 mg/L, and 1.79 ± 0.66 mg/L, respectively. TSS had the highest mean value (0.09 ± 0.02 mg/L) in treatment 1 (control), which was significantly different (p < 0.05) from treatments 2, 3, and 4, with mean values of 0.07 ± 0.01 mg/L, 0.07 ± 0.01 mg/L, and 0.05 ± 0.01 mg/L, respectively. Turbidity was also highest in treatment 1 (control) (7.69 ± 5.32 NTU), significantly differing (p < 0.05) from treatments 2, 3, and 4, which had mean values of 3.12 ± 1.90 NTU, 2.58 ± 1.67 NTU, and 2.40 ± 1.26 NTU, respectively. These results are summarized in Table 1 and illustrated in Figure 2A–J.

Table 1.
Comparison of water quality parameters across different treatments of Asian seabass in rearing tanks after 30 days of culture.
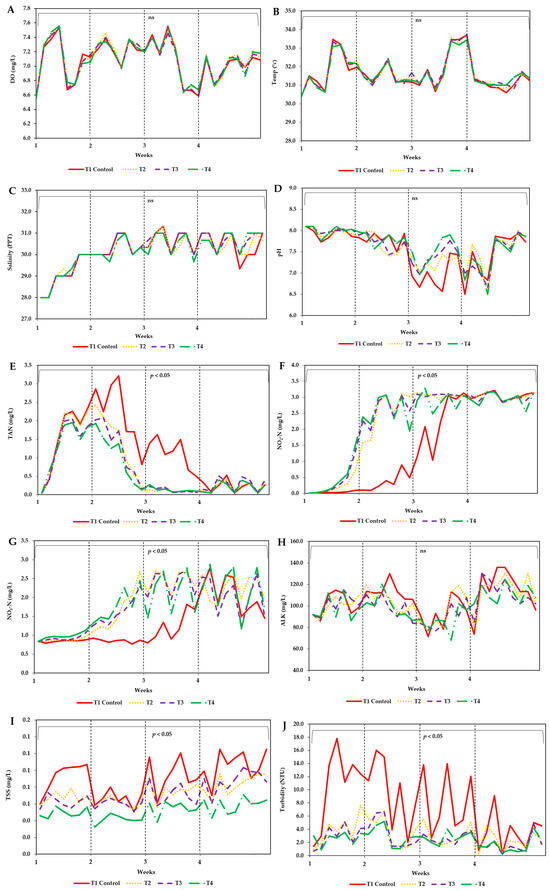
Figure 2.
Distribution of measured variables during the experiment for (A) dissolved oxygen (DO), (B) temperature (temp), (C) salinity, (D) pH, (E) total ammonia nitrogen (TAN), (F) nitrite–nitrogen (NO2–N), (G) nitrate–nitrogen (NO3–N), (H) alkalinity (ALK), (I) total suspended solids (TSS), and (J) turbidity. The treatments are: T1(Control), T2 (Asian seabass + 100 g), T3 (Asian seabass + 200 g), and T4 (Asian seabass + 400 g). “ns” indicates no significant difference, while a significant difference between treatments is denoted where p < 0.05.
3.2. Biomass and Growth of Sea Grapes
The final biomass of sea grapes differed significantly (p < 0.05) across treatments, with treatment 4 having the highest final weight (504.30 ± 22.40 g), followed by treatment 3 (240.23 ± 5.97 g) and treatment 2 (161.40 ± 15.63 g). BI (g) was highest in treatment 4 (104.30 ± 25.04 g), which was significantly different (p < 0.05) from treatments 2 and 3, with weight gains of 61.40 ± 17.47 g and 40.23 ± 6.67 g, respectively. Treatment 2 had the highest BI (%) (61.40 ± 17.47%), which was significantly different (p < 0.05) from treatments 3 and 4, which had BI values of 20.12 ± 3.34% and 26.08 ± 6.26%, respectively. Additionally, treatment 2 had the highest average RGR (% Day−1) (2.05 ± 0.58% Day−1), which was significantly different (p < 0.05) from treatment 3 (0.67 ± 0.11% Day−1) and treatment 4 (0.87 ± 0.21% Day−1), as shown in Table 2 and Figure 3.
Table 2.
Biomass and growth performance of sea grapes across treatments.
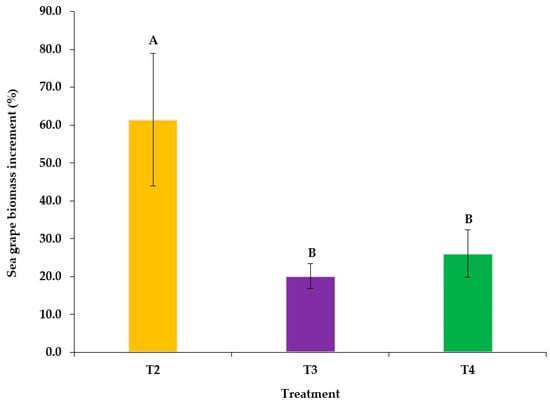
Figure 3.
Biomass increment percentage (BI%) of sea grapes under different treatments: T2, T3, and T4. Significant differences (p < 0.05) are indicated by letters.
3.3. Growth Performance of Asian Seabass
Different densities of sea grapes with Asian seabass did not affect growth, survival, production, or FCR. No significant differences (p > 0.05) were observed in the growth of Asian seabass cultured with different sea grape weights across all parameters and treatments. FW values ranged from 37.97 to 41.37 g/fish, WG from 12.72 to 16.42 g/fish, ADG from 0.42 to 0.55 g/day, and SGRW from 1.22 to 1.30%/day. Additionally, survival rates were 100% across all treatments, production ranged from 759.33 to 827.44 g, and FCR ranged from 1.77 to 1.84. These results are presented in Table 3.
Table 3.
Growth performance of Asian seabass under different sea grape densities after 30 days.
3.4. Nitrogen Budget
Approximately 65% of the nitrogen introduced into the culture tanks originated from feed, with FCR values ranging from 1.77 to 1.84. Of this nitrogen, only 47.78–48.96% was utilized by the harvested fish, while 1.17–1.46% was released during water exchanges and final drainage. The largest portion (45.27–50.76%) was assumed to have been retained in sediments, volatilized as ammonia, or lost through denitrification. During their growth, sea grapes effectively absorbed TN, as indicated by an increase in their TN content from an initial 1.78–7.12 g to 2.32–8.42 g by the end of the experimental period. These results are presented in Table 4.
Table 4.
Nitrogen budget (mg/L) in the polyculture system over the 30-day experimental period.
4. Discussion
This study demonstrated that integrating sea grapes at varying densities into a polyculture system with Asian seabass effectively improved water quality by reducing TAN and TSS without compromising fish growth or survival. Most water quality parameters remained within optimal ranges for seabass culture [30], except for TAN and NO2–N, which exceeded suitable levels. This deviation may be attributed to a higher stocking density than typically recommended for polyculture systems [28]. Despite this, the inclusion of sea grapes significantly reduced TAN levels compared to the control group, reinforcing their role as biofilters in sustainable aquaculture systems.
The observed reduction in TAN, along with increased NO2–N and NO3–N levels, suggests active nitrification processes within the culture system. Nitrification, a two-step microbial process, involves the oxidation of ammonia to NO2–N by ammonia-oxidizing bacteria (AOB), followed by the oxidation of NO2–N to NO3–N by nitrite-oxidizing bacteria (NOB). These findings indicate that while sea grapes efficiently absorb ammonia, residual TAN undergoes microbial transformation, leading to increased NO2–N and NO3–N concentrations. This process was supported by sufficient DO levels, which are essential for nitrification [8].
These findings align with previous studies demonstrating the ability of sea grapes to improve water quality in aquaculture. For instance, Chaitanawisuti et al. [34] reported that sea grapes effectively reduced TAN levels in recirculating systems with juvenile spotted Babylons (Babylonia areolata). Similarly, Dobson et al. [26] observed significant reductions in TAN and total dissolved solids when integrating sea grapes with sandfish and Babylon snails. Other studies, such as Ly et al. [27] and Anh et al. [20], also documented improved water quality and shrimp performance when sea grapes were co-cultured with whiteleg shrimp. Collectively, these findings reinforce the potential of sea grapes as biofilters that absorb excess nitrogen and prevent toxic buildup in aquaculture systems.
One of the main limitations of this study is the short 30-day cultivation period, which may not fully capture long-term effects on growth performance and water quality. While short-term results indicate positive impacts, future studies should extend the experimental period to assess whether nitrification and denitrification processes reach full efficiency over time and how this affects nitrogen cycling in saline environments. Additionally, the optimal sea grape density observed in this study may not be universally applicable, as environmental factors such as light intensity, water flow, salinity, and temperature could influence nitrogen uptake efficiency. Conducting experiments under varied conditions will help refine density recommendations for different aquaculture systems [35,36].
Beyond biological considerations, economic feasibility should also be evaluated. While sea grapes show promise in improving water quality, their large-scale application in aquaculture requires cost–benefit analyses to determine whether their integration is financially viable. Future research should explore the economic implications of using sea grapes in commercial settings, including market demand and potential revenue streams from co-cultivating sea grapes as a secondary product [37].
The findings of this study highlight the potential of sea grapes as a natural biofilter in sustainable aquaculture practices, contributing to both environmental management and economic viability. By efficiently reducing TAN without negatively impacting fish growth, sea grapes can be integrated into polyculture systems to enhance water quality and reduce reliance on water exchange. However, to optimize their effectiveness, future research should focus on long-term ecological and economic assessments, as well as multi-species integration strategies. As suggested by Liu et al. [24], combining different macroalgae species may offer a more comprehensive approach to nitrogen removal, further enhancing sustainability in intensive aquaculture systems [38,39].
By refining density optimization, evaluating long-term impacts, and assessing economic viability, future studies can provide actionable strategies for integrating sea grapes beyond the current experimental setup, extending their benefits to a wider range of aquaculture systems.
5. Conclusions
Integrating sea grapes into Asian seabass polyculture systems effectively improved water quality by reducing TAN, TSS, and turbidity levels without compromising fish growth or survival. Based on the study results, a suitable treatment for Asian seabass polyculture would involve an initial stocking biomass of 2.66 kg/m3, along with 100 g of sea grapes. The observed nitrification process at higher sea grape densities underscores the importance of balanced density optimization to manage nitrite and nitrate accumulation effectively. This study highlights the potential of sea grapes as biofilters in sustainable aquaculture, contributing to environmental sustainability and economic viability in intensive production systems. However, further research is needed to optimize sea grape density for long-term water quality management and to assess its prolonged effects on fish growth, system stability, and overall ecological balance.
Author Contributions
Conceptualization: R.J., A.I. and W.T.; methodology: R.J., K.K., S.R. and W.T.; software: R.J., K.K. and W.T.; validation: R.J., K.K. and W.T.; formal analysis: R.J., K.K. and W.T.; investigation: R.J., K.K. and W.T.; resources: K.K. and A.I.; data curation: R.J. and K.K.; writing—original draft preparation: R.J. and W.T.; writing—review and editing: R.J. and W.T.; visualization: R.J. and W.T.; supervision: W.T.; project administration: A.I.; funding acquisition: A.I. All authors have read and agreed to the published version of the manuscript.
Funding
This research was funded by the Kasetsart University Research and Development Institute (KURDI), Bangkok, Thailand, under the project “Integrated Multi-Trophic Aquaculture in Sriracha Bay, Chonburi Province” (KURDI-RS(KU) 9.65).
Institutional Review Board Statement
This animal study protocol was approved by the Ethics Committee of the Kasetsart University Institutional Animal Care and Use Committee (ACKU67-FIS-025) in Bangkok, Thailand, on 10 October 2024.
Data Availability Statement
The data supporting the findings of this study are available from the first and corresponding author upon reasonable request.
Acknowledgments
The authors appreciated assistance from the staff at the Sriracha Fisheries Research Station, who provided the experimental site.
Conflicts of Interest
The authors declare no conflicts of interest.
References
- Mojjada, S.K.; Divu, D.N.; Sudhakaran, P.O.; Sundaram, S.L.P.; Menon, M.; Mojjada, R.K.; Tade, M.S.; Viswambharan, V.S.; Shree, J.; Subramanian, A.; et al. An integrated techno-economic decision-support fiscal forecast model for sea cage mariculture enterprises for Asian seabass production in Indian territorial waters. Aquaculture 2024, 580, 740351. [Google Scholar] [CrossRef]
- Razzak, M.; Sukhan, Z.; Alam, M.; Al-Amin, M.; Sikder, M.; Hossen, S. Optimization of stocking density of seabass (Lates calcalifer) in brackish-and freshwater earthen ponds under monoculture in south-west coastal zone of Bangladesh. Bangladesh J. Fish. Res. 2019, 31, 305–312. [Google Scholar]
- Viji, S.; Purushothaman, K.; Sridatta, P.S.R.; Jerry, D.R. Transcriptomic analysis of gill and kidney from Asian seabass (Lates calcarifer) acclimated to different salinities reveals pathways involved with euryhalinity. Genes 2020, 11, 733. [Google Scholar] [CrossRef] [PubMed]
- Domingos, J.A.; Goldsbury, J.A.; Gomes, G.B.; Smith, B.G.; Tomlinson, C.; Bade, T.; Sander, C.; Forrester, J.; Jerry, D.R. Genotype by environment interactions of harvest growth traits for barramundi (Lates calcarifer) commercially farmed in marine vs. freshwater conditions. Aquaculture 2021, 532, 735989. [Google Scholar] [CrossRef]
- Stathopoulou, P.; Berillis, P.; Valhos, N.; Nikouli, E.; Kormas, K.A.; Levizou, E.; Katsoulas, N.; Mente, E. Freshwater-adapted seabass Dicentrarchus labrax feeding frequency impact in a lettuce Lactuca sativa aquaponics system. PeerJ 2021, 9, e11522. [Google Scholar] [CrossRef]
- Muangrerk, C.; Uchuwittayakul, A.; Srisapoome, P. Identification, expression and antimicrobial functional analysis of interleukin-8 (IL-8) in response to streptococcus iniae and Flavobacterium covae in Asian seabass (Lates calcarifer Bloch, 1790). Animal 2024, 14, 475. [Google Scholar] [CrossRef]
- Tacon, A.G.J.; Metian, M. Global overview on the use of fish meal and fish oil in industrially compounded aquafeeds: Trends and future prospects. Aquaculture 2008, 285, 146–158. [Google Scholar] [CrossRef]
- Catacutan, M.R.; Coloso, R.M. Effect of dietary protein to energy ratios on growth, survival, and body composition of juvenile Asian seabass, Lates calcarifer. Aquaculture 1995, 131, 125–133. [Google Scholar] [CrossRef]
- Hua, K.; Bureau, D.P. Modelling digestible phosphorus and nitrogen waste output in fish and shrimp aquaculture. Aquaculture 2016, 464, 73–83. [Google Scholar] [CrossRef]
- Chen, D.; Tian, C.; Yuan, H.; Zhai, W.; Chang, Z. Nitrogen removal performance and microbial community structure of IMTA ponds (Apostistius japonicus-Penaeus japonicus-Ulva). Microb. Ecol. 2024, 87, 82. [Google Scholar] [CrossRef]
- Yan, Y.; Zhou, J.; Du, C.; Yang, Q.; Huang, J.; Wang, Z.; Xu, J.; Zhang, M. Relationship between Nitrogen Dynamics and Key Microbial Nitrogen-Cycling Genes in an Intensive Freshwater Aquaculture Pond. Microorganisms 2024, 12, 266. [Google Scholar] [CrossRef] [PubMed]
- Yang, S.; Dong, M.; Lu, H.; Cai, Z.; Ge, M.; Xing, J.; Huang, H.; Huang, Y.; Sun, G.; Zhou, S.; et al. Explaining nitrogen turnover in sediments and water through variations in microbial community composition and potential function. Chemosphere 2023, 344, 140379. [Google Scholar] [CrossRef] [PubMed]
- Rao, P.V.S.; Mantri, V.A. Indian seaweed resources and sustainable utilization: Scenario at the dawn of a new century. Curr. Sci. 2013, 91, 164–174. [Google Scholar]
- Chopin, T.; Robinson, S.M.C.; Troell, M.; Neori, A.; Bushmann, A.H.; Fang, J. Multitrophic integration for sustainable marine aquaculture. In The Encyclopedia Ecolological Engineering, 3rd ed.; Jørgensen, S.E., Fath, B.D., Eds.; Elsevier: Amsterdam, The Netherlands, 2008; pp. 2463–2475. [Google Scholar] [CrossRef]
- Barrington, K.; Chopin, T.; Robinson, S. Integrated multi-trophic aquaculture (IMTA) in marine temperate waters. In Integrated Mariculture: A Global Review; Soto, D., Ed.; FAO Fisheries and Aquaculture Technical Paper 529; FAO: Rome, Italy, 2010; pp. 7–46. [Google Scholar]
- Chopin, T.; Cooper, J.A.; Reid, G.; Cross, S.; Moore, C. Open water integrated multi-trophic aquaculture: Environmental biomitigation and economic diversification of fed aquaculture by extractive aquaculture. Rev. Aquac. 2012, 4, 209–220. [Google Scholar] [CrossRef]
- Hughes, A.D.; Black, K.D. Going beyond the search for solutions: Understanding trade-offs in European integrated multi-trophic aquaculture development. Aquacult. Environ. Interact. 2016, 8, 191–199. [Google Scholar] [CrossRef]
- Buck, B.H.; Troell, M.F.; Krause, G.; Angel, D.L.; Grote, B.; Chopin, T. State of the art and challenges for offshore integrated multi-trophic aquaculture (IMTA). Front. Mar. Sci. 2018, 5, 165. [Google Scholar] [CrossRef]
- Famà, P.; Wysor, B.; Kooistra, W.H.C.F.; Zuccarello, G.C. Molecular phylogeny of the genus Caulerpa (Caulerpales, Chlorophyta) inferred from chloroplast tufA gene. J. Phycol. 2002, 38, 1040–1050. [Google Scholar] [CrossRef]
- Anh, N.T.N.; Murungu, A.K.; Khanh, L.V.; Hai, T.N. Polyculture of sea grape (Caulerpa lentillifera) with different stocking densities of whiteleg shrimp (Litopenaeus vannamei): Effects on water quality, shrimp performance and sea grape proximate composition. Algal Res. 2022, 67, 102845. [Google Scholar] [CrossRef]
- Chen, X.; Sun, Y.; Liu, H.; Liu, S.; Qin, Y. Advances in cultivation, wastewater treatment application, bioactive components of Caulerpa lentillifera and their biotechnological applications. PeerJ 2019, 7, e6118. [Google Scholar] [CrossRef]
- Marungrueng, K.; Pavasant, P. Removal of basic dye (Astrazon Blue FGRL) using macroalga Caulerpa lentillifera. J. Environ. Manag. 2006, 78, 268–274. [Google Scholar] [CrossRef]
- Paul, N.A.; Nys, R.d. Promise and pitfalls of locally abundant seaweeds as biofilters for integrated aquaculture. Aquaculture 2008, 28, 49–55. [Google Scholar] [CrossRef]
- Liu, H.; Wang, F.; Wang, Q.; Dong, S.; Tian, X. A comparative study of the nutrient uptake and growth capacities of seaweeds Caulerpa lentillifera and Gracilaria lichenoides. J. Appl. Phycol. 2016, 28, 3083–3089. [Google Scholar] [CrossRef]
- Saputra, N.R.; Sukoso, S.; Kartikaningsih, H. A solid waste pond tiger shrimp (Peneaus monodon) as fertilizer for Caulerpa lentillifera. J. Exp. Life Sci. 2017, 7, 17–21. [Google Scholar] [CrossRef]
- Dobson, G.T.; Duy, N.D.Q.; Paul, N.A.; Southgate, P.C. Assessing potential for integrating sea grape (Caulerpa lentillifera) culture with sandfish (Holothuria scabra) and Babylon snail (Babylonia areolata) co-culture. Aquaculture 2020, 522, 735153. [Google Scholar] [CrossRef]
- Ly, K.V.; Murungu, D.K.; Nguyen, D.P.; Nguyen, N.A.T. Effects of different densities of sea grape (Caulerpa lentillifera) on water quality, growth, and survival of the whiteleg shrimp (Litopenaeus vannamei) in a polyculture system. Fishes 2021, 6, 19. [Google Scholar] [CrossRef]
- Cotou, E.; Miliou, H.; Chatzoglou, E.; Schoina, E.; Politakis, N.; Kogiannou, D.; Fountoulaki, E.; Androni, A.; Konstantinopoulou, A.; Assimakopoulou, G.; et al. Growth performance and environmental quality indices and biomarkers in a co-culture of the European seabass with filter and deposit feeders: A case study of an IMTA system. Fishes 2024, 9, 69. [Google Scholar] [CrossRef]
- Boyd, C.E.; Tucker, C.S. Pond Aquaculture Water Quality Management; Kluwer Academic Publishers: Boston, MA, USA, 1998. [Google Scholar] [CrossRef]
- Sukhsangchan, R.; Phaksopa, J.; Uchuwittayakul, A.; Chou, C.-C.; Srisapoome, P. Effect of zinc oxide nanoparticles (ZnO NPs) on growth, immune responses, and histopathological alterations in Asian seabass (Lates calcarifer, Bloch 1790) under low-salinity conditions. Animals 2024, 14, 2737. [Google Scholar] [CrossRef]
- APHA. Standard Methods for the Examination of Water and Wastewater, 23rd ed.; Baird, R.B., Eaton, A.D., Rice, E.W., Eds.; American Public Health Association: Washington, DC, USA, 2017; Volume 10, ISBN 978-0-87553-287-5. [Google Scholar]
- APHA; American Water Works Association; Water Environment Federation. Standard Methods for the Examination of Water and Wastewater; American Public Health Association: Washington, DC, USA, 2005. [Google Scholar]
- Shokita, S.; Kakazu, K.; Tomori, A.; Toma, T. Mariculture of seaweeds. In Aquaculture in Tropical Area; Midori Shobo Co., Ltd.: Tokyo, Japan, 1991; pp. 31–95. [Google Scholar]
- Chaitanawisuti, N.; Santhaweesuk, W.; Kritsanapuntu, S. Performance of the seaweeds Gracilaria salicornia and Caulerpa lentillifera as biofilters in a hatchery-scale recirculating aquaculture system for juvenile spotted babylons (Babylonia areolata). Aquac. Int. 2011, 19, 1139–1150. [Google Scholar] [CrossRef]
- Egea, I.; Estrada, Y.; Faura, C.; Egea-Fernández, J.M.; Bolarín, M.C.; Flores, F.B. Salt-tolerant alternative crops as sources of quality food to mitigate the negative impact of salinity on agricultural production. Front. Plant Sci. 2023, 14, 1092885. [Google Scholar] [CrossRef]
- Phillips, J.C.; Hurd, C.L. Nitrogen ecophysiology of intertidal seaweeds from New Zealand: N uptake, storage, and utilisation in relation to shore position and season. Mar. Ecol. Prog. Ser. 2003, 264, 31–48. [Google Scholar]
- Van Osch, S.; Hynes, S.; Freeman, S.; O’Higgins, T. Estimating the public’s preferences for sustainable aquaculture: A country comparison. Sustainability 2019, 11, 569. [Google Scholar] [CrossRef]
- Nathawat, N.S.; Kuhad, M.S.; Goswami, C.L.; Patel, A.L.; Kumar, R. Nitrogen-metabolizing enzymes: Effect of nitrogen sources and saline irrigation. J. Plant Nutr. 2005, 28, 1089–1101. [Google Scholar] [CrossRef]
- Burkholder, J.M.; Tomasko, D.A.; Touchette, B.W. Seagrasses and eutrophication. J. Exp. Mar. Biol. Ecol. 2007, 350, 46–72. [Google Scholar] [CrossRef]
Disclaimer/Publisher’s Note: The statements, opinions and data contained in all publications are solely those of the individual author(s) and contributor(s) and not of MDPI and/or the editor(s). MDPI and/or the editor(s) disclaim responsibility for any injury to people or property resulting from any ideas, methods, instructions or products referred to in the content. |
© 2025 by the authors. Licensee MDPI, Basel, Switzerland. This article is an open access article distributed under the terms and conditions of the Creative Commons Attribution (CC BY) license (https://creativecommons.org/licenses/by/4.0/).