1. Introduction
Hydroelectric power is frequently promoted as a sustainable energy solution, given its potential to provide low-carbon electricity and mitigate greenhouse gas emissions [
1]. In Andean countries such as Ecuador, this energy source has been central to national development strategies [
2]. In fact, 78.6% of Ecuador’s gross electricity generation in 2023 came from hydroelectric sources [
3]. However, hydroelectric infrastructure’s ecological and socio-environmental consequences have raised serious concerns. Large-scale projects disrupt the natural flow regimes of rivers, altering sediment transport, nutrient cycles, and the ecological connectivity critical for freshwater biodiversity [
4,
5,
6]. These impacts have cascading effects, often leading to habitat fragmentation, changes in water quality, and fish population and diversity declines [
7,
8].
The design of hydroelectric plants plays a critical role in determining their ecological impact. Run-of-river systems or riverbank hydropower plants, which rely on smaller intakes of water and avoid the creation of large reservoirs, generally impose fewer ecological disturbances [
9] compared to traditional large dams with substantial reservoirs that cause severe and often irreversible alterations to river hydrology, inundating vast areas and isolating upstream and downstream communities of fishes and other aquatic organisms [
10].
However, small hydropower projects (SHPs), including both traditional and run-of-river designs, can have important negative impacts on local human communities and aquatic ecosystems as well, especially due to poor planning and design, as well as irresponsible construction, operation, and maintenance [
11]. Depending on how they are designed, SHPs can also lead to river fragmentation, which also disrupts sediment transport, aquatic habitats, and connectivity, negatively affecting fish migration and biodiversity, similar to large hydropower projects [
12,
13,
14]. Socially, SHPs often provoke conflicts with local communities, especially indigenous populations, by disrupting traditional livelihoods, reducing access to water, and undermining cultural practices tied to river ecosystems [
15,
16]. Moreover, the cumulative impacts of multiple SHPs in the same basin are often more severe than those of large hydropower projects, due to increased habitat fragmentation and river basin-level ecological stress [
17].
From a legal perspective, Ecuador’s laws and policies strongly protect nature and local communities from the negative impacts of industrial development, including hydropower. Notably, Ecuador’s 2008 Constitution was the first in the world to recognize nature as a subject of legal rights. The Constitution also enshrines the human right to water, establishing a hierarchical framework for water allocation.
The Article 318 of the Constitution and Article 86 of the Water Law prioritize water use in the following order: first, human consumption; second, small-scale agriculture supporting food sovereignty; third, environmental flows; and fourth, economically productive uses, such as hydropower production. Furthermore, Article 73 reinforces this prioritization by requiring the State to “apply preventive and restrictive measures on activities that might lead to the extinction of species, the destruction of ecosystems, and the permanent alteration of natural cycles”.
Despite these and other robust legal protections against the potential negative impacts of hydropower development, environmental legal scholars have identified some concerning regulatory loopholes. For example, Conrad [
16] points out that, based on various Ecuadorian regulatory policies, hydropower projects with an installed capacity of 10 MW or less are exempt from producing an Environmental Impact Study altogether. Without determining the potential environmental harm through pre-construction studies, it is extremely difficult to enforce the legal safeguards for local human communities and river ecosystems regarding these projects.
From a biodiversity perspective, Ecuador’s Andean region is a global hotspot, particularly for freshwater ecosystems that support an extraordinary array of endemic fish [
18,
19]. However, despite its biodiversity, the country’s ichthyological knowledge remains surprisingly scarce. Research on Ecuadorian freshwater fish’s diversity, distribution, and ecology remains limited, particularly for montane species inhabiting Andean rivers [
20]. Among these are the climbing catfishes, Astroblepidae family, a monophyletic group consisting solely of the genus
Astroblepus. These species are the only native fish found in rivers above 1000 m.a.s.l. and are severely threatened by the extensive land use, water pollution, and invasive species such as the brown trout,
Salmo trutta (Linnaeus, 1758), and the rainbow trout,
Oncorhynchus mykiss (Walbaum, 1792) [
21]. This lack of baseline data poses considerable challenges for conservation planning and environmental impact assessments.
In Ecuador, where hydropower development is expanding rapidly, understanding the ecological consequences of hydropower project construction is critical, particularly in rivers supporting high levels of fish diversity and endemic species [
20]. The absence of robust distributional and ecological datasets hinders the ability to predict how fish communities respond to anthropogenic stressors, including habitat fragmentation, altered flow regimes, and the broader impacts of hydroelectric dam construction [
8,
22]. Without this foundational knowledge, assessments of environmental impacts and the development of effective conservation strategies are often incomplete or imprecise, leaving many species vulnerable to extirpation before their ecological roles and conservation needs are fully understood [
23].
Despite this ecological significance and established environmental legal protections like those in the Ecuadorian Constitution, the region’s rivers are increasingly impacted by hydropower development [
7,
24]. These alterations can be particularly severe in montane river systems to endemic fish with highly specialized adaptations to local conditions such as the previously mentioned Andean climbing catfishes [
21,
22]. For instance, studies have found that hydroelectric projects in the Tropical Andes frequently fail to maintain environmental flows, leading to critically low discharges that threaten the survival of aquatic biota [
8]. The limited knowledge of how these engineering structures and their operations affect endangered fish species impedes the development of effective management strategies to conserve river biodiversity [
25].
The current study focuses on the ecological impacts of the San José del Tambo hydropower project, which has a generation capacity of 8 MW, putting it in the SHP category. The hydroelectric plant is located on the Dulcepamba River on the western slopes of Ecuador’s central Andes, which drain to the Pacific Ocean. Using a comparative approach, the ecological integrity of the Dulcepamba River basin, which is affected by the hydropower facility, was evaluated against the unaltered Cristal River basin, a neighboring watershed lacking hydropower development. Key components of this assessment included fish community analyses, habitat quality indices, and environmental flow compliance. Moreover, this comparative analysis aims to elucidate the extent of ecological disruption caused by SHPs’ operations and to identify critical conservation priorities for Andean river ecosystems.
The objectives of this study are: (1) to evaluate the ecological effects of the San José del Tambo Hydroelectric Project on fish communities in the Dulcepamba River; (2) to contrast fish diversity, abundance, and habitat characteristics and integrity between the impacted Dulcepamba River and the unaltered Cristal River; and (3) to identify the consequences of hydroelectric operation providing data to guide sustainable management and conservation strategies in the context of small hydropower development.
2. Materials and Methods
2.1. Study Area
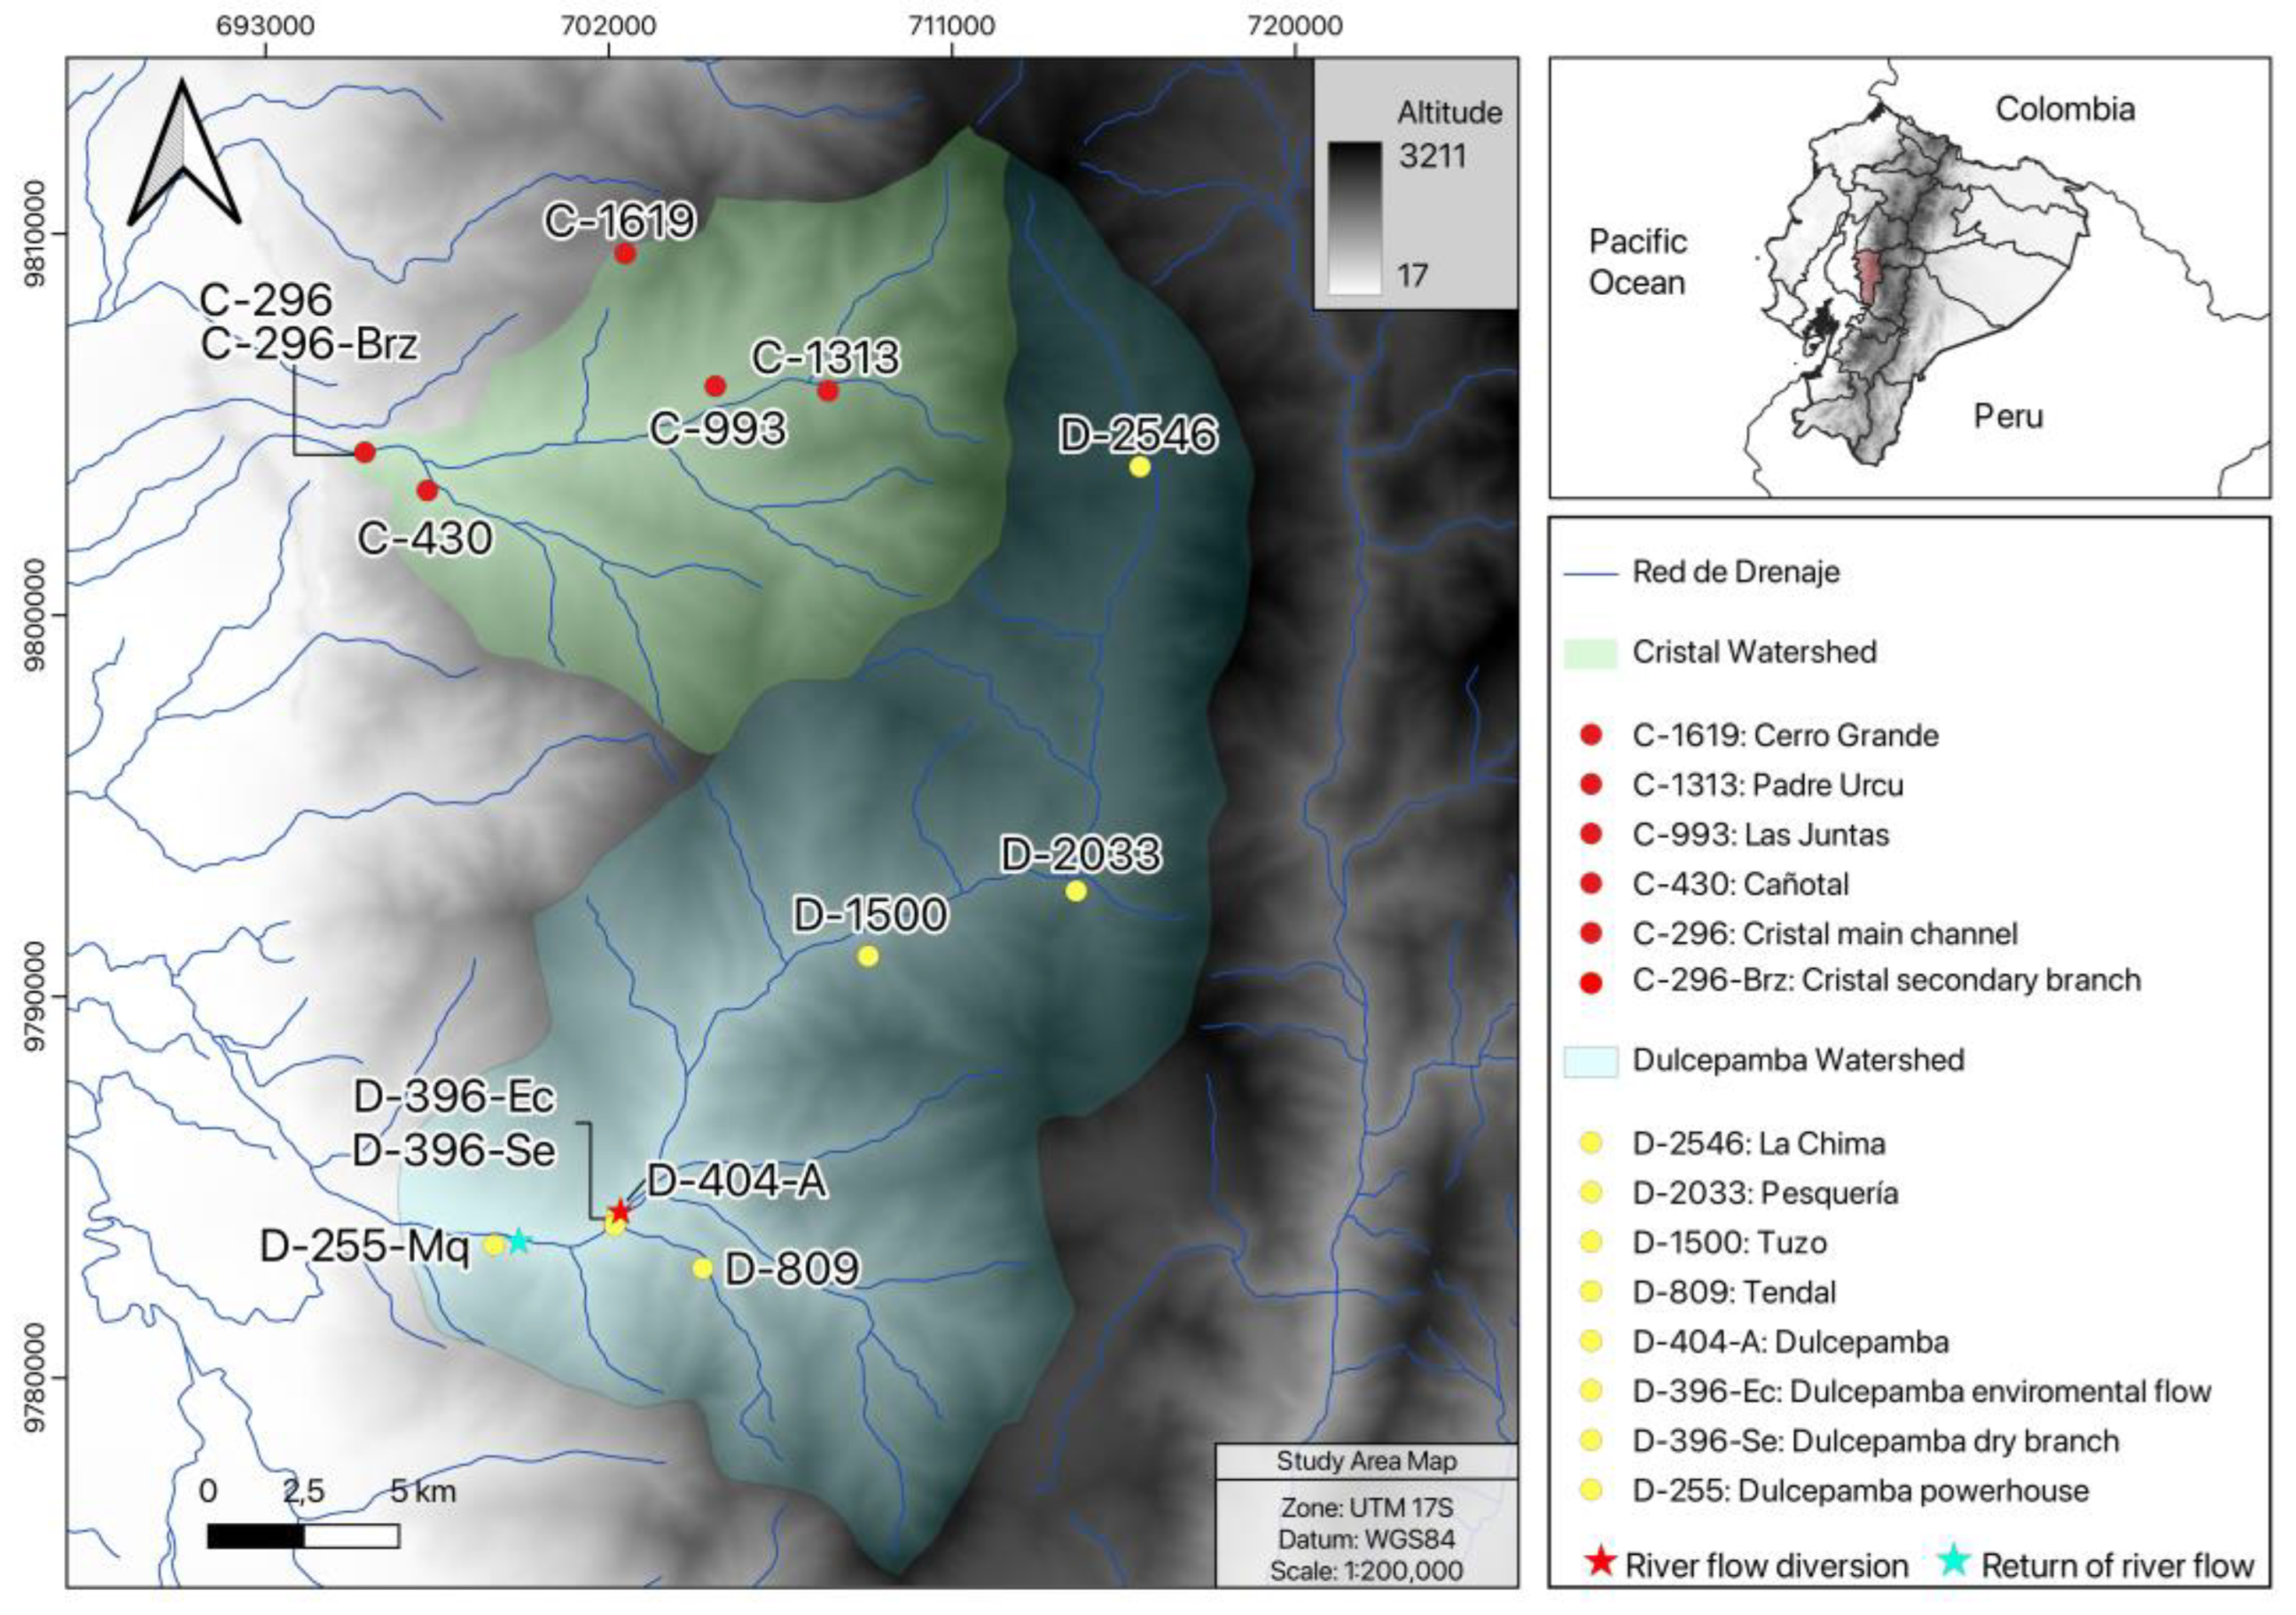
This study was conducted in the Dulcepamba and Cristal River basins (
Figure 1), located on the Pacific slopes of the central Andes in Ecuador. It was conducted between 30 November and 4 December 2023, during the dry season, which typically occurs between June and December. Both basins are part of the larger Babahoyo River watershed, one of the tributaries of the Guayas River. The study sites were selected from an ecological perspective, aiming to distribute them at regular intervals along the altitudinal gradient (approximately every 500 m of elevation change) to ensure comparability and gain a better understanding of the natural changes in the river along its course. However, poor accessibility constrained the selection of sampling locations, forcing adaptation to the nearest accessible site and preventing a fully homogeneous distribution along the altitudinal gradient.
The Dulcepamba River basin covers a larger area, reaches higher elevations, and has a higher water discharge on the lowest reaches (480 km
2 of watershed area, 3200 m.a.s.l. of maximum elevation and of discharge 6.27 m
3/s at 255 m.a.s.l.) compared to the Cristal River watershed (168 km
2 of watershed area, 3040 m.a.s.l. of maximum elevation and 4.51 m
3/s of discharge at 296 m.a.s.l.). The Dulcepamba River basin faces major agricultural and livestock pressure, with 83.9% of the area used for human activities: 49.3% for planted pastures, 26.1% for short-cycle crops, and 8.4% for perennial crops. In contrast, forest and shrub vegetation occupy only 16.2% of the area, comprising 9.1% natural forest and 7.1% shrubs [
26]. The basin is also impacted by the presence of the San José del Tambo Hydroelectric Plant, with an installed power of 8 megawatts, which diverts a substantial portion of the river’s flow for energy production [
27]. In this basin, eight sampling points were selected, ranging from 2546 m to 255 m above sea level (m.a.s.l.) (
Figure S1).
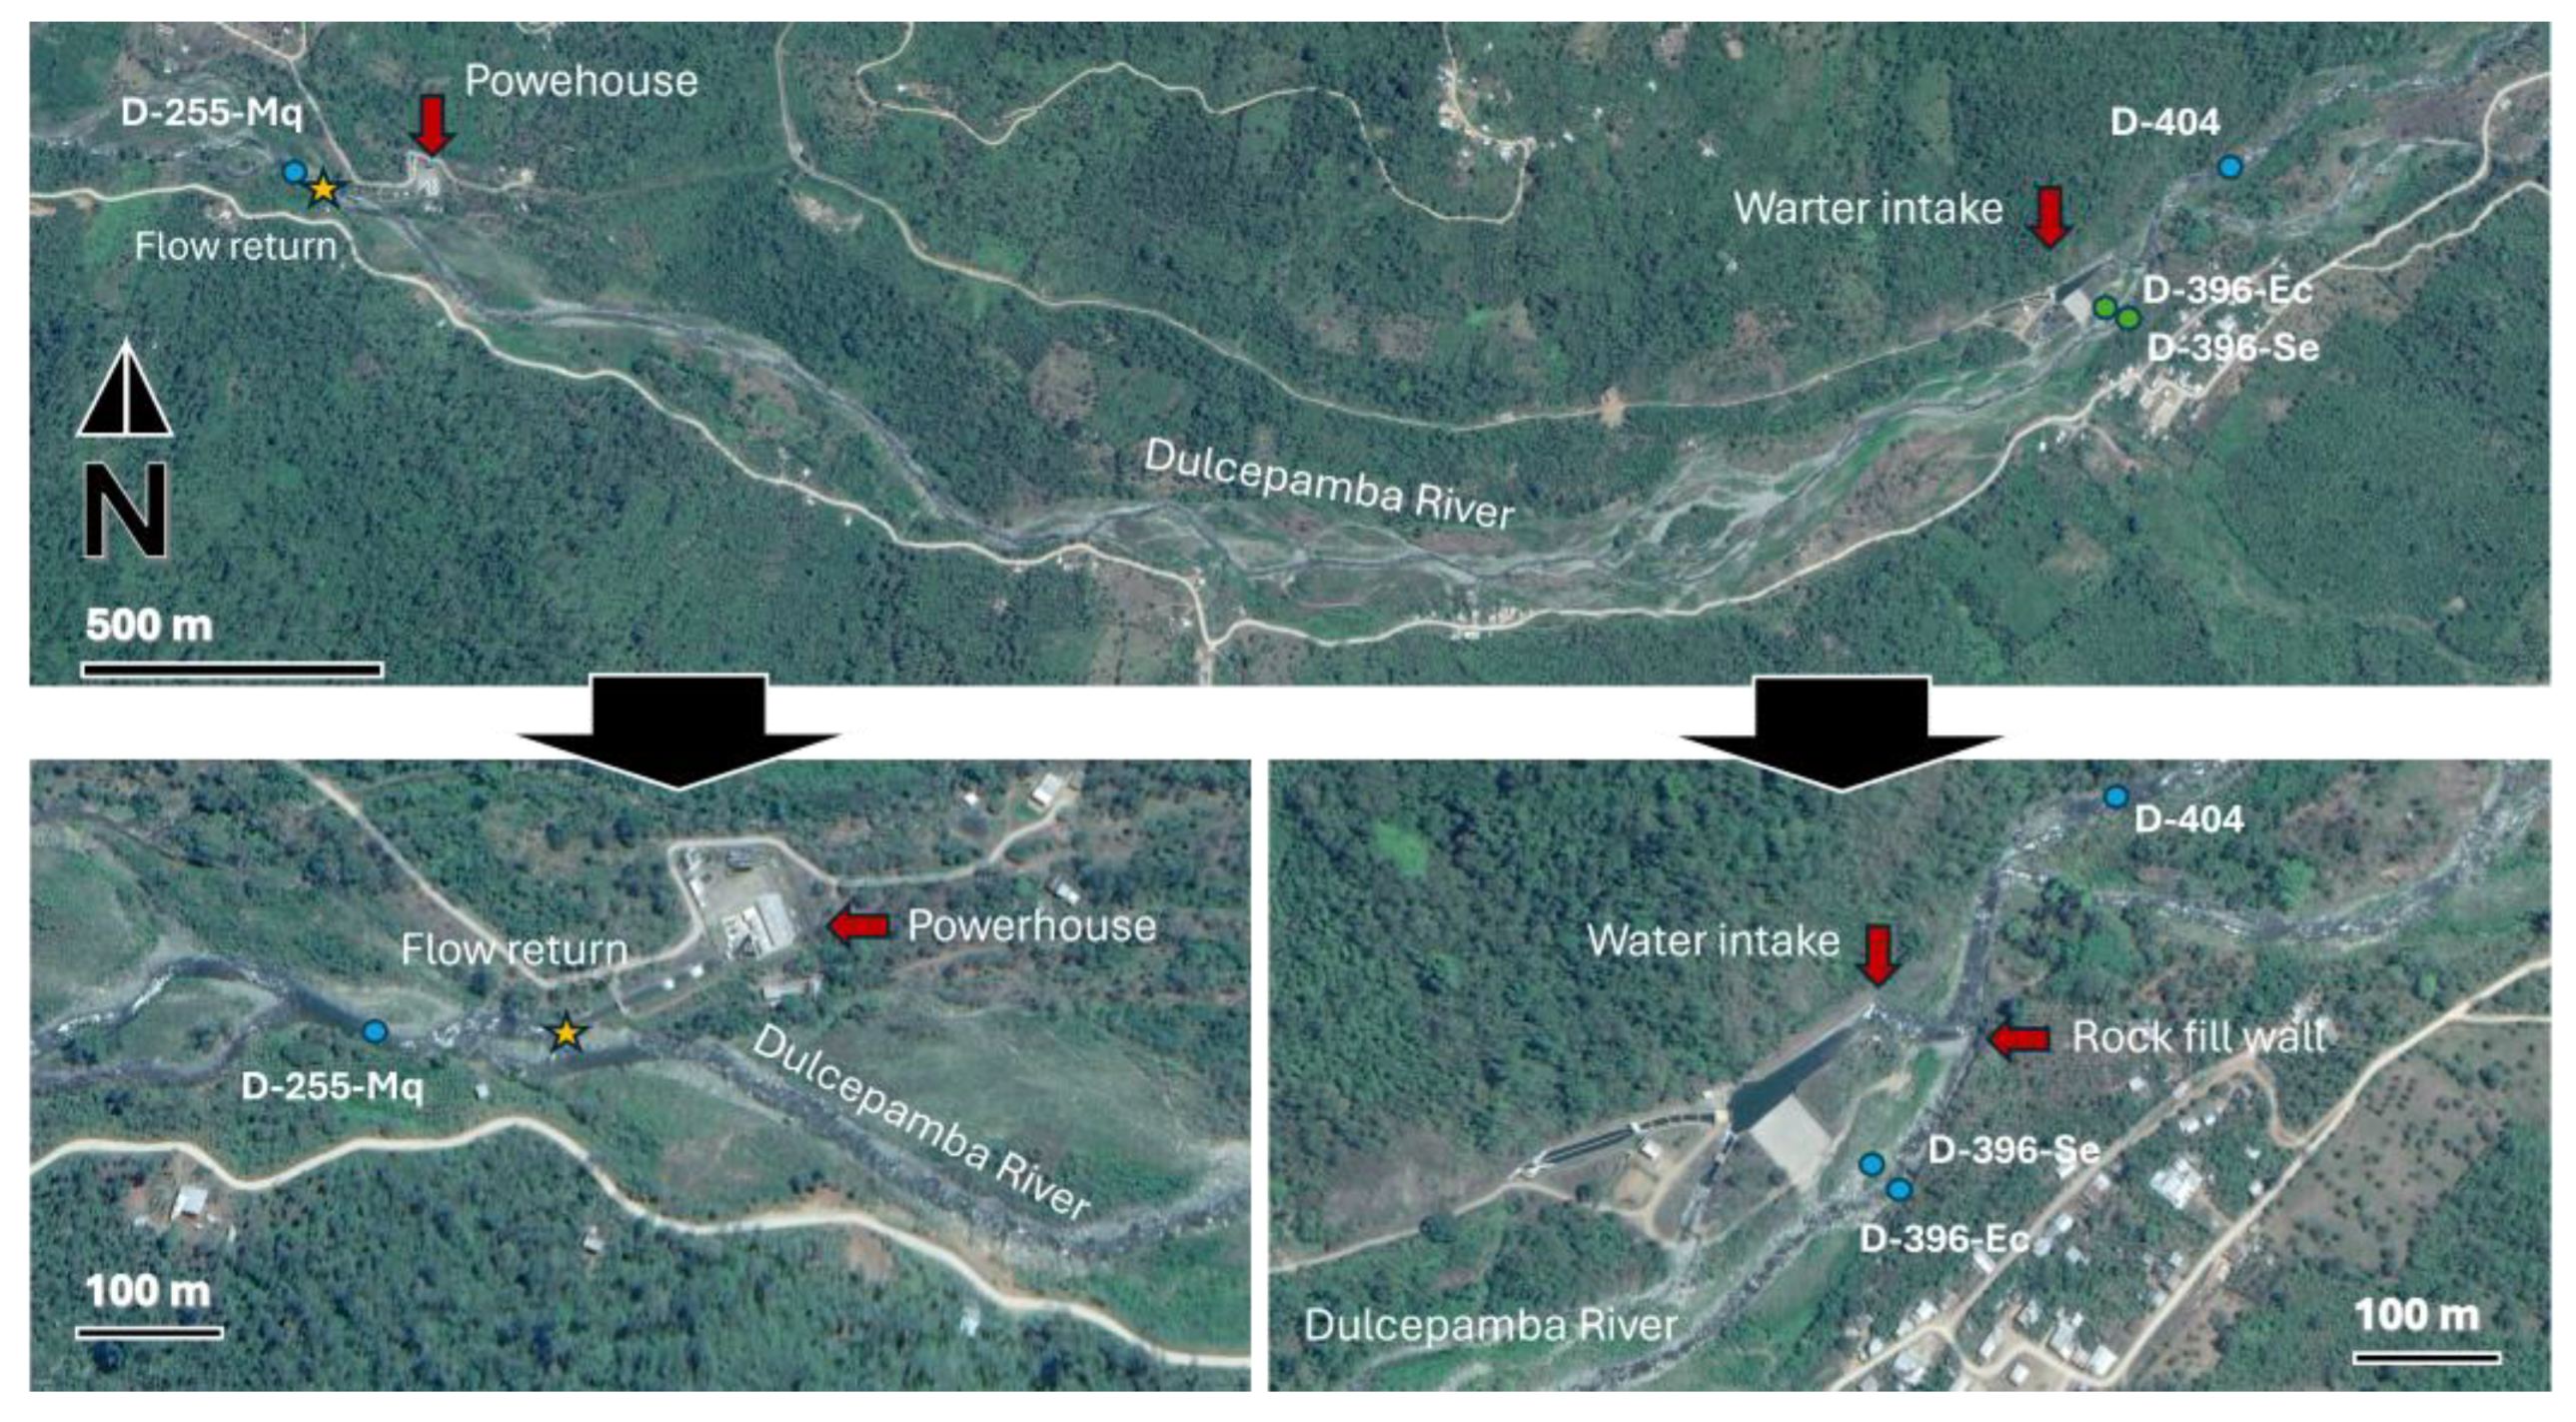
The hydroelectric power plant includes a water intake infrastructure located around 400 m.a.s.l., where a temporary rock-fill diversion wall (25 m length, 6 m wide, and between 1 and 2 m tall) is deployed during the dry season to direct the entire flow of the Dulcepamba River into its facilities. The remaining flow leaks through the rock-fill diversion wall into what is designated as the environmental flow, where the river splits into two branches. One branch becomes completely dry during the dry season, while the other maintains some flow, though it can approach near-dry conditions depending on the year. The water diverted at the intake is transported around 2 km kilometers through a pipe system and released to the powerhouse, which operates with a 130 m drop, before being returned to the Dulcepamba River. At the beginning of the rainy season, the rock-fill diversion wall at the water intake facility is removed to prevent infrastructure damage from major flooding events.
However, the construction of the water intake infrastructure caused the Dulcepamba River to lose its original channel, redirecting its flow along a new course [
28]. This hydrological alteration redirected floodwaters toward the village of San Pablo de Amalí. This modification contributed to a major flooding event in March 2015, which led to four fatalities, the destruction of homes, and large loss of farmland [
27].
To better assess the potential ecological impacts of the hydroelectric infrastructure, four sampling sites were strategically selected in its vicinity to evaluate potential alterations (
Figure 2). A reference site (D-404-A) was located 250 m upstream of the diversion, ensuring it remained unaffected by the infrastructure. Two sites were established within the environmental flow branches: one in the branch that maintains flow (D-396-Ec) and another in the branch that typically dries out during the dry season (D-396-Se). The latter site was completely dry three weeks before the sampling campaign but began flowing again after recent rainfall—an unusual occurrence for this typically dry time of year. The flow resumed after the hydroelectric company opened a small breach in the temporary rock wall to mitigate potential damage to their intake infrastructure from anticipated higher discharge. After the water intake, the Dulcepamba River spans 2.75 km downstream (dropping 145 m in elevation below) to the point where the diverted water is returned to the main channel. A final site (D-255-Mq) was positioned immediately downstream of the powerhouse, where the river regains its full discharge.
The Cristal River basin, located immediately to the north of the Dulcepamba River, was selected as a control basin due to several shared environmental characteristics. Both basins lie within the same geographic region, experiencing similar climate, geomorphology, bioclimatic zones, and ecosystems, and hosting comparable biodiversity compositions. These similarities make the Cristal River a suitable reference for assessing natural conditions. However, the Cristal River basin differs from the Dulcepamba River basin because it contains lesser amounts of anthropogenic disturbances. Although there is no land use data, the available satellite images and personal observations point out that the basin is extensively covered by native forests, and agriculture and livestock activities occupy small patches in the basin. Moreover, the lack of any hydropower development enables the basin to be used as a baseline for comparison in this study.
A total of six sites were sampled in the Cristal River basin (
Figure S1). The lowest locality in the basin, situated at 296 m.a.s.l., included a main channel site (C-296) and another site on a lateral, shallower branch with lower discharge (C-296-Brz). Due to the substantial ecological differences between them, both branches were sampled as separate sites. The highest sampling site was located at 1619 m.a.s.l., as access to headwater streams was completely restricted by the absence of roads or trails in the extremely steep terrain.
2.2. Habitat Characterization and Integrity
At each sampling site, physical and chemical parameters were recorded once. Water temperature (°C) and dissolved oxygen (mg/L and %) were measured using a YSI Pro20 dissolved oxygen meter, pH was measured using a Hanna HI98129 tester, and for conductivity measurements (µS/cm), a YSI Pro30 Conductivity Meter was employed. Average depth (cm), average width (m), flow velocity (m/s), and substrate composition (percentages of fines (<2 mm), gravels (2–64 mm), cobbles (65–256 mm), and boulders (>256 mm) and shading percentage were recorded across four transects at each site, with three sampling points per transect (located at one-quarter, one-half, and three-quarters of the river’s total width), distributed at 25 m intervals along a 100 m reach. Flow velocity and water depth were measured using a Global Water Flow Probe Hand-held Flow meter. Riparian shading was estimated visually as a percentage considering the shading estimations on each of the transect points. Wet width and distances between transects were measured using a linear tape measure. All the aforementioned hydro-chemical and habitat data were collected by the same person to minimize subjectivity. These parameters were used to identify environmental gradients influencing biotic communities.
Habitat integrity was further assessed using the Andean adaptations of the Fluvial Habitat Index (IHF) and the Andean Riparian Quality Index (QBR-And) [
29]. The Riparian Quality Index evaluates the quality of riparian forests in Andean regions, focusing on vegetation structure, connectivity, and alteration. It is an easily applicable field method ideal for assessing riparian habitat conditions [
30]. The Fluvial Habitat Index (IHF) characterizes stream and river habitats by assessing physical variables like substrate, flow diversity, and channel morphology, highlighting habitat heterogeneity’s role in supporting aquatic biodiversity [
31]. Both indices follow a qualitative visual assessment methodology; therefore, all the evaluations were conducted by the same person to minimize subjectivity.
Aquatic macroinvertebrates were used as bioindicators of water quality. Sampling followed the European Union’s “20-kick” protocol, which ensures a multihabitat approach by targeting representative microhabitats such as rocky substrates, submerged vegetation, and sandy areas. Collected specimens were identified at the family level, and their presence data were used to calculate the BMWP-Col (Biological Monitoring Working Party-Colombia) [
32] and AAMBI (Andean–Amazon Biotic Index) indices for ecological quality assessment [
33]. Both indices are regional adaptations of widely used macroinvertebrate-based indices, providing a sensitive evaluation of water quality.
Fish-based indices could not be used to evaluate ecological integrity, as their effective application requires extensive ecological information about species’ life histories, habitat requirements, and tolerance thresholds, which is currently unavailable for most fish species in Ecuador.
2.3. Hydrological Monitoring
In the Dulcepamba basin, additional long-term discharge data were incorporated from the local nonprofit Proyecto Dulcepamba. They conducted discharge measurements of the Dulcepamba River and the environmental flow every two weeks during the months of June through January during the years 2013 through 2018. During 2019, the team performed these measurements every month between August and December. During the years 2020–2023, the Dulcepamba Project team performed the discharge measurements once or twice during the dry season. We analyzed these data as part of our study to evaluate the frequency in which discharge in the Dulcepamba River exceeded the established environmental flows (1.46 m3/s) for the time period of 2013–2023.
Discharge measurements were conducted using the methodology explained in Water Supply Paper 2175 by the United States Geological Survey (USGS) [
34]. They began by measuring the wet width of the Dulcepamba River channel in a relatively uniform cross-section using a measuring tape, always at approximately the same location. Then, the transect was divided into 10 or 15 evenly spaced sections (depending on the total width of the channel). Depth was measured in each section using a retractable meter stick and the depth was multiplied by the width of each section to calculate the area. They used a calibrated Price AA USGS current meter to measure the current velocity over a period of 40 to 90 s in each of the 10 or 15 sections. If the water depth was less than 50 cm, they measured the velocity at 60% of the depth from the water surface. If the water depth in any section was 50 cm or more, they measured the velocity at 20% below the surface and 80% below the surface and averaged it. The area of each section was multiplied by the velocity of that section to calculate the discharge for each section. Finally, the discharge of each of the 10 or 15 sections was summed to obtain the total discharge of the river.
Measurements of environmental flows downstream of the catchment of the hydroelectric plant were compared against the legal minimum requirement of 1.46 m
3/s, as established in 2019 by the National Water Secretariat of Ecuador (SENAGUA), as part of an administrative resolution addressing issues with the studied hydroelectric plant [
35].
However, the discharge data used in this study for statistical analyses were limited to measurements taken during the same days as the environmental and biodiversity data collection. Historical discharge data provided by Dulcepamba Project are included to illustrate flow conditions once the hydroelectric plant started operating.
2.4. Fish Communities
Fish were sampled using electrofishing technology (Hans Grassl model IG200/2D; 300–600 V, 0.2–2 A). Sampling effort was standardized by recording the duration of electrofishing at each site. While an approximate surface area of 100 m2 was sampled at each site, abundances were calculated as catch per unit effort (CPUE) per minute of electrofishing to ensure comparability across sites, as time was considered a more reliable metric than surface area estimation. For each species, CPUE was calculated by dividing the total number of individuals of that species captured at a given site by the total electrofishing time (in minutes). In cases where a species was not captured at a site, the CPUE was recorded as zero, reflecting its absence despite the sampling effort. The total CPUE for each species across all sites was calculated as the sum of the CPUE values from the sites where the species was present.
Captured fish were maintained alive in an aquarium equipped with an oxygen pump, identified, enumerated, photographed, and released back into the river at the end of sampling. Representative specimens were retained as vouchers. These specimens were anesthetized using 2% lidocaine hydrochloride and fixed in 10% formalin for subsequent analysis at the Museum of Zoology of the Universidad Tecnológica Indoamérica (MZUTI) in Quito. Laboratory identification was conducted using the Guide to Freshwater Fish of the Western Slope of Ecuador [
36], supplemented with detailed descriptions for
Chaetostoma identification by Lujan and collaborators [
37].
2.5. Data Analysis
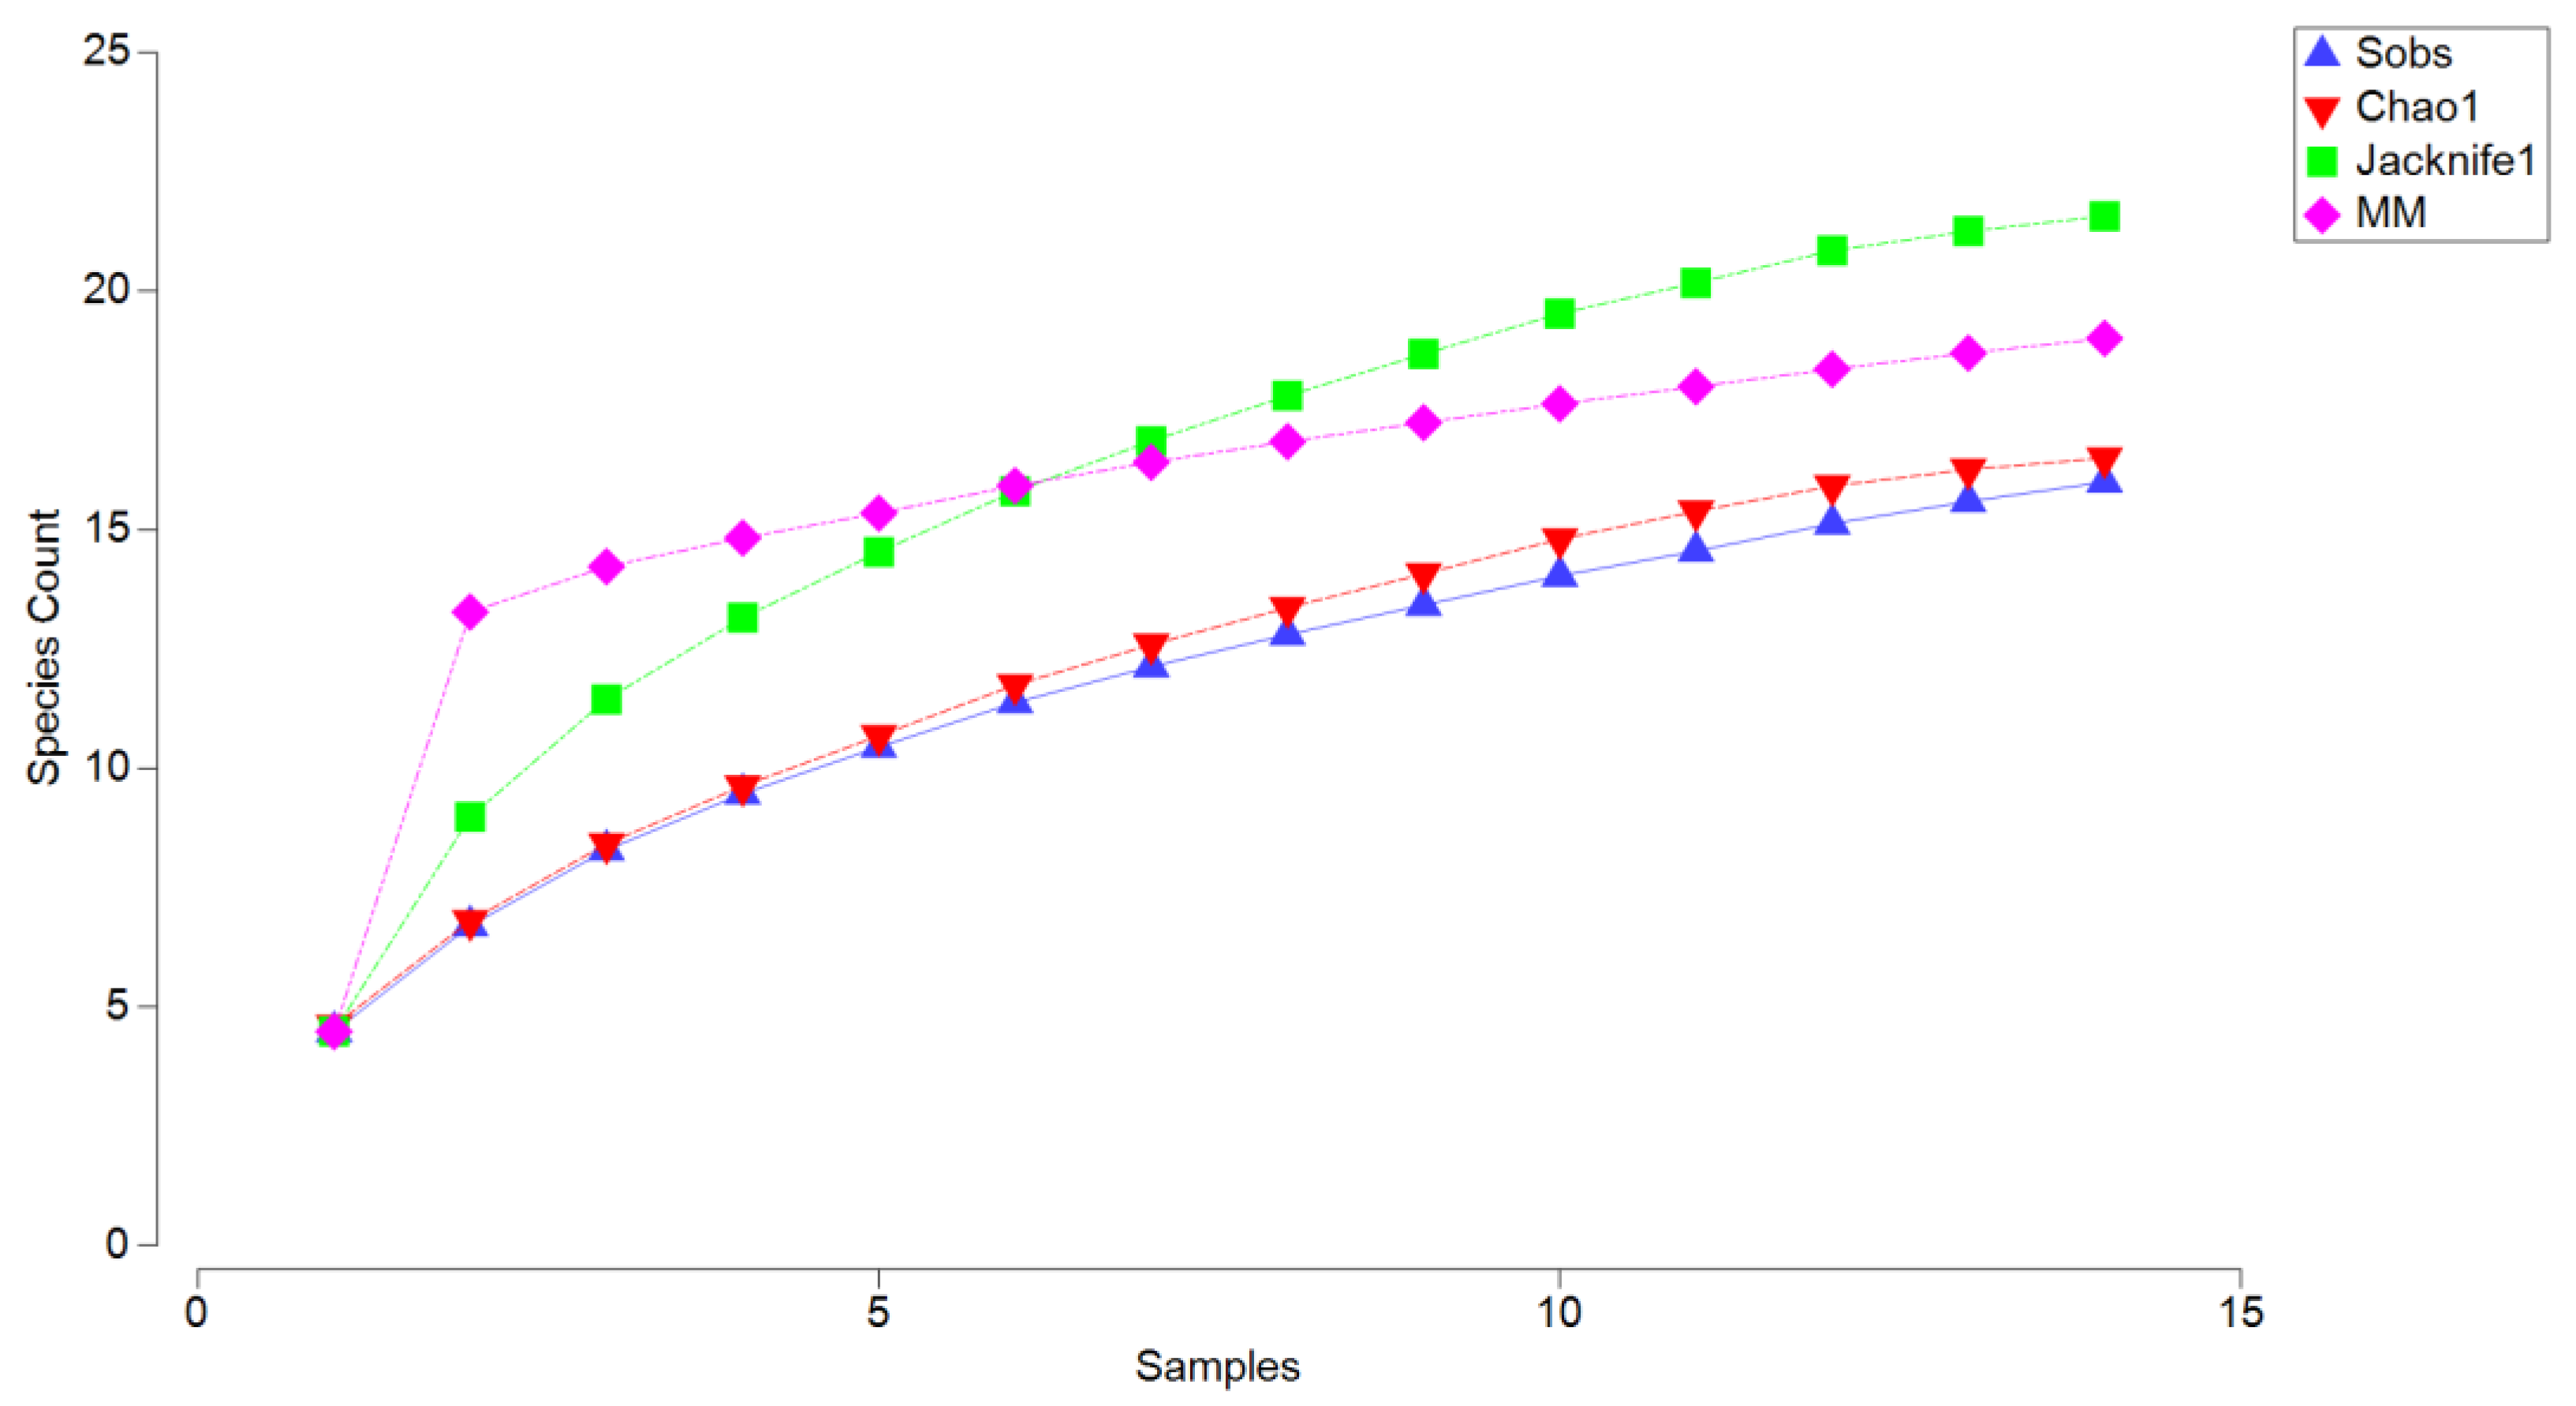
The completeness of the sampling effort was assessed using species accumulation curves and richness estimators, where observed richness (Sobs) was compared to Chao1, Jackknife1, and Michaelis–Menten models to estimate undetected species.
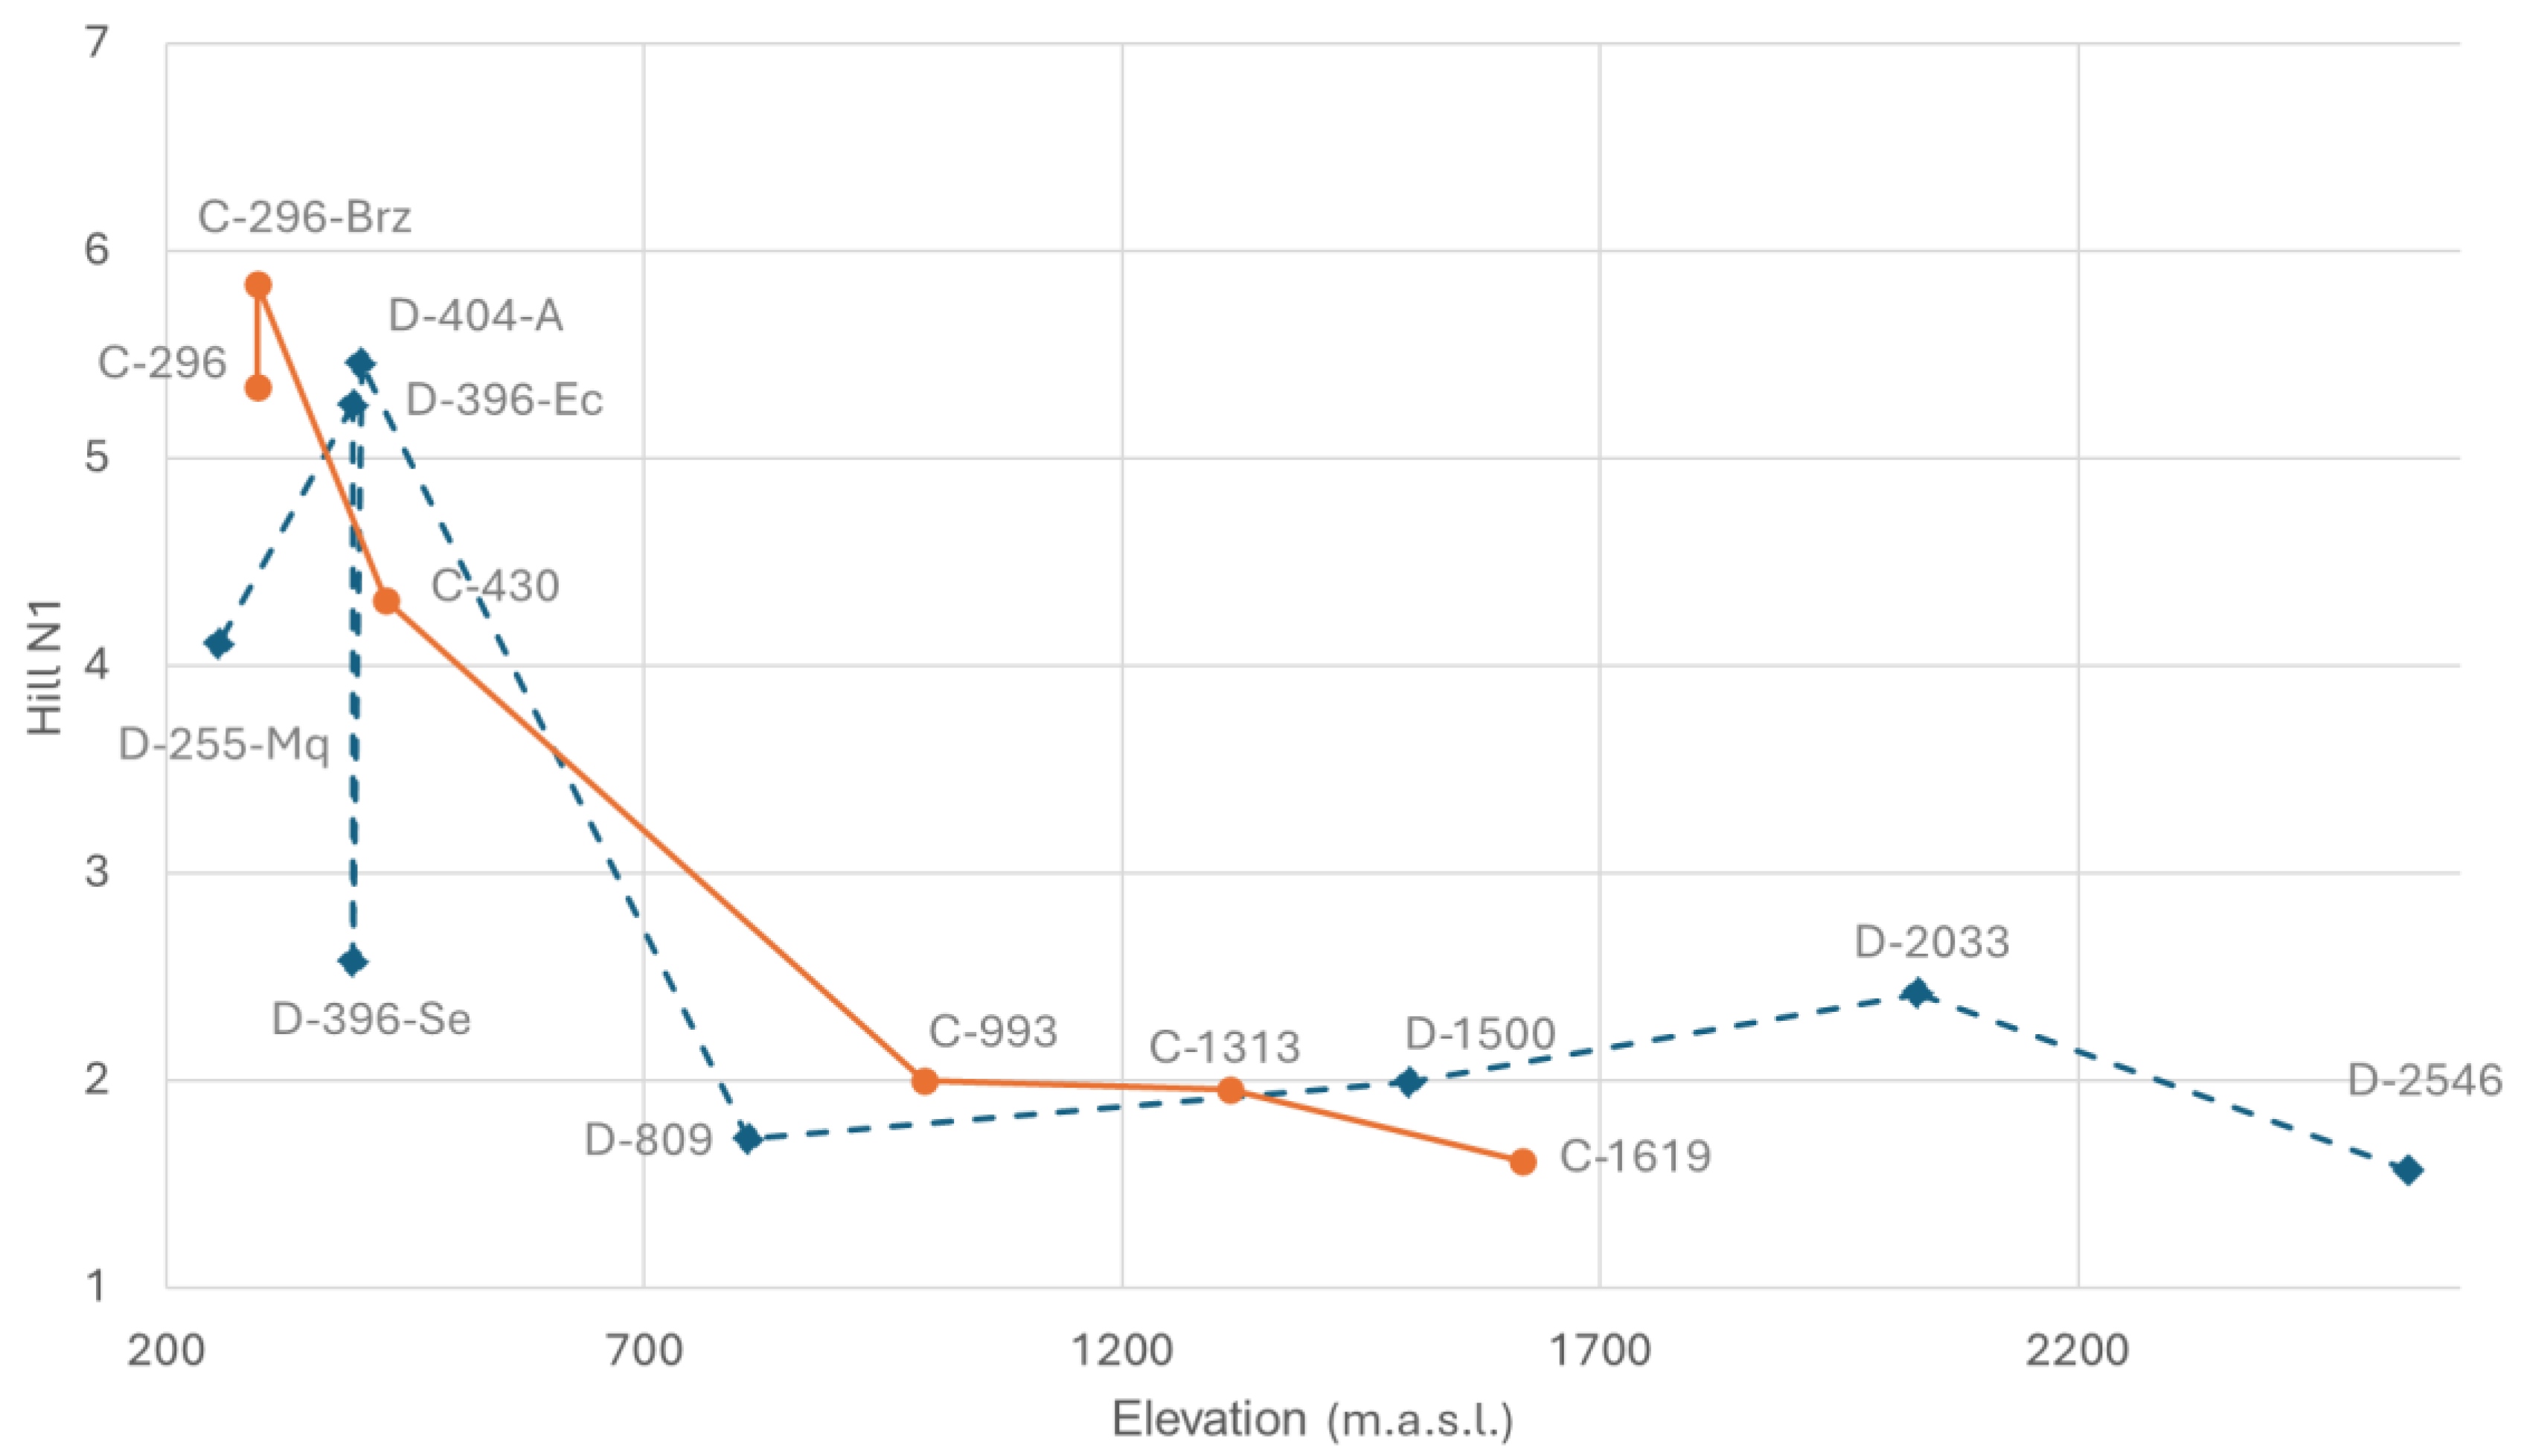
Species richness and diversity were analyzed along the altitudinal gradient. The total number of species was calculated for each site, and diversity was evaluated using Hill’s Index of Diversity (Hill N1) (number of equally common species), which is the exponential of the Shannon–Weiner index.
To assess and compare all the pairwise relationships between fish-related variables (species richness, CPUE, effective species diversity (Hill N1) and elevation in the Dulcepamba and Cristal River basins, Pearson correlation analyses were performed. This analysis aimed to identify trends in fish diversity and abundance along the elevation gradient across both basins. Correlation coefficients (r-values) measured the strength and direction of linear relationships, while p-values assessed the statistical significance of these correlations. Significance was evaluated using permutation tests with 999 iterations to account for potential non-normal data distributions.
A nonparametric Wilcoxon signed-rank test was used to assess statistical differences in river discharge distribution between the upstream reference site and the environmental flow channel. Additionally, a one-sample Wilcoxon signed-rank test was conducted to evaluate whether discharge values significantly differed from the legally established minimum flow (1.46 m
3/s) [
38]. The normal approximation of the test statistic (z) is reported [
39].
Habitat characterization was conducted using Principal Component Analysis (PCA). Prior to conducting the Principal Component Analysis (PCA), a 1-to-1 correlation analysis was performed using the Pearson correlation coefficient. Variables that exhibited a high degree of correlation (|r| > 0.7) were considered redundant. To address this, only one variable from each highly correlated pair was retained. The decision on which variable to keep was based on its ecological relevance and its capacity to capture distinct environmental gradients relevant to the study objectives. The PCA was based on a combined matrix of hydro-chemical parameters (discharge, temperature, dissolved oxygen, pH, and conductivity), habitat structural features (mean depth, mean width, water velocity, substrate type, and shade percentage), and environmental integrity indices (QBR-And, IHF, BMWP, and AAMBI).
To complement the PCA and objectively assess whether environmental variables differed between the Dulcepamba and Cristal River basins, an ANOSIM (Analysis of Similarities) was performed. The goal was to statistically determine if the grouping patterns observed in the PCA reflected significant differences between the two basins. The ANOSIM was run with 999 permutations to calculate the R statistic and p-value, providing a robust evaluation of environmental variation across the basins. To determine how many axes to retain in the PCA, a scree plot was utilized. The plot revealed a clear inflection point, indicating that additional components beyond the first two contributed minimal explanatory power. This decision was further supported by the broken stick model, which showed that eigenvalues for PC1 and PC2 exceeded those expected under random distribution. These combined methods ensured a robust selection of principal components for further analysis. The analysis aimed to classify streams according to their habitat traits and identify key environmental gradients influencing their natural features.
Fish assemblages were analyzed using Non-metric Multidimensional Scaling (nMDS) based on Bray–Curtis similarity of log-transformed abundance data. To identify the most relevant environmental variables, a correlation analysis was performed. From each group of correlated variables, the most representative was selected and subsequently superimposed onto the nMDS analysis using the vector fitting routine available in PRIMER-e. This method calculates correlations (Pearson’s r) between each environmental variable and the NMDS axes projecting relationships as vectors. To quantify the comparison of fish species composition between the Dulcepamba and Cristal River basins and complement the qualitative patterns observed in the nMDS, an ANOSIM was conducted. This test provided an R statistic and p-value to determine whether observed differences in fish assemblages between basins were statistically significant.
To explore the relationship between fish species composition and environmental characteristics, a Canonical Correspondence Analysis (CCA) was performed. The environmental parameters used in the PCA were combined with fish abundance data to identify key drivers of species distribution. For the PCA and CCA, environmental data and mean depth were log (x)-transformed, while habitat structure data with a bimodal distribution were arcsine (√x)-transformed. Fish relative abundance data were square root transformed to down weight dominant species. Significance tests were performed using 999 permutations to verify the robustness of the PCA and CCA models.
All analyses were conducted using PRIMER-e 7 software [
40], except for the CCA, which was carried out using PAST version 4.13 software [
41].
3. Results
3.1. Fish Diversity
A total of 696 fish individuals were captured, belonging to 10 families, 12 genus, and summing up 16 different species. Most of the fish belong to the Astroblepidae family (419 individuals, 60.2% of the total captures), followed by Characidae (151 individuals, 21.7% of the total) and Parodontidae (54 individuals, 7.6% of the total).
The most common species, based on the total number of captures for both basins, was Astroblepus cf. cyclopus (Humboldt 1805), with 243 individuals recorded, followed by Brycon atrocaudatus (Kner 1863) (n = 132) and Astroblepus grixalvii (Humboldt, 1805) (n = 158). These species also had a high occurrence across multiple sites, indicating their broad distribution within the study area. Conversely, several rare species were identified, captured in only one or two sites. These include Astroblepus sp. (n = 1), Eretmobrycon brevirostris (Günther 1860) (n = 1), Lebiasina astrigata (Regan 1903) (n = 4), and Pimelodella modesta (Günther 1860) (n = 4), suggesting more restricted distributions or specialized habitat requirements. None of the captured species have been categorized as threatened by the IUCN.
In the Dulcepamba River basin, total fish captures were lower compared to the Cristal River basin. The average catch per unit effort (CPUE) in the Dulcepamba was 1.30 fish/minute (235 captured fish in 181 min of sampling), compared to 4.66 fish/minute in the Cristal (461 captured fish in 99 min of sampling) (
Table 1). Considering the variations in the number of sites sampled per basin, the average catch per unit effort (CPUE), calculated as the mean across sampling sites, was 1.39 fish/minute in the Dulcepamba River (eight sites) and 4.27 fish/minute in the Cristal River (six sites).
Astroblepus cf.
cyclopus and
Brycon atrocaudatus were also the species with the highest CPUE values, with 13.55 and 6.39 fish captured per minute, respectively.
Three sites in the Dulcepamba Basin stand out with CPUE values below 1 fish/minute: D-2546, one of the sources of the Dulcepamba River (2546 m.a.s.l.), heavily impacted stream in the middle of pastureland; D-396-Se, the environmental flow branch of the Dulcepamba River (396 m.a.s.l.) that is dry in summer due to the diversion of flow to the hydroelectric plant’s infrastructure; and D-255-Mq, in the Dulcepamba River (255 m.a.s.l.) after the water is returned to the main channel below the powerhouse.
The completeness analysis (
Figure 3) revealed that the observed species richness (Sobs) reached 16 species after 15 sampling units, indicating that the sampling effort captured most of the community but did not fully saturate. The Jackknife1 estimator predicted a higher richness of 20 species, and the Michaelis–Menten (MM) model, which estimates asymptotic richness, also stabilized at approximately 20 species. These indices suggest that the sampling effort captured about 80% of the total expected richness, reflecting the sensitivity of these models to moderately rare species and indicating that further sampling could reveal additional diversity. In contrast, the Chao1 estimator projected a richness of 17 species, a slight increase over the observed richness. Chao1 is considered the most appropriate index for this dataset because it is specifically designed to account for unseen species based on the presence of singletons (species represented by a single individual) and doubletons (species represented by two individuals). This makes it particularly suited to sampling efforts where rare species are expected to contribute significantly to community structure. Accordingly, the Chao1 estimate suggests that the sampling effort captured approximately 94% of the total expected richness, demonstrating its robustness in accounting for the nature of the sampling and the influence of rare species.
While analyzing correlations between elevation, species richness, CPUE, and Hill N1 (
Table 2) for the Dulcepamba basin, species richness and CPUE showed a very strong and significative positive correlation (
r = 0.871,
p = 0.005). For the Cristal basin, the correlation between elevation and Hill N1 was very strong and negative (
r = −0.943,
p = 0.005), showing a substantial decline in diversity with increasing elevation. As in Dulcepamba, species richness and CPUE in the Cristal River were strongly and significantly correlated (
r = 0.941,
p = 0.005). Other correlations were weak and not significant. Overall, both basins showed significant positive correlations between species richness and CPUE, with elevation having a stronger negative effect on diversity (Hill N1) in the Cristal River.
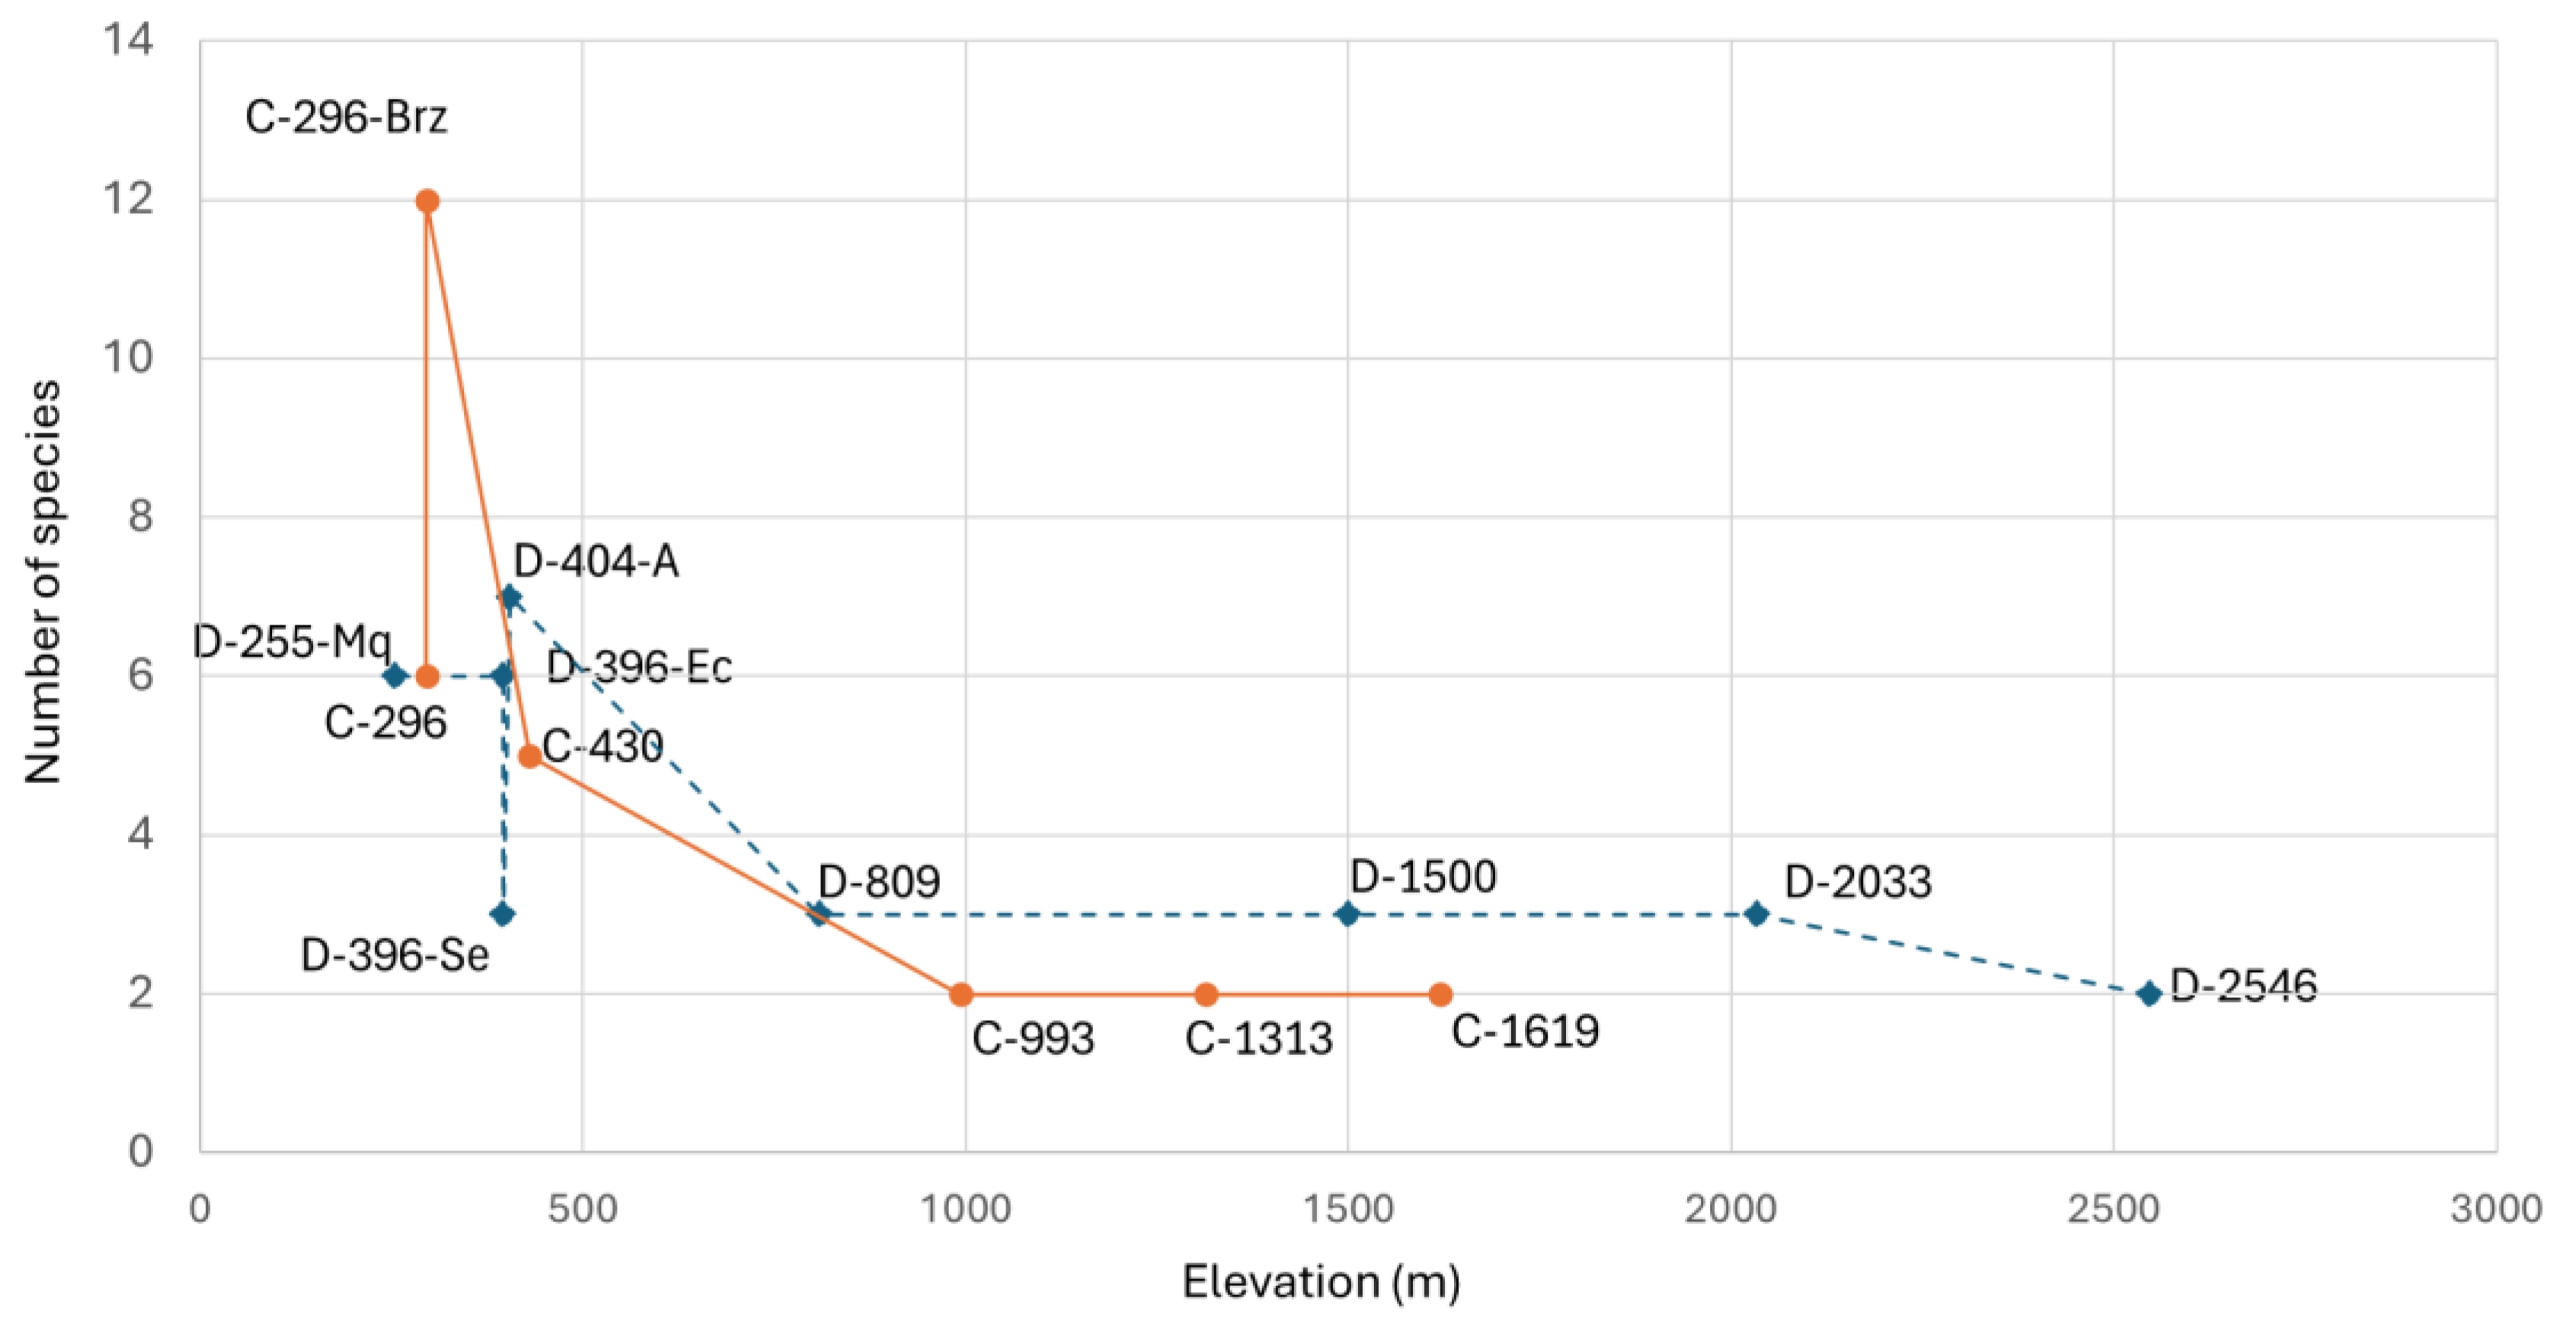
The relationship between species richness and elevation in the Dulcepamba and Cristal River basins is detailed in
Figure 4. As anticipated by the correlation analysis, a clear decline in species richness is observed as elevation increases. At lower elevations (below 500 m.a.s.l.), species richness was highest, particularly at site C-296-Brz with 12 species, followed by C-296 and D-255-Mq, each with 6 species. However, the difference between the number of species in the main branch (6 species) and the secondary branch (12 species) of the Cristal River at 296 m.a.s.l. stands out. A similar pattern was observed in the two branches of the Dulcepamba River at 396 m.a.s.l.; the branch that had been dry weeks before (D-396-Se) supported only three species, whereas the branch with constant discharge (D-396-Ec) recorded six species. At mid-to-high elevations (above 800 m.a.s.l.), species richness declined sharply, with sites supporting only two or three species, predominantly climbing catfishes (
Astroblepus cyclopus,
Astroblepus cf.
eigenmanni (Regan, 1904),
Astroblepus cf.
grixalvii and Astroblepus sp.) (
Table 1). An exception was observed at the Tendal River site (D-809), which recorded three Trichomycterids. At the highest elevation, site D-2546 (2546 m.a.s.l.), species richness was lowest, with only two species: one unidentified individual of the
Astroblepus genus and five invasive rainbow trout,
Oncorhynchus mykiss (
Table 1).
Hill N1 follows a similar pattern to species richness as anticipated by the correlation analysis, increasing downstream, particularly below 800 m.a.s.l. (
Figure 5). The difference between D-404-A and D-396-Ec compared to D-396-Se is more pronounced, emphasizing the impact of low water discharge and channel drying. In contrast, the Hill N1 values for the two sites at the lowest reach of the Cristal River (C-296 and C-296-Br) reduce their dissimilarity and show a notable difference when compared to the Dulcepamba River at a similar elevation (D-255-Mq), where Hill N1 is lower. This is particularly striking as the Hill N1 value of this Dulcepamba site is even lower than at sampling points located around 400 m.a.s.l. in the same river.
3.2. Hydrological Analysis
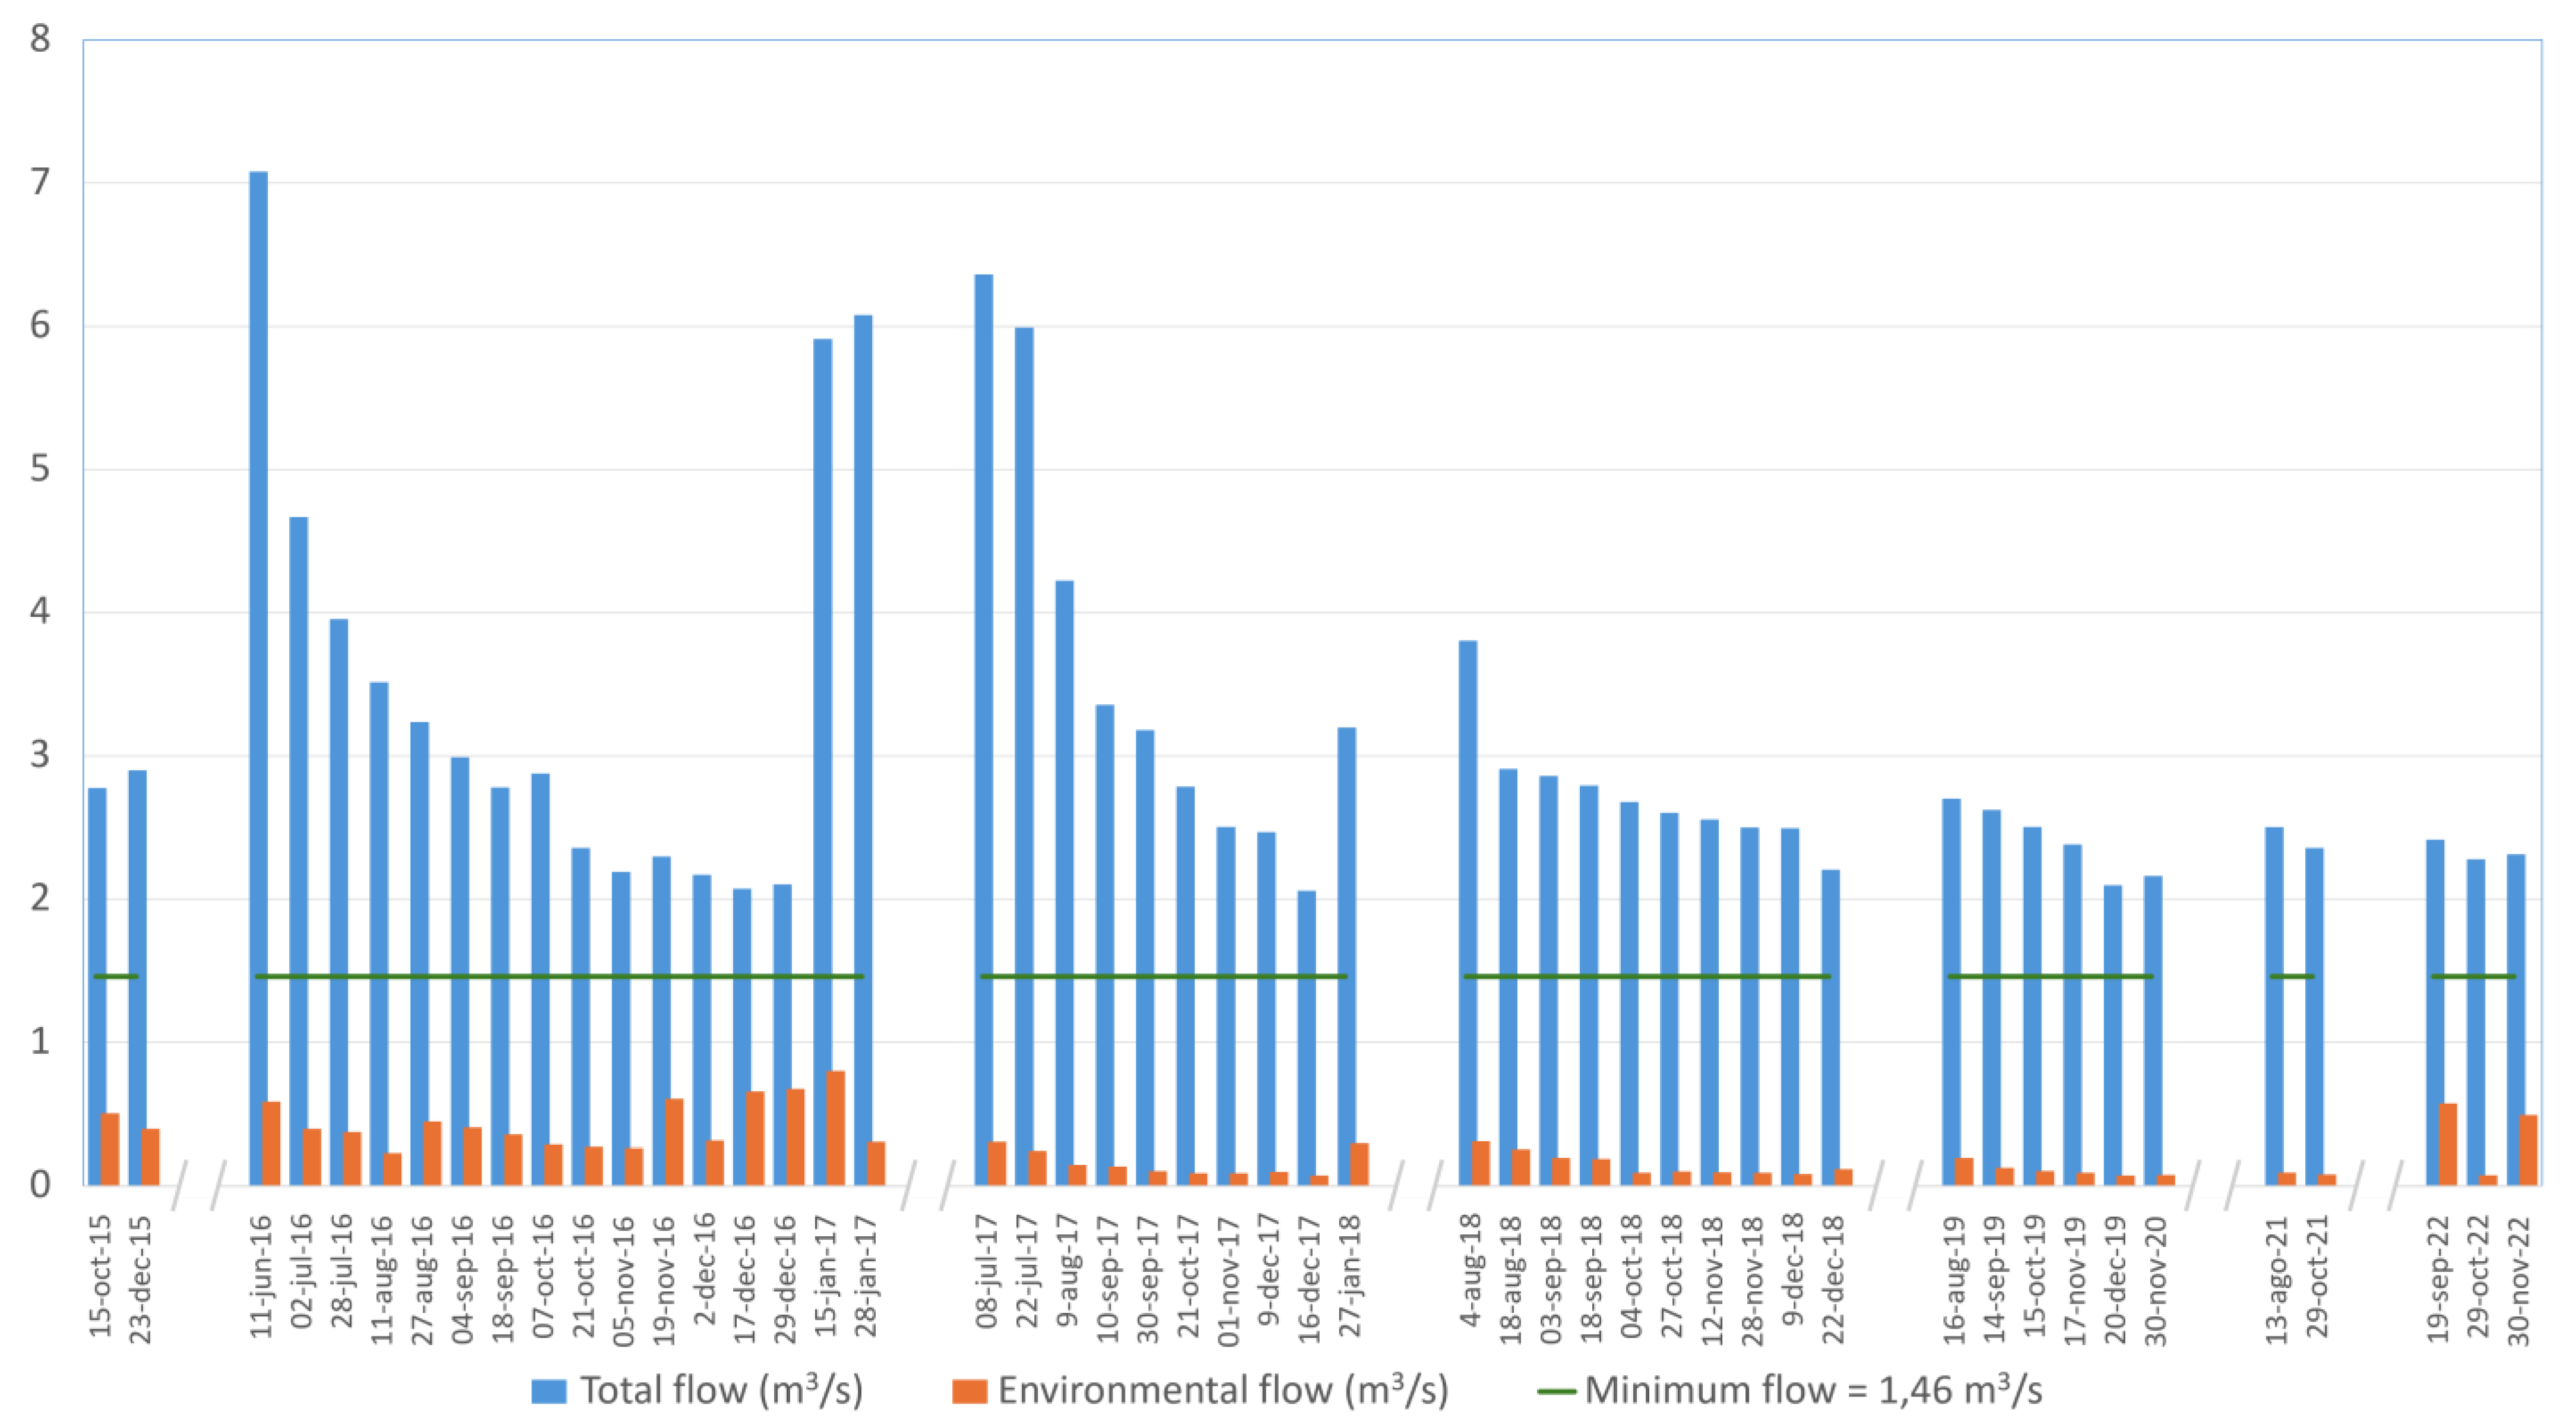
The discharge measurements in the Dulcepamba River from 2015 through 2023 highlight a recurring failure to meet the legally mandated environmental flow of 1.46 m
3/s (
Figure 6). The Wilcoxon signed-rank test revealed significant differences in discharge between the upstream site and the environmental flow channel (
z = 16.81, d.f. = 48,
p < 0.01). Comparisons with the legally established minimum flow also showed significant differences for both the upstream discharge (
z = 6.093, d.f. = 48,
p < 0.01) and the environmental flow (
z = 6.093, d.f. = 48,
p < 0.01). Therefore, the environmental flow downstream of the hydroelectric plant intake facility consistently fell short, particularly during the dry season, with significant reductions in discharge observed.
The percentage of discharge left for the environmental flow has been below the 10% of the legally required minimum discharge on 21 of the 49 measures taken from 2015 to 2023. For example, on 16 December 2017, the environmental flow was recorded at 0.070 m3/s, corresponding to only 4.80% of the required discharge. A similar trend was observed on 20 December 2019 (0.071 m3/s) and 29 October 2022 (0.072 m3/s), underscoring a long-term pattern of critically insufficient discharge allocation. On some occasions, discharge releases increased marginally but still failed to meet legal standards. Only once was the discharge in the environmental flow above 50% of the legally required minimum (on the 15 January 2017, with 0.797 m3/s, representing 54.59% of the legally required minimum discharge). Despite these improvements, compliance remained sporadic and inconsistent during the dry season.
3.3. Habitat Characterization
For analyzing the relationships among environmental variables across the sampling sites, a Principal Component Analysis (PCA) was performed (
Figure 7). To objectively compare environmental conditions between the two basins, an ANOSIM test was conducted, yielding an R-value of −0.05426 and a
p-value of 0.712 (999 permutations), indicating no significant differences between environmental conditions across both basins.
The first two principal components (PC1 and PC2) of the PCA analysis explained 78.6% of the total variation in the data, with PC1 accounting for 59.2% and PC2 for 19.4% (
Figure 7).
PC1 was primarily associated with hydrological variables, with a strong negative correlation for Discharge (–0.754), followed by Shade (Shad) (0.530), and Width (–0.197). This indicates that discharge and shading conditions play a dominant role in structuring the environmental variability across sites. PC2 was influenced by ecological and habitat quality indicators, particularly QBR-And (0.660), AAMBI (0.448), and BMWP (0.423), which are positively correlated with this axis. These variables reflect habitat quality and biotic integrity, separating sites based on their ecological conditions.
All the sites except for four of them (D-2546, D-404, D-255-Mq, and C-296) are found on the upper-right side of the diagram, higher as they present better ecological integrity, and more rightwards as they are more shaded and with lower discharge. Site D-2546 stands out on the bottom right area of the graph, with low discharge, the lowest environmental quality, and mostly fine substrates. On the other hand, in the left area of the graph, two of the lowest reaches appear, both for Dulcepamba (D-255-Mq) and Cristal (C-296), to be characterized mainly because of their greater discharge, high water flow velocity, depth, and width. However, the site in the Dulcepamba River is closer to the middle area of the graph because of its lower ecological integrity values. Site D-404 is also positioned in the upper-left quadrant of the diagram, reflecting its relatively high discharge—though less pronounced than the other two sites in this section—while being pushed upwards due to its better ecological integrity.
3.4. Fish Assemblages
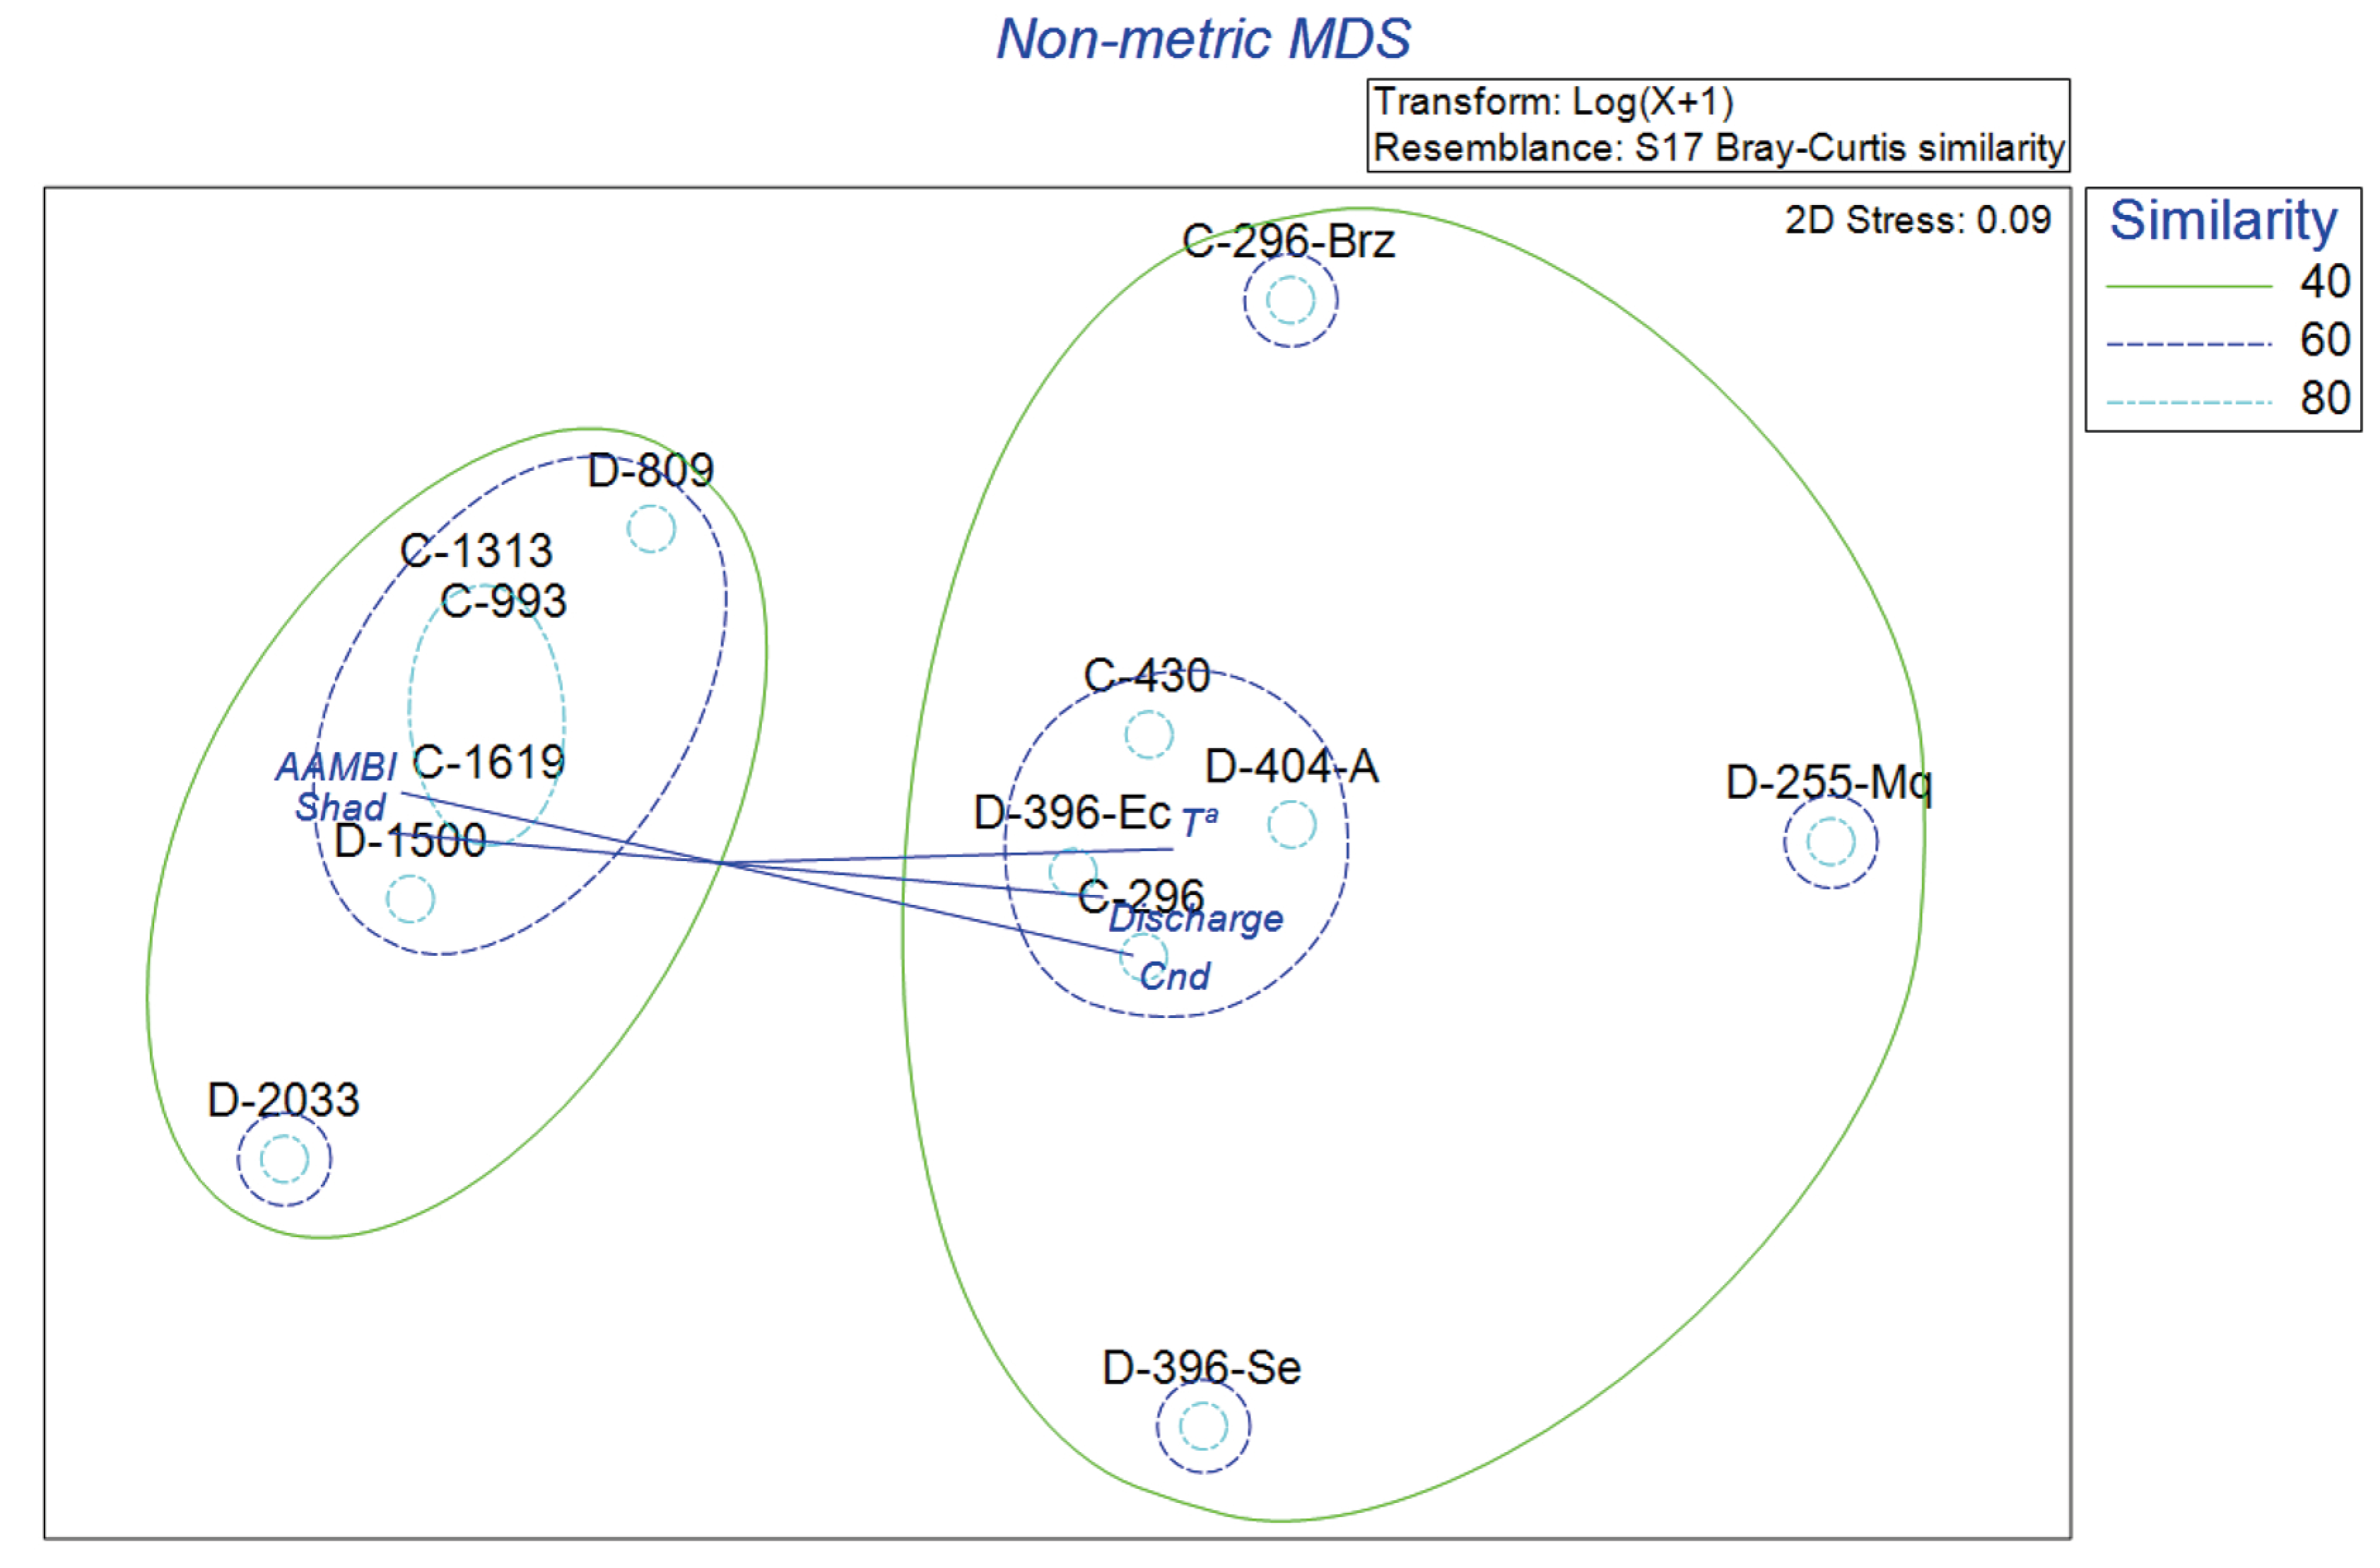
The results of the non-metric multidimensional scaling analysis (nMDS) to identify fish assemblage patterns and community distribution are shown in
Figure 8. This analysis provided a two-dimensional representation of fish community composition, where the ordination plot shows a stress value of 0.09, indicating an excellent two-dimensional representation of the data. Similarity contours at 40%, 60%, and 80% thresholds were overlaid to identify clusters of sites with similar fish assemblages. Site D-2546 was excluded from the analysis due to its noteworthy differences in fish species composition, which made the original NMS plot difficult to interpret and uninformative.
The analysis showed sites from both basins often clustered together, suggesting a high degree of similarity in fish community composition regardless of basin identity (
Figure 8). This pattern indicates that basin-level differences are not the primary drivers of fish assemblages. To statistically support this observation, an ANOSIM (Analysis of Similarities) was conducted, yielding a very low R-value (
R = −0.082) and a high
p-value (
p = 0.705), confirming that there are no significant differences in fish communities between the Dulcepamba and Cristal River basins.
The analysis revealed clear patterns in fish community structure within the Dulcepamba and Cristal River basins. Three primary groups of sites were identified, as represented by similarity contours at 40%, 60%, and 80%. Sites C-296, D-396-Ec, D-404-A, and C-430 clustered together, enclosed within the 60% similarity level, indicating similar fish community composition. This group is associated with mid-low elevation sites, characterized by environmental variables such as discharge, temperature, and conductivity. A second group includes sites C-1619, C-993, C-1313, D-1500, D-809, and D-2033, enclosed within the 40–60% similarity contours. These higher-elevation sites showed an association with variables like AAMBI and shade, highlighting the influence of habitat quality and shading on fish composition. In contrast, C-296-Brz, D-255-Mq, and D-396-Se were spatially isolated from the main clusters. C-296-Brz exhibited the highest dissimilarity, reflecting unique environmental conditions or species composition in this branch of the Cristal River. Site D-396-Se, located downstream of the hydroelectric plant’s water intake facility in the Dulcepamba basin, showed lower similarity, potentially due to drying conditions affecting the fish community. Similarly, D-255-Mq appeared distinct, likely influenced by hydrological alterations.
Finally, the CCA ordination plot (
Figure 9) illustrates the association between environmental variables and fish species composition across the study sites. The first two axes represented 65.94% of the total variation, with CCA1 accounting for 42.51% and CCA2 for 23.43%.
The CCA plot clearly separates sites located below 800 m.a.s.l. on the right side of the graph from those above 800 m.a.s.l. on the left. This separation reflects both environmental conditions and fish diversity. Sites at higher elevations exhibit lower discharge, depth, temperature, and conductivity, with increased shade and better ecological integrity (high values for the environmental indices: QBR-And, AAMBI, BWMP, and IHF). These sites are characterized by the near-exclusive presence of three species of Astroblepids (Astroblepus cf. eigenmanni, Astroblepus cf. grixalvii, and Astroblepus cf. cyclopus), whereas species richness increases considerably below 800 m.a.s.l.
On the upper-right side of the plot, site D-255-Mq appears distinct from the rest of the sampling sites, being strongly associated with species such as
Trichomycterus taenia (Kner 1863),
Saccodon wagneri (Kner 1863), and
Transancistrus aequinoctialis (Pellegrin 1909). On the lower-right side, site C-296-Brz stands out, being exclusively associated with species found only at this location,
Lebiasina astrigata,
Rhoadsia altipinna (Fowler 1911), and
Andinoacara blombergi (Wijkmark, Kullander and Barriga Salazar, 2012), and also including
Brycon atrocaudatus,
Pimelodella modesta, and
Eretmobrycon guaytarae (Eigenmann and Henn 1914). This site is differentiated from its main channel counterpart (C-296), highlighting important differences in both environmental characteristics (
Figure 7) and species composition, which is similar to more elevated sites like D-404 or C-430, characterized by the presence of
Astroblepus cf.
cyclopus,
Astroblepus grixalvii,
Brycon atrocaudatus,
Saccodon wagneri, and
Transancistrus aequinoctialis, sharing a typical lowland species like
Pimelodella modesta with the branch (C-296-Brz).
4. Discussion
4.1. Fish Diversity
Our results suggest the ecological integrity of the Dulcepamba River basin is affected by the hydropower operations of the San José del Tambo Hydroelectric Plant, as shown by trends observed in fish community analyses, habitat characterization, and hydrological monitoring. Comparisons with the neighboring Cristal River basin suggest ecological disruptions associated with altered flow regimes downstream of the water diversion infrastructure. Similar trends regarding the alteration of fish communities due to the presence of hydropower dams have been reported worldwide [
42,
43].
The species accumulation analysis (
Figure 3) further supports the robustness of our sampling effort, with observed richness (16 species) accounting for approximately 94% of the estimated total richness when using Chao1, the best-fitting index. However, rare species are critical to understanding biodiversity dynamics, as they contribute disproportionately to ecosystem function and resilience in tropical ecosystems [
44]. Their omission can obscure substantial ecological insights, particularly in systems under anthropogenic stress. This underscores the importance of incorporating additional targeted sampling efforts that explicitly account for rare species to ensure a more comprehensive and accurate understanding of community structure and ecosystem health [
45]. However, considering the results of the completeness analysis, electrofishing has proven to be an effective method for our study area, capturing a broad spectrum of fish species, including those less detectable by traditional sampling techniques such as nets or hooks [
46].
Fish species richness (
Figure 4) and diversity (
Figure 5) showed a clear downstream increase, with the most pronounced differences observed at sites below 800 m.a.s.l. on both basins. This pattern is also explained by the correlation analysis between elevation and diversity (Hill N1) (
Table 2), and aligns with previous findings in Andean rivers, where high-elevation systems tend to host fewer, highly specialized species such as
Astroblepus spp., which exhibit adaptations to fast-flowing, cold, and oxygen-rich waters [
21,
22]. However, within the Dulcepamba basin, sites directly impacted by the hydroelectric diversion showed markedly lower abundance, richness, and diversity compared to analogous sites in the Cristal basin.
It is important to highlight that the highest site in the Dulcepamba River basin is also home to the invasive rainbow trout (
Oncorhynchus mykiss), a species widely established in high-elevation Andean streams [
47]. The presence of rainbow trout poses a major threat to native
Astroblepus fishes and other native biota [
48]. This menace is compounded by the severe human alterations in these high-elevation streams, where agriculture, cattle raising, and urbanization have degraded habitats critical for the conservation of these endemic species [
20].
4.2. Hydrological and Habitat Alterations
Hydrological monitoring confirmed that the hydroelectric plant consistently failed to comply with the legally mandated environmental discharge of 1.46 m
3/s, particularly during dry seasons (
Figure 6). During our sampling campaign, the environmental flow was higher (0.49 m
3/s or 21.18% of the minimum required discharge) compared to other recorded years for the same dates, usually below 4% of the minimum required discharge. A study in October 2020 recorded a discharge of 0.049 m
3/s, representing 3.36% of the minimum legal discharge) [
49]. Therefore, although we found fish on both branches downstream of the intake, the scarce discharge usually found for this time of the year may be insufficient to sustain fish populations. Such severe reductions profoundly impact aquatic habitats, leading to loss of connectivity, desiccation of critical refuges, and deterioration in water quality [
50]. This underscores the severe ecological consequences of discharge reduction and channel drying, which can eliminate habitats essential for sustaining fish communities [
51,
52]. The drying of the Dulcepamba River along 2.75 km of its course is particularly critical for altitudinal migratory species, such as
Brycon atrocaudatus [
53] and
Eretmobrycon brevirostris [
54]. The direct correlation between discharge reduction and declines in aquatic biodiversity observed in this study mirrors similar findings from other hydropower-affected rivers worldwide [
4,
5,
6,
7].
Habitat characterization through PCA (
Figure 7) revealed differences in habitat conditions among sites, with discharge, depth, and shading identified as key variables differentiating these habitats. Moreover, the ANOSIM analysis pointed out that differences within-basin were slightly greater than between-basin differences, a pattern further confirmed by the PCA, as sites from both watersheds appear intermingled. This reinforces the idea that both basins are comparable considering natural conditions.
Sites in the Cristal River basin, particularly the side channel C-296-Brz, demonstrated higher habitat complexity and ecological integrity. In contrast, the Dulcepamba River exhibited degraded habitat conditions at impacted sites (D-396-Se, D-396-Ec, and D-255-Mq), characterized by lower discharge, reduced shading, and higher substrate instability. The higher scores on the environmental integrity indices (QBR-And, IHF, AAMBI, and BMWP) for the sites in the Cristal basin further underscore the better conservation status of this system.
4.3. Species Composition Changes
The observed patterns in fish assemblages, as illustrated by the nMDS (
Figure 8) and Canonical Correspondence Analysis (CCA) (
Figure 9), underscore the large impact of hydrological alterations on community structure. Sites affected by hydroelectric infrastructure, particularly D-255-Mq and D-396-Se, exhibited clear dissimilarities compared to other sites in both basins. Although species richness increased downstream, the absence or rarity of several taxa at impacted sites highlights the selective pressures imposed by altered flow regimes. For example, site D-255-Mq, located downstream of the powerhouse, recorded lower species richness and diversity compared to the Cristal River at its lowest reaches (C-296-Brz), which had the highest biodiversity observed in the study.
The fish assemblage at D-255-Mq was notably distinct from other sites and deviated from what would be expected at that elevation. The lack of shallow and slow-flow habitats at D-255-Mq restricts the presence of lowland species like
Lebiasina astrigata,
Andinoacara blombergi,
Eretmobrycon guaytarae,
Lebiasina astrigata,
Pimelodella modesta,
and Rhoadsia altipinna. This habitat loss is due to the sudden return of diverted water from the powerhouse, creating a uniform and confined habitat devoid of natural shallow, slow-flowing areas typically found at lower elevations. High-velocity flows concentrated in a narrow channel, excavated by erosion like the ones found in D-255-Mq, are uncommon in lower basin areas of natural watersheds but have been widely reported as consequences of hydroelectric infrastructure [
55]. As a result, species richness and diversity at D-255-Mq were lower than expected for its location. The fish assemblage was dominated by species tolerant to high-velocity flows, such as
Trichomycterus taenia and
Saccodon wagneri, while species adapted to shallow, low-energy habitats like
Lebiasina astrigata, Rhoadsia altipinna, or
Andinoacara blombergi were largely absent.
In contrast, on the lower reaches of the Cristal River basin, fish diversity notably increased as many species adapted to slower waters and shallow habitats were found, such as
Pimelodella modesta,
Bryconamericus dahli,
Lebiasina astrigata,
Rhoadsia altipinna, and
Andinoacara blombergi. Located in a meandering section as the river enters the flatlands, C-296-Brz provides diverse habitats, such as shallow waters, side channels, and slow-flowing areas, supporting a unique and diverse fish assemblage. The 12 species recorded here were considerably higher than at impacted sites at similar elevations like D-255-Mq. This community, typical for a basin at this elevation on the Andean–Pacific versant [
56,
57], underscores the importance of natural flow regimes in maintaining habitat diversity and species richness.
However, the site in the main channel at the same river reach, C-296, exhibited a fish assemblage more akin to upstream sites (grouping in nMDS and CCA analyses with C-430, D-396-Ec, and D-404-A). This similarity reflects its retention of natural flow conditions typical of higher-elevation streams, with fewer shallow, low-energy habitats to support species found in the secondary branch. Although analyzed separately, C-296 and C-296-Brz are part of the same watercourse, and their combined habitat diversity plays a crucial role in supporting the overall biodiversity of the Cristal River. The natural hydrology of this system creates a range of ecological niches downstream, in stark contrast to the habitat simplification observed at D-255-Mq and the severe disruption at D-396-Se.
Finally, site D-396-Se was the most severely impacted, as flow diversion caused it to become completely dry. This extreme alteration eliminated natural fish assemblages, leaving primarily recent colonizers like Astroblepus grixalvii, Brycon atrocaudatus, and Saccodon wagneri to occupy the newly available habitat—a direct result of altered hydrology.
4.4. Hydroelectric Development and Fish Conservation in the Andes
The findings of this study provide critical insights into the ecological impacts of SHP operations in freshwater ecosystems of Andean rivers. The observed patterns of species richness and habitat degradation align with previous studies highlighting the vulnerability of montane river systems to hydropower development [
51,
58]. This study confirms previous findings that SHPs and run-of-river systems, which are generally considered less impactful than large hydropower projects, can still cause substantial ecological disruptions, especially when environmental flows are not maintained [
50,
51,
52]. The severe discharge reductions observed in the Dulcepamba River not only compromise habitat quality but also disrupt ecological processes essential for maintaining fish diversity. However, our results show that the studied hydropower project did not affect fish communities at the river basin scale but had localized effects on the sites directly impacted by the infrastructure operation.
According to recent studies, the Andean Piedmont rivers are among the most irreplaceable rivers worldwide regarding freshwater fish diversity [
59]. However, 88% of the species are not adequately encompassed in any protected area in the Tropical Andean region, and there is limited knowledge about the conservation status of many of these species, highlighting a critical gap in conservation efforts [
20]. Conservation strategies must prioritize maintaining environmental flows, protecting key habitats, and implementing ecological monitoring programs to mitigate the long-term impacts of hydropower development [
7,
8]. Further research is needed to explore the resilience of Andean fish communities to altered flow regimes and to identify thresholds for environmental flow compliance that ensure the sustainability of freshwater ecosystems. These ecological consequences combined with the severe social impacts on the local communities of events like the 2015 flood, which caused fatalities and economic losses in San Pablo de Amalí [
27], underscore the consequences of poorly planned and operated hydroelectric infrastructure.
Despite Ecuador’s robust legal protections for nature and communities impacted by hydropower projects, among other types of industrial infrastructure, the persistent failure to meet the legally mandated minimum environmental flow, year after year, highlights a glaring lack of enforcement. The ecological consequences observed in the Dulcepamba River highlight the need for stricter enforcement of discharge regulations to preserve downstream habitats and aquatic biodiversity, as well as improved infrastructure designs to minimize environmental impacts and maximize social benefits [
16].
While SHPs can contribute to local energy sovereignty, they typically operate with an average capacity factor of 40–50%, limited by seasonal water discharge variations and operational downtime, which further reduces their production efficiency [
60,
61]. Given their relatively low energy generation and tendency to cause ecological and social negative impacts, the net benefits of SHP have been questioned [
12,
13]. Especially since the San José del Tambo hydroelectric project only has a maximum generation capacity of 8 MW on an inconsistent basis, it is essential to question whether the large ecological and social costs justify the means [
62].
Furthermore, the ecological impacts observed through this study reinforce concerns that Ecuadorian environmental regulations exempt hydroelectric projects with generating capacities of ≤10 MW from the Environmental Impact Study (EIA) requirement. If anything, this study points to the need for more comprehensive environmental studies to better understand potential and actual ecological impacts of hydroelectric projects, especially in biodiversity-rich and socially vulnerable regions. Small hydropower plants (SHPs) must be designed to minimize habitat fragmentation, protect connectivity, and reduce downstream impacts. Our results, indicating localized impacts of SHPs, highlight that mandatory Environmental Impact Assessments (EIAs), even for projects below 10 MW capacity, are crucial to evaluate ecological and social consequences.
Further research is needed to explore the resilience of Andean fish communities to altered flow regimes and to identify thresholds for environmental flow compliance that ensure the sustainability of freshwater ecosystems. These efforts, combined with stricter enforcement of discharge regulations and habitat restoration initiatives, are essential for balancing energy production with the preservation of biodiversity in high-mountain river systems.
5. Conclusions
Fish Diversity and Ecological Integrity: The ecological integrity of the Dulcepamba River basin appears to be compromised by hydropower operations, as evidenced by significant reductions in fish abundance, richness, and diversity in impacted areas. Comparisons with the Cristal River basin suggest that hydrological alterations are a major factor driving changes in community structure.
Hydrological and Habitat Alterations: The hydroelectric plant consistently failed to comply with the legally mandated environmental discharge. Severe reductions in water flow during the dry season led to habitat degradation, loss of connectivity, and desiccation of critical refuges, severely impacting fish communities. The fish community downstream of flow restoration showed an unexpected shift, resembling upstream fast-flowing communities rather than expected lowland assemblages.
Policy and Conservation Needs: Conservation strategies should prioritize maintaining environmental flows, protecting key habitats, and implementing ecological monitoring programs to mitigate the long-term impacts of hydropower development. Stricter enforcement of discharge regulations and improved infrastructure designs are essential for preserving biodiversity and supporting sustainable energy production.
Future Research Directions: Considering the extensive creation of hydroelectric projects along the Andes, further research is needed to assess the resilience of fish communities to altered flow regimes and to establish thresholds for environmental flow compliance. These efforts will be crucial for balancing energy needs with the sustainability of freshwater ecosystems.


 ,
, 


