
Assessment of over Four Decades the Status of White Grouper Epinephelus aeneus (Geoffroy Saint-Hilaire, 1817) Population in the Eastern Central Atlantic

 , , , and
Abstract
1. Introduction
2. Data and Methods
2.1. Data Used
2.1.1. Catch Data
- Scientific surveys
- Commercial data
- -
- Lines: The pirogue glacier line (LPG); the octopus’s line (LPO); the single line of motorized pirogues (LSM); the single line of non-motorized pirogues (LSNM) and the longline (PAL);
- -
- Nets: The bottom set net (FD), the bottom drift gillnet (FMDF), and the trammel net (TM).
- -
- Handline targeting demersal fish
- -
- Jig to target the Octopus vulgaris and demersal fish
2.1.2. Length Frequencies Data
- Scientific survey
- Commercial data
2.2. Abundance Indices
3. Stock Assessment Methods
3.1. Just Another Bayesian Biomass Assessment (JABBA)
- A state space production model in a Bayesian framework.
- Priors specification
- Input fishery data
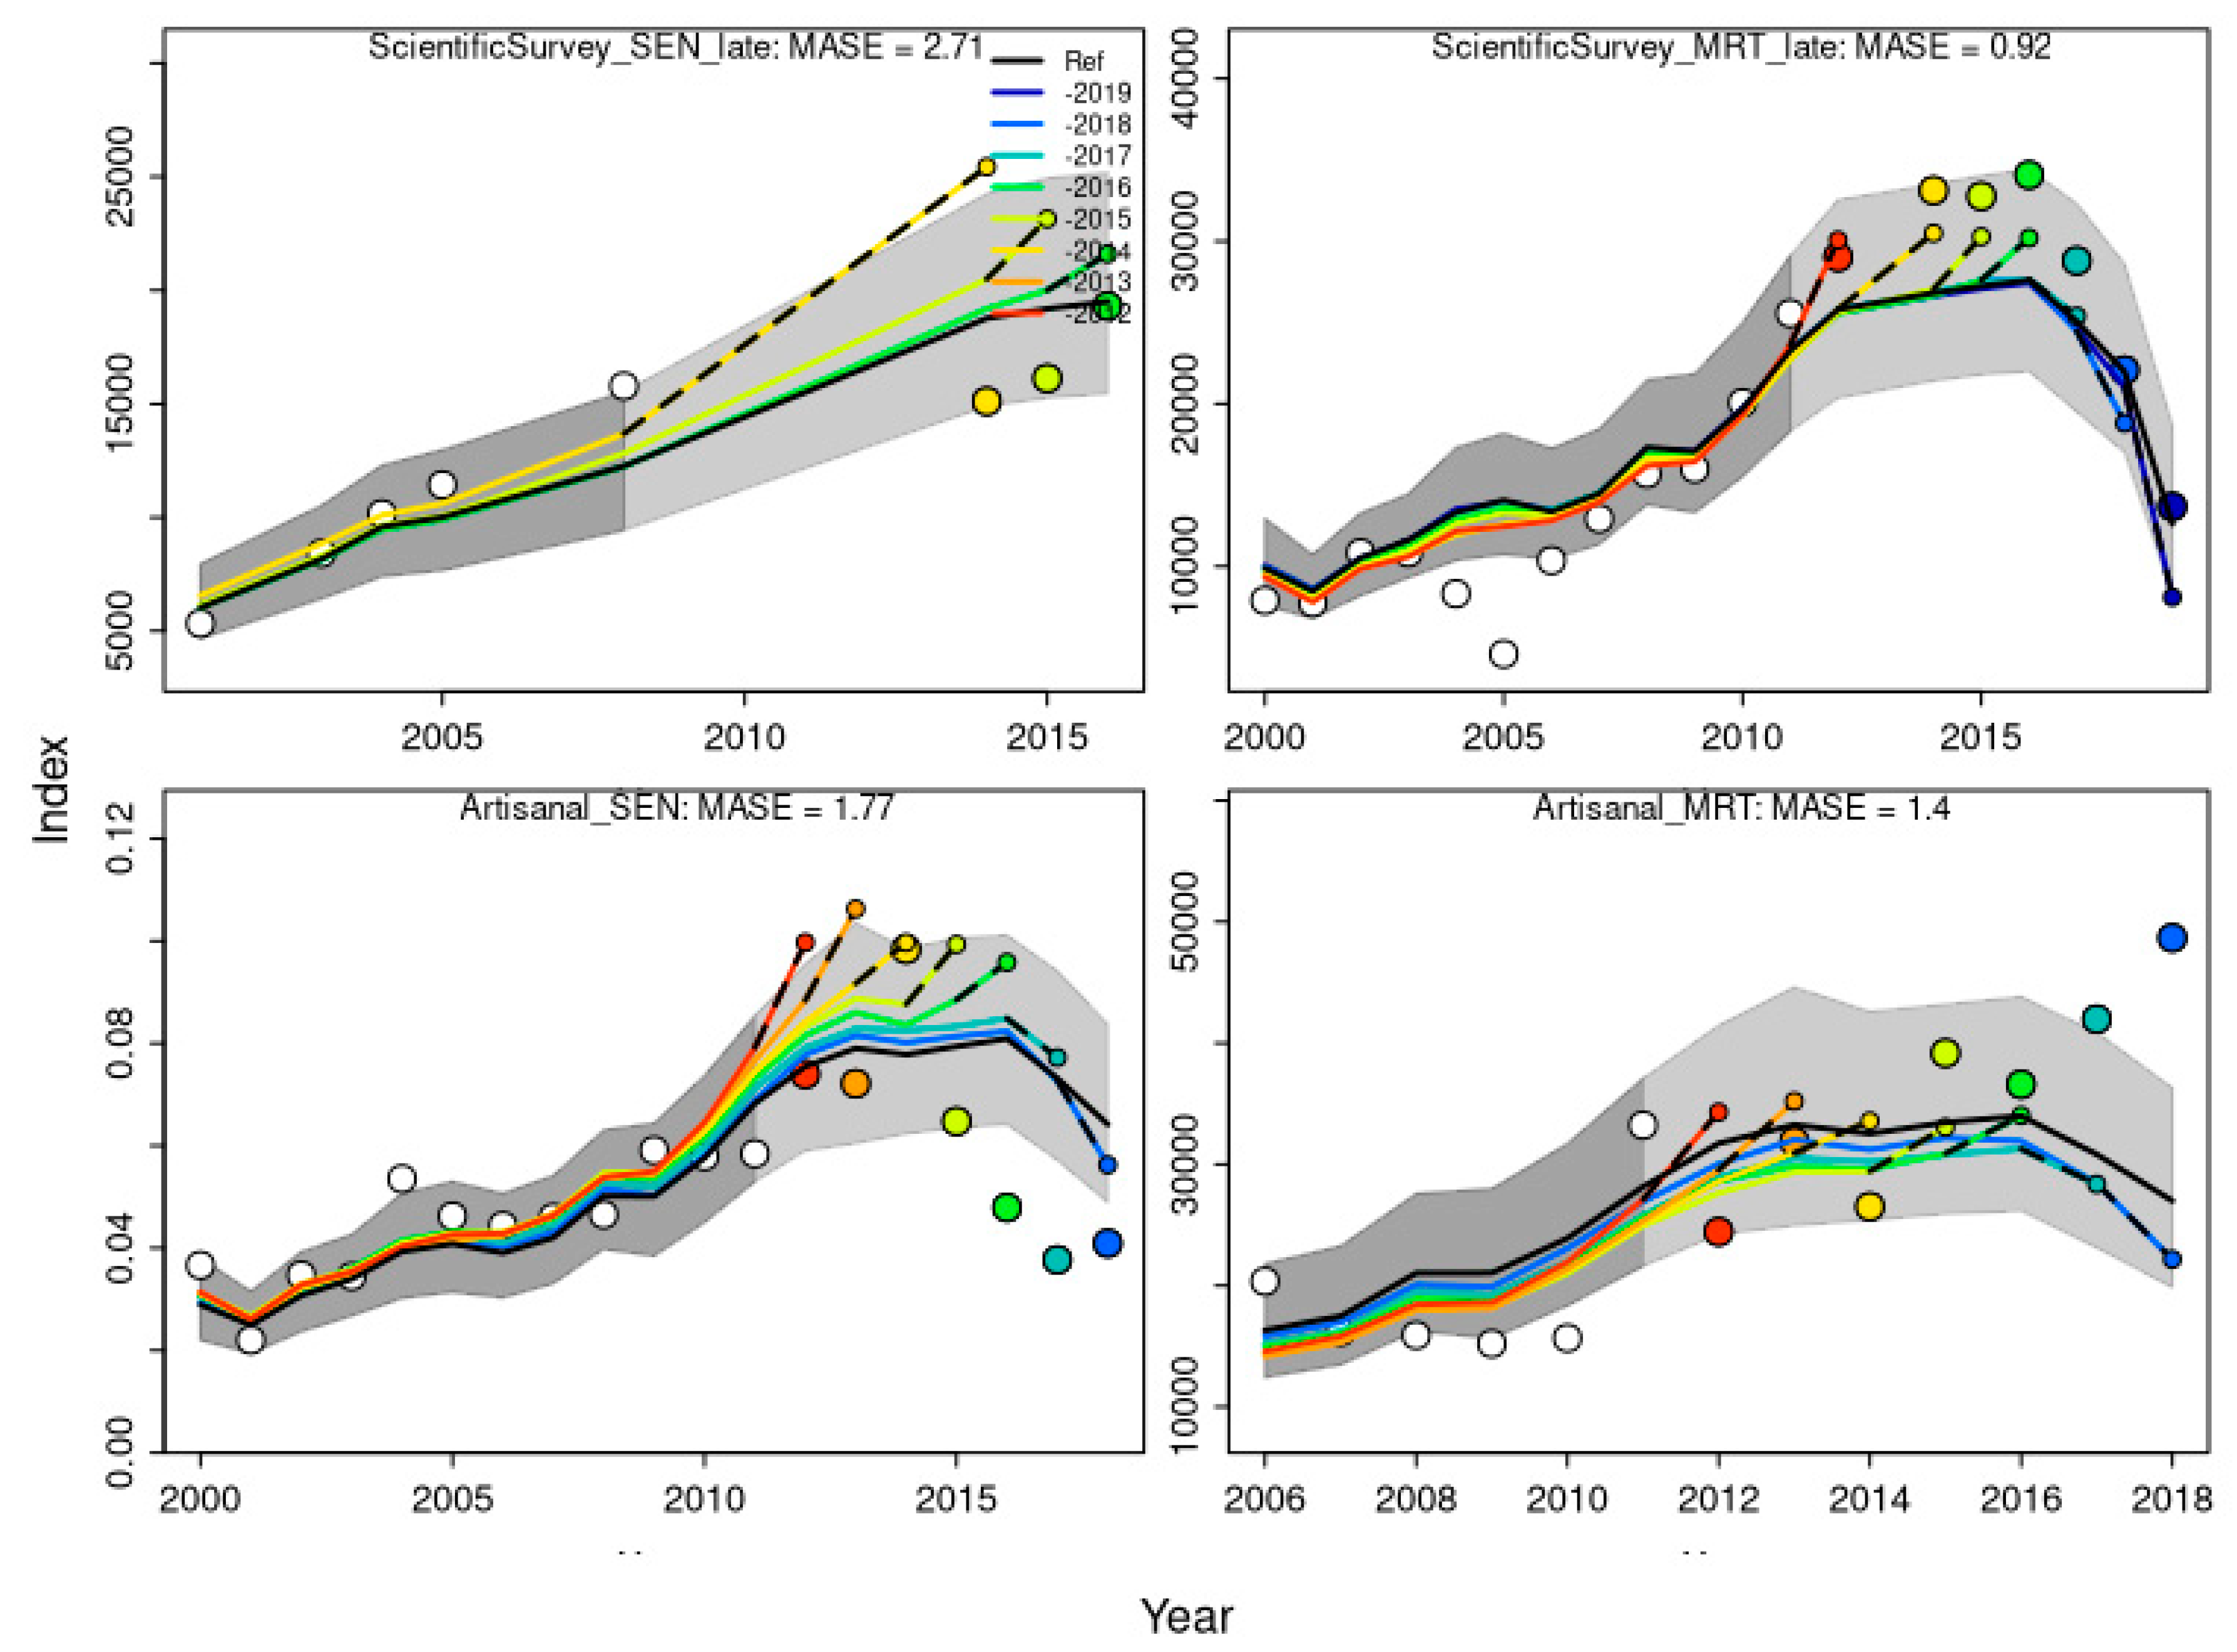
- Retrospective and hindcast cross-validating analysis
3.2. Length-Based Bayesian Biomass
4. Results
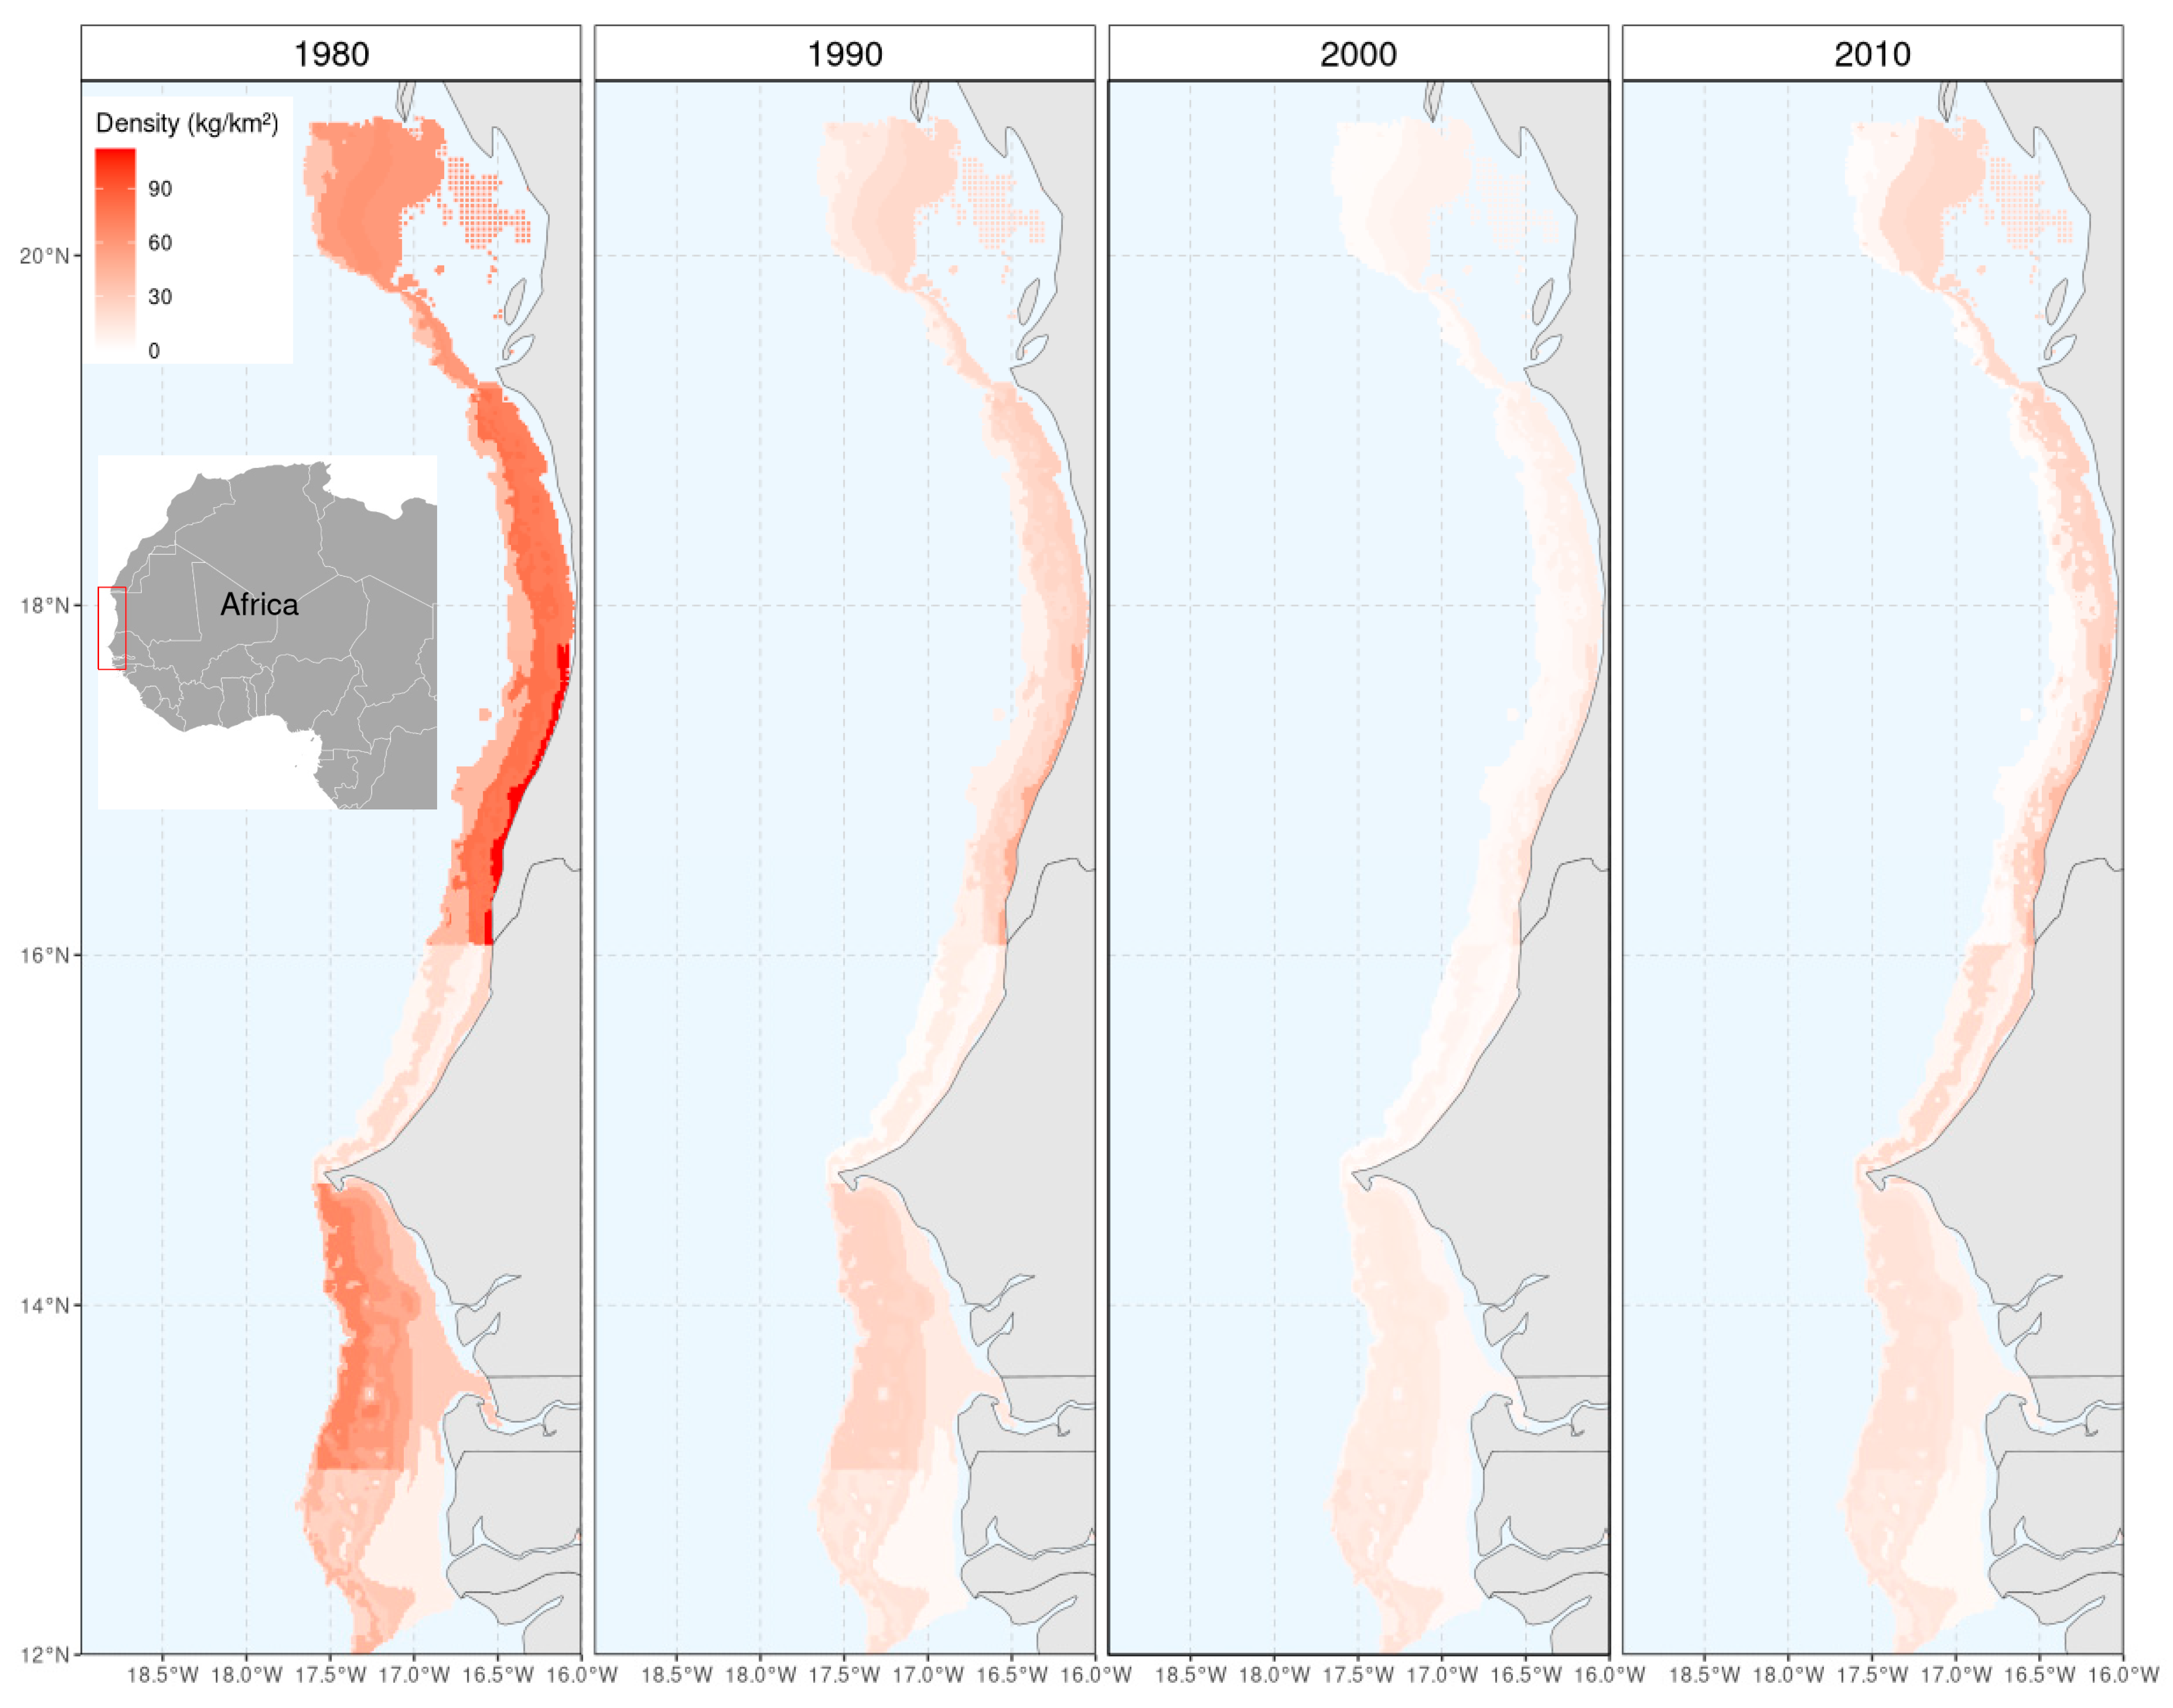
4.1. Delta-GLM Model and Abundance Indices
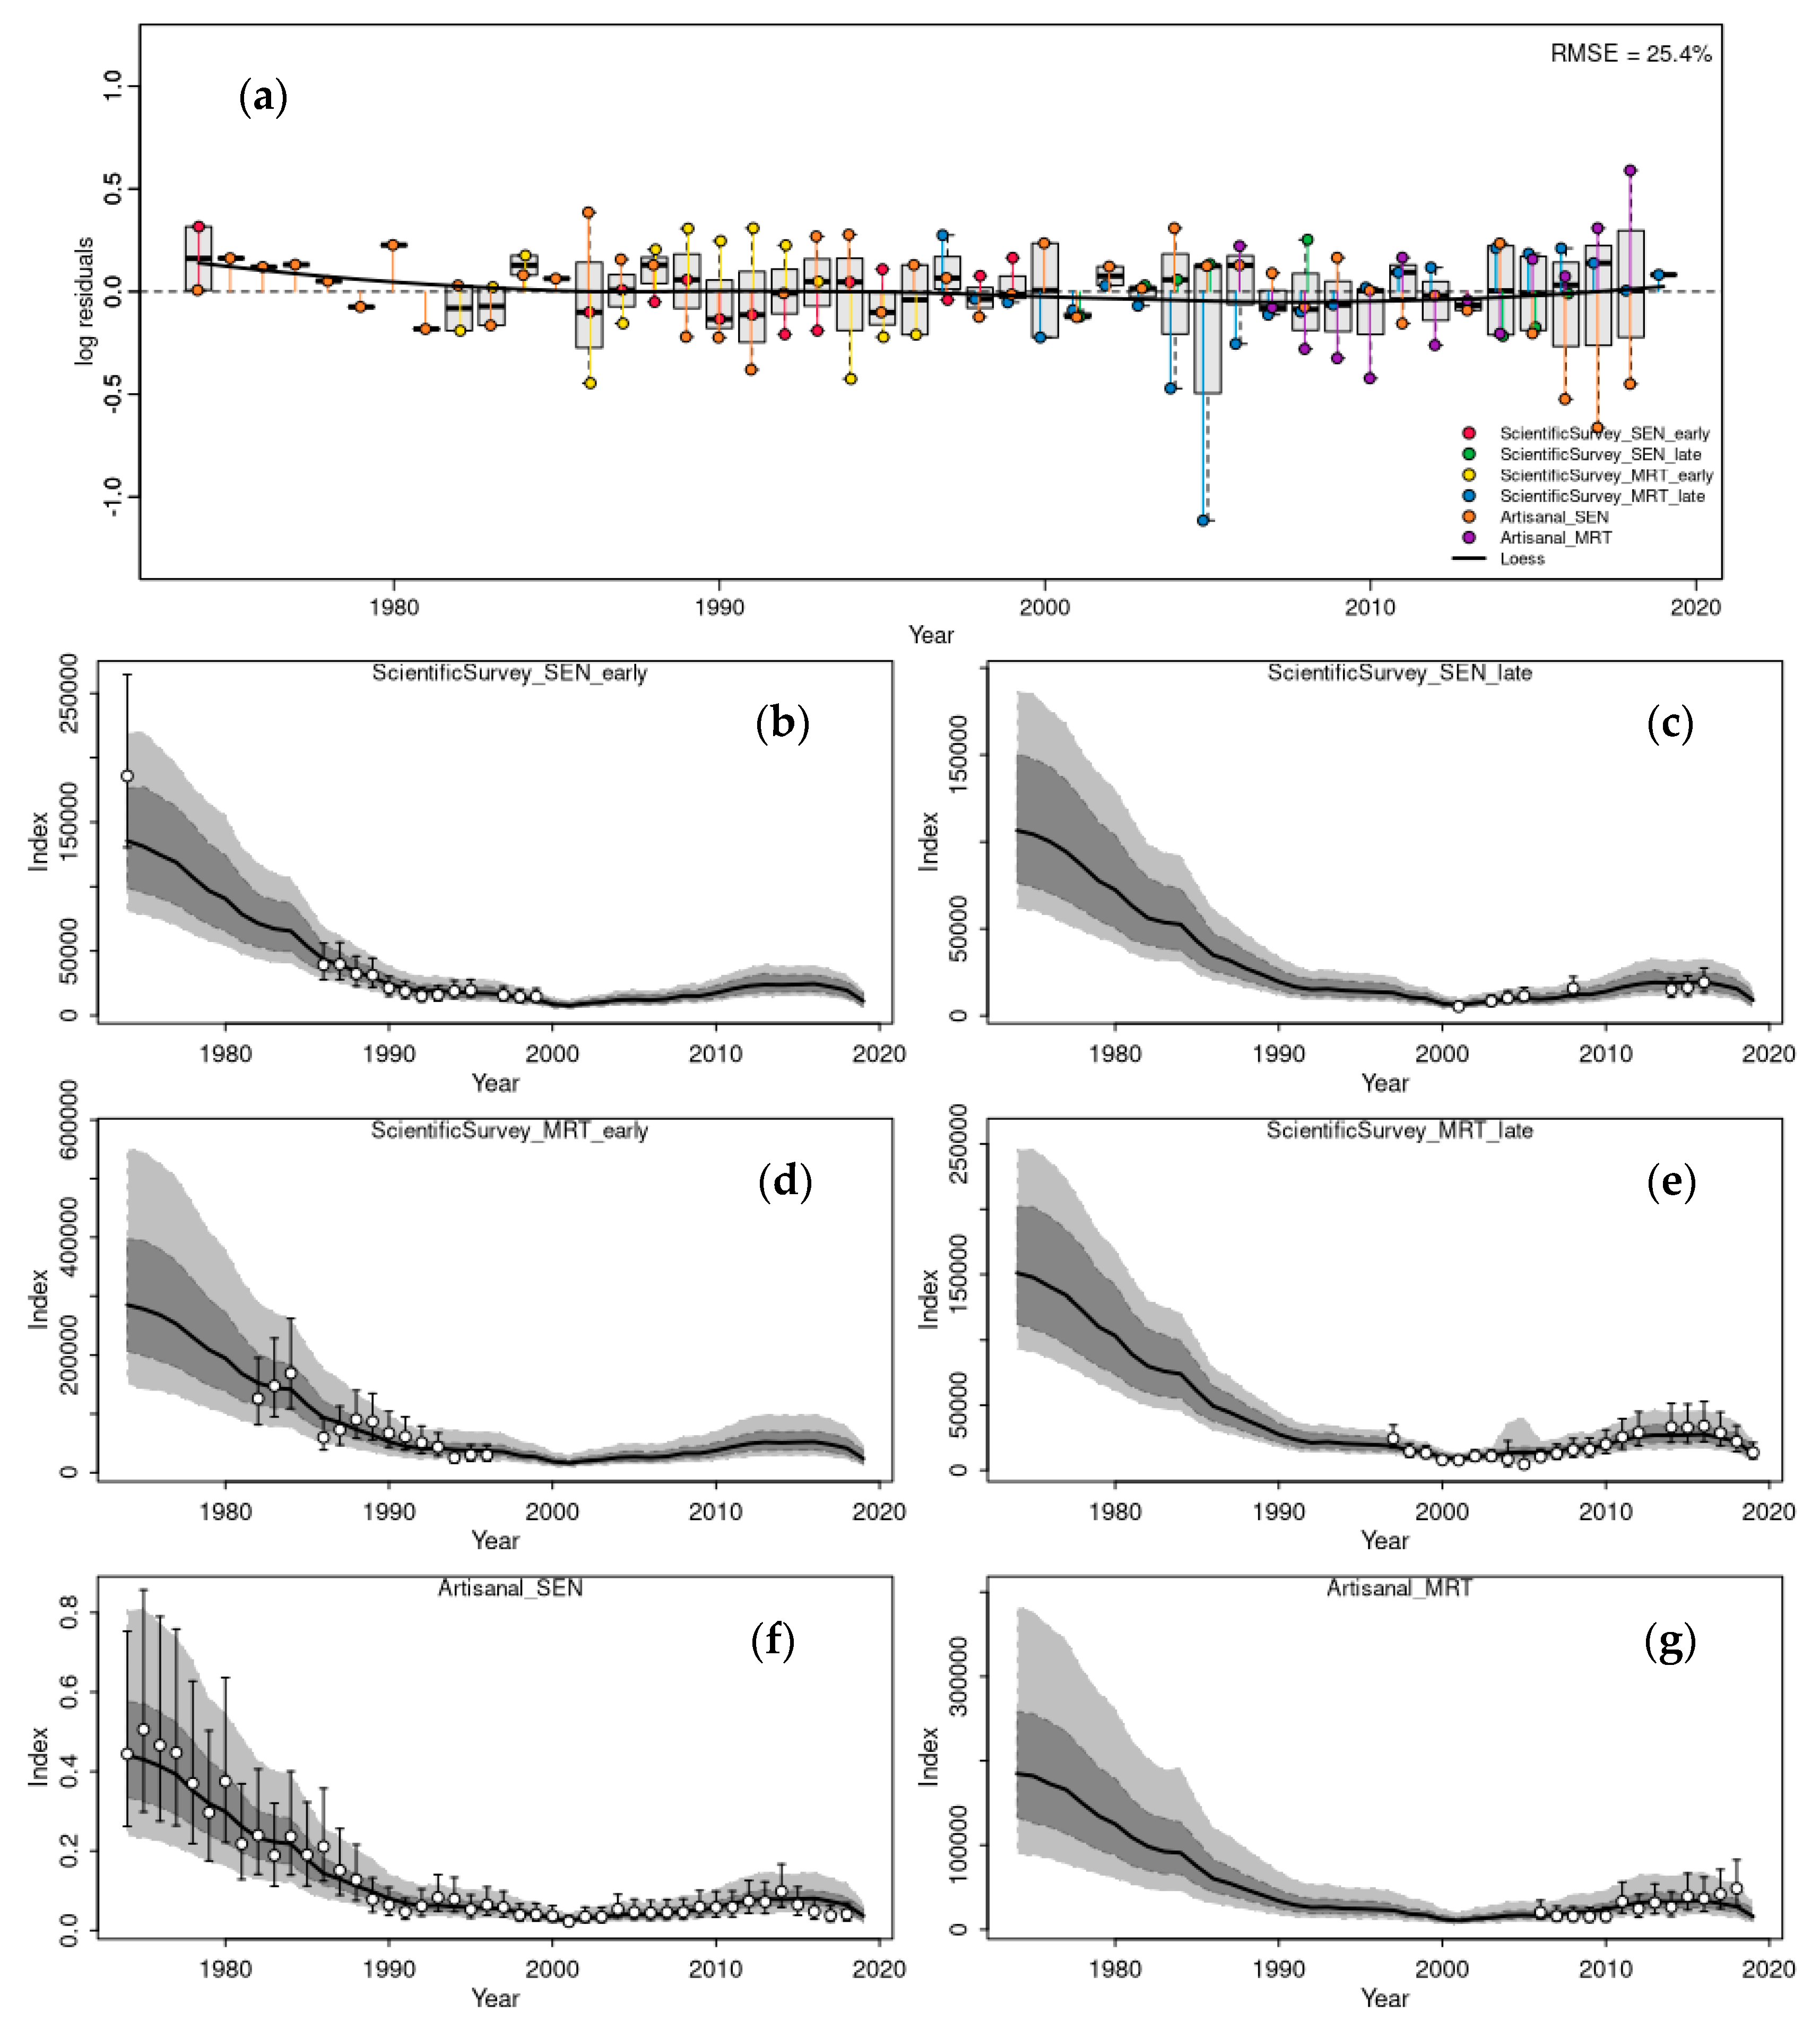
4.2. Evaluation
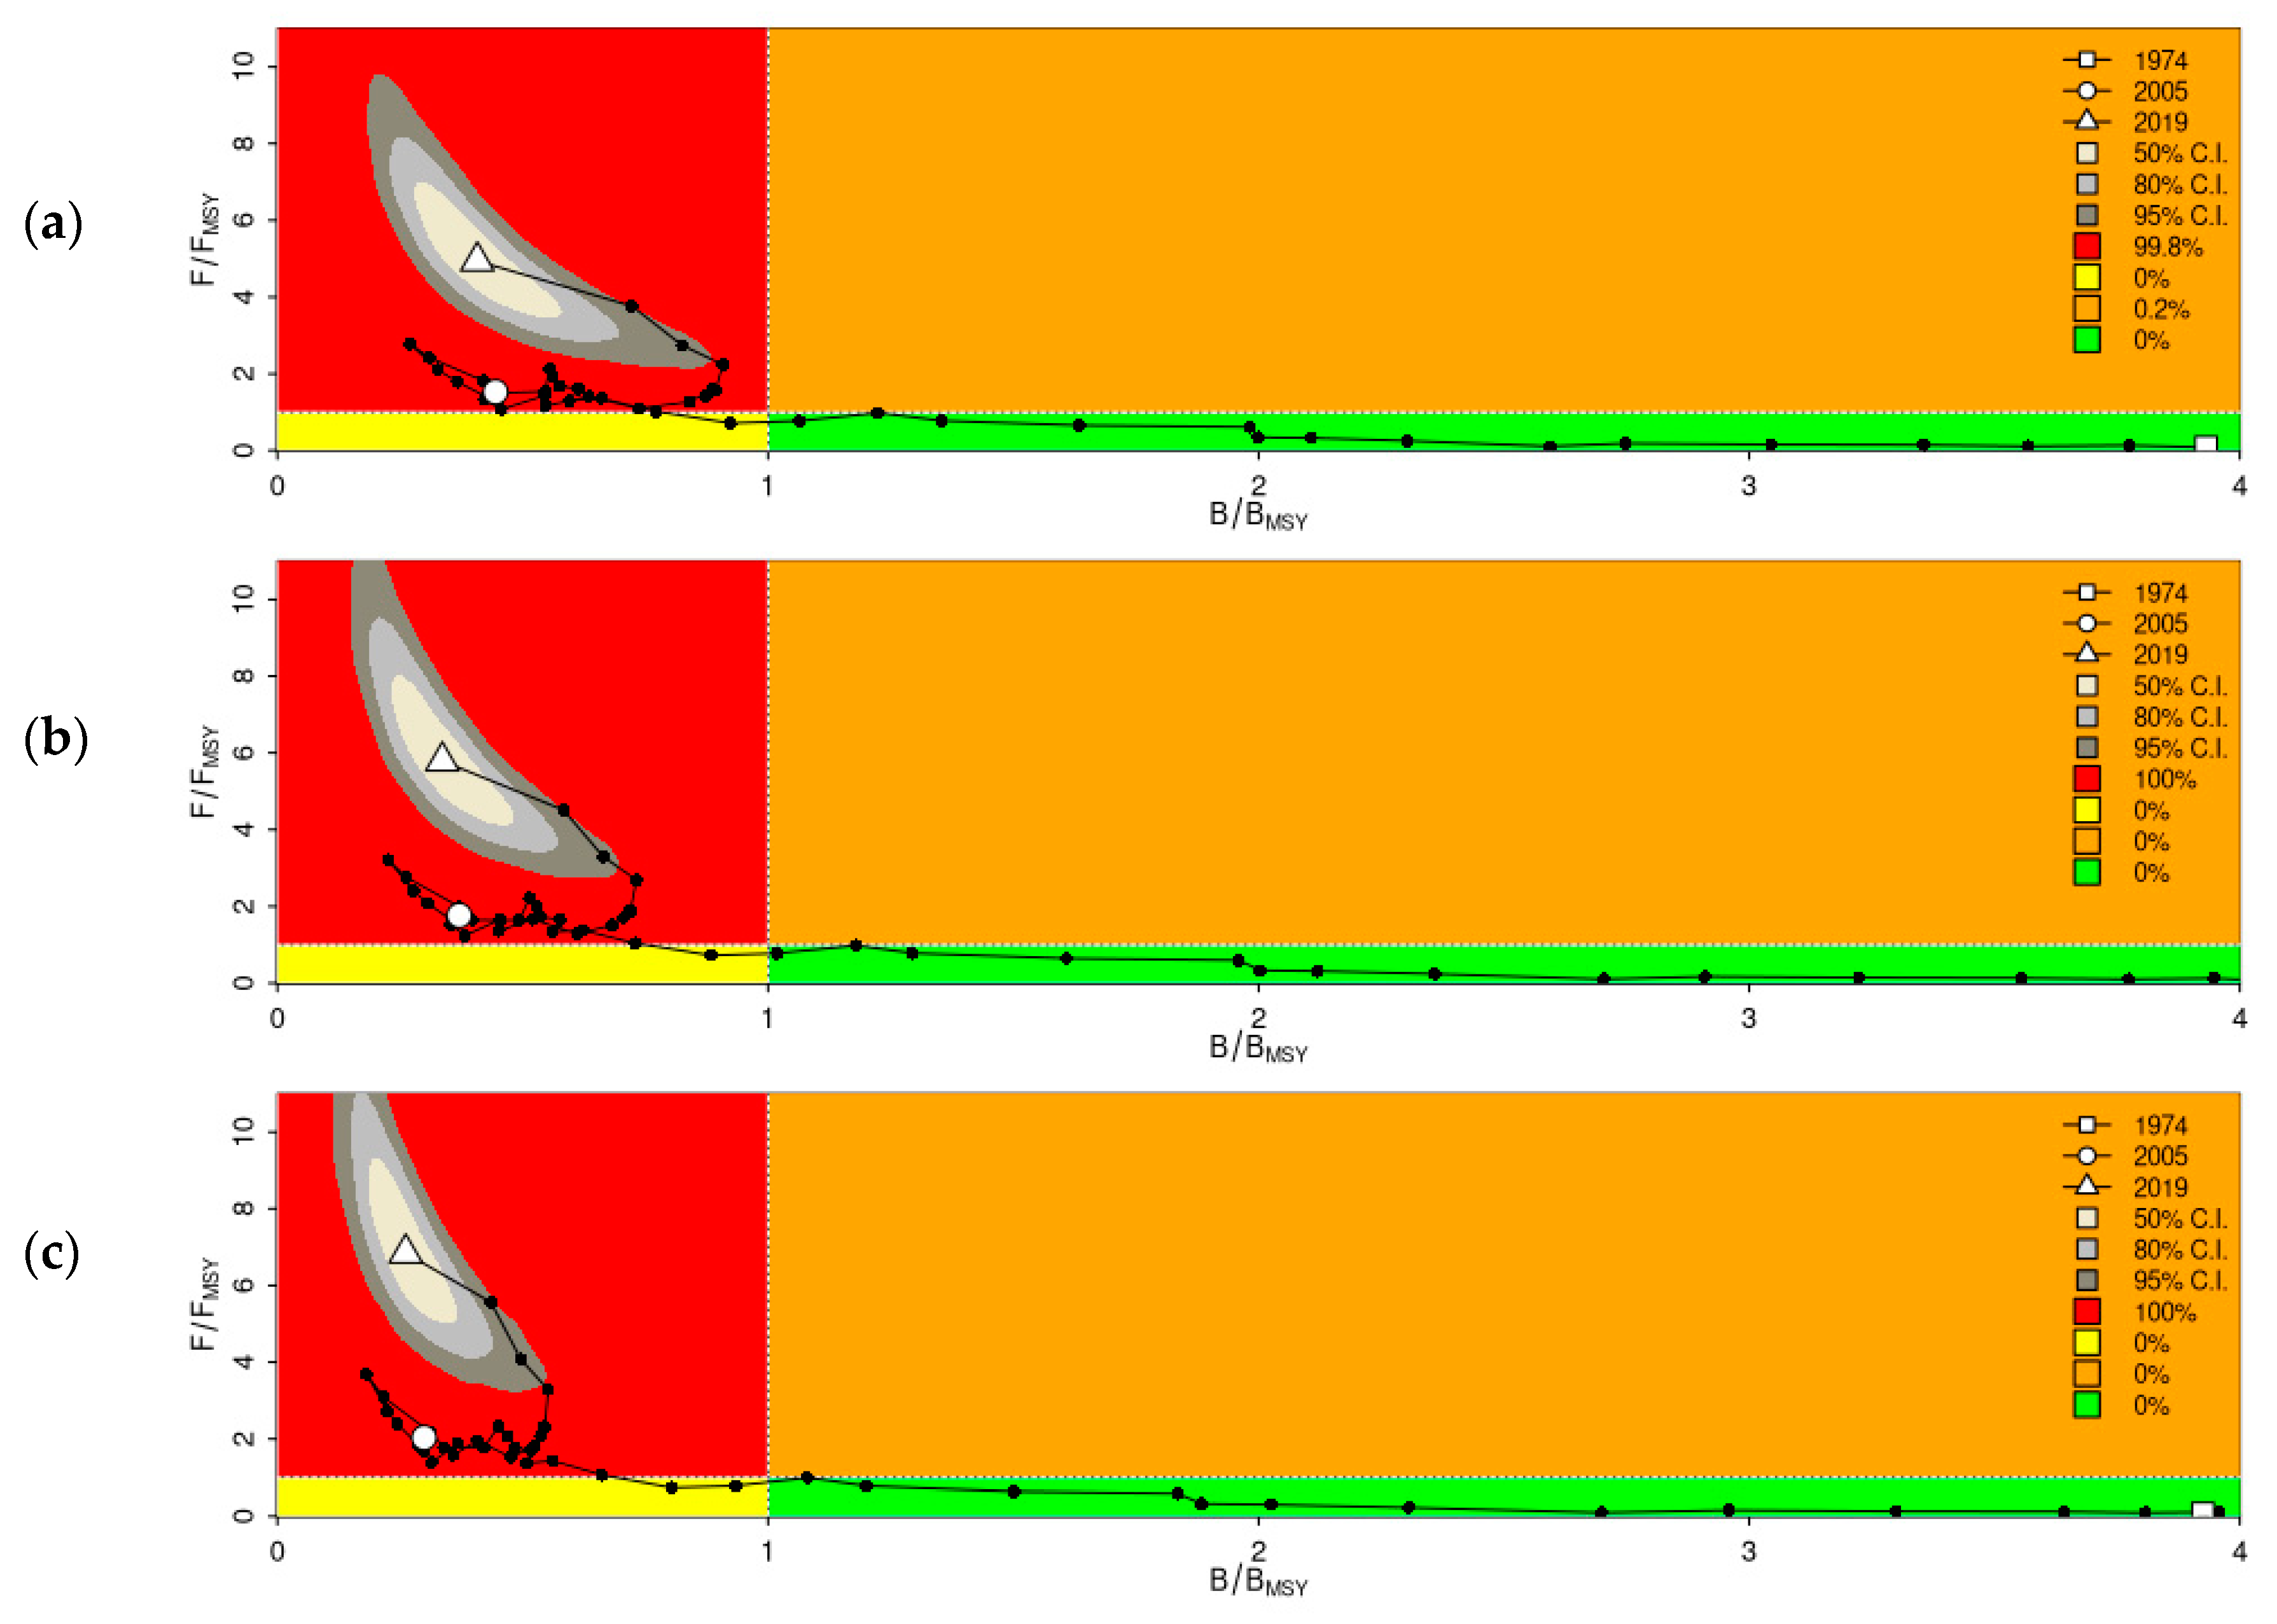
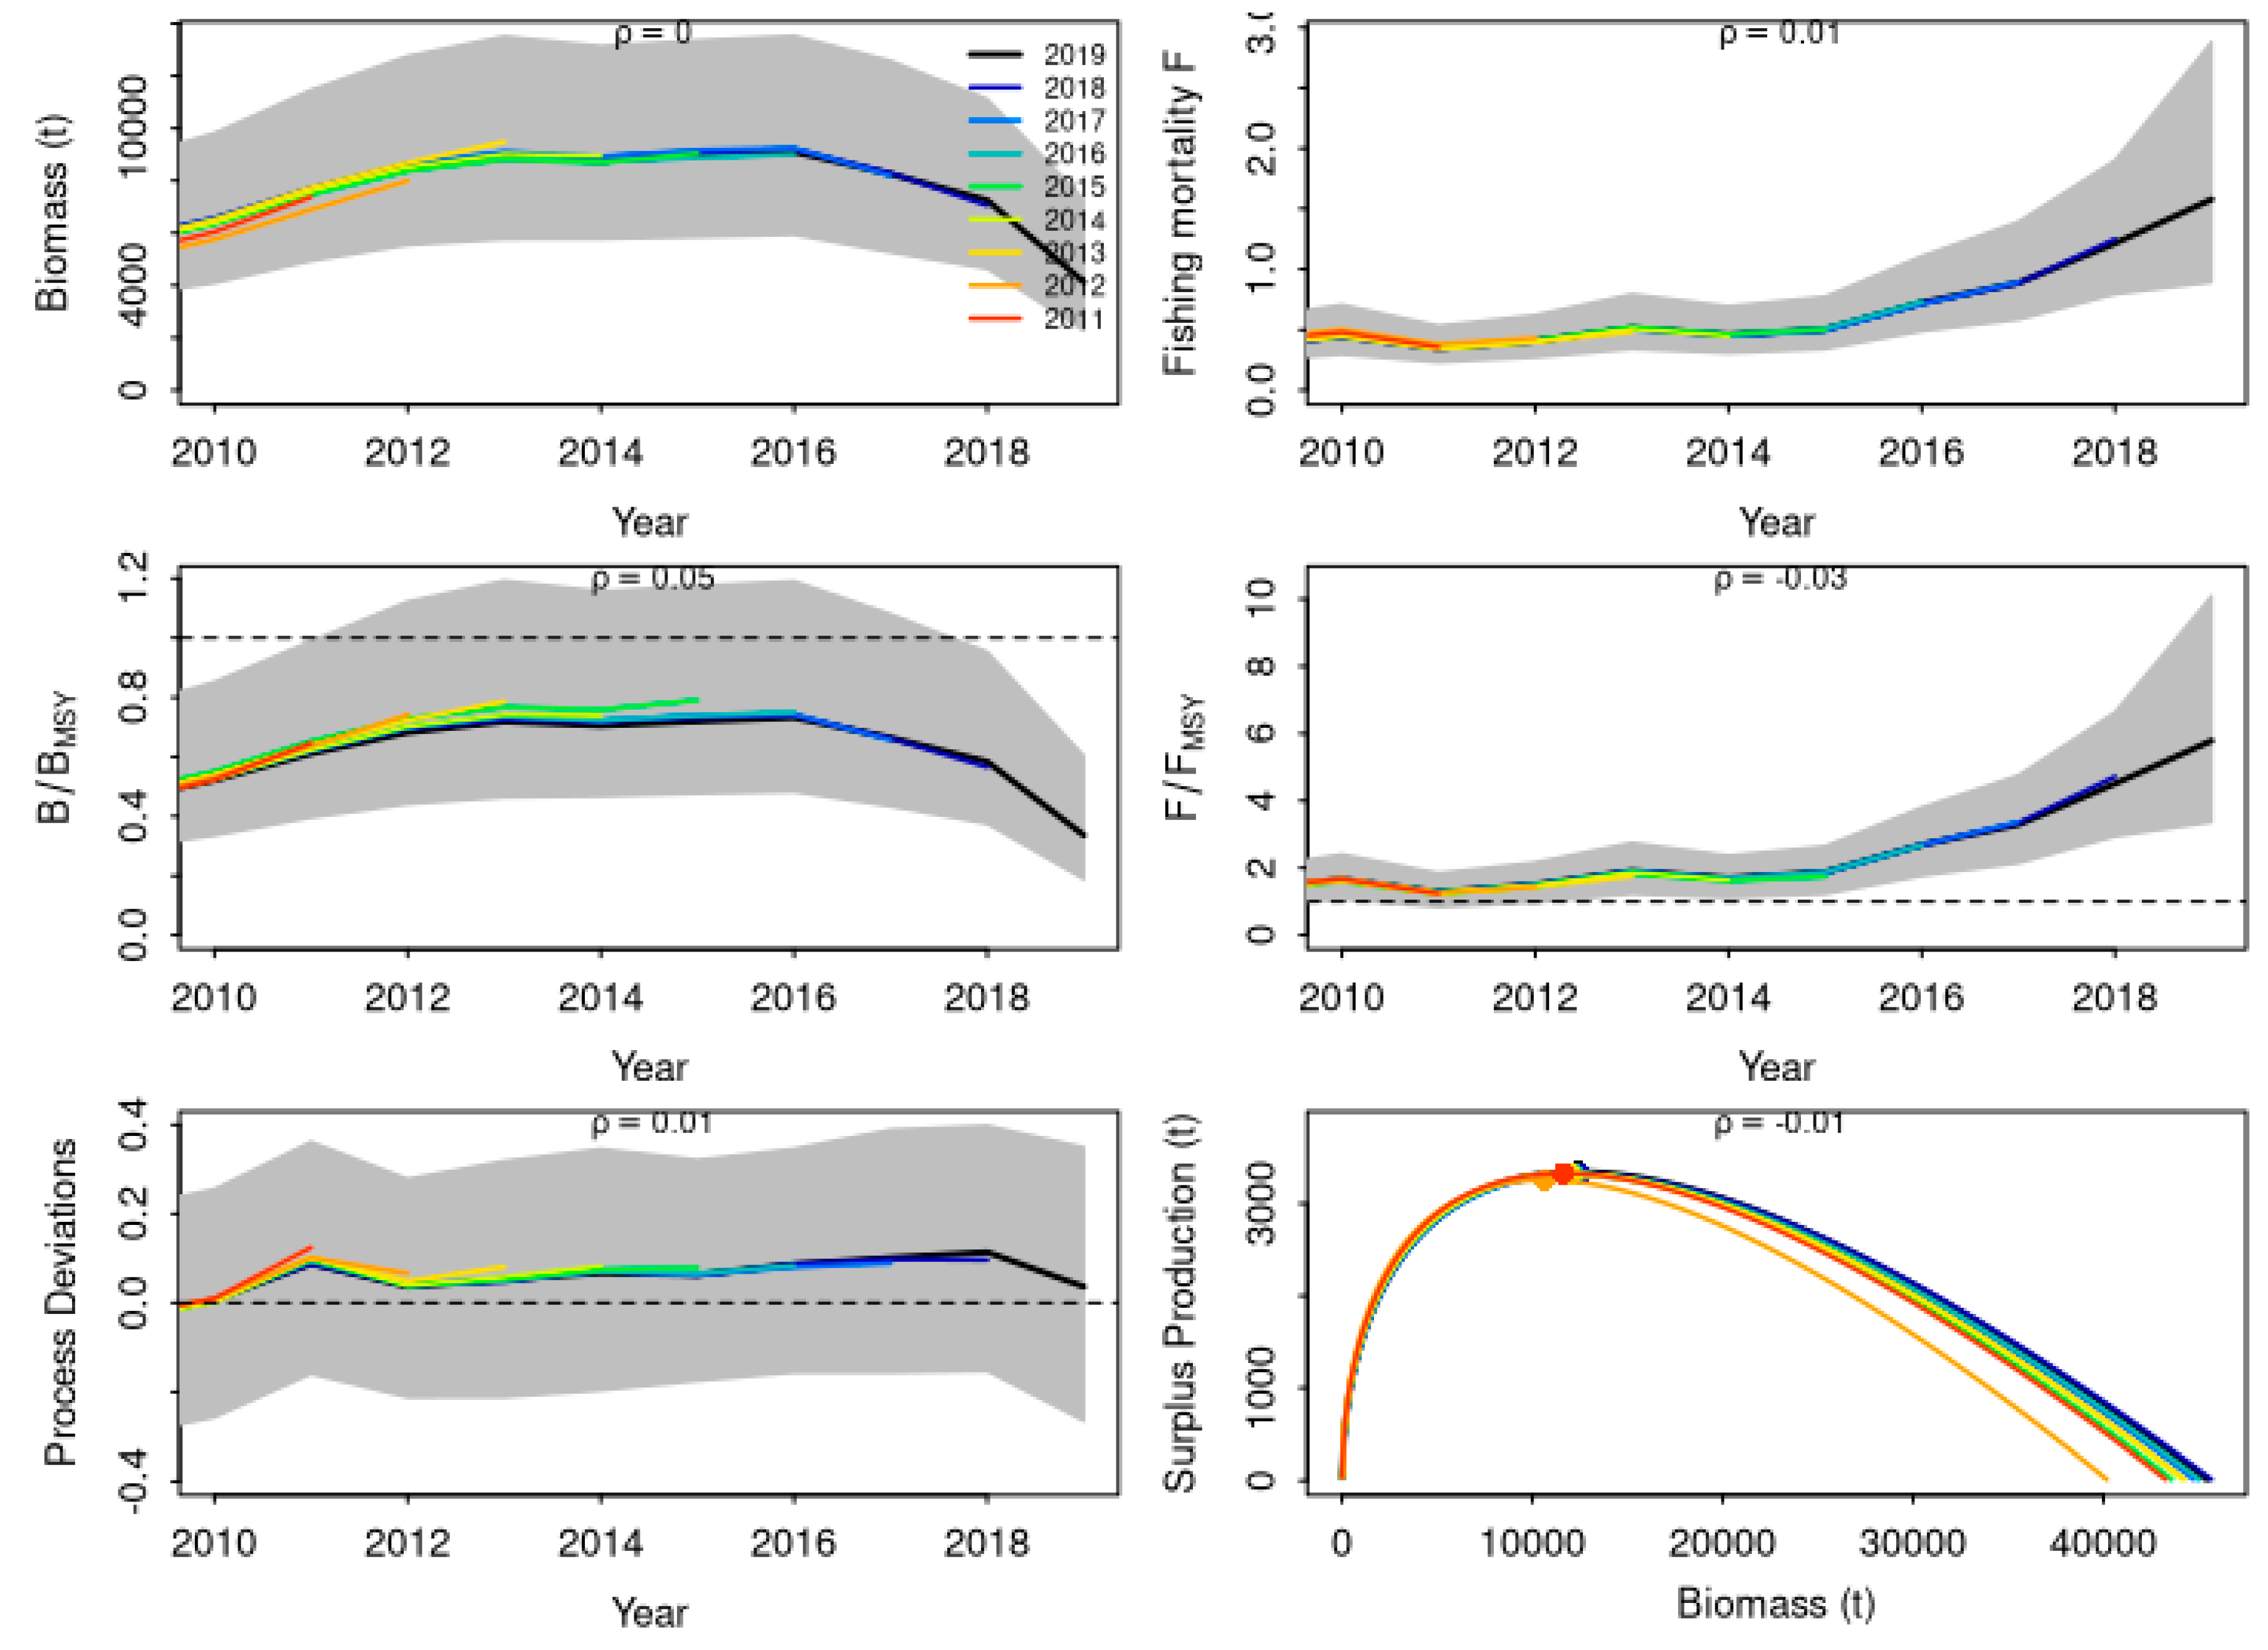
4.2.1. JABBA
4.2.2. LBB
5. Discussion
6. Conclusions
Supplementary Materials
Author Contributions
Funding
Institutional Review Board Statement
Informed Consent Statement
Data Availability Statement
Acknowledgments
Conflicts of Interest
References
- Mora, C.; Myers, R.A.; Coll, M.; Libralato, S.; Pitcher, T.J.; Sumaila, R.U.; Zeller, D.; Watson, R.; Gaston, K.J.; Worm, B. Management Effectiveness of the World’s Marine Fisheries. PLoS Biol. 2009, 7, e1000131. [Google Scholar] [CrossRef] [PubMed]
- FAO. Summary Report of the FAO-CECAF Working Group on the Assessment of Demersal Resources off Northwest Africa (Agadir, Morocco 4–12 June 2024); FAO Fisheries and Aquaculture Report; FAO: Rome, Italy, 2024; 18p. [Google Scholar]
- Punt, A.E. 2023. Those who fail to learn from history are condemned to repeat it: A perspective current stock assessment good practices and the consequences of not following them. Fish. Res. 2023, 261, 106642. [Google Scholar] [CrossRef]
- CNROP. Méthodologies d’évaluation directe par chalutage en Afrique de l’ouest. In Proceedings of the Groupe de Travail CNROP, Nouadhibou, Nouadhibou, Mauritania, 25–29 November 1990. 30p. [Google Scholar]
- Cury, P.; Worms, J. Pêche Biologie et Dynamique du Thiof (Epinephelus aeneus, E. Geoff St Hill, 1817) sur les Côtes Sénégalaises; Documents Scientifiques No. 82; Centre de Recherches Océanographiques et de Pêches de Dakar-Thiaroye: Dakar, Senegal, 1982. [Google Scholar]
- Vally, Y.E.; Quenum, C.L.; MThiaw, M.; Guitton, J.; Meissa, B.; Le Pape, O. Quantitative mapping of effective habitats for the white grouper Epinephelus aeneus (Geoffroy Saint-Hilaire, 1817) in North West Africa. Reg. Stud. Mar. Sci. 2023, 65, 103067. [Google Scholar] [CrossRef]
- Ba, K.; Thiaw, M.; Fall, M.; Thiam, N.; Meissa, B.; Jouffre, D.; Thiaw, O.T.; Gascuel, D. Long-term fishing impact on the Senegalese coastal demersal resources: Diagnosing from stock assessment models. Aquat. Living Resour. 2018, 31, 8. [Google Scholar] [CrossRef]
- Champagnat, C.; Domain, F. Migrations des poissons démersaux le long des côtes Ouest-Africaines de10 à 24° de latitude Nord. Cahier de l’ORSTOM Série Océanographique 1978, 16, 239–261. [Google Scholar]
- Meissa, B.; Gascuel, D.; Rivot, E. Assessing stocks in data-poor African fisheries: A case study on the white grouper Epinephelus aeneus of Mauritania. Afr. J. Mar. Sci. 2013, 35, 253–267. [Google Scholar] [CrossRef]
- Laurans, M. Ressources et exploitations “démersales” en Afrique de l’ouest: Evaluation des stocks, dynamique des populations et approche écosystémique. Ph.D. Thesis, École Nationale Supérieure Agronomique de Rennes, Rennes, France, 2005; 311p. [Google Scholar]
- Winker, H.; Carvalho, F.; Kapur, M. JABBA: Just Another Bayesian Biomass Assessment. Fish. Res. 2018, 204, 275–288. [Google Scholar] [CrossRef]
- Froese, R.; Winker, H.; Coro, G.; Demirel, N.; Tsikliras, A.C.; Dimarchopoulou, D.; Scarcella, G.; Probst, W.N.; Dureuil, M.; Pauly, D. A new approach for estimating stock status from length frequency data. ICES J. Mar. Sci. 2018, 76, 350–351. [Google Scholar] [CrossRef]
- Froese, R.; Winker, H.; Coro, G.; Demirel, N.; Tsikliras, A.C.; Dimarchopoulou, D.; Scarcella, G.; Palomares, M.L.D.; Dureuil, M.; Pauly, D. Estimating stock status from relative abundance and resilience. ICES J. Mar. Sci. 2020, 77, 527–538. [Google Scholar] [CrossRef]
- Gascuel, D.; Labrosse, P.; Meissa, B.; Taleb Sidi, M.O.; Guénette, S. Decline of demersal resources in North-West Africa: An analysis of Mauritanian trawl survey data over the last 25 years. Afr. J. Mar. Sci. 2007, 29, 331–345. [Google Scholar] [CrossRef]
- Girardin, M.; Dia, M.; Inejih, C.A. Comparaison de L’efficacité du Chalut du N’Diago Avant et Après 1989, Suite au Changement des Panneaux; Archives du Centre National de Recherches Océanographiques et des Pêches: Nouadhibou, Mauritania, 1990. [Google Scholar]
- Meissa, B.; Rivot, E.; Gascuel, D. Analysis of CPUE Data Series Through Generalized Linear Models and Delta Method to Derive Annual Series of Abundance Indices; Application to the Mauritanian demersal fishery; Scientific report European project ISTAM, Deliverable D.3.2; Agrocampus Ouest: Rennes, France, 2008. [Google Scholar]
- Stefansson, G. Analysis of groundfish survey abundance data: Combining the GLM and delta approaches. ICES J. Mar. Sci. 1996, 53, 577–588. [Google Scholar] [CrossRef]
- Le Pape, O.; Chauvet, F.; Mahévas, S.; Lazure, P.; Guérault, D.; Désaunay, Y. Quantitative description of habitat suitability for the juvenile common sole (Soleasolea, L.) in the Bay of Biscay (France) and the contribution of different habitats to the adult population. J. Sea Res. 2003, 50, 139–149. [Google Scholar] [CrossRef]
- Laurent, A.G. Lognormal distribution and the translation method: Description and estimation problems. J. Americ. Statist. Assoc. 1963, 58, 231–235. [Google Scholar] [CrossRef]
- Meyer, R.; Millar, R.B. BUGS in Bayesian stock assessment. Can. J. Fish. Aquat. Sci. 1999, 56, 1078–1086. [Google Scholar] [CrossRef]
- Palomares, M.L.D.; Pauly, D. On the creeping increaseof vessels’ fishing power. Ecol. Soc. 2019, 24, 31. [Google Scholar] [CrossRef]
- Thiao, D.; Westlund, L.; Sambe, B.; Diadhiou, H.D.; Dème, M.; Mbenga, A.; Diop, M. A perception-based participatory monitoring and evaluation approach to foster effective co-management of the marine protected areas in Northwest Africa. Ocean. Coast. Manag. 2019, 175, 1–16. [Google Scholar] [CrossRef]
- Carvalho, F.; Punt, A.E.; Chang, Y.J.; Maunder, M.N.; Piner, K.R. Can diagnostic tests help identify model misspecification in integrated stock assessments? Fish Res. 2017, 192, 28–40. [Google Scholar] [CrossRef]
- Hyndman, R.J.; Koehler, A.B. Another look at measures of forecast accuracy. Int. J. Forecast. 2006, 22, 679–688. [Google Scholar] [CrossRef]
- Carvalho, F.; Winker, H.; Courtney, D.; Kapur, M.; Kell, L.; Cardinale, M.; Schirripa, M.; Kitakado, T.; Yemane, D.; Piner, K.R.; et al. A cookbook for using model diagnostics in integrated stock assessments. Fish. Res. 2021, 240, 105959. [Google Scholar] [CrossRef]
- Froese, R.; Winker, H.; Gascuel, D.; Sumalia, U.R.; Pauly, D. Minimizing the impact of fishing. Fish Fish. 2016, 17, 785–802. [Google Scholar] [CrossRef]
- Meissa, B.; Dia, M.; Baye, B.C.; Bouzouma, M.; Beibou, E.; Roa-Ureta, R.H. A Comparison of Three Data-Poor Stock Assessment Methods for the Pink Spiny Lobster Fishery in Mauritania. Front. Mar. Sci. 2021, 8, 714250. [Google Scholar] [CrossRef]
- Geweke, J. Evaluating the accuracy of sampling-based approaches to the calculation of posterior moments. In Bayesian Statistics 4: Proceedings of the Fourth Valencia International Meeting; Berger, J.O., Bernardo, J.M., Dawid, A.P., Smith, A.F.M., Eds.; Clarendon Press: Oxford, UK, 1992; pp. 169–193. [Google Scholar]
- Heidelberger, P.; Welch, P.D. Simulation run length control in the presence of an initial transient. Oper. Res. 1992, 31, 1109–1144. [Google Scholar] [CrossRef]
- Brochier, T.; Auger, P.A.; Pecquerie, L.; Machu, E.; Baye, C.M.; Thiaw, M.; Brehmer, P. Investigating Sardinella aurita seasonal migratory pattern off North-West Africa with a biophysical model. In Book of Abstract IV Congress of Marine Sciences, Las Palmas de Gran Canaria, Spain, 11–13 June 2014; Universidad de Las Palmas de Gran Canaria: Las Palmas, Spain, 2014; p. 458. ISBN 13: 978-84-697-0471-4. [Google Scholar]
- Dowling, N.A.; Smith, A.D.; Smith, D.C.; Parma, A.M.; Dichmont, C.M.; Sainsbury, K.; Wilson, J.R.; Dougherty, D.T.; Cope, J.M. Generic solutions for data-limited fishery assessments are not so simple. Fish Fish. 2019, 20, 174–188. [Google Scholar] [CrossRef]
- Wetzel, C.R.; Punt, A.E. Performance of a fisheries catch-at-age model (Stock Synthesis) in data-limited situations. Mar. Freshw. Res. 2011, 62, 927–936. [Google Scholar] [CrossRef]
- Costello, C.; Ovando, D.; Hilborn, R.; Gaines, S.D.; Deschenes, O.; Lester, S.E. Status and solutions for the world’s unassessed fisheries. Science 2012, 338, 517–520. [Google Scholar] [CrossRef]
- Dowling, N.A.; Dichmont, C.M.; Haddon, M.; Smith, D.C.; Smith, A.D.M.; Sainsbury, K. Empirical harvest strategies for data-poor fisheries: A review of the literature. Fish. Res. 2015, 171, 141–153. [Google Scholar] [CrossRef]
- Dowling, N.A.; Wilson, J.R.; Rudd, M.B.; Babcock, E.A.; Caillaux, M.; Cope, J.; Dougherty, D.; Fujita, R.; Gedamke, T.; Gleason, M.; et al. FishPath: A Decision Support System for Assessing and Managing Data-and Capacity Limited Fisheries. In Assessing and Managing Data-Limited Fish Stocks; Alaska Sea Grant—University of Alaska Fairbanks: Fairbanks, AK, USA, 2016. [Google Scholar]
- Chrysafi, A.; Kuparinen, A. Assessing abundance of populations with limited data: Lessons learned from data-poor fisheries stock assessment. Environ. Rev. 2016, 24, 25–38. [Google Scholar] [CrossRef]
- Rosenberg, A.A.; Kleisner, K.M.; Afflerbach, J.; Anderson, S.C.; Dickey-Collas, M.; Cooper, A.B.; Fogarty, M.J.; Fulton, E.A.; Gutiérrez, N.L.; Hyde, K.J.; et al. Applying a new ensemble approach to estimating stock status of marine fisheries around the world. Conserv. Lett. 2018, 11, e12363. [Google Scholar] [CrossRef]
- Wetzel, C.R.; Punt, A.E. Evaluating the performance of data-moderate and catch-only assessment methods for U.S. west coast groundfish. Fish. Res. 2015, 171, 170–187. [Google Scholar] [CrossRef]
- Chong, L.; Mildenberger, T.K.; Rudd, M.B.; Taylor, M.H.; Cope, J.M.; Branch, T.A.; Wolff, M.; Stäbler, M. Performance evaluation of data-limited, length-based stock assessment methods. ICES J. Mar. Sci. 2020, 77, 97–108. [Google Scholar] [CrossRef]
- Hordyk, A.R.; Prince, J.D.; Carruthers, T.R.; Walters, C.J. Comment on “A new approach for estimating stock status from length frequency data” by Froese et al. ICES J. Mar. Sci. 2019, 76, 457–460. [Google Scholar] [CrossRef]
- Pons, M.; Cope, J.M.; Kell, L.T. Comparing performance of catchbased and length-based stock assessment methods in data-limited fisheries. Can. J. Fish. Aquat. Sci. 2020, 77, 1026–1037. [Google Scholar] [CrossRef]


| Country | Datatype | Dataset | Period | Remarks on Missing Years |
|---|---|---|---|---|
| Senegal | Catch | Scientific Survey | 1971–2016 | Regularly missing (50%) |
| Commercial | 1974–2018 | ∅ | ||
| Length Frequencies | Scientific Survey | 1987–2016 | Regularly missing (50%) | |
| Commercial | 2004–2020 | ∅ | ||
| Gambia | Catch | Commercial | 1990–2018 | ∅ |
| Mauritania | Catch | Scientific Survey | 1982–2019 | Seldom missing (5%) |
| Commercial | 2006–2018 | ∅ | ||
| Length Frequencies | Scientific Survey | 1987–2018 | Occasionally missing (10%) | |
| Commercial | 2019–2020 | ∅ |
| Country | Dataset | Variables and Modality |
|---|---|---|
| Senegal | Scientific survey | year, month, season, area (Sud, Small Coast, North), depth (5–10 m, 10–20 m, 20–40 m, 40–60 m, 60–100 m, 100–200 m) |
| Artisanal fishery | year, month, season, area (Dakar, Small Coast, Great Coast), fishing gear (handline, fixed bottom net) | |
| Mauritania | Scientific survey | year, month, season, area (Sud, Center, North), depth (5–20 m, 20–40 m, 40–60 m, 60–100 m) |
| Artisanal fishery | year, month, season, area (Dakar, Small Coast, Great Coast), fishing gear (handline, hooks) |
| Priors | Distribution |
|---|---|
| , carrying capacity | |
| q, catchability | Range [0–10] |
| , intrinsic rate of stock growth | |
| , initial depletion rate (φ = B1974/K) | |
| , shape parameter of the Pella–Tomlinson model | |
| , process variance (default) |
| Country | Data Used | Model | % Deviance | |||||||
|---|---|---|---|---|---|---|---|---|---|---|
| Year | Season | Depth | Area | Fishing Gear | Year: Area | Area: Depth | Total | |||
| Senegal | Survey | IA 0/1 | 5.9 | 0.7 | 3.8 | 2.8 | 4.0 | 17.3 | ||
| IA + | 10.5 | 12.4 | 5.8 | 7.2 | 4.8 | 40.8 | ||||
| Artisanal | IA 0/1 | 10.4 | 2.4 | 1.2 | 2.8 | 16.9 | ||||
| IA + | 4.6 | 0.9 | 4.3 | 3.8 | 4.9 | 18.1 | ||||
| Mauritania | Survey | IA 0/1 | 5.9 | 5.8 | 0.7 | 2.6 | 15 | |||
| IA + | 17.1 | 17.1 | ||||||||
| Artisanal | IA 0/1 | 3.1 | 9.4 | 25.6 | 38.2 | |||||
| IA + | 8.5 | 36.3 | 29 | 63.5 | ||||||
| Country | Abundance Indices | CV | Remarks |
|---|---|---|---|
| Scientific_Survey_early | 0.15 | ∅ | |
| Senegal | Scientific_Survey_late | 0.15 | ∅ |
| Artisanal | 0.25 | Fish creep: 1–7% | |
| Scientific_Survey_early | 0.2 | ∅ | |
| Mauritania | Scientific_Survey_late | 0.15 | CV of 0.5 for 2004–2005 |
| Artisanal | 0.25 | Fish creep: 1–3% |
| Scenario | Reference Points | ||||||
|---|---|---|---|---|---|---|---|
| K | B_msy | F_msy | MSY | F/Fmsy | B/Bmsy | B/K | |
| Optimistic | 43,578 | 11,811 | 0.27 | 3230 | 4.93 | 0.41 | 0.11 |
| Intermediate | 45,522 | 12,284 | 0.27 | 3329 | 5.79 | 0.34 | 0.09 |
| Pessimistic | 53,401 | 14,924 | 0.24 | 3609 | 6.84 | 0.26 | 0.07 |
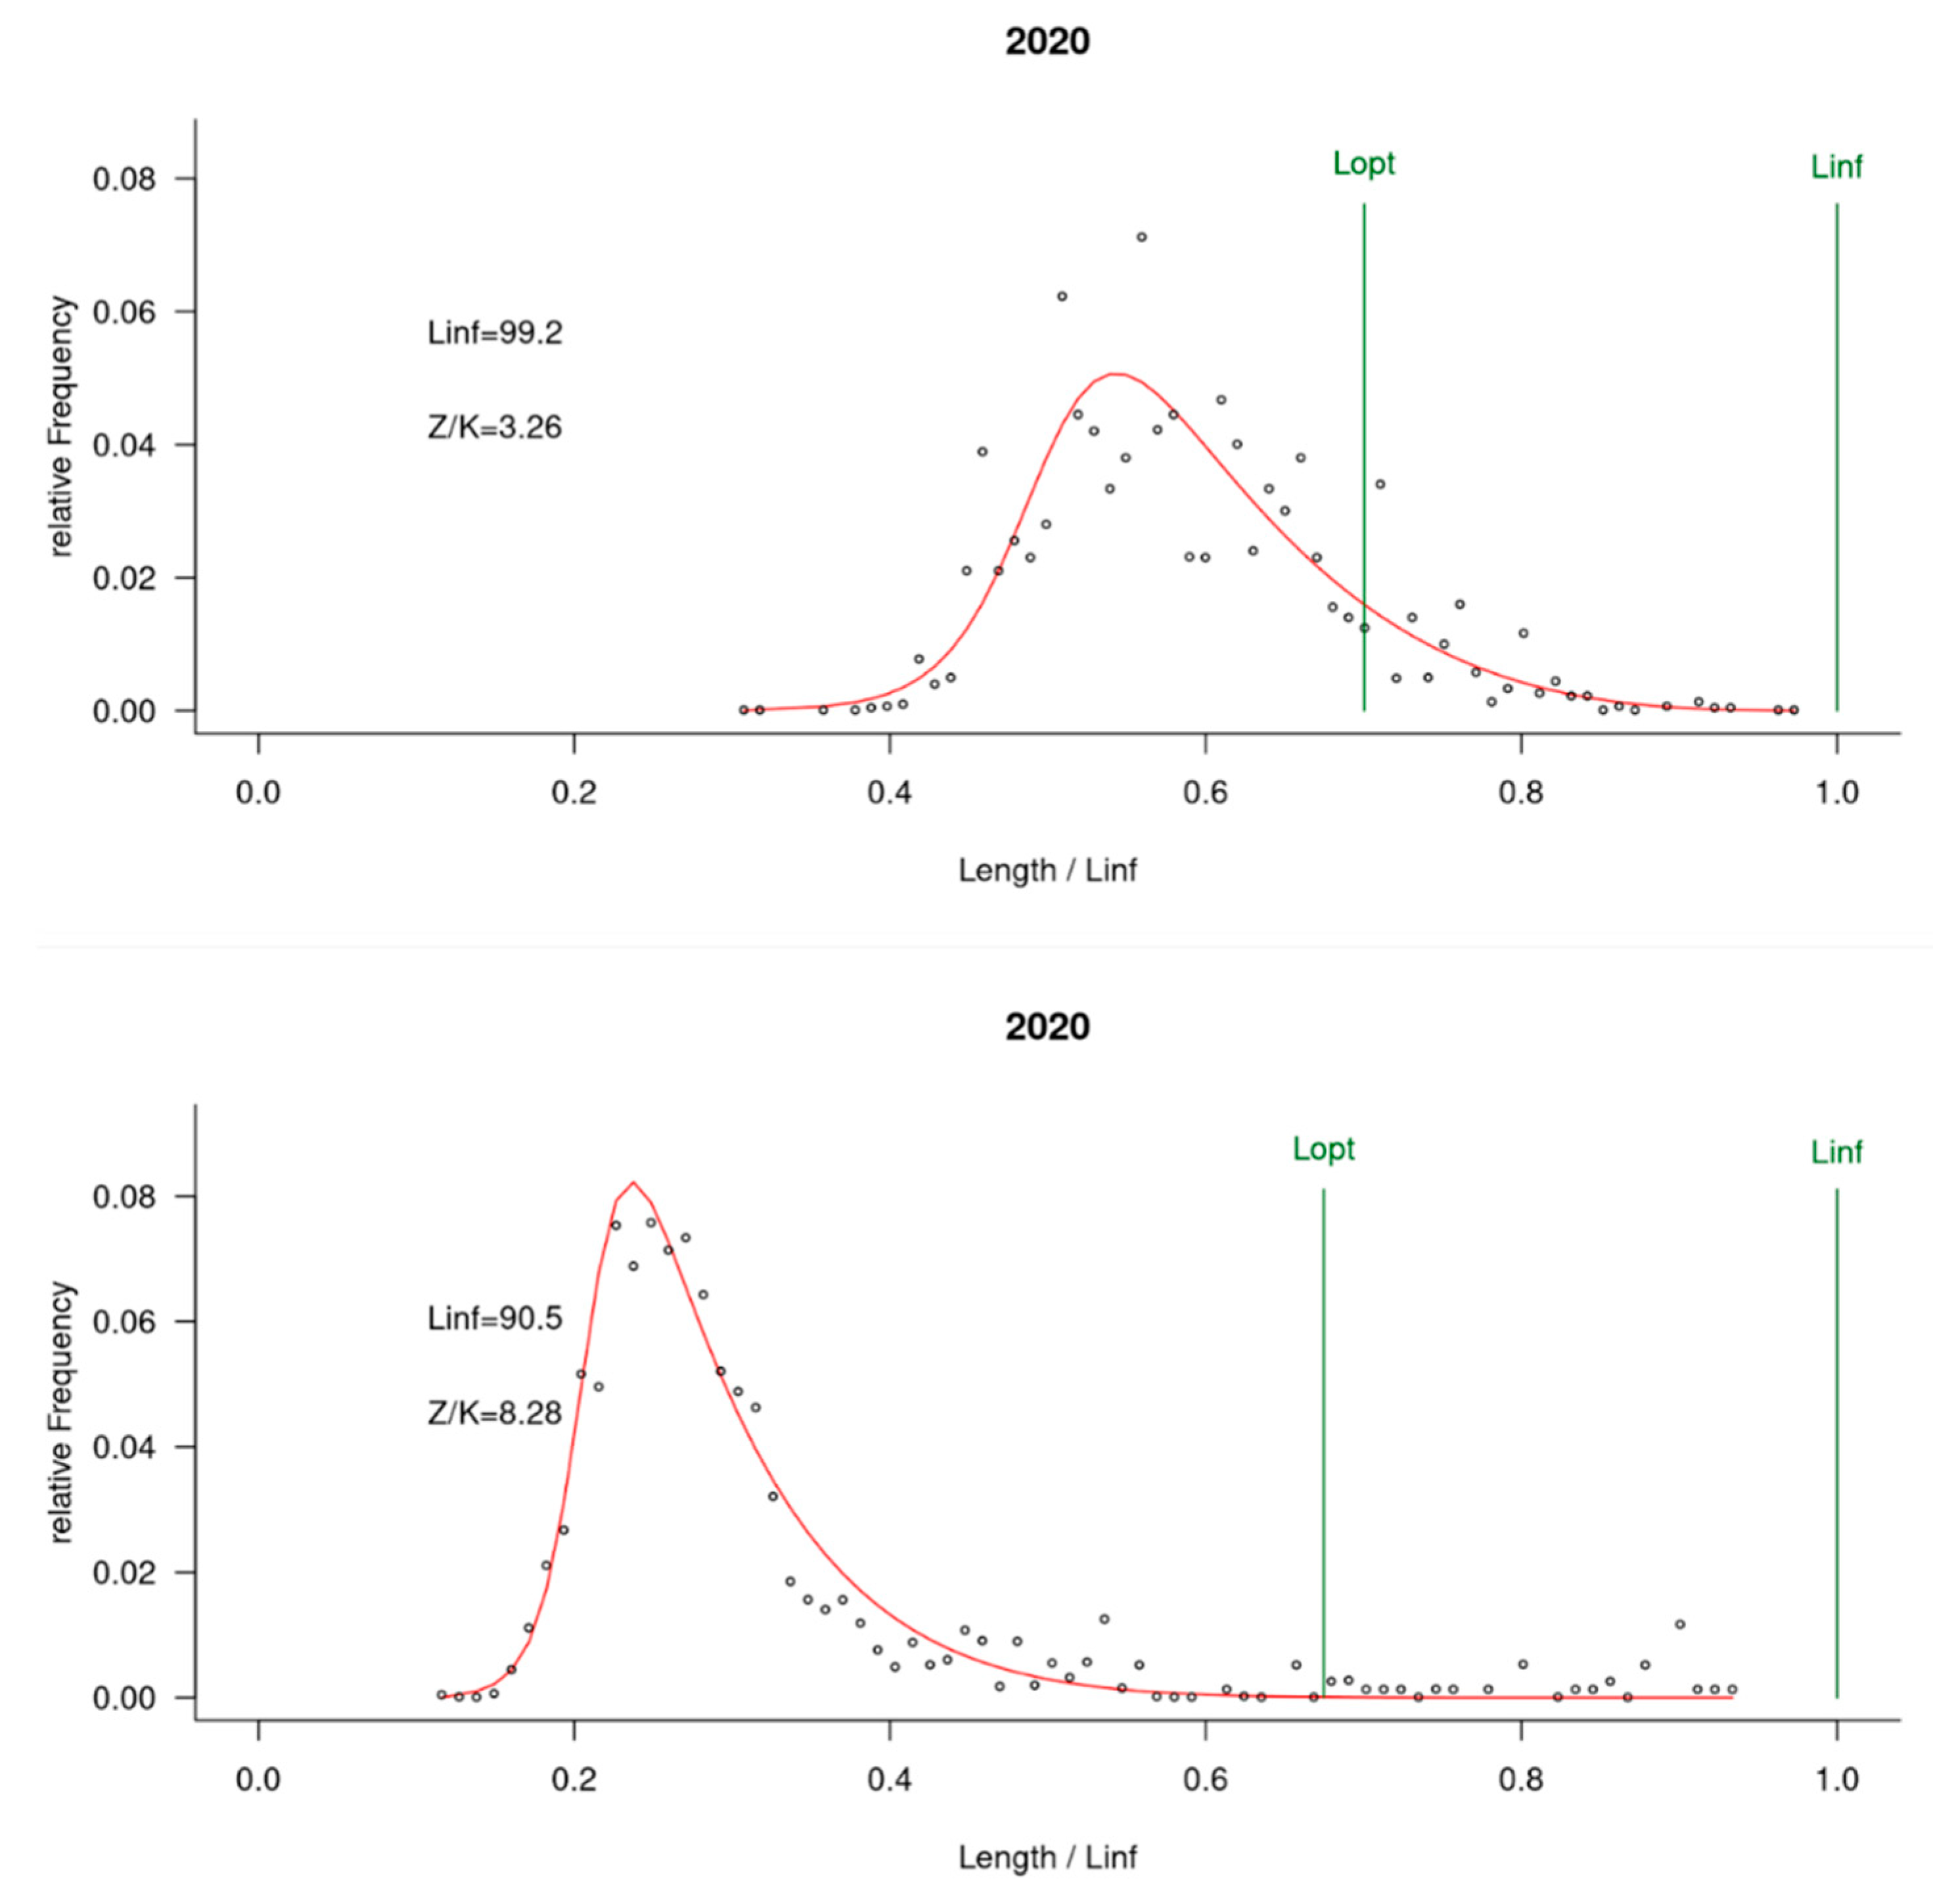
| Country | Sampling Period | Linf | Lmean/Lopt | Lc/Lc_opt | B/B0 | B/BMSY | F/M | F/K | Z/K |
|---|---|---|---|---|---|---|---|---|---|
| Senegal and Gambia | 2004–2006 | 95.2 | 0.72 | 0.47 | 0.83 | 1.8 | 0.1 | 0.1 | 1.1 |
| 2007–2009 | 94.6 | 0.71 | 0.51 | 0.20 | 0.7 | 1.5 | 0.9 | 1.5 | |
| 2010–2012 | 94.5 | 0.72 | 0.43 | 0.81 | 1.9 | 0.1 | 0.1 | 1.1 | |
| 2013–2015 | 94.9 | 0.70 | 0.58 | 0.04 | 0.1 | 5.8 | 2.8 | 3.3 | |
| 2016–2018 | 91.9 | 0.59 | 0.47 | 0.1 | 0.2 | 2.4 | 2.4 | 3.4 | |
| 2019–2021 | 90.5 | 0.46 | 0.33 | 0.01 | 0.03 | 8.8 | 8.5 | 9.5 | |
| Mauritania | 2019–2021 | 99.2 | 0.87 | 0.82 | 0.24 | 0.64 | 1.5 | 2 | 3.27 |
Disclaimer/Publisher’s Note: The statements, opinions and data contained in all publications are solely those of the individual author(s) and contributor(s) and not of MDPI and/or the editor(s). MDPI and/or the editor(s) disclaim responsibility for any injury to people or property resulting from any ideas, methods, instructions or products referred to in the content. |
© 2025 by the authors. Licensee MDPI, Basel, Switzerland. This article is an open access article distributed under the terms and conditions of the Creative Commons Attribution (CC BY) license (https://creativecommons.org/licenses/by/4.0/).
Share and Cite
Meissa, B.; Quemper, F.; Thiaw, M.; Ba, K.; Tfeil, B.M.; Jallow, M.S.; Guitton, J.; Sharma, R.; Gascuel, D. Assessment of over Four Decades the Status of White Grouper Epinephelus aeneus (Geoffroy Saint-Hilaire, 1817) Population in the Eastern Central Atlantic. Fishes 2025, 10, 98. https://doi.org/10.3390/fishes10030098
Meissa B, Quemper F, Thiaw M, Ba K, Tfeil BM, Jallow MS, Guitton J, Sharma R, Gascuel D. Assessment of over Four Decades the Status of White Grouper Epinephelus aeneus (Geoffroy Saint-Hilaire, 1817) Population in the Eastern Central Atlantic. Fishes. 2025; 10(3):98. https://doi.org/10.3390/fishes10030098
Chicago/Turabian StyleMeissa, Beyah, Florian Quemper, Modou Thiaw, Kamarel Ba, Brahim Mohamed Tfeil, Momodou S. Jallow, Jérome Guitton, Rishi Sharma, and Didier Gascuel. 2025. "Assessment of over Four Decades the Status of White Grouper Epinephelus aeneus (Geoffroy Saint-Hilaire, 1817) Population in the Eastern Central Atlantic" Fishes 10, no. 3: 98. https://doi.org/10.3390/fishes10030098
APA StyleMeissa, B., Quemper, F., Thiaw, M., Ba, K., Tfeil, B. M., Jallow, M. S., Guitton, J., Sharma, R., & Gascuel, D. (2025). Assessment of over Four Decades the Status of White Grouper Epinephelus aeneus (Geoffroy Saint-Hilaire, 1817) Population in the Eastern Central Atlantic. Fishes, 10(3), 98. https://doi.org/10.3390/fishes10030098