Article

Integration of Gill and Intestinal Osmoregulatory Functions to Assess the Smoltification Window in Atlantic Salmon

1
Department of Biological Sciences, University of Bergen, 5020 Bergen, Norway
2
Instituto de Ciencias Marinas de Andalucía, Consejo Superior de Investigaciones Científicas (ICMAN-CSIC), 11519 Cádiz, Spain
*
Author to whom correspondence should be addressed.
Current address: Institute of Marine Research, 9007 Tromsø, Norway.
Fishes 2025, 10(3), 119; https://doi.org/10.3390/fishes10030119
Submission received: 22 January 2025 / Revised: 4 March 2025 / Accepted: 6 March 2025 / Published: 8 March 2025
(This article belongs to the Special Issue Rhythms in Marine Fish and Invertebrates)

Abstract

:
The transfer time of Atlantic salmon smolts from freshwater to seawater remains a challenge in aquaculture, with the “smolt window” referring to the optimal timeframe for seawater readiness. Our study monitored Atlantic salmon osmoregulatory adaptations during smoltification under continuous light (LL) and winter signal regime (6 weeks LD 12:12) followed by 6 or 8 weeks of constant light. Fish were subsequently reared in seawater for 8 weeks and subjected to a stress event of cyclic hypoxia at the conclusion of the trial. Significant differences in growth trajectories were observed between the LL and LD groups, with fish receiving the winter signal showing compensatory growth after seawater transfer. Gill Na+/K+-ATPase (NKA) activity, plasma ions, glucose, and cortisol levels confirmed the importance of the winter signal for seawater adaptation. Molecular markers, including nka isoforms, Na+-K+-2Cl cotransporter (nkcc), cystic fibrosis transmembrane conductance regulator (cftr), and Na+/HCO3 cotransporter (nbc), showed distinct temporal expression patterns, particularly in gills and midgut. Notably, the LD group with delayed seawater transfer exhibited enhanced growth and improved hypo-osmoregulatory capacity. These findings underscore the advantages of a winter signal in smoltification and suggest that delaying seawater transfer for up to 8 weeks could be beneficial.
Key Contribution: The present study indicates that extending the time in freshwater up to 8 weeks after the winter signal enhances the osmoregulatory capacity of both the gills and intestine in Atlantic salmon. Additionally, our findings indicate that the maturation of osmoregulatory functions in the intestine triggers a range of physiological responses during smoltification, with the posterior midgut displaying the most pronounced physiological modifications during this process.

1. Introduction

Atlantic salmon (Salmo salar) is an anadromous species that hatches and lives in freshwater (FW) during the first stages of life before migrating to seawater (SW) for faster growth in a more energy-rich marine environment. Unlike other anadromous fish, salmonids have developed a complex set of physiological changes to preadapt to the osmotic conditions of the SW environment. The process of transitioning from an FW to an SW environment is known as smoltification, or parr–smolt transformation, a developmental stage that prepares the fish to migrate downstream and be prepared and adapt to ocean life [1]. The changes occurring during this period are characterized by a suite of morphological, physiological, and behavioral modifications [2,3,4]. These partly concurrent processes are tightly regulated to ensure the fish’s survival in the SW environment. The photoperiod is the primary environmental cue that ensures a correct synchronization and initiation of the physiological responses associated with smoltification in Atlantic salmon. In nature, smoltification occurs when the daylength increases after the winter season, whereas fish farmers artificially stimulate smoltification with the implement of a reduced photoperiod (LD, 12:12) followed by a continuous light phase (LD, 24:0) [5,6,7]. The onset of smoltification is controlled by various hormones, with increasing cortisol levels in the blood playing a key role in modulating the expression of genes associated with ion transporters in osmoregulatory organs [8,9,10,11,12,13]. The adjustment of the osmoregulatory mechanisms is at the core of the smoltification process, starting while the fish are still in FW. In this regard, previous studies have highlighted a decrease in plasma monovalent ions concentrations, including Na+ and Cl, during the FW phase, reflecting the development of hypo-osmoregulatory capacities [14,15,16,17].
The osmoregulatory function of the gills serves a central role in SW adaptation because of their direct exposure to the environment [14,18,19]. One important element in the osmoregulation is the Na+/K+-ATPase (NKA) activity, an enzyme capable of moving ions against an osmotic gradient, thus generating the membrane potential for the specialized ionocytes in the epithelium that actively transport ions, regulate osmotic gradients and ensure proper physiological function [19]. The measurement of NKA enzyme activity in the gills is a routine technique that has been extensively used to assess smoltification in research and in the aquaculture industry for anadromous species [19]. However, the efficacy of using it as the only marker to identify the timing for SW transfer has been questioned [20], particularly taking into consideration the high levels of mortality that continue to be registered after SW transfer [21,22]. In this context, several efforts have been made to evaluate Atlantic salmon adaptation to the SW environment by analyzing additional osmoregulatory tissues, such as the gastrointestinal tract (GIT) [15,23,24,25,26]. The salmon GIT is segmented into regions, each with specific functions crucial for digestion, nutrient absorption, and osmoregulation. The anterior GIT consists of the esophagus and stomach [27]. The esophagus transfers ingested feed from the mouth to the stomach, where mechanical and enzymatic digestion occurs [28]. The anterior GIT also contributes to osmoregulation. To avoid dehydration due to passive water loss in a hyperosmotic environment, fish in SW increase their water drinking rate to compensate for losses [29,30,31]. In this context, the anterior GIT is the primary site of desalinization, with active uptake of ions [32], while the posterior region of the GIT, the midgut (or anterior intestine), plays a significant role in maximizing nutrient uptake while desalinization and water uptake take place [32]. The hindgut (or posterior intestine) is responsible for the final stages of water reabsorption and the formation of feces, playing a crucial role in osmoregulation by reabsorbing water and essential ions to maintain the internal balance [23]. As in the gills, the NKA enzyme activity is the driving force for the epithelium transport of water and ions. Indeed, a seasonally independent increment of NKA enzyme activity has been found in both the anterior and posterior intestine when Atlantic salmon is moved into the SW environment [15,33].
The NKA enzyme is a heteromeric complex composed of three subunits (α, β, and γ), with the α subunit serving as the main catalytic unit; in salmonids, five isoforms have been described [34]. In smolting Atlantic salmon gills, the mRNA abundance of the nkaα1a decreases, while the nkaα1b increases [14,35]. On the other hand, in the intestine, the nkaα1c is the predominant isoform, while nkaα1a is expressed at very low levels [36]. Other important biomarkers involved in the active transport of Na+, K+, and Cl ions include the Na+-K+-2Clcotransporter (nkcc) and cystic fibrosis transmembrane conductance regulator (cftr) isoforms cftrI and cftrII, which are upregulated in the gills during the SW adaptation [14,37,38], as well as in the intestine [15,39]. In the intestine, the excess of divalent ions, such as Mg2+ and Ca2+, are eliminated by the Na+/HCO3 cotransporter (NBC). This cotransporter moves HCO3 ions from the plasma into the enterocyte, promoting an alkaline luminal pH, which causes the precipitation of Ca2+ and Mg2+ in the form of carbonate [40]. In the gills, the nbc gene is involved in sustaining the acid–base equilibrium, especially during the FW phase [41,42].
The smolt window refers to a limited period when the fish is physiologically fully prepared to cope with environmental changes associated with the transfer to SW. Failing to meet the physiological criteria of peak smolt quality or transferring outside this “window” can result in high mortality, which remains a major challenge for the industry. Furthermore, delayed transfer can trigger “desmoltification”, i.e., when the fish lose the ability to adapt to the marine environment [43,44,45,46,47]. Understanding the dynamics and synchrony of the osmoregulatory mechanisms in different tissues during the smolt window can provide valuable information on the timing for the SW transfer as well as the consequences of a suboptimal adaptation to the SW environment. In this study, we aim to detail the dynamics of established biomarkers, such as NKA enzyme activity, and the gene expression of nka isoforms, nkcc, cftrI, cftrII, and nbc, which are involved in the osmoregulatory functions of the gills and intestine during smoltification. Furthermore, we examined how the timing of transfer to SW (6 or 8 weeks after the winter signal) influences the salmon osmoregulatory capability, growth, and the fish’s ability to cope with a stressful cycle of hypoxia, which is commonly encountered in production conditions in the sea.

2. Materials and Methods

2.1. Ethical Statement

The experiment complied with the guidelines of the Norwegian Regulation on Animal Experimentation, including the PIT-tagging and cyclic hypoxia, which have been approved by the National Animal Research Authority in Norway (FOTS ID28276). The participants responsible for the sampling were all accredited by the Federation of European Laboratory Animal Science Associations (FELASA).

2.2. Experimental Setup

In March 2022, 500 Atlantic salmon parr with a mean weight of 33.23 ± 5.41 g were obtained from Lerøy Sjøtroll Kjærelva RAS facility (Fitjar, Norway) and transferred to an FW flow-through system at the Department of Biological Sciences (University of Bergen, Bergen, Norway). One week after transport, fish were anesthetized with a non-lethal dose of NaHCO3-buffered tricaine methanesulphonate (80 mg/L MS-222TM; MSD Animal Health) and individually intra-peritoneally PIT-tagged with glass tags of 2.12 × 12 mm, 134.2 kHz ISO FDX-B using a single shot implanter. The PIT-tag was read using an Agrident APR600 reader. Fish were randomly distributed into 10 square 500 L tanks, with 50 fish in each tank. Tanks were constantly supplied with FW at a temperature of 10 °C, oxygen saturation over 80%, and constant light conditions. Fish were fed in excess with EWOS 2 mm commercial pellets provided by Lerøy Sjøtroll Kjærelva and using automatic feeders for 6 h a day during light periods.
Following a 25-day acclimation period, fish tanks were divided into two experimental groups, maintained during the FW phase: one subjected to constant light (LL) conditions and one exposed to a winter signal with a light regime of 12 h of light and 12 h of dark for 6 weeks (LD). After the winter signal, the LD group was returned to a constant light regime, and both groups were maintained under the same rearing conditions until the end of the FW phase.
In the SW phase, 3 experimental groups were established: LD-1—fish transferred to SW 6 weeks after the winter signal; LL—fish reared always in constant light and transferred at the same time as LD-1; and LD-2—fish transferred to SW 8 weeks after receiving the winter signal (see Figure 1 for detailed information). Fish were transferred into 6 SW cylindrical tanks with 460 L running 35 ppt SW, 2 tanks per experimental group (45 fish per tank). During the transfer, the fish were anesthetized with 80 mg/L MS222, the PIT-tag number was recorded, and weight and length were measured. Tanks were constantly maintained with flow-through SW at a temperature of 10 °C, oxygen saturation over 80%, and constant light conditions. During the SW phase, the fish were fed with 3 mm EWOS commercial pellets provided by Lerøy Sjøtroll Kjærelva using automatic feeders running daily for 6 h. The fish were exposed to a cyclic hypoxia stress event (this corresponds to 5 weeks in SW for the LD-2 group and 7 weeks in SW for the LL and LD-1 groups). The test comprised 4 cycles of hypoxia, each lasting 2 h, during which water flow was diminished to sustain oxygen saturation at approximately 50% and water temperature set to 15 °C. The trial ended two weeks after the cyclic hypoxic event, resulting in a total period of seven (LD-2) or nine weeks (LL and LD-1) in SW (Figure 1).

2.3. Sampling

Fish were sampled 2 h after the last meal to ensure the presence of intestinal content before sampling [33]. During the FW phase, 5 samplings were performed, each conducted at weeks 0, 2, 4, 6, and 8 after the end of the winter signal. A total of 24 fish per experimental group were collected at each sampling point. During the SW phase, two samplings, one before and one after the cyclic hypoxia event, were conducted (Figure 1). A total of 16 fish per experimental group (LL, LD-1, and LD-2) were collected at each sampling point.
A lethal dose of 200 mg/L of NaHCO3-buffered MS222 was used to euthanize the fish sampled. Blood was collected from the caudal vein using heparinized syringes and centrifuged for 3 min at 5000 rpm to separate the plasma from the cellular fraction of the blood. Plasma was aliquoted and immediately frozen on dry ice and stored at −80 °C until further analysis. PIT-tag, fish body weight (BW), and fork length were recorded immediately after. Fish were ventrally opened, and the liver, heart, and gonads were collected and weighed.
The first arch of the right gills was collected and cleaned, and gill filaments were placed into 0.6 mL tubes containing 100 µL SEI buffer (150 mM sucrose, 10 mM EDTA, 50 mM imidazole, pH 7.3) while the rest of the gill arch was placed into a 1.5 mL tube with 1 mL SEI buffer. Both tubes were frozen in dry ice and stored at −80 °C until further NKA analyses. The first gill arch from the fish’s left side was collected, the cartilage removed, and the filaments stored in RNAlater (Thermo Fisher Scientific, Waltham, MA, USA). The samples were thereafter refrigerated for one day and then stored at −80 °C until RNA isolation was performed.
The fish intestine was divided into 3 sections: anterior midgut (AMG), the region right after the last pyloric caeca; posterior midgut (PMG), before the ileorectal valve; and hindgut (HG), the distal region of the intestine (see Figure 2). From each section, a soft scrap of the mucosa was made with a glass slide and placed into a 0.6 mL tube containing 0.1 mL of intestinal SEI buffer (200 mM glycine, 27.74 mM EDTA, 50 mM EGTA, 300 mM glucose, 50 mM imidazole, pH 7.3. One tablet of cOmplete™ Mini Protease Inhibitor Cocktail from Roche was added prior use), as described by [33]. The samples were collected in duplicate and immediately frozen in dry ice and stored at −80 °C until analysis. Additionally, a small area of each intestinal section was collected, cleaned in 1xPBS buffer, and stored in RNAlater as described above.

2.4. Morphometrics

The following morphometric parameters were calculated:
Fulton’s condition factor (K): K = 100 × BW/L3
Hepatosomatic Index (HSI): HSI = 100 × LW/BW
Cardiosomatic Index (CSI): CSI = 100 × HW/BW
Gonadosomatic Index (GSI): GSI = 100 × GW/BW
Relative growth rate (RGR): RGR = 100 × (BW2 − BW1)/BW1))
Specific growth rate (SGR): SGR = 100 × (e((ln (BW2) −ln (BW1 or BW1.1))/t) − 1)
where BW is fish body weight (g), L is the fork length of the fish (cm), LW is the liver weight (g), HW is heart weight (g), GW is gonad weight (g), and t is the number of experimental days. BW2 refers to the BW at each sampling point, BW1 represents the BW at PIT-tagging, and BW1.1 is the BW at the SW transfer, only used for the calculation of the SGR during the SW phase. The Gonadosomatic Index (GSI) was only determined for males, and a conservative threshold of GSI > 0.05% was set to detect early maturation [48,49].

2.5. Plasma Analysis

The Pentra c400 Analyzer was utilized to determine the plasma concentrations of sodium, chloride, potassium, glucose, lactate, calcium, magnesium, and inorganic phosphorus. Monovalent ions were determined by potentiometry with an ion-selective electrode (ISE) module clinical chemistry analyzer (HORIBA), calibrated using the ABX Pentra Standards 1 and 2 and ABX Pentra Reference. Lactate, calcium, magnesium, phosphorus, and glucose concentrations were analyzed using standard enzymatic colorimetric methods with commercial kits (HORIBA).
Plasma cortisol concentrations were measured using a commercial competitive ELISA following the manufacturer’s instructions (Demeditec Diagnostics GmbH, DEH3388). The assays were conducted using 96-well plates containing standards of known concentrations and quality control samples. Each plasma sample was analyzed in triplicate with 10 μL in each well. The cortisol concentration was determined through a competition assay, where the plasma was incubated with a known concentration of horseradish peroxidase-labeled cortisol, competing for binding to the anti-cortisol antibody coated on the plate. The resulting color developed by TMB (3,3′, 5,5′-Tetramethylbenzidine) was measured at 450 nm using a Tecan Spark® multimode microplate reader and compared against the standard curve. Cortisol concentrations were calculated using a 4-parameter Marquardt logistic regression with an extrapolation factor of 1. Samples with a coefficient of variation above 12 were repeated.

2.6. Gene Expression Analysis

Total RNA was isolated using TRI reagent (Sigma-Aldrich, St. Louis, MO, USA) following the manufacturer’s instructions. Potential genomic DNA contamination was removed by treating 10 μg of total RNA with the TURBO DNase-free Kit (Ambion Applied Biosystems, Foster City, CA, USA) following the manufacturer’s instructions. The concentration and purity of the RNA were measured using a NanoDrop ND-1000 spectrophotometer (Thermo Fisher Scientific, Waltham, MA, USA). To ensure nonsystematic degradation was not due to sampling or extraction protocol, an Agilent 2100 Bioanalyzer (Agilent Technologies, Sta Clara, CA, USA) was used in 20% of the samples for each tissue. The SuperScript III First-Strand Synthesis kit (Invitrogen, Carlsbad, CA, USA) was used to synthesize the first-strand complementary DNA (cDNA) from 1.9 μg of DNase-treated total RNA in a final reaction volume of 20 µL.
Primer amplification efficiencies were determined by running a 2-fold dilution curve of a cDNA pool for each tissue, ranging from 50 ng to 3.125 ng. The efficiency of the primers was calculated for each gene and tissue individually through serial cDNA dilution, yielding values between 84 and 106%. Normalized efficiency-corrected relative gene expression was calculated according to [50] using the geometric mean of the endogenous reference genes ef1α and β-actin. A no-template control was used to ensure no contamination, and no-reverse transcriptase control was used to check for DNA contamination.
For gene expression analysis, cDNA was used as a template for RT-qPCR using specific primers for each gene of interest (Table 1). The RT-qPCR reactions were performed in duplicate in a final volume of 12.5 µL consisting of 2.5 µL of diluted cDNA, 6.25 µL of Universal SYBR Green Supermix (Bio-Rad Laboratories, Hercules, CA, USA), 0.25 µL of each forward and reverse primer (10 mM), and 3.25 µL of water. The reactions were run on a CFX-96 Real-Time PCR detection system platform (Bio-Rad Laboratories, Hercules, CA, USA), with the following RT-qPCR protocol: (1) 95 °C for 30 s, (2) 95 °C for 5 s, (3) 60 °C for 25 s (steps 2–4 repeated for 40 cycles), followed by a melting curve analysis over a range of 65–95 °C (increment of 0.5 °C per cycle). Interplate normalization was performed with a pooled cDNA sample of the corresponding tissue.

2.7. Na+, K+- ATPase Activity in Gills and Intestine

The NKA enzyme activity in the gills was determined following the protocol described by [53]. The NKA enzyme activity in the intestine was measured according to the protocol developed by [33]. In both protocols, the NKA enzyme activity was estimated in an ouabain-sensitive protein fraction obtained from gills and intestines. The estimation was based on the hydrolysis of ATP to ADP, a reaction linked enzymatically to the oxidation of NADH to NAD+ by pyruvate kinase and lactic dehydrogenase. The reaction was measured for 10 min at 25 °C and 340 nm in a Tecan Spark® multimode microplate reader with and without ouabain (0.5 mM), a specific NKA inhibitor, in duplicate. Another plate was used to determine the protein using the Thermo Scientific™ Pierce™ BCA Protein Assay Kit in triplicates according to manufacturer instructions. The activity is expressed as μmol ADP × mg protein−1 × hour−1.

2.8. Statistical Analysis

Statistical analyses were performed using R Statistical Software [54] and Rstudio (v2023.6,1,524, [55]). All dependent variables analyzed were tested for the best-fitted continuous distribution (Normal, lognormal, and gamma) using the package “fitdistrplus” [56]. The selection was based on visual assessment (density plot, plot of the empirical cumulative distribution function, and the empirical distribution of quantiles) and Akaike’s information criteria (AIC).
Due to the difference in the number of experimental groups between the FW and SW phases, each phase was analyzed separately using the package “glmmTMB” [57]. Two categorical variables were considered: treatment (in the FW phase: LL and LD; in the SW phase: LL, LD-1, and LD-2) and sampling point, as well as an interaction between treatment and sampling point. The model was adjusted using the link “identity” and “log” for normal and gamma distributions, respectively. For lognormal distribution, data were first log10-transformed and then analyzed as a normal distribution. Details of the distribution used to model each dependent variable, as well as the models’ parameters, are presented in the Supplementary Material (Supplementary Tables S1 and S2). For plasma cortisol analyses, a normal distribution was used, considering a zero-inflation factor due to a high number of values under the lower limit of detection, which in this case were treated as zero.
Model adjustments were checked with randomized quantile residuals [58] provided by the package “DHARMa” [59] with 1000 simulations. The same package was used to perform the Levene test for homogeneity of variance and nonparametric dispersion test via standard deviation of residuals fitted vs. simulated. The package “car” [60] was utilized to evaluate the significance of each variable and the interaction in the statistical models. Post hoc Sidak tests were performed using the “emmeans” package [61] to conduct pairwise comparisons of each level of the response variable.
All plots were produced with the “ggplot2” package [62], depicting response variables over time for the different groups in both FW and SW phases to represent the estimated mean of the model ± standard error of the mean. For multiple comparison procedures and adjusting p-values in the presence of multiple tests, the package “multcomp” [63] was used. A significance level of α = 0.05 was used for all statistical analyses.

3. Results

3.1. Morphometrics and Somatic Indexes

The LD and LL groups had a similar body weight at week 0 (at the end of the winter signal); however, the LL group had a significantly higher body weight at weeks 2 and 8 compared to the LD group (Figure 3A). In the SW phase, significant differences in growth were observed between the LD-1 and the LL group at the end of the trial (Table 2). The fish RGR, similarly to the body weight, was significantly affected by the treatment and sampling time during the FW phase (p < 0.001). The effect of the treatment during the SW phase was less relevant (p = 0.018) compared to the sampling point (p < 0.001). The fish in constant light had a significantly higher RGR compared to the LD fish at weeks 0 and 2 after the winter signal (Figure 3B). No other differences in the RGR were observed between the experimental groups.
The fish SGR in the FW phase was significantly affected by treatment (p < 0.001) and sampling (p < 0.001). Atlantic salmon in the LL group had a significantly higher SGR at the first two sampling points (weeks 0 and 2) compared to the LD group. After week 2, the LL group’s SGR decreased, and no significant differences were found between the LL and LD groups in the other FW phase sampling points (Figure 3C). During the SW phase, the SGR was affected only by the sampling point (p = 0.006). The LD-2 group had a significantly higher SGR in week 8 compared to week 5 after the SW transfer. Although there were no significant differences among experimental groups, LD-2 presented the highest SGR at the end of the trial.
There was a significant effect of the sampling point, treatment, and the interaction between both variables (p < 0.001, p = 0.003, p < 0.001) during the FW phase for the K. In the SW phase, K was only affected by treatment (p > 0.001). The K decreased in both LL and LD groups during the FW phase (Figure 3D). At week 2 after the winter signal, the LL group presented a lower K than the LD group. Subsequently, K stabilized in the LL group, while in the LD group, a decreasing trend for K becomes more pronounced. These differences in K were significant for all the sampling points, including in the SW phase, where both groups that received the winter signal (LD-1 and LD-2) presented a lower K compared with the constant light group (Table 2).
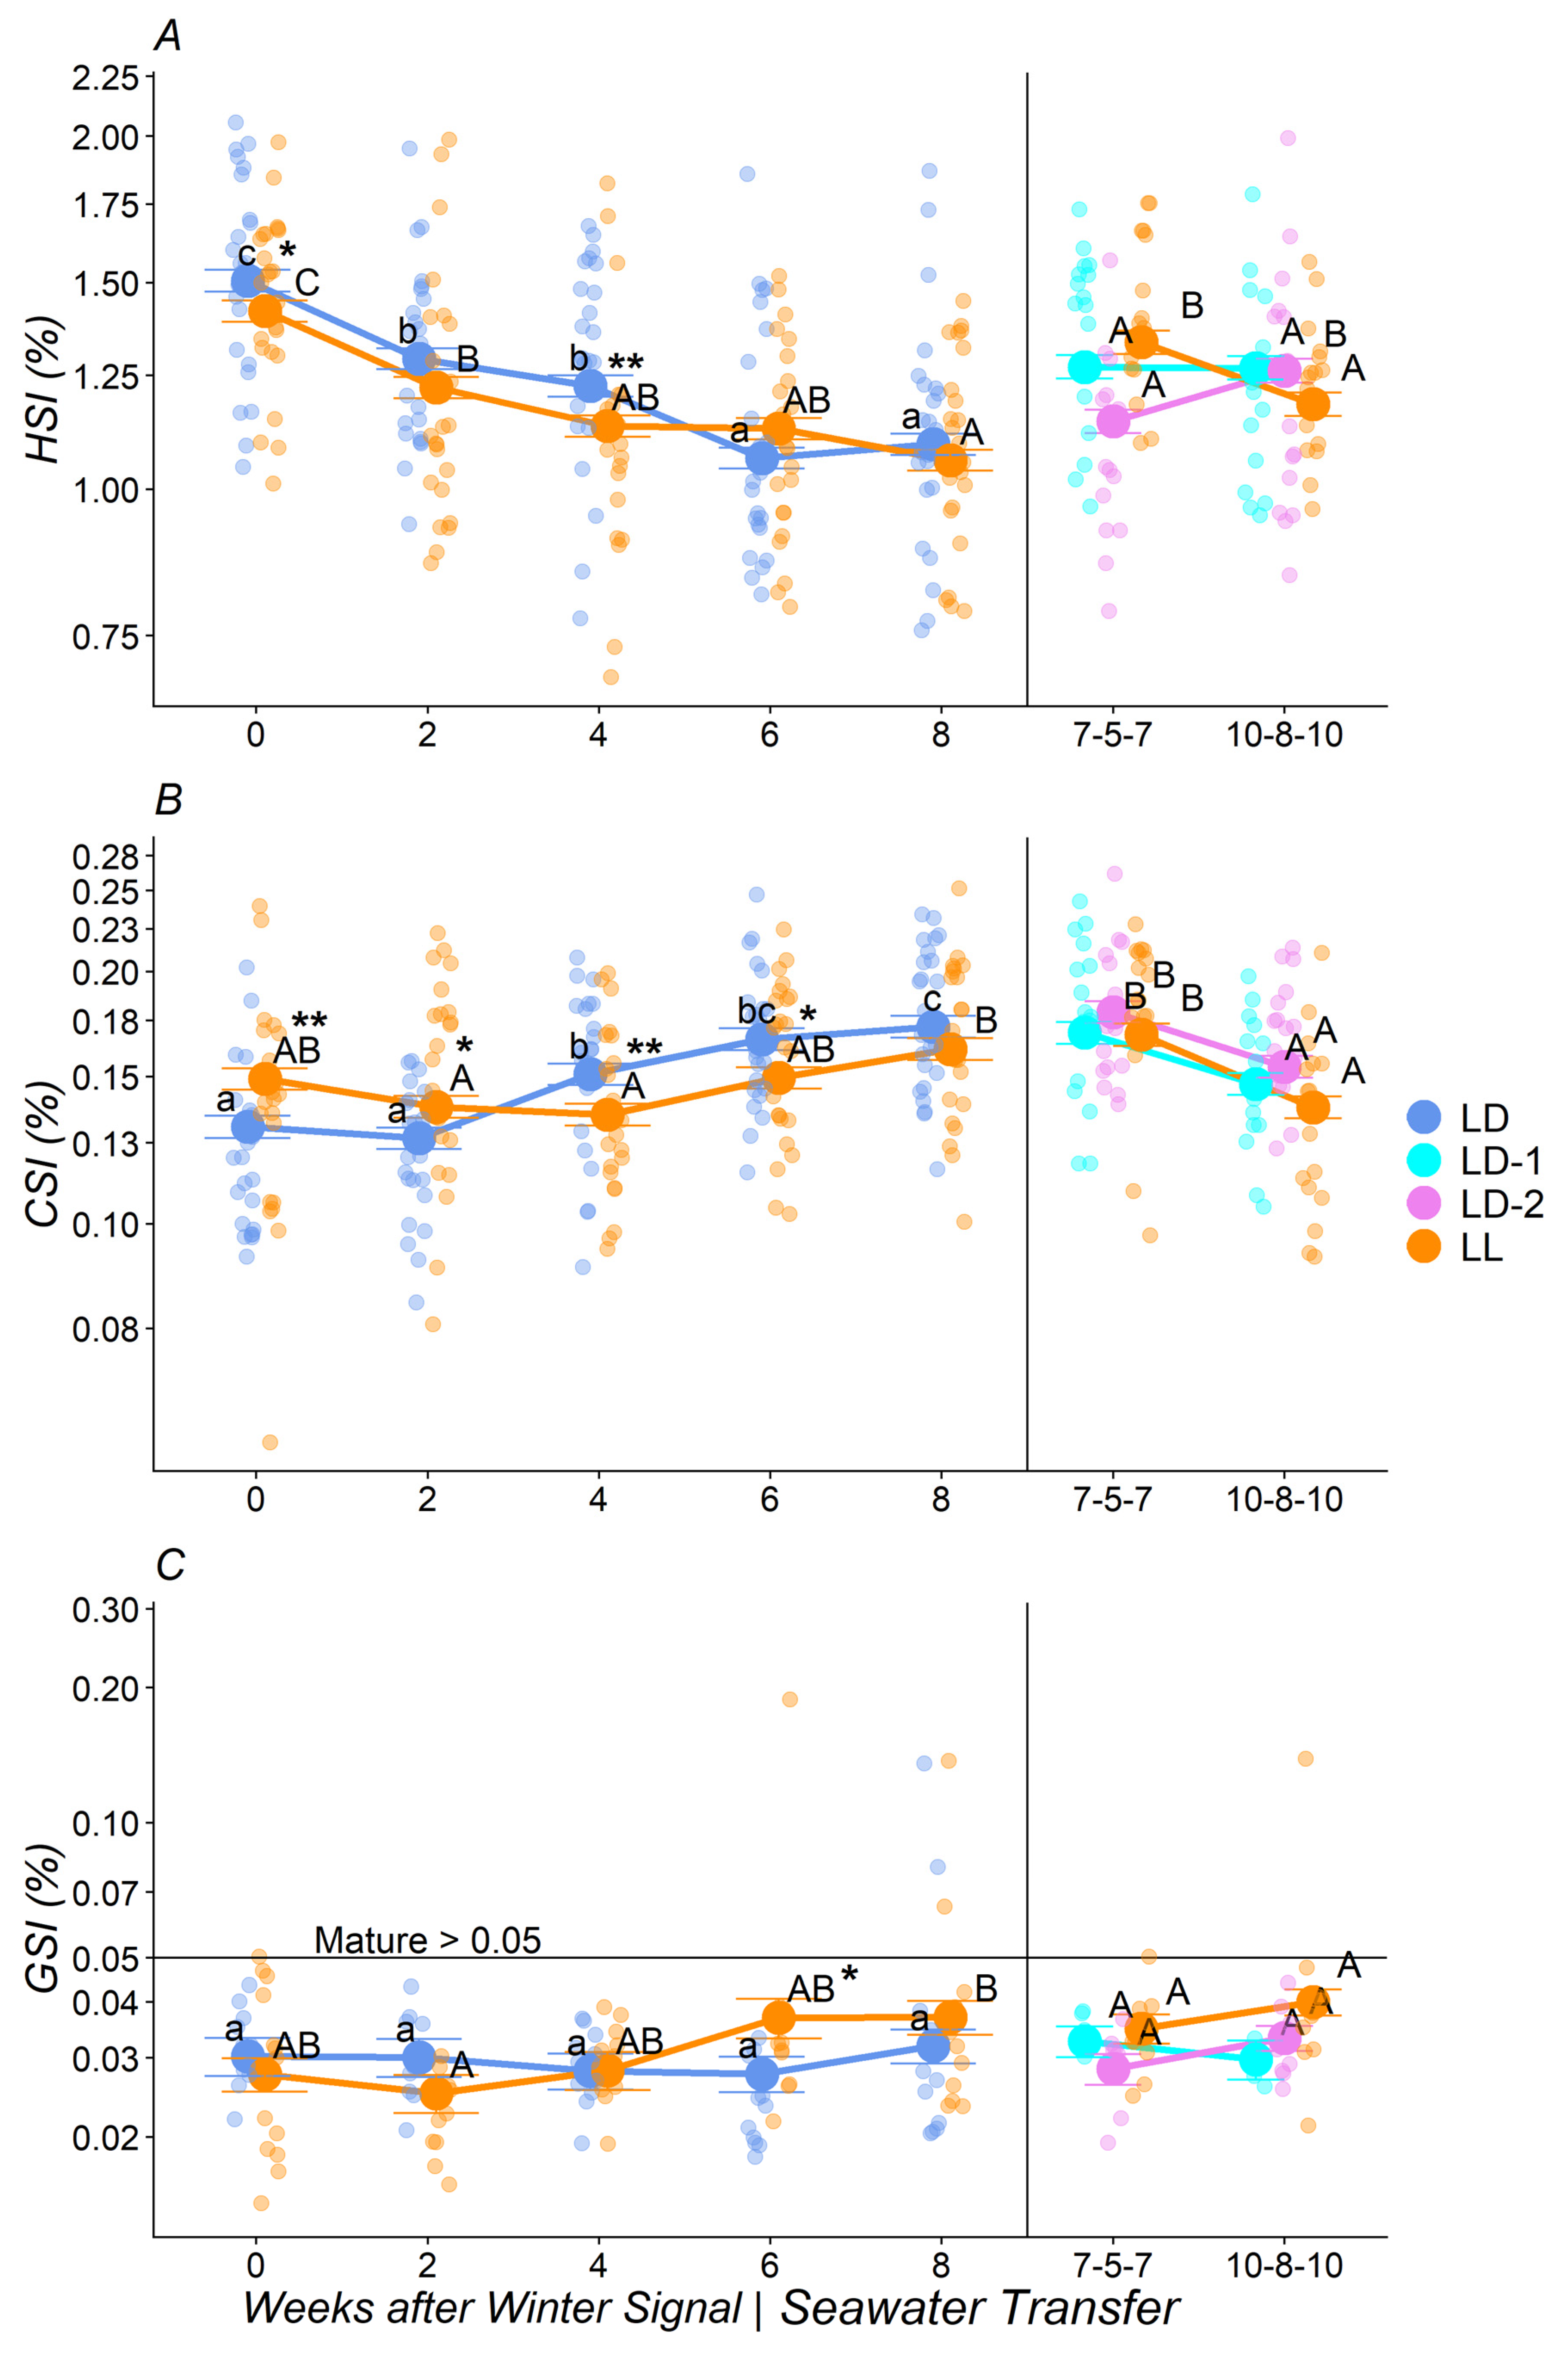
During the FW phase, the HSI was significantly affected by treatment (p = 0.011), sampling point (p < 0.001), and the interaction between both variables (p = 0.010), while in SW, only the effect of treatment (p = 0.038) and interaction (p < 0.001) were detected. For both light regime groups, a downward trend in HSI was observed during the FW phase (Figure 4A). In the first sampling in SW (weeks 4 and 6 after transfer), the LD-2 group presented the lowest HSI compared to the LL and LD-1 groups (Table 2), but at the end of the trial, the LL group had the lowest HSI, although not significantly different.
The CSI of the fish during the FW phase was not significantly affected by the treatment but by sampling (p < 0.001) and the interaction between treatment and sampling (p < 0.001), while during the SW phase, it was affected by the treatment (p = 0.015) and sampling (p < 0.001). At the end of the trial, the LL group presented the lowest CSI value (Figure 4B), significantly lower than the LD-2 group, which had the highest CSI (Table 2).
The GSI in males was not significantly affected by treatment, sampling point, or the interaction between those in the FW phase. However, at week 6 after the winter signal, one maturing male and a significant increase in the GSI was observed in the LL group (Figure 4C). In total, three maturing males were observed in the LL group from a total of 121 male fish sampled in the FW phase. During the SW phase, a total of two maturing males were found in the LL group, while in both LD groups, no maturing fish were observed. Significant differences were observed at week 10 between the LD-1 and LL groups (53 male fish for all three groups during the SW phase) (Table 2).

3.2. Plasma Metabolites

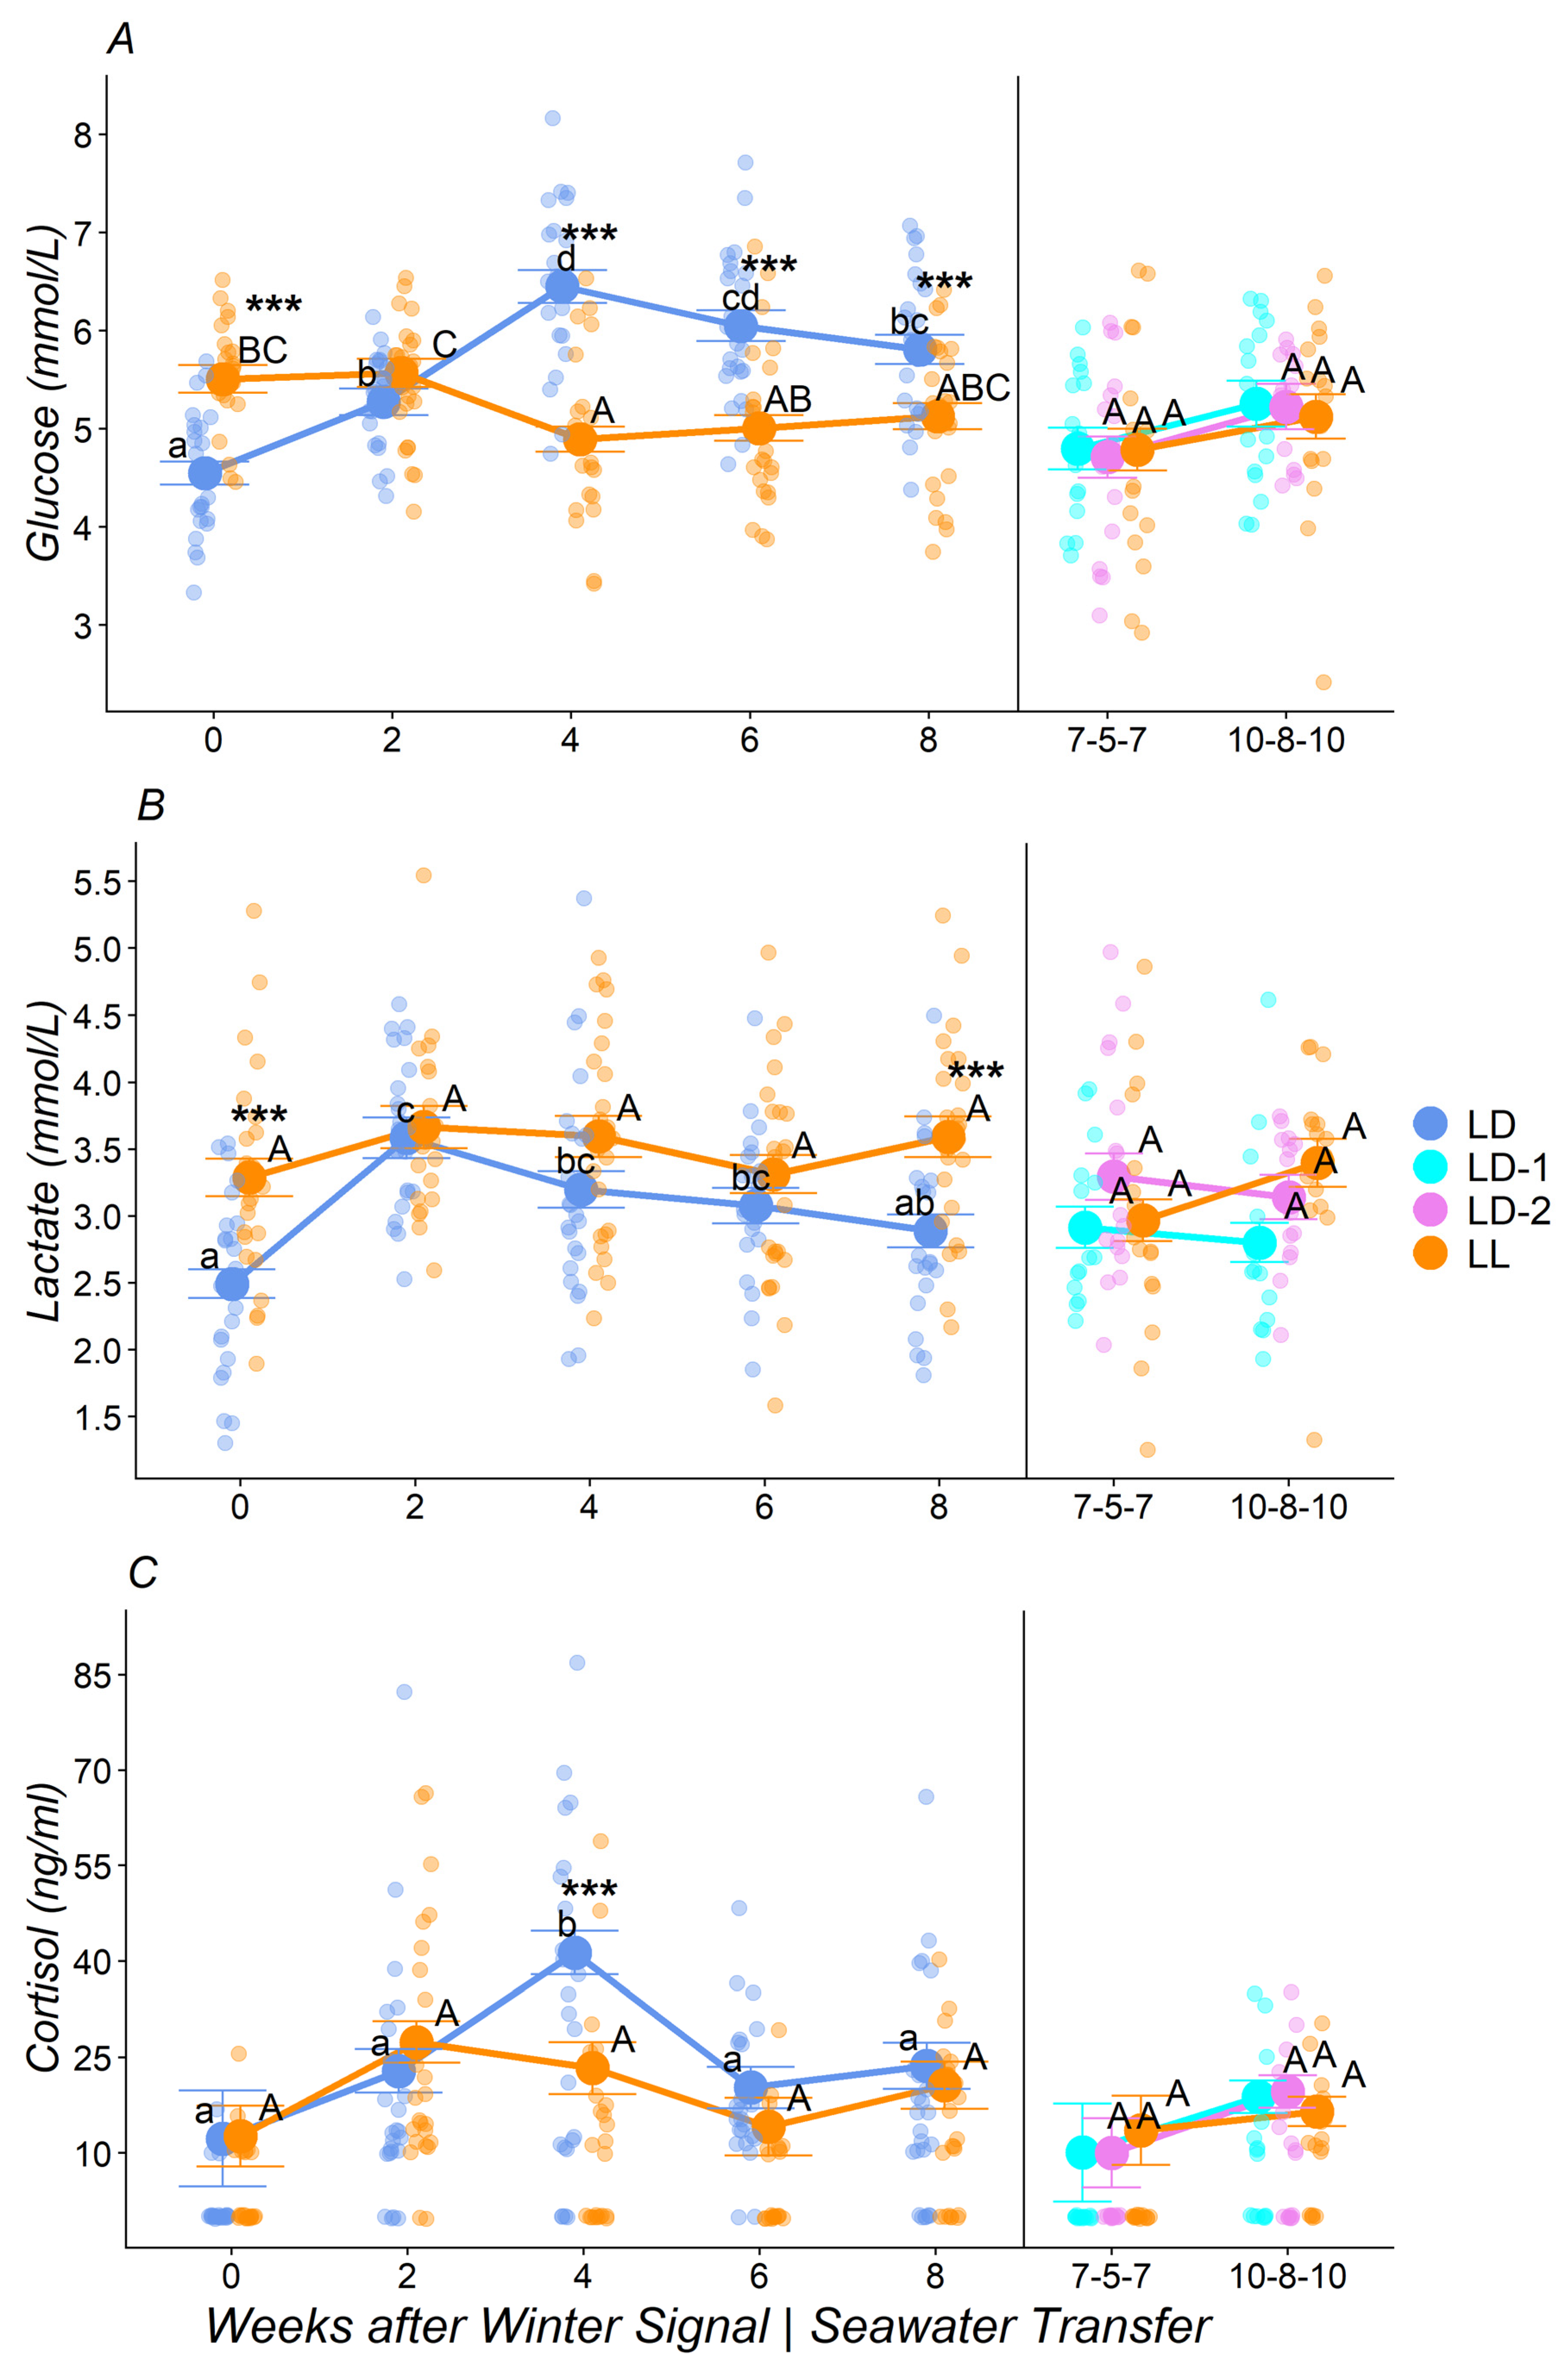
The plasma glucose levels were strongly affected (p < 0.001) by the treatment, sampling point, and the interaction between treatment and sampling during the FW phase but only affected by the sampling point during the SW phase (p = 0.016). At week 0 after the winter signal, the glucose levels in the LD group were significantly lower than in the LL group (Figure 5A). However, this result was reversed after week 4, based on a decrease in glucose plasma levels in the LL group and a pronounced increment of glucose levels in the LD group.
The lactate levels in plasma were affected by the treatment (p < 0.001), sampling point (p < 0.001), and the interaction between treatment and sampling (p = 0.018) during FW, but only by treatment in the SW phase (p = 0.047). No significant changes in lactate levels were observed in the LL group during the FW phase and SW phase (Figure 5B). At week 0 (end of the winter signal), the levels of lactate were significantly lower in the LD group. However, a significant increment in lactate levels was observed for the LD group at week 2 after the winter signal, but this was reverted toward the end of the FW phase. During the SW phase, the plasma lactate levels in both LD groups (LD-1 and LD-2) had a similar decreasing trend, while the LL group had an increasing trend (Table 2). The LD-1 group had the lowest lactate values, and the LL group had the highest values at the end of the SW phase.
After the winter signal (week 0), cortisol levels in plasma presented a similar trend for both LL and LD groups, but the LD group presented a pronounced peak at week 4 after the winter signal (Figure 5C). No significant differences in cortisol levels during the SW phase were found, although higher levels were observed in the last sampling for all groups.

3.3. Plasma Ions

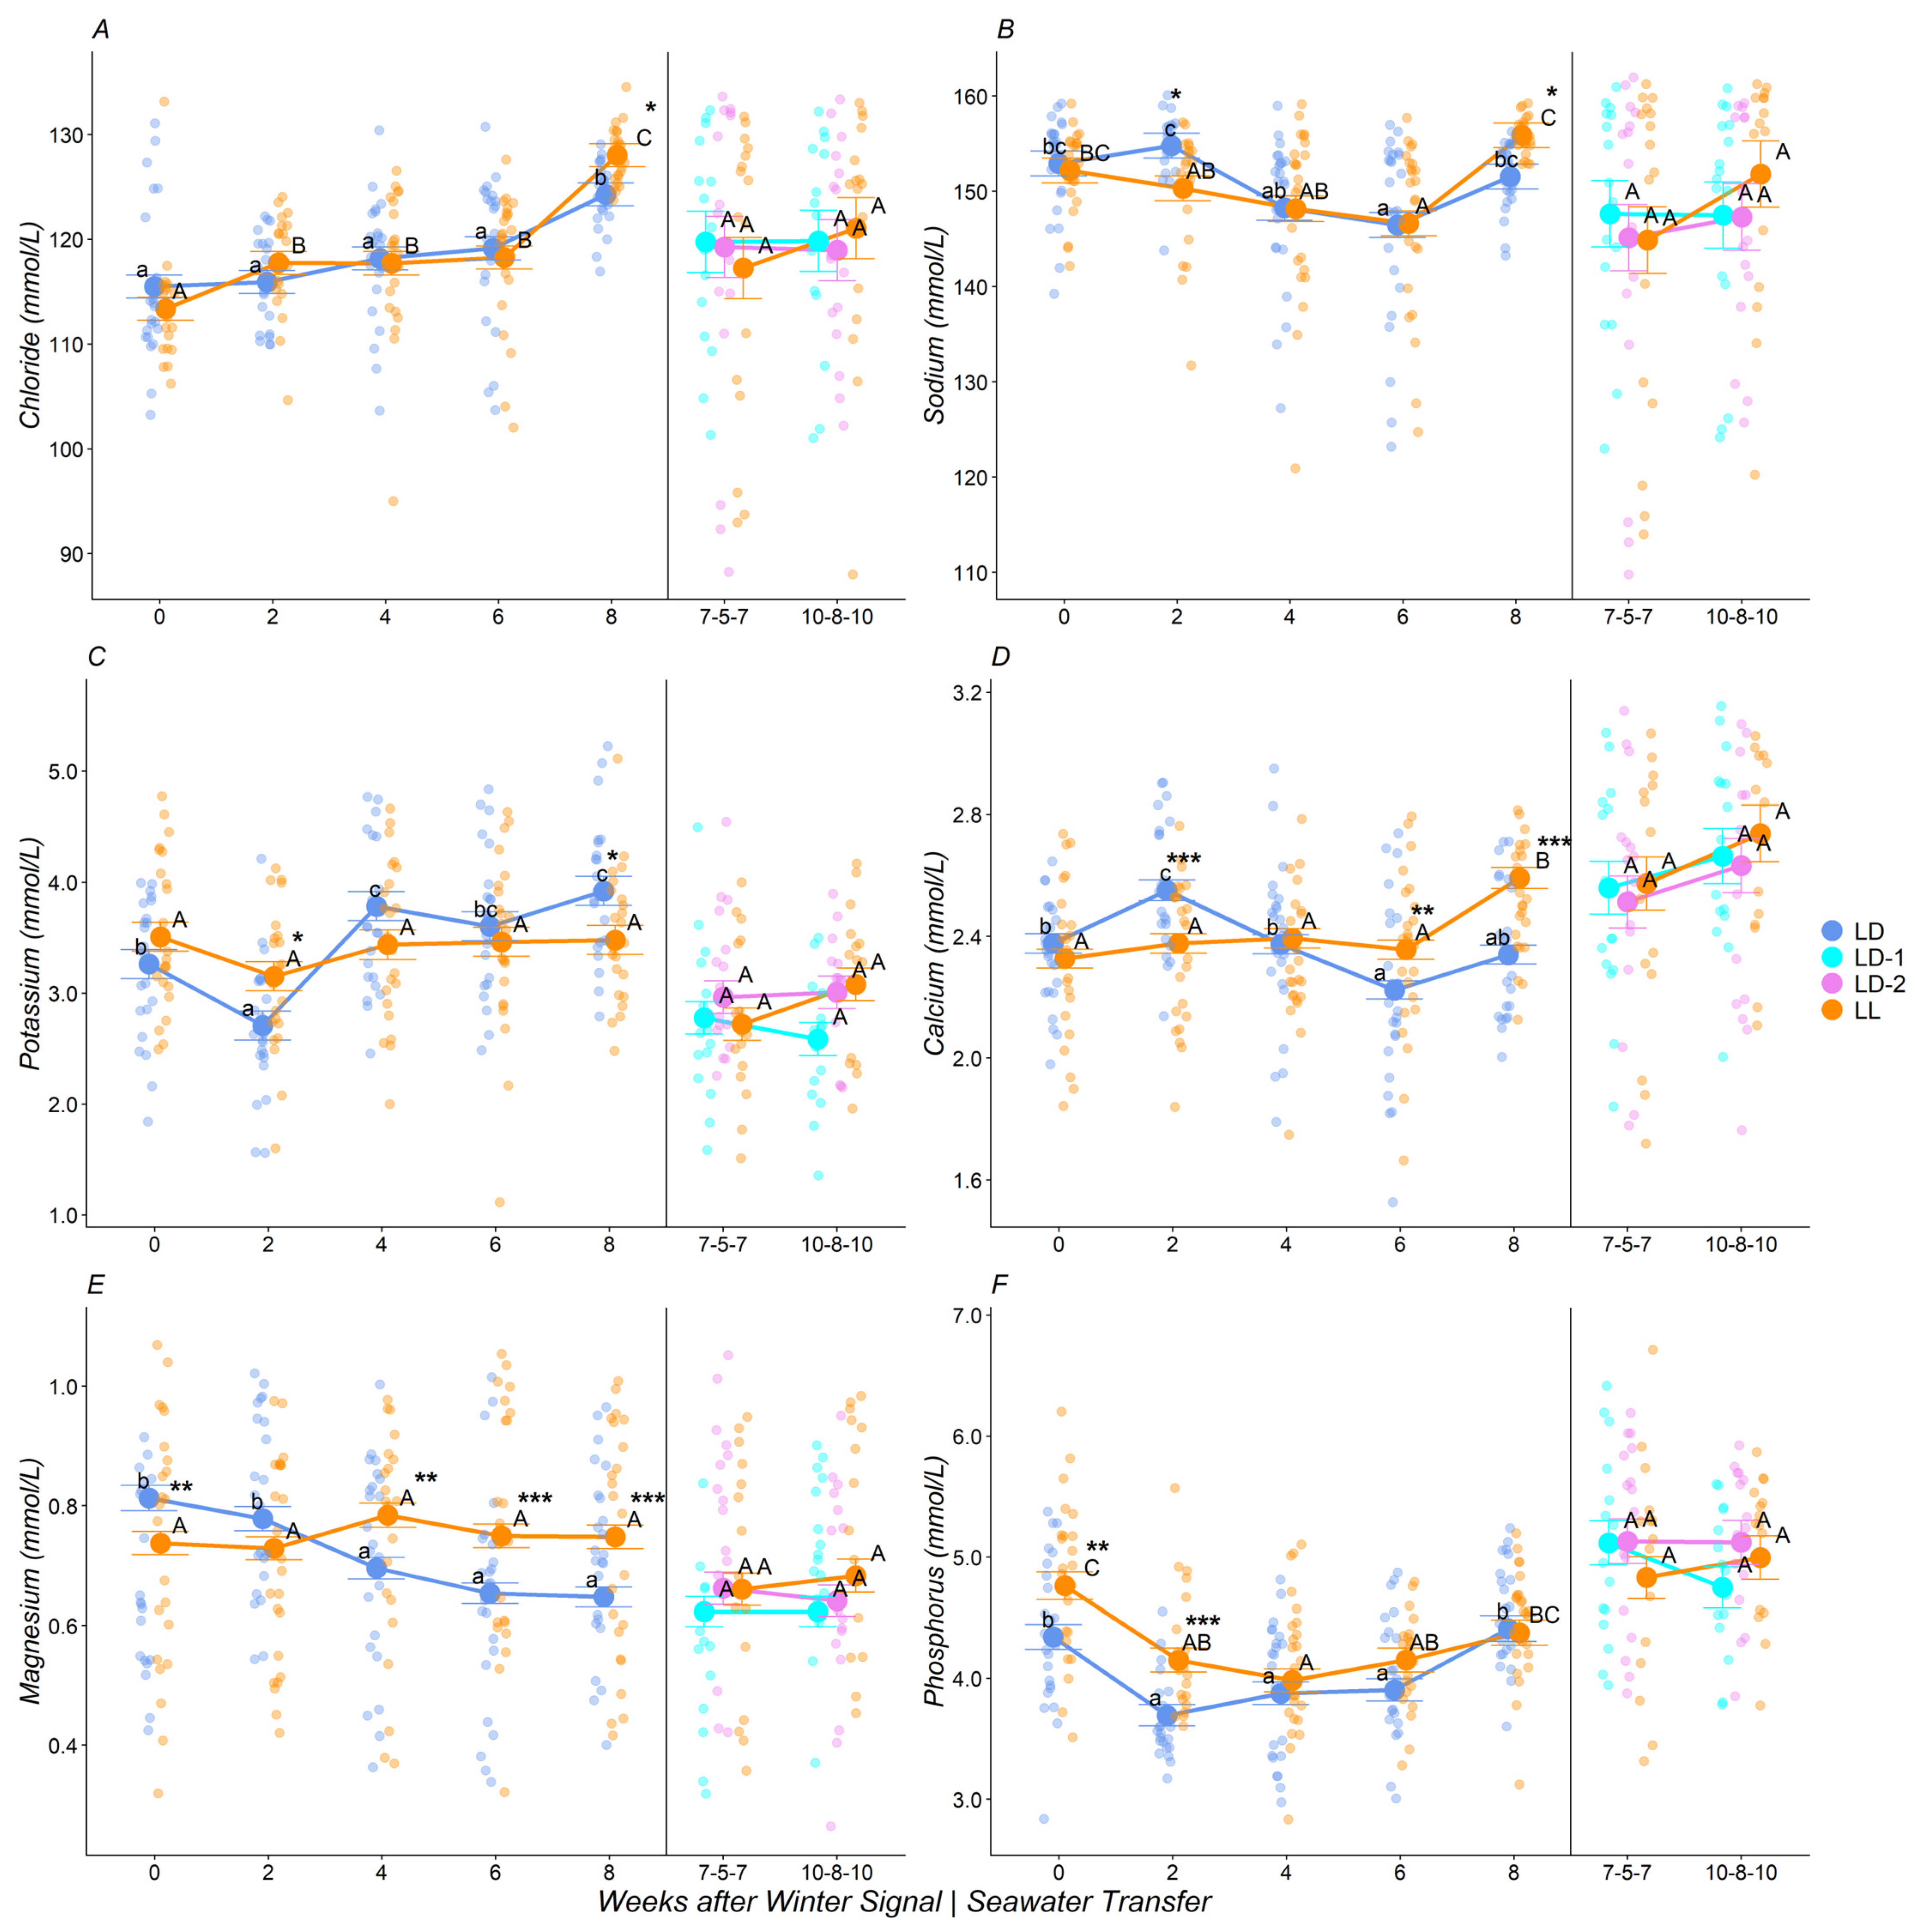
Figure 6 shows the plasma ions levels change over time after the winter signal in the FW phase and after SW transfer. During FW, the monovalent ions Cl, Na+, and K+ were affected by sampling time (p < 0.001) and by the interaction between treatment and sampling for Na+ (p = 0.02) and K+ (p = 0.002) but not for Cl. The light regime alone did not affect the concentration of the monovalent ions. At week 8, end of the FW phase, the LD group had significantly lower levels of Na+ and Cl compared with LL. For K+, the LL group maintained constant plasma levels, while in the LD group, a significant decrease at week 2 was observed, followed by an increase toward the end of the FW phase. In the SW phase, there were no effects of treatment, sampling, or interaction in any of the monovalent ions analyzed.
For the divalent ions, a significant effect of the treatment (p = 0.004), sampling (p < 0.001), and interaction between treatment and sampling (p < 0.001) was observed for Mg2+, and an effect of sampling and the interaction (p < 0.001) for Ca2+. Both divalent ions presented a marked decreasing trend for the LD group and an opposite trend for the LL group (Figure 6D,E). The Ca2+ levels presented a clear peak in the LD group at week 2.
The plasma inorganic phosphorus (Pi) levels in the FW phase were significantly affected by both treatment (p < 0.001) and sampling point (p < 0.001) but were not affected by the interaction between treatment and sampling. Although Pi levels showed a similar trend in both treatments, the LD group presented lower levels at weeks 0 and 2 (Figure 6F). During the SW phase, there were no significant changes in the Pi levels.

3.4. NKA Activity

The NKA activity in the gills (Figure 7) was strongly affected by treatment, sampling point, and the interaction between treatment and sampling (p < 0.001). The LD group presented a lower NKA activity compared to the LL group at weeks 0 and 2. However, at week 4, there was a pronounced (and significant) increase in the gills’ NKA activity in the LD group (from 3 to 9 µmoles ADP/mg protein × h). Subsequently, the LD group presented higher NKA levels compared with the LL group (significantly different at week 6). During the SW phase, the NKA in the gills was significantly affected by the sampling point (p < 0.001). The gills NKA activity was significantly higher in the last SW sampling point for LL and LD-2 groups compared to the first SW sampling.
Due to technical issues, we failed to accurately determine the NKA activity in the three intestine sections sampled (AMG, PMG, and HG). The results suggest that only time affected NKA activity in the intestine; however, these results should be interpreted carefully. From week 4 after the winter signal, there was an increment in the NKA activity levels, which was sustained after the SW transfer. NKA activity values range from values below 1 in all intestinal sections to 10, 25, and 34 µmoles ADP/mg protein x h in the HG, PMG, and AMG, respectively (Supplementary Figure S1).

3.5. Gene Expression

For all four tissues, gill, AMG, PMG, and HG, the relative gene expression of nkaα1b, nkaα1c, cftrI, cftrII, nbc, and nkcc1a were analyzed, while the nkaα1a relative gene expression was analyzed only in the gills because no expression levels were detected in the intestine sections. In the SW phase, only the last sampling point was used for relative gene expression analyses.
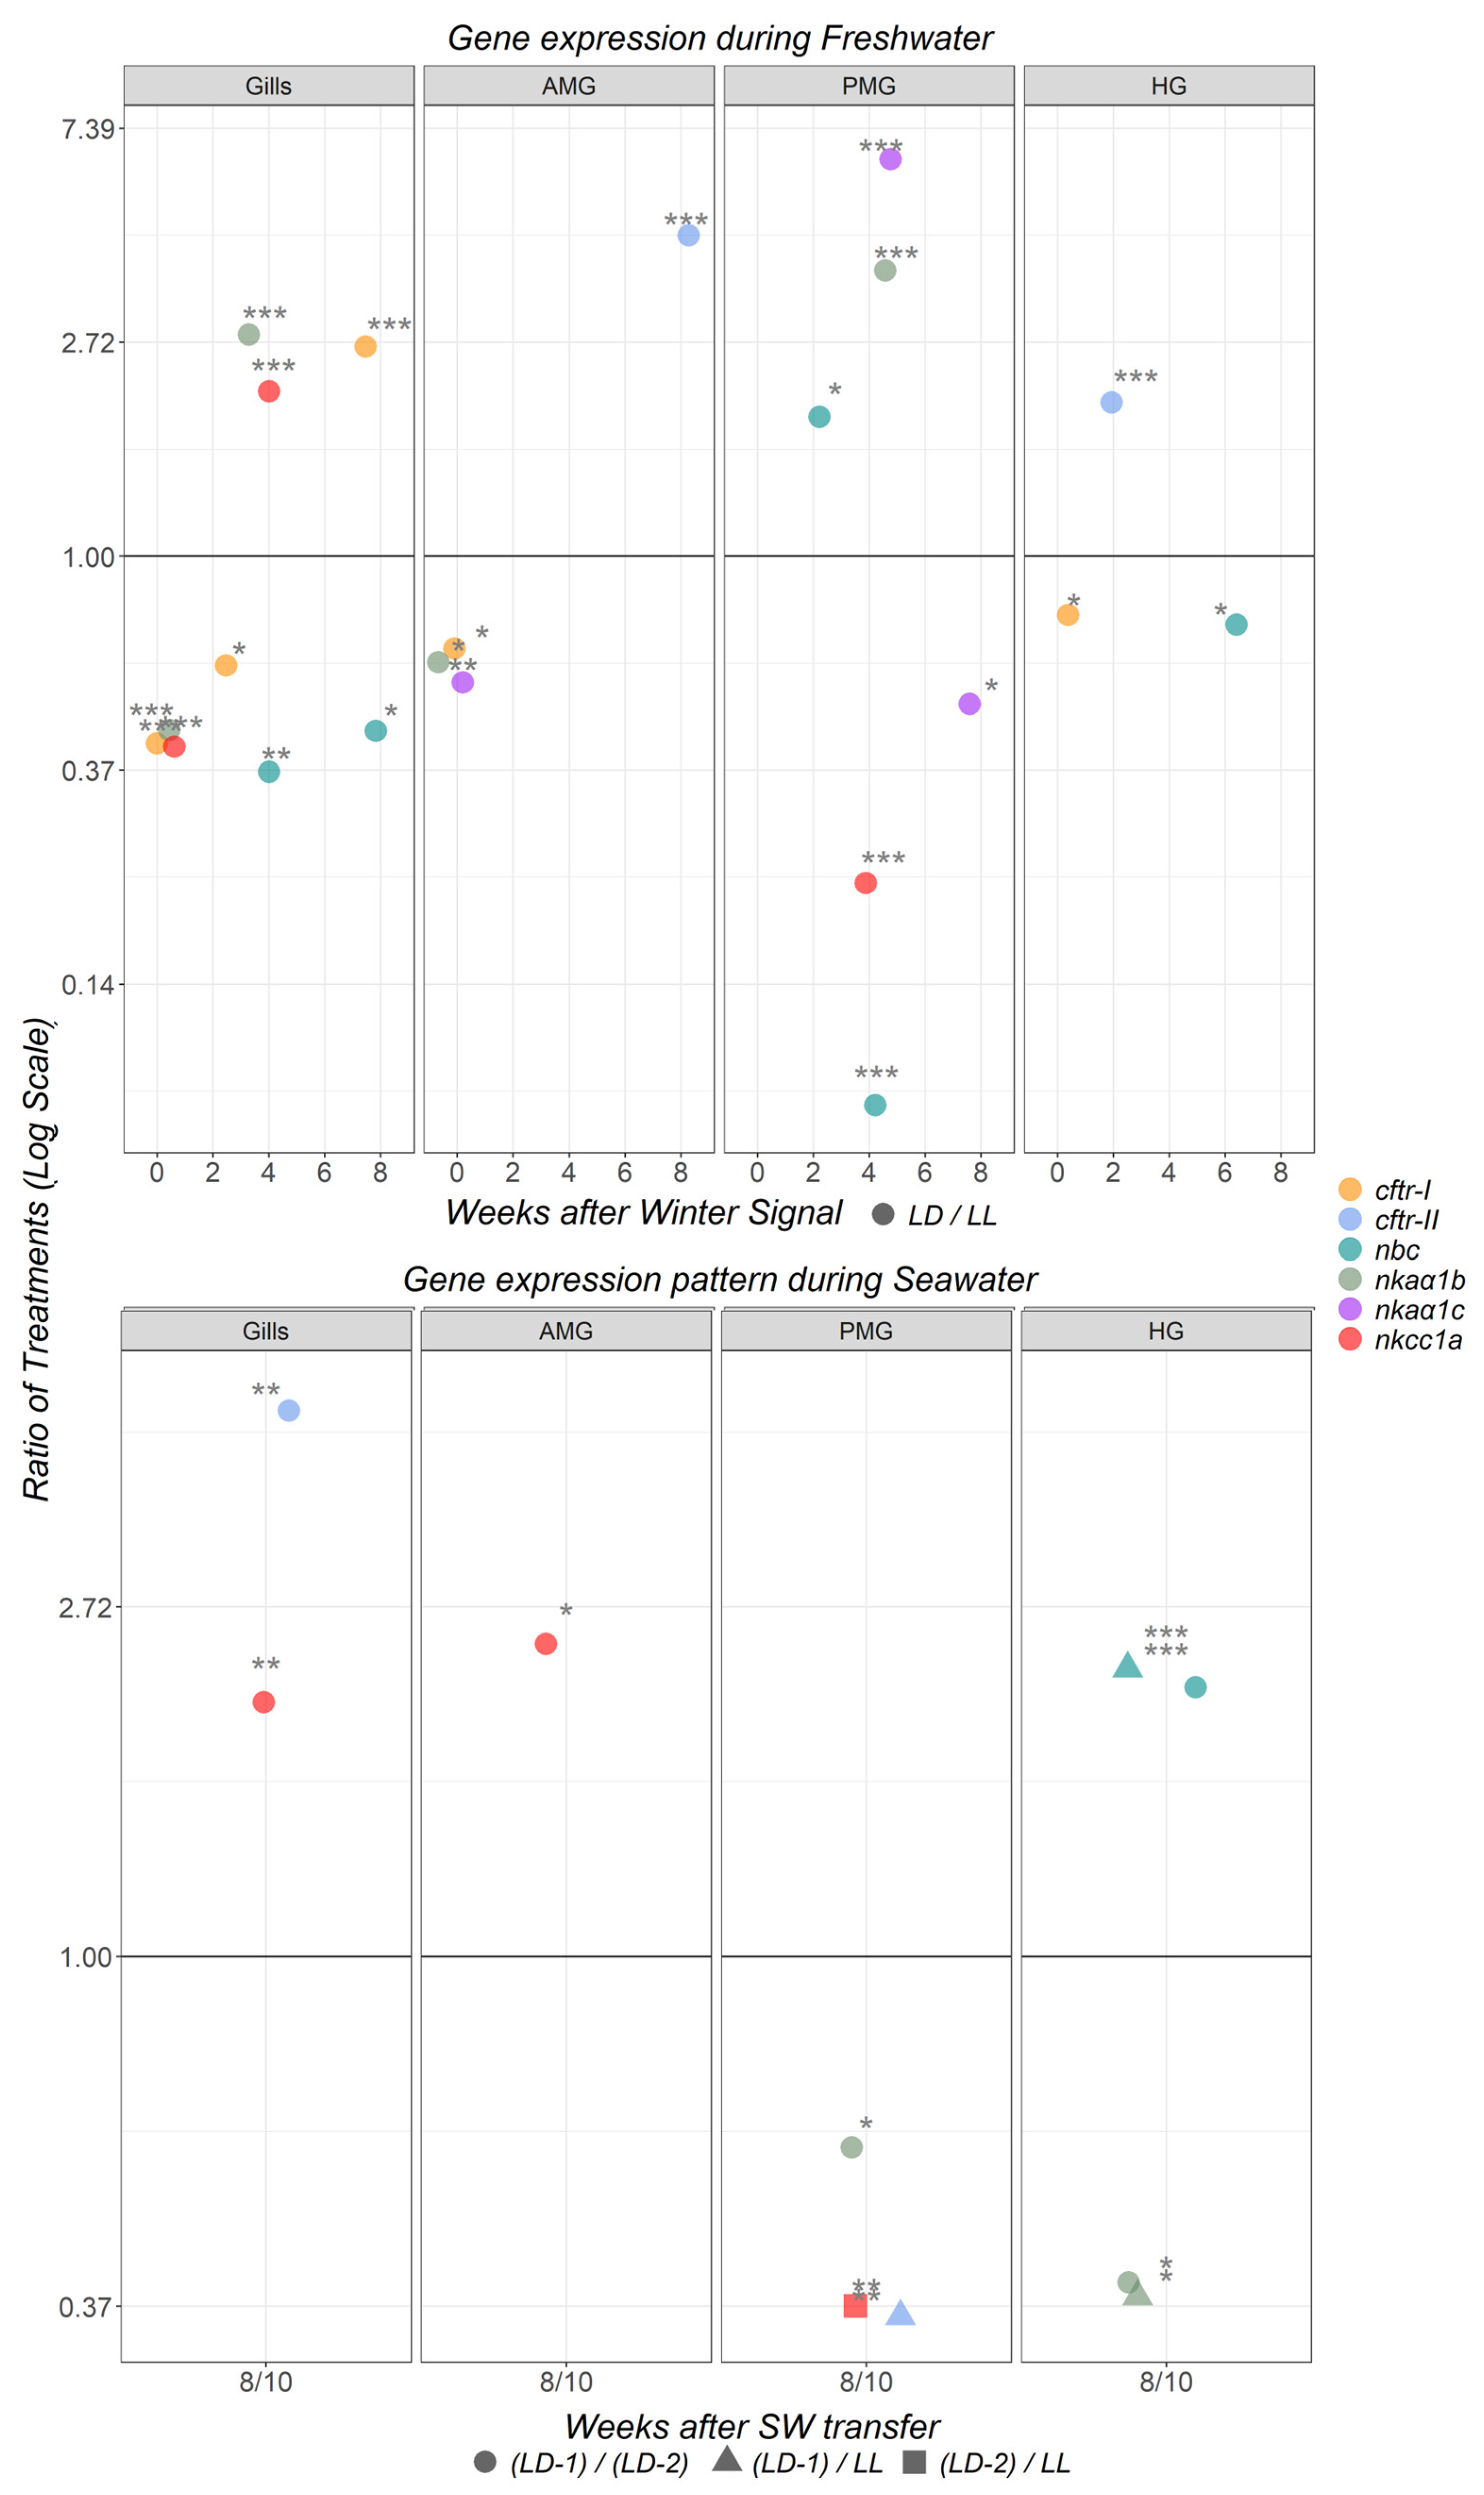
None of the genes analyzed in the gills were affected by the treatment alone during the FW phase. However, the effect of the interaction between treatment and sampling point was observed for cftrI (p < 0.001), nbc (p = 0.007), nkaα1b (p < 0.001), and nkcc1a (p < 0.001), while the effect of the sampling point was observed for cftrII (p = 0.018), nkaα1a (p < 0.001), nkaα1b (p = 0.045), and nkaα1c (p < 0.001). The cftrI gene expression showed a continuous increasing trend in the LD group, and the opposite was observed in the LL group (Supplementary Figure S2). Significant differences were found at weeks 0, 2, and 8 after the winter signal (Figure 8). The gene expression of nbc in the LD group showed a peak at week 2 after the winter signal, but its expression decreased right after (Supplementary Figure S2). The nbc gene showed significant differences between the LL and LD groups at weeks 4 and 8 (Figure 8). The expression of nkaα1b and nkcc1a at week 0 was significantly lower in the LD group compared with the LL group. Afterward, the expression of both genes was significantly higher at week 4 compared to the LD group (Figure 8). During the SW phase, a significant effect of treatment in the gene expression of cftrII (p = 0.003) and nkcc1a (p = 0.002) was found, showing significant differences between LD-1 (highest expression) and LD-2 groups (Figure 8).
During the FW phase, the cftrI gene expression in the AMG was affected by treatment (p = 0.027) and sampling point (p = 0.006) but not by the interaction of treatment and sampling. The cftrI expression in the LD group was significantly lower than that in the LL group at week 0 (Figure 8). The cftrII gene expression was affected by the sampling point (p = 0.020) and the interaction between sampling and treatment (p = 0.004), as well as the gene expression of nkaα1c (p < 0.001, p = 0.019). For cftrII, expression in the LD group decreased over time, particularly at weeks 2 and 4, but remained in general stable, contrary to the LL group in which cftrII gene expression dropped dramatically between weeks 6 and 8 (Supplementary Figure S3). The gene expression of cftrII was significantly different between groups at week 8 (Figure 8). The gene expression of both nka isoforms (nkaα1b and nkaα1c) was significantly lower after the winter signal (week 0) in the LD group (Figure 8). The gene expression of nbc and nkcc1a was significantly affected by sampling point (p < 0.001 and p = 0.005, respectively), but no clear trend during the FW phase was observed. However, during the SW phase, nkcc1a was significantly affected by the treatment (p = 0.028). The gene expression of nkcc1a was significantly higher in the LD-1 group compared to LD-2 (Figure 8).
In the PMG, the gene expression of nbc was affected by treatment (p < 0.001), sampling point (p < 0.001), and the interaction between treatment and sampling (p < 0.001); nkaα1b by treatment (p = 0.008), sampling point (p = 0.001) and the interaction (p < 0.001); nkaα1c by treatment (p = 0.024), sampling point (p < 0.001) and the interaction (p < 0.001), while nkcc1a expression was only affected by treatment (p = 0.026) and interaction (p = 0.001), and cftrI and cftrII by sampling (p = 0.005 and p < 0.001, respectively). Few changes were observed in the expression of osmoregulation-related genes in the LL group. On the other hand, at week 4 after the winter signal, a significant decrease in the expression in nbc and nkcc1a and a significant increment in the gene expression of nkaα1b and nkaα1c was observed in the LD group (Supplementary Figure S4). At week 4, these genes were also significantly different among treatments (Figure 8). During the SW phase, cftrII (p = 0.003), nkaα1b (p = 0.037), and nkcc1a (p = 0.01) expression was affected by treatment. The LL group had higher cftrII gene expression than the LD-1 and higher nkcc1a compared with the LD-2. In addition, the gene expression of nkaα1b was significantly lower in the LD-1 group compared to the LD-2 group (Figure 8).
In the HG, during the FW phase, the gene expression of cftrI was affected by the treatment (p = 0.008) and sampling point (p = 0.018). In fact, the LD group had significantly lower cftrI levels compared to the LL group at week 0 (Figure 8). The gene expression of cftrII was affected by the sampling point (p = 0.033) and the interaction between treatment and sampling (p = 0.01), and there was a significant increment in the LD group at week 2 after the winter signal (Supplementary Figure S5). The gene expression of the nbc gene was affected by the interaction between treatment and sampling (p = 0.036). The HG nbc gene expression did not change in the LD group, but in the LL group, oscillations occurred during the FW phase and a significant increment compared with the LD group at week 6 after the winter signal (Figure 8). The gene expression of nkcc1a and nkaα1b was affected only by the sampling point (p = 0.002 and p < 0.001, respectively), while the isoform nkaα1c was not affected by any of the variables, i.e., treatment, sampling, or interaction. Two months after the SW transfer, the gene expression of nbc was significantly affected by treatment (p < 0.001), and the LD-1 group presented a higher gene expression compared with both LD-2 and LL groups (Figure 8). The nkaα1b was also affected by treatment during the SW phase (p = 0.009), and a significantly lower expression in the LD-1 group compared with the LD-2 and LL groups was observed.

4. Discussion

4.1. Atlantic Salmon Growth and Performance

A notable difference in Atlantic salmon growth was observed between the different experimental light regimes. At the end of the winter signal (week 0), both SGR and RGR were significantly higher in the LL group compared to the LD group. These results align with the findings from several other studies that have reported decreased fish growth associated with reduced light exposure [6,7,17,35]. However, our results also indicate that at the end of FW and during the SW phase, the fish that received a winter signal exhibited similar (or even enhanced) growth rates compared to fish without such environmental cues, which is consistent with previous studies [6,17]. Of particular interest is the growth performance during the SW phase, where the LD-2 group, transferred into SW 8 weeks after the winter signal (i.e., two weeks later than the two other groups), displayed a significant increase in specific growth rate (SGR) by the end of the experiment. This observation is noteworthy, especially considering that the initial 14 days in SW are typically regarded as a challenging period associated with potential body mass loss [20,22]. It is plausible that the LD-2 group exhibited enhanced nutrient utilization for growth during the initial two months in SW, indicative of a rapid growth phase characteristic of Atlantic salmon [64]. The physiological smolt window—a period of readiness for osmotic stress—growth-promoting factors might have been activated during the final two weeks during FW, suggesting a dynamic role of growth hormone in both smoltification and desmoltification processes [2,42]. This result could hold significance for the aquaculture industry, leading us to speculate that with an extended duration in SW, the LD-2 group might even surpass the growth of fish reared under a constant light regime, a phenomenon reminiscent of compensatory growth in SW observed in fish subjected to a winter signal [6,17]. Previous studies, such as those by [65], suggest that transferring the fish 6 weeks after returning to constant light is recommended, which is the most applied practice in the salmon aquaculture industry, while our growth data point out that 8 weeks after winter signal could be optimal.
In line with this hypothesis, our results show that both experimental groups (LL and LD) exhibited a decreasing K during the FW phase, one characteristic signal of smoltification [5,17,25]. This suggests, as previous studies have shown, that fish can undergo smoltification even in the absence of a winter signal [17,66]. However, the decreasing trend was more pronounced in the fish subjected to the winter signal, leading to lower K values in the LD group at week 4 after the winter signal, an observation documented in similar studies [6,35,67]. Similarly, during the SW phase, the LL group exhibited significantly higher K values compared to both LD groups, suggesting that both LD groups retained smolt-like characteristics [68,69].
The HSI serves as an indicator of an organism’s energy reserves, particularly the storage of glucose in the form of glycogen, which is a process influenced during smoltification [68,69,70]. Here, we observed a consistent decrease in HSI in both LL and LD groups during the FW phase, leading us to speculate a potential reduction in hepatocyte size, glycogen content, and increased metabolic activity associated with smoltification [69]. In this regard, cortisol, a hormone capable of mobilizing energy reserves and elevating blood glucose levels if required (such as during the crucial development of hypo-osmoregulatory mechanisms in smoltification), may play an important role [71]. In our study, we observed a peak of cortisol in the LD group at week 4 after the winter signal, exceeding the described cortisol level of 25 ng/µL in smolting Atlantic salmon after receiving a winter signal [25], and a subsequent increase in plasma glucose levels with a simultaneous decrease in HSI. This pattern was, however, not observed for the LL group, which may indicate an uncoordinated and less pronounced metabolic response to smoltification. Interestingly, the LD-2 group exhibited an increase in HSI, a potential indication of greater energy reserves, as well as an increment in SGR through time during the SW phase. It is worth noting that body size can improve performance in SW, including for large juveniles outside of the smolt windows [72,73], so this factor can promote a better physiological response to the SW environment for the LD-2 group in addition to the application of the winter signal.
The advantage of using a winter signal to induce smoltification is further emphasized by our observations on other indicators of stress, SW adaptation, and welfare. The LL group showed overall lower physiological adaptation to the SW phase, including a lower HSI and CSI and higher lactate levels (an indicator of acute stress) compared to the LD groups. In addition, the application of a winter signal reduced the incidence of male sexual maturation, a process that demands significant energy resources [74] and can potentially hinder smoltification or growth during the SW phase. This issue is of particular concern within the aquaculture industry [75]. During the FW phase, the LL group had a higher number of fish categorized as maturing (3 maturing males from a total of 121 males) based on their GSI [48,49]. These results clearly indicate that, as previous studies have shown, the winter signal can stop, reduce, or delay the sexual maturation process in both smolts and post-smolts [35,76]. This pattern was also corroborated during the SW phases, where at the end of the trial, several more maturing males were found in the LL group compared to the LD groups.

4.2. Osmoregulatory Physiology: Plasma Ions and NKA Activity

Despite temporal variations observed in the LD group (not present in the LL group), no overall decrease in monovalent ion concentrations, such as Na+ and Cl, was observed during the FW phase. This contrasts with findings in previous studies, which reported a decrease in these monovalent ions due to the development of hypo-osmoregulatory capacities in fish during this phase [14,15,16,17]. However, the level observed of monovalent ions in plasma throughout the FW phase was in the range described by other authors during smoltification [13,40].
A significant decrease in the divalent ion’s Mg2+ and Ca2+ concentrations was observed during the FW phase. Calcium is crucial for various physiological functions in fish, such as growth and bone tissue formation [64], activation of ion channels [77], and other metabolic functions [78]. Calcium uptake in fish is regulated by hormones like calcitriol, which [64] found to increase in smolts compared to parrs. Additionally, the upregulation of calcium-binding proteins in the pituitary of smolts has been documented [78]. The significant increase in plasma calcium levels in the LD group at week 2 after the winter signal may be related to some of those important physiological mechanisms. Furthermore, [77] reported an increase in potassium channels activated by calcium in the gills following transfer to brackish water. Our findings suggest that the activation of these channels might start early in smoltification, as evidenced by the elevated plasma calcium levels at week 2, alongside a decrease in potassium levels.
NKA enzyme activity in the gills is regarded as one of the most extensively used biomarkers of smoltification. Our results indicate that both fish groups, those receiving the winter signal (LD) and those kept under constant light (LL), developed gradually elevated levels of NKA activity, although at different times, reinforcing previous reports [7,17]. In the LD group, an increase in the gills’ NKA enzyme activity started at week 4, coinciding with the maximum plasma cortisol levels. Indeed, a relationship between cortisol and NKA activity in the gills during smoltification has been previously demonstrated [8,79]. Thus, our findings corroborate that providing a winter signal can be beneficial for inducting smoltification processes, promoting homogeneous development of the smolt population, and better preparation for the SW life. However, it is important to note that all groups developed similar NKA activity levels at the end of the SW phase. Consequently, NKA enzyme activity alone may not be enough to assess smolt status, as some authors discussed evaluating the osmoregulatory capacity of different groups of fish with low, middle, and high NKA levels [20].
In this study, we aimed to determine the osmoregulatory maturation of the intestine during smoltification, and therefore, we measured the NKA enzyme activity in three different sections of the intestine using the protocol outlined by [33]. The existing literature suggests an increase in NKA activity in the intestine during smoltification, but especially after exposure to SW conditions [25,33,80]. In this study, some individuals analyzed presented high levels of NKA enzyme activity toward the end of the FW phase and in SW, particularly in the midgut. However, due to technical issues, we failed to obtain reliable NKA activity measurements in the intestine. This might be attributed to challenges associated with preparing the protein extracts and/or the intrinsic complexity of the intestine, with the presence of digestive enzymes, mucus, and debris. Nevertheless, our data fell within the range of values reported in the literature [25,33,80]. In this study, we did not observe any relationship between intestinal NKA enzymatic activity and the treatment. Additionally, no correlation between plasma cortisol and NKA enzyme activity in the intestine was found in the LD group, consistent with the findings of [81].

4.3. Molecular Markers of Osmoregulation in Gills and Intestine

During smoltification, the nkaα1b expression increases, nkaα1a decreases, and nkaα1c does not change in the gill of Atlantic salmon [14,67,82], which is consistent with our findings for the LD group in the present study. On the other hand, in the intestine, the predominant nka isoform is the nkaα1c [36]. Our results showed that in the AMG, a constant increasing trend of the expression of nkaα1c throughout the FW phase was observed, which contrasts with previous studies where no changes in the anterior intestine were reported [15]. Notably, in the PMG, a strong increase in the gene expression of both nkaα1c and nkaα1b isoforms was observed in the LD group at week 4 after the winter signal, coinciding with a peak in plasma cortisol levels. These results align with what was observed for nkaα1b isoform expression in the gill and with previous studies that confirmed the role of cortisol in promoting the expression of nka isoforms in both the gill and intestine [8,9,36,37,82,83]. Our results did not indicate any changes in the nkaα1c expression in the HG, although some authors reported an increase as a preparatory process during smoltification in FW and one month after SW transfer [15].
The cftrI expression in the gill increased steadily during the FW phase, as previous studies have shown [14,78]. Given the important role of cftrI in the excretion of ions and long-term SW acclimation [8,84], the continuous increase in gill cftrI expression in the LD group may indicate that this group is still developing its osmoregulatory capacity at week 8 after the winter signal. On the other hand, the decrease observed in the LL group could indicate a loss of osmoregulatory capacity during the FW phase, potentially as a process of readaptation to FW since they have not faced the SW environment in time, as suggested by previous studies [42,44,85]. In the intestine, only in the AMG, there was an increase in the gene expression of cftrI in the LD group at week 2 following the winter signal, results consistent with the findings reported by [15].
Although in the gills, the gene expression of cftrII during the FW phase was not affected by treatment or time, while in the AMG, we observed a notable decrease in the gene expression of cftrII in the LL group at week 8 of the FW phase. This result can suggest that the fish is undergoing desmoltification since the intestine epithelium was not exposed to the marine environment, which aligns with other authors who reported that the gene expression of cftrII in smolts maintained in FW decreased constantly in the anterior intestine [40]. On the other hand, in the PMG and the HG, the gene expression of cftrII can be a suitable molecular marker of smoltification and the development of osmoregulatory capacity. Our results showed an increasing trend with a peak at weeks 2 and 4 in the HG and PMG, respectively, after the winter signal. Previous studies showed that the gene expression of cftrII does not vary in the anterior intestine and decreases in the posterior intestine during smoltification and further in SW [15].
Two months post-exposure to SW, significant differences in the gene expression of cftrII in the gills were observed between the different treatments, highlighting the importance of cftrII as a molecular marker for long-term adaptation to the marine environment and supporting prior findings that characterized cftrII as an early response gene in the SW adaptation process [84]. The gene expression of cftrII has been shown to be lower in smolts compared to parrs and decreases once the fish have adapted to the marine environment [42,78,84]. In this regard, considering that the fish in the LD-2 group did not exhibit elevated levels of cftrII at the end of the SW phase, we suggest that this group may have had a higher osmoregulatory capacity to deal with the marine environment at this time point. Similarly, in the PMG, the gene expression of cftrII showed differences among treatments during the SW phase, with the highest expression reported for the LL group. Previous reports showed that 4 weeks after the SW transfer, the gene expression of cftrII decreased in the midgut and posterior intestine [15]. Therefore, the upregulation of cftrII in the PMG two months after the SW transfer in the fish that did not receive the winter signal suggests that this group was less prepared for the marine environment and was still adapting to their intestinal osmoregulatory system. However, in the AMG and the HG, there were no significant differences among groups in SW, highlighting the specialization of the PMG in ion secretion rather than the role of water uptake of the posterior intestine or nutrient uptake for anterior sections [27,86,87].
The expression of nkcc1a in the gills of the LD group significantly increased over time in the FW phase, peaking simultaneously with cortisol, in line with other studies that showed the effect of cortisol in the gene expression of nkcc1a during smoltification [9,37,67]. Contrary to what was described by [15], we found important changes in the expression of nkcc1a in the PMG. In this regard, we observed that the plasma cortisol levels were negatively correlated with the gene expression of nkcc1a in the PMG. This result suggests a regulatory process inhibiting nkcc1a expression. Similarly to cftrII, nkcc1a was significantly affected by the treatment during the SW phase in the gills, AMG, and PMG but not in the HG. The LD-2 group did not exhibit elevated gene expression of nkcc1a in the gills and AMG, while the LD-1 group showed higher expression levels, suggesting that the delay in transfer may influence the osmoregulatory capacity of the fish. Ref. [15] described that after SW transfer, the nkcc1a mRNA expression did not change in the PMG, while we observed that nkcc1a expression increased in the LL group and was significantly different from the LD-2 group.
The nbc gene and its role in osmoregulation are relatively understudied in the gills of salmonids; however, our results are consistent with those reported by [40,42], who indicated a decrease in nbc expression at the smoltification peak or after the fish were transferred to SW, suggesting an active role of this gene in FW-adapted fish. An important aspect of the hypo-osmoregulation is the precipitation of calcium and magnesium in the intestine, a process in which the nbc plays a fundamental role in co-transporting sodium and bicarbonate from the plasma into the enterocyte, thus fueling (at least partially) the apical bicarbonate secretion that drives precipitation of divalent ions in the intestinal lumen [88]. While an increase in nbc expression might have been expected as part of the preparation for the marine environment, we observed a strong inhibition of the expression of this gene in the PMG at week 4 in the LD group. A recent study by [40] evaluated the expression of different isoforms of the nbc transporter and found an increment in the gene expression of the isoform nbce1.1, which was the most abundant form in the intestine for them. However, Ref. [40] study did not evaluate the gene expression in the intestine (only in the gills) of the gene here analyzed (corresponding to their nbce1.2a isoform). Like nkcc1a, nbc can potentially be a good smoltification biomarker in the PMG due to the strong reduction in the gene expression observed in fish that received the winter signal.
Contrary to what was observed in the AMG and PMG, no changes were observed in the genes analyzed in the HG during smoltification. This may be attributed to the fact that the HG presented a non-synchronized regulation in fluid transport and biomarkers compared to the midgut [15,89]. However, our results highlight the important role of nbc in the osmoregulatory capacity after the SW transfer in the HG rather with a higher level of expression in the LD-1 group. These results suggest that LD-1 fish may need to maintain relatively high levels of nbc after being transferred to SW, possibly as an additional mechanism to cope with di-valent ions and promote their precipitation. This could reflect that the SW adaptation process may not yet be fully complete. Maintaining high nbc levels could help to reduce the osmotic pressure in the feces, thus facilitating adequate water absorption in the HG [86]. This aligns with previous reports that found no change in nbc expression levels in the posterior intestine of smolts two days after SW transfer [40].

4.4. Conclusions

The present study highlights the importance of applying the winter signal to promote smoltification in Atlantic salmon. A coordinated physiological response, including changes in plasma cortisol, glucose, and ions such as calcium, potassium, and magnesium, was observed in the fish exposed to the winter signal. These adaptations also involved an increase in gill NKA enzyme activity and alterations in gene expression of several biomarkers, including cftrI, cftrII, nkcc1a, and nkaα1b in gills, and nbc, nkaα1b, nkaα1c and nkcc1a in the PMG. In addition, the results indicate that extending the FW phase by 2 weeks, i.e., transferring the fish to SW 8 weeks after the winter signal, might enhance growth and improve the osmoregulatory capacity of Atlantic salmon gills and intestine. Overall, our findings contribute to a deeper understanding of the smoltification process in farmed Atlantic salmon and identify key biomarkers crucial for successful adaptation to SW.

Supplementary Materials

The following supporting information can be downloaded at: https://www.mdpi.com/article/10.3390/fishes10030119/s1, Figure S1: NKA activity level in 3 sections of the intestine of Atlantic salmon, Figure S2: Supplementary Figure S2, Relative gene expression of biomarkers linked to ions homeostasis in the gill of Atlantic salmon, Figure S3: Relative gene expression of biomarkers linked to ions homeostasis in the anterior midgut of Atlantic salmon, Figure S4: Relative gene expression of biomarkers linked to ions homeostasis in the posterior midgut of Atlantic salmon, Figure S5: Relative gene expression of biomarkers linked to ions homeostasis in the hindgut of Atlantic salmon, Table S1: Summary Table of Applied Models for Studied Variables, during freshwater phase, Table S2: Summary Table of Applied Models for Studied Variables during seawater phase.

Author Contributions

Conceptualization, F.L., S.O.H. and A.S.G.; Data curation, J.I.S.-M.; Formal analysis, J.I.S.-M.; Funding acquisition, F.L. and A.S.G.; Investigation, J.I.S.-M., F.L., C.P., V.G., P.B., J.F. and A.S.G.; Methodology, J.I.S.-M., F.L., S.O.H. and A.S.G.; Project administration, I.R. and A.S.G.; Resources, S.O.H. and I.R.; Supervision, F.L., S.O.H. and A.S.G.; Visualization, J.I.S.-M.; Writing—original draft, J.I.S.-M.; Writing—review and editing, J.I.S.-M., F.L., S.O.H., C.P., V.G., P.B., J.F., I.R. and A.S.G. All authors have read and agreed to the published version of the manuscript.

Funding

This study was funded by the Research Council of Norway Time4Sucess (320566).

Institutional Review Board Statement

The animal handling and procedures described in this study have been approved by the National Animal Research Authority in Norway (FOTS ID28276). The participants responsible for the sampling were all accredited by the Federation of European Laboratory Animal Science Associations (FELASA).

Data Availability Statement

The data supporting the findings of this study are available from the corresponding author upon reasonable request.

Acknowledgments

The authors thank the staff from Lerøy Seafood AS, including Marco Schaer, Harald Sveier, and Julia Fossberg Buhaug, for providing the fish and pellets for this experimental trial. In addition, the authors thank from the University of Bergen Ann-Elise Olderbakk Jordal and Enrique Pino Martínez for assistance during samplings, Heikki Juhani Savolainen for technical support in maintaining the fish rearing facilities, and Tom Ole Nilsen and Marius Takvam for providing the protocol for the NKA activity analyses in the intestine.

Conflicts of Interest

The authors declare that they have no known competing financial interests or personal relationships that could have appeared to influence the work reported in this paper.

References

  1. McCormick, S.D.; Hansen, L.P.; Quinn, T.P.; Saunders, R.L. Movement, Migration, and Smolting of Atlantic Salmon (Salmo salar). Can. J. Fish. Aquat. Sci. 1998, 55, 77–92. [Google Scholar] [CrossRef]
  2. Björnsson, B.T.; Stefansson, S.O.; McCormick, S.D. Environmental Endocrinology of Salmon Smoltification. Gen. Comp. Endocrinol. 2011, 170, 290–298. [Google Scholar] [CrossRef]
  3. Hoar, W.S. 4 The Physiology of Smolting Salmonids. Fish Physiol. 1988, 11, 275–343. [Google Scholar] [CrossRef]
  4. Boeuf, G. Salmonid Smolting: A Pre-Adaptation to the Oceanic Environment. Fish Ecophysiol. 1993, 105–135. [Google Scholar] [CrossRef]
  5. McCormick, S.D. Smolt Physiology and Endocrinology. In Fish Physiology; Academic Press: Cambridge, MA, USA, 2012; Volume 32, pp. 199–251. [Google Scholar]
  6. Striberny, A.; Lauritzen, D.E.; Fuentes, J.; Campinho, M.A.; Gaetano, P.; Duarte, V.; Hazlerigg, D.G.; Jørgensen, E.H. More than One Way to Smoltify a Salmon? Effects of Dietary and Light Treatment on Smolt Development and Seawater Growth Performance in Atlantic Salmon. Aquaculture 2021, 532, 736044. [Google Scholar] [CrossRef]
  7. Ytrestøyl, T.; Hjelle, E.; Kolarevic, J.; Takle, H.; Rebl, A.; Afanasyev, S.; Krasnov, A.; Brunsvik, P.; Terjesen, B.F. Photoperiod in Recirculation Aquaculture Systems and Timing of Seawater Transfer Affect Seawater Growth Performance of Atlantic Salmon (Salmo salar). J. World Aquac. Soc. 2023, 54, 73–95. [Google Scholar] [CrossRef]
  8. Singer, T.D.; Finstad, B.; McCormick, S.D.; Wiseman, S.B.; Schulte, P.M.; McKinley, R.S. Interactive Effects of Cortisol Treatment and Ambient Seawater Challenge on Gill Na+,K+-ATPase and CFTR Expression in Two Strains of Atlantic Salmon Smolts. Aquaculture 2003, 222, 15–28. [Google Scholar] [CrossRef]
  9. Kiilerich, P.; Kristiansen, K.; Madsen, S.S. Cortisol Regulation of Ion Transporter MRNA in Atlantic Salmon Gill and the Effect of Salinity on the Signaling Pathway. J. Endocrinol. 2007, 194, 417–427. [Google Scholar] [CrossRef]
  10. Madsen, S.S. Cortisol Treatment Improves the Development of Hypoosmoregulatory Mechanisms in the Euryhaline Rainbow Trout, Salmo gairdneri. Fish Physiol. Biochem. 1990, 8, 45–52. [Google Scholar] [CrossRef]
  11. Madsen, S.S.; Kiilerich, P.; Tipsmark, C.K. Multiplicity of Expression of Na+,K+-ATPase α-Subunit Isoforms in the Gill of Atlantic Salmon (Salmo salar): Cellular Localisation and Absolute Quantification in Response to Salinity Change. J. Exp. Biol. 2009, 212, 78–88. [Google Scholar] [CrossRef]
  12. McCormick, S.D.; Dickhoff, W.W.; Duston, J.; Nishioka, R.S.; Bern, H.A. Developmental Differences in the Responsiveness of Gill Na+, K+-ATPase to Cortisol in Salmonids. Gen. Comp. Endocrinol. 1991, 84, 308–317. [Google Scholar] [CrossRef] [PubMed]
  13. Nilsen, T.O.; Ebbesson, L.O.E.; Kiilerich, P.; Björnsson, B.T.; Madsen, S.S.; McCormick, S.D.; Stefansson, S.O. Endocrine Systems in Juvenile Anadromous and Landlocked Atlantic Salmon (Salmo salar): Seasonal Development and Seawater Acclimation. Gen. Comp. Endocrinol. 2008, 155, 762–772. [Google Scholar] [CrossRef]
  14. Nilsen, T.O.; Ebbesson, L.O.E.; Madsen, S.S.; McCormick, S.D.; Andersson, E.; Björnsson, B.T.; Prunet, P.; Stefansson, S.O. Differential Expression of Gill Na+,K+-ATPase α- and β-Subunits, Na+,K+,2Cl Cotransporter and CFTR Anion Channel in Juvenile Anadromous and Landlocked Atlantic Salmon Salmo salar. J. Exp. Biol. 2007, 210, 2885–2896. [Google Scholar] [CrossRef]
  15. Sundh, H.; Nilsen, T.O.; Lindström, J.; Hasselberg-Frank, L.; Stefansson, S.O.; Mccormick, S.D.; Sundell, K. Development of Intestinal Ion-Transporting Mechanisms during Smoltification and Seawater Acclimation in Atlantic Salmon Salmo salar. J. Fish Biol. 2014, 85, 1227–1252. [Google Scholar] [CrossRef]
  16. Esbaugh, A.J.; Kristensen, T.; Takle, H.; Grosell, M. The Effects of Sustained Aerobic Swimming on Osmoregulatory Pathways in Atlantic Salmon Salmo salar Smolts. J. Fish Biol. 2014, 85, 1355–1368. [Google Scholar] [CrossRef] [PubMed]
  17. Pino Martinez, E.; Imsland, A.K.D.; Hosfeld, A.C.D.; Handeland, S.O. Effect of Photoperiod and Transfer Time on Atlantic Salmon Smolt Quality and Growth in Freshwater and Seawater Aquaculture Systems. Fishes 2023, 8, 212. [Google Scholar] [CrossRef]
  18. Björnsson, B.T.; Bradley, T.M. Epilogue: Past Successes, Present Misconceptions and Future Milestones in Salmon Smoltification Research. Aquaculture 2007, 273, 384–391. [Google Scholar] [CrossRef]
  19. McCormick, S.D.; Shrimpton, J.M.; Moriyama, S.; Björnsson, B.T. Effects of an Advanced Temperature Cycle on Smolt Development and Endocrinology Indicate That Temperature Is Not a Zeitgeber for Smolting in Atlantic Salmon. J. Exp. Biol. 2002, 205, 3553–3560. [Google Scholar] [CrossRef] [PubMed]
  20. Zydlewski, G.B.; Zydlewski, J. Gill Na+,K+-ATPase of Atlantic Salmon Smolts in Freshwater Is Not a Predictor of Long-Term Growth in Seawater. Aquaculture 2012, 362–363, 121–126. [Google Scholar] [CrossRef]
  21. Oliveira, V.H.S.; Dean, K.R.; Qviller, L.; Kirkeby, C.; Bang Jensen, B. Factors Associated with Baseline Mortality in Norwegian Atlantic Salmon Farming. Sci. Rep. 2021, 11, 14702. [Google Scholar] [CrossRef]
  22. Lai, F.; Rønnestad, I.; Budaev, S.; Balseiro, P.; Gelebart, V.; Pedrosa, C.; Stevnebø, A.; Haugarvoll, E.; Korsøen, Ø.J.; Tangen, K.L.; et al. Freshwater History Influences Farmed Atlantic Salmon (Salmo salar) Performance in Seawater. Aquaculture 2024, 586, 740750. [Google Scholar] [CrossRef]
  23. Loretz, C.A. Electrophysiology of Ion Transport in Teleost Intestinal Cells. Fish Physiol. 1995, 14, 25–56. [Google Scholar] [CrossRef]
  24. Veillette, P.A.; Sundell, K.; Specker, J.L. Cortisol Mediates the Increase in Intestinal Fluid Absorption in Atlantic Salmon during Parr-Smolt Transformation. Gen. Comp. Endocrinol. 1995, 97, 250–258. [Google Scholar] [CrossRef]
  25. Sundell, K.; Jutfelt, F.; Ágústsson, T.; Olsen, R.E.; Sandblom, E.; Hansen, T.; Björnsson, B.T. Intestinal Transport Mechanisms and Plasma Cortisol Levels during Normal and Out-of-Season Parr–Smolt Transformation of Atlantic Salmon, Salmo salar. Aquaculture 2003, 222, 265–285. [Google Scholar] [CrossRef]
  26. Sundell, K.S.; Sundh, H. Intestinal Fluid Absorption in Anadromous Salmonids: Importance of Tight Junctions and Aquaporins. Front. Physiol. 2012, 3, 388. [Google Scholar] [CrossRef]
  27. Bjørgen, H.; Li, Y.; Kortner, T.M.; Krogdahl, Å.; Koppang, E.O. Anatomy, Immunology, Digestive Physiology and Microbiota of the Salmonid Intestine: Knowns and Unknowns under the Impact of an Expanding Industrialized Production. Fish Shellfish Immunol. 2020, 107, 172–186. [Google Scholar] [CrossRef] [PubMed]
  28. Collie, N.L.; Ferraris, R.P. Nutrient Fluxes and Regulation in Fish Intestine. Biochem. Mol. Biol. Fishes 1995, 4, 221–239. [Google Scholar] [CrossRef]
  29. Takei, Y.; Hiroi, J.; Takahashi, H.; Sakamoto, T. Diverse Mechanisms for Body Fluid Regulation in Teleost Fishes. Am. J. Physiol.—Regul. Integr. Comp. Physiol. 2014, 307, R778–R792. [Google Scholar] [CrossRef]
  30. Fuentes, J.; Eddy, F.B. Drinking in Marine, Euryhaline and Freshwater Teleost Fish. In Ionic Regulation in Animals: A Tribute to Professor W.T.W.Potts; Springer: Berlin/Heidelberg, Germany, 1997; pp. 135–149. ISBN 978-3-642-60415-7. [Google Scholar]
  31. Takei, Y. The Digestive Tract as an Essential Organ for Water Acquisition in Marine Teleosts: Lessons from Euryhaline Eels. Zool. Lett. 2021, 7, 10. [Google Scholar] [CrossRef]
  32. Grosell, M. Intestinal Transport. In The Physiology of Fishes; Evans, D.H., Claiborne, J.B., Currie, S., Eds.; CRC Press: Boca Raton, FL, USA, 2014; pp. 175–203. [Google Scholar]
  33. Takvam, M.; Sundell, K.; Sundh, H.; Gharbi, N.; Kryvi, H.; Nilsen, T.O. New Wine in Old Bottles: Modification of the Na+/K+-ATPase Enzyme Activity Assay and Its Application in Salmonid Aquaculture. Rev. Aquac. 2024, 16, 1087–1098. [Google Scholar] [CrossRef]
  34. Gharbi, K.; Ferguson, M.M.; Danzmann, R.G. Characterization of Na, K-ATPase Genes in Atlantic Salmon (Salmo salar) and Comparative Genomic Organization with Rainbow Trout (Oncorhynchus mykiss). Mol. Genet. Genomics 2005, 273, 474–483. [Google Scholar] [CrossRef] [PubMed]
  35. Pino Martinez, E.; Balseiro, P.; Pedrosa, C.; Haugen, T.S.; Fleming, M.S.; Handeland, S.O. The Effect of Photoperiod Manipulation on Atlantic Salmon Growth, Smoltification and Sexual Maturation: A Case Study of a Commercial RAS. Aquac. Res. 2021, 52, 2593–2608. [Google Scholar] [CrossRef]
  36. Tipsmark, C.K.; Sørensen, K.J.; Hulgard, K.; Madsen, S.S. Claudin-15 and -25b Expression in the Intestinal Tract of Atlantic Salmon in Response to Seawater Acclimation, Smoltification and Hormone Treatment. Comp. Biochem. Physiol. Part A Mol. Integr. Physiol. 2010, 155, 361–370. [Google Scholar] [CrossRef]
  37. Tipsmark, C.K.; Madsen, S.S.; Seidelin, M.; Christensen, A.S.; Cutler, C.P.; Cramb, G. Dynamics of Na+,K+,2Cl Cotransporter and Na+,K+-ATPase Expression in the Branchial Epithelium of Brown Trout (Salmo Trutta) and Atlantic Salmon (Salmo salar). J. Exp. Zool. 2002, 293, 106–118. [Google Scholar] [CrossRef] [PubMed]
  38. Hiroi, J.; McCormick, S.D. New Insights into Gill Ionocyte and Ion Transporter Function in Euryhaline and Diadromous Fish. Respir. Physiol. Neurobiol. 2012, 184, 257–268. [Google Scholar] [CrossRef]
  39. Grosell, M. The Role of the Gastrointestinal Tract in Salt and Water Balance; Academic Press: Cambridge, MA, USA, 2010; Volume 30. [Google Scholar]
  40. Breves, J.P.; McKay, I.S.; Koltenyuk, V.; Nelson, N.N.; Lema, S.C.; McCormick, S.D. Na+/HCO3 Cotransporter 1 (Nbce1) Isoform Gene Expression during Smoltification and Seawater Acclimation of Atlantic Salmon. J. Comp. Physiol. B Biochem. Syst. Environ. Physiol. 2022, 192, 577–592. [Google Scholar] [CrossRef]
  41. Perry, S.F.; Furimsky, M.; Bayaa, M.; Georgalis, T.; Shahsavarani, A.; Nickerson, J.G.; Moon, T.W. Integrated Responses of Na+/HCO3 Cotransporters and V-Type H+-ATPases in the Fish Gill and Kidney during Respiratory Acidosis. Biochim. Biophys. Acta—Biomembr. 2003, 1618, 175–184. [Google Scholar] [CrossRef]
  42. Bernard, B.; Leguen, I.; Mandiki, S.N.M.; Cornet, V.; Redivo, B.; Kestemont, P. Impact of Temperature Shift on Gill Physiology during Smoltification of Atlantic Salmon Smolts (Salmo salar L.). Comp. Biochem. Physiol. Part A Mol. Integr. Physiol. 2020, 244, 110685. [Google Scholar] [CrossRef]
  43. McCormick, S.D.; Regish, A.M.; Christensen, A.K.; Björnsson, B.T. Differential Regulation of Sodium-Potassium Pump Isoforms during Smolt Development and Seawater Exposure of Atlantic Salmon. J. Exp. Biol. 2013, 216, 1142–1151. [Google Scholar] [CrossRef]
  44. Stefansson, S.O.; Björnsson, B.T.; Ebbesson, L.O.; McCormick, S.D. Smoltification. In Fish Larval Physiology; Finn, R.N., Kapoo, B.G., Eds.; CRC Press: Boca Raton, FL, USA, 2020; pp. 639–681. ISBN 9780429061608. [Google Scholar]
  45. McCormick, S.D.; Cunjak, R.A.; Dempson, B.; O’Dea, M.F.; Carey, J.B. Temperature-Related Loss of Smolt Characteristics in Atlantic Salmon (Salmo salar) in the Wild. Can. J. Fish. Aquat. Sci. 1999, 56, 1649–1667. [Google Scholar] [CrossRef]
  46. Handeland, S.O.; Wilkinsson, E.; Stefansson, S.O. Smolting and De-Smolting at Different Temperatures in Two Strains of Atlantic Salmon (Salmo salar L.). Inst. Fisk. Mar. Rapp. Bergen 2001, 10, 1–20. [Google Scholar]
  47. Zydlewski, G.B.; Haro, A.; McCormick, S.D. Evidence for Cumulative Temperature as an Initiating and Terminating Factor in Downstream Migratory Behavior of Atlantic Salmon (Salmo salar) Smolts. Can. J. Fish. Aquat. Sci. 2005, 62, 68–78. [Google Scholar] [CrossRef]
  48. Melo, M.C.; Andersson, E.; Fjelldal, P.G.; Bogerd, J.; França, L.R.; Taranger, G.L.; Schulz, R.W. Salinity and Photoperiod Modulate Pubertal Development in Atlantic Salmon (Salmo salar). J. Endocrinol. 2014, 220, 319–332. [Google Scholar] [CrossRef]
  49. Ciani, E.; von Krogh, K.; Nourizadeh-Lillabadi, R.; Mayer, I.; Fontaine, R.; Weltzien, F.A. Sexual Maturation in Atlantic Salmon Male Parr May Be Triggered Both in Late Summer and Early Spring under Standard Farming Conditions. Aquaculture 2021, 544, 737086. [Google Scholar] [CrossRef]
  50. Pfaffl, M.W. A New Mathematical Model for Relative Quantification in Real-Time RT-PCR. Nucleic Acids Res. 2001, 29, e45. [Google Scholar] [CrossRef] [PubMed]
  51. Olsvik, P.A.; Lie, K.K.; Jordal, A.E.O.; Nilsen, T.O.; Hordvik, I. Evaluation of Potential Reference Genes in Real-Time RT-PCR Studies of Atlantic Salmon. BMC Mol. Biol. 2005, 6, 21. [Google Scholar] [CrossRef]
  52. Gaetano, P. Intestinal Physiology in Atlantic Salmonpreparatory Changes during Smolting and After Seawater Entry. Doctoral Dissertation, University of Cadiz, Cádiz, Spain, 2024. [Google Scholar]
  53. McCormick, S.D. Methods for Nonlethal Gill Biopsy and Measurement of Na+,K+-ATPase Activity. Can. J. Fish. Aquat. Sci. 1993, 50, 656–658. [Google Scholar] [CrossRef]
  54. R Core Team. R: A Language and Environment for Statistical Computing; R Foundation for Statistical Computing: Vienna, Austria, 2022. [Google Scholar]
  55. Posit Team. RStudio: Integrated Development Environment for R; Posit Team: Boston, MA, USA, 2023. [Google Scholar]
  56. Delignette-Muller, M.L.; Dutang, C. Fitdistrplus: An R Package for Fitting Distributions. J. Stat. Softw. 2015, 64, 1–34. [Google Scholar] [CrossRef]
  57. Brooks, M.E.; Kristensen, K.; van Benthem, K.J.; Magnusson, A.; Berg, C.W.; Nielsen, A.; Skaug, H.J.; Mächler, M.; Bolker, B.M. GlmmTMB Balances Speed and Flexibility among Packages for Zero-Inflated Generalized Linear Mixed Modeling. R J. 2017, 9, 378–400. [Google Scholar] [CrossRef]
  58. Dunn, P.K.; Smyth, G.K. Randomized Quantile Residuals. J. Comput. Graph. Stat. 1996, 5. [Google Scholar] [CrossRef]
  59. Hartig, F. DHARMa: Residual Diagnostics for Hierarchical (Multi-Level/Mixed) Regression Models, R Package Version 0.4.6; 2022. Available online: http://florianhartig.github.io/DHARMa (accessed on 6 March 2025).
  60. Fox, J.; Weisberg, S. An R Companion to Applied Regression: Appendices, 3rd ed.; Sage: Thousand Oaks, CA, USA, 2019; ISBN 141297514X. [Google Scholar]
  61. Lenth, R.V. Emmeans: Estimated Marginal Means, Aka Least-Squares Means, R Package Version 1.8.4-1; 2023. Available online: https://rvlenth.github.io/emmeans/ (accessed on 6 March 2025).
  62. Wickham, H. Ggplot2: Elegant Graphics for Data Analysis; Springer: New York, NY, USA, 2016; Volume 35. [Google Scholar]
  63. Hothorn, T.; Bretz, F.; Westfall, P. Simultaneous Inference in General Parametric Models. Biom. J. 2008, 50, 346–363. [Google Scholar] [CrossRef] [PubMed]
  64. Lock, E.J.; Ornsrud, R.; Aksnes, L.; Spanings, F.A.T.; Waagbø, R.; Flik, G. The Vitamin D Receptor and Its Ligand 1α,25-Dihydroxyvitamin D3 in Atlantic Salmon (Salmo salar). J. Endocrinol. 2007, 193, 459–471. [Google Scholar] [CrossRef] [PubMed]
  65. van Rijn, C.A.; Jones, P.L.; Evans, B.S.; Afonso, L.O.B. Physiological and Growth Responses of Juvenile Atlantic Salmon (Salmo salar) Transferred to Seawater during Different Stages of Smolt Development. Aquaculture 2021, 538, 736527. [Google Scholar] [CrossRef]
  66. Handeland, S.O.; Imsland, A.K.; Björnsson, B.T.; Stefansson, S.O. Long-Term Effects of Photoperiod, Temperature and Their Interaction on Growth, Gill Na+, K+-ATPase Activity, Seawater Tolerance and Plasma Growth-Hormone Levels in Atlantic Salmon Salmo salar. J. Fish Biol. 2013, 83, 1197–1209. [Google Scholar] [CrossRef]
  67. Stefansson, S.O.; Nilsen, T.O.; Ebbesson, L.O.E.; Wargelius, A.; Madsen, S.S.; Björnsson, B.T.; McCormick, S.D. Molecular Mechanisms of Continuous Light Inhibition of Atlantic Salmon Parr-Smolt Transformation. Aquaculture 2007, 273, 235–245. [Google Scholar] [CrossRef]
  68. Sheridan, M.A.; Woo, N.Y.S.; Bern, H.A. Changes in the Rates of Glycogenesis, Glycogenolysis, Lipogenesis, and Lipolysis in Selected Tissues of the Coho Salmon (Oncorhynchus kisutch) Associated with Parr-smolt Transformation. J. Exp. Zool. 1985, 236, 35–44. [Google Scholar] [CrossRef]
  69. Robertson, J.C.; Bradley, T.M. Hepatic Ulstrastructure Changes Associated with the Parr-smolt Transformation of Atlantic Salmon (Salmo salar). J. Exp. Zool. 1991, 260, 135–148. [Google Scholar] [CrossRef]
  70. Ji, H.; Bradley, T.M.; Tremblay, G.C. Lactate-Dependent Gluconeogenesis and Atractyloside-Sensitive Flux through Pyruvate Carboxylase Are Reduced during Smoltification of Atlantic Salmon (Salmo Solar). J. Exp. Zool. 1996, 276, 375–386. [Google Scholar] [CrossRef]
  71. Peter, M.C.S. The Role of Thyroid Hormones in Stress Response of Fish. Gen. Comp. Endocrinol. 2011, 172, 198–210. [Google Scholar] [CrossRef]
  72. Handeland, S.O.; Imsland, A.K.; Stefansson, S.O. The Effect of Temperature and Fish Size on Growth, Feed Intake, Food Conversion Efficiency and Stomach Evacuation Rate of Atlantic Salmon Post-Smolts. Aquaculture 2008, 283, 36–42. [Google Scholar] [CrossRef]
  73. Brown, M.S.; Jones, P.L.; Tromp, J.J.; van Rijn, C.A.; Collins, R.A.; Afonso, L.O.B. The Physiology of Saltwater Acclimation in Large Juvenile Atlantic Salmon Salmo salar. J. Fish Biol. 2018, 93, 540–549. [Google Scholar] [CrossRef]
  74. Good, C.; Davidson, J. A Review of Factors Influencing Maturation of Atlantic Salmon, Salmo salar, with Focus on Water Recirculation Aquaculture System Environments. J. World Aquac. Soc. 2016, 47, 605–632. [Google Scholar] [CrossRef]
  75. Pino Martinez, E.; Balseiro, P.; Stefansson, S.O.; Kaneko, N.; Norberg, B.; Fleming, M.S.; Imsland, A.K.D.; Handeland, S.O. Interaction of Temperature and Feed Ration on Male Postsmolt Maturation of Atlantic Salmon (Salmo salar L.). Aquaculture 2023, 562, 738877. [Google Scholar] [CrossRef]
  76. Skjold, V.; Rørvik, K.-A.; Sveen, L.; Burgerhout, E.; Mota, V.C.; Weihe, R.; Ytrestøyl, T.; Bou, M.; Jacobsen, H.J.; Allaoui, G.; et al. Gradually Decreasing Daylength after Smoltification Induced by “winter Signal” Reduced Sexual Maturation in Male Atlantic Salmon. Front. Aquac. 2024, 2, 1235584. [Google Scholar] [CrossRef]
  77. Loncoman, C.A.; Saravia, J.; Gutierrez, L.; Contreras, C.; Oyarzún, R.; Strobel, P.; Enriquez, R.; Isla, A.; Figueroa, J.; Vargas-Chacoff, L.; et al. BK Potassium Channel MRNA Level Changes in Gills of Atlantic Salmon after Brackish Water Transfer. Aquaculture 2018, 491, 184–189. [Google Scholar] [CrossRef]
  78. Robertson, L.S.; McCormick, S.D. Transcriptional Profiling of the Parr-Smolt Transformation in Atlantic Salmon. Comp. Biochem. Physiol. Part D Genom. Proteom. 2012, 7, 351–360. [Google Scholar] [CrossRef] [PubMed]
  79. McCormick, S.D.; Regish, A.; O’Dea, M.F.; Shrimpton, J.M. Are We Missing a Mineralocorticoid in Teleost Fish? Effects of Cortisol, Deoxycorticosterone and Aldosterone on Osmoregulation, Gill Na+,K+-ATPase Activity and Isoform MRNA Levels in Atlantic Salmon. Gen. Comp. Endocrinol. 2008, 157, 35–40. [Google Scholar] [CrossRef]
  80. Gaetano, P.; Duarte, V.; Striberny, A.; Hazlerigg, D.; Jørgensen, E.H.; Campinho, M.A.; Fuentes, J. Photoperiod and Dietary Treatment in Freshwater Modulate the Short-Term Intestinal Response to Seawater in Atlantic Salmon (Salmo salar). Aquaculture 2023, 568, 739316. [Google Scholar] [CrossRef]
  81. Bisbal, G.A.; Specker, J.L. Cortisol Stimulates Hypo-osmoregulatory Ability in Atlantic Salmon, Salmo salar L. J. Fish Biol. 1991, 39, 421–432. [Google Scholar] [CrossRef]
  82. Kiilerich, P.; Pedersen, S.H.; Kristiansen, K.; Madsen, S.S. Corticosteroid Regulation of Na+,K+-ATPase A1-Isoform Expression in Atlantic Salmon Gill during Smolt Development. Gen. Comp. Endocrinol. 2011, 170, 283–289. [Google Scholar] [CrossRef]
  83. Breves, J.P.; Runiewicz, E.R.; Richardson, S.G.; Bradley, S.E.; Hall, D.J.; McCormick, S.D. Transcriptional Regulation of Esophageal, Intestinal, and Branchial Solute Transporters by Salinity, Growth Hormone, and Cortisol in Atlantic Salmon. J. Exp. Zool. Part A Ecol. Integr. Physiol. 2024, 341, 107–117. [Google Scholar] [CrossRef] [PubMed]
  84. Singer, T.D.; Clements, K.M.; Semple, J.W.; Schulte, P.M.; Bystriansky, J.S.; Finstad, B.; Fleming, I.A.; Scott McKinley, R. Seawater Tolerance and Gene Expression in Two Strains of Atlantic Salmon Smolts. Can. J. Fish. Aquat. Sci. 2002, 59, 125–135. [Google Scholar] [CrossRef]
  85. Morro, B.; Balseiro, P.; Albalat, A.; Pedrosa, C.; Mackenzie, S.; Nakamura, S.; Shimizu, M.; Nilsen, T.O.; Sveier, H.; Ebbesson, L.O.; et al. Effects of Different Photoperiod Regimes on the Smoltification and Seawater Adaptation of Seawater-Farmed Rainbow Trout (Oncorhynchus mykiss): Insights from Na+, K+–ATPase Activity and Transcription of Osmoregulation and Growth Regulation Genes. Aquaculture 2019, 507, 282–292. [Google Scholar] [CrossRef]
  86. Jutfelt, F.; Olsen, R.E.; Björnsson, B.T.; Sundell, K. Parr-Smolt Transformation and Dietary Vegetable Lipids Affect Intestinal Nutrient Uptake, Barrier Function and Plasma Cortisol Levels in Atlantic Salmon. Aquaculture 2007, 273, 298–311. [Google Scholar] [CrossRef]
  87. Madsen, S.S.; Olesen, J.H.; Bedal, K.; Engelund, M.B.; Velasco-Santamaría, Y.M.; Tipsmark, C.K. Functional Characterization of Water Transport and Cellular Localization of Three Aquaporin Paralogs in the Salmonid Intestine. Front. Physiol. 2011, 2, 56. [Google Scholar] [CrossRef]
  88. Grosell, M. Intestinal Anion Exchange in Marine Teleosts Is Involved in Osmoregulation and Contributes to the Oceanic Inorganic Carbon Cycle. Acta Physiol. 2011, 202, 421–434. [Google Scholar] [CrossRef]
  89. Veillette, P.A.; White, R.J.; Specker, J.L. Changes in Intestinal Fluid Transport in Atlantic Salmon (Salmo salar L.) during Parr-Smolt Transformation. Fish Physiol. Biochem. 1993, 12, 193–202. [Google Scholar] [CrossRef]
Figure 1. Schematic representation of experimental design. Following PIT-tagging, all fish were acclimated in flow-through FW tanks for 3 weeks at constant light (LL 24:0) conditions. Tanks were divided into 2 experimental groups: one kept at a constant light (LL group), and one subjected to a winter signal with 12 h of light and 12 h of dark for 6 weeks (LD group). After the winter signal, the LD group was given constant light for 6 (LD-1) or 8 (LD-2) weeks before SW transfer. LL and LD-1 were transferred to SW simultaneously. Sampling points are represented by green triangles and numbered by the sampling week. PIT-tagging and cyclic hypoxia events are indicated by purple triangles. The cyclic hypoxia (reduction in oxygen to 50% and increased temperature to 15 °C for 2 h) was performed in 4 episodes as follows: day 1 from 15:00 to 17:00, day 2 from 8:00 to 10:00 and from 15:00 to 17:00, and day 3 from 8:00 to 10:00.
Fishes 10 00119 g001
Figure 2. Intestinal sections collected for analysis. AMG: anterior midgut; PMG: posterior midgut; HG: hindgut. Photo: K. Murashita (picture of an Atlantic salmon gastrointestinal tract from a different study).
Fishes 10 00119 g002
Figure 3. Growth of Atlantic salmon in the freshwater phase after the winter signal and in seawater phase. (A): Fish body weight (g). (B): Relative Growth Rate (%) calculated based on the tagging weight. (C): Specific growth rate (g day−1) calculated from the tagging time for the FW phase and from the transfer time for the SW phase. (D): Condition factor (K). The x axis represents each sampling point in weeks after the winter signal and after the seawater transfer for every experimental group. The graph presents the model’s predicted mean (big dots) with SE, and the individual measurements are shown as jittered dots in the background. Sampling points not sharing the same letter (capital for LL and lowercase for LD) are significantly different (p.value ≤ 0.05), while asterisks denote differences between treatments at the same sampling point (* p value <0.05, ** p value < 0.01, *** p value < 0.001). The comparisons were performed independently for FW and SW.
Fishes 10 00119 g003
Figure 4. Atlantic salmon somatic indexes during the freshwater phase after winter signal and after transfer to seawater. (A): Hepatosomatic Index (HSI; %); (B): Cardiosomatic Index (CSI; %); (C): Gonadosomatic Index (GSI; %) in males. The x axis represents each sampling point in weeks after the winter signal and after the seawater transfer for every experimental group. The graph presents the model’s predicted mean (big dots) with SE, and the individual measurements are shown as jittered dots in the background. Sampling points not sharing the same letter (capital for LL and lowercase for LD) are significantly different (p.value ≤ 0.05), while asterisks denote differences between treatments at the same sampling point (* p value <0.05, ** p value < 0.01). The comparisons were performed independently for FW and SW.
Fishes 10 00119 g004
Figure 5. Plasma metabolites levels during the freshwater phase after winter signal and after transfer to seawater. (A): Glucose (mmol/L). (B): Lactate (mmol/L). (C): Cortisol (ng/mL). The x axis represents each sampling point in weeks after the winter signal and after the seawater transfer for every experimental group. The graph presents the model’s predicted mean (big dots) with SE, and the individual measurements are shown as jittered dots in the background. Sampling points not sharing the same letter (capital for LL and lowercase for LD) are significantly different (p.value ≤ 0.05), while asterisks denote differences between treatments at the same sampling point (*** p value < 0.001). The comparisons were performed independently for FW and SW.
Fishes 10 00119 g005
Figure 6. Plasma ion concentrations during the freshwater phase after the winter signal and during the seawater phase. (A) Chloride in mmol/L. (B) Sodium in mmol/L. (C) Potassium in mmol/L. (D) Calcium in mmol/L. (E) Magnesium in mmol/L. (F) Phosphorus in mmol/L. The x axis represents each sampling point in weeks after the winter signal and after the seawater transfer for every experimental group. The graph presents the model’s predicted mean (big dots) with SE, and the individual measurements are shown as jittered dots in the background. Sampling points not sharing the same letter (capital for LL and lowercase for LD) are significantly different (p.value ≤ 0.05), while asterisks denote differences between treatments at the same sampling point (* p value <0.05, ** p value < 0.01, *** p value < 0.001). The comparisons were performed independently for FW and SW.
Fishes 10 00119 g006
Figure 7. NKA activity level in the Atlantic salmon gill. The x axis represents each sampling point in weeks after the winter signal and after the seawater transfer for every experimental group. The graph presents the model’s predicted mean (big dots) with SE, and the individual measurements are shown as jittered dots in the background. Sampling points not sharing the same letter (capital for LL and lowercase for LD) are significantly different (p.value ≤ 0.05), while asterisks denote differences between treatments at the same sampling point (** p value < 0.01, *** p value < 0.001). The comparisons were performed independently for FW and SW.
Fishes 10 00119 g007
Figure 8. Summary of significant differences in gene expression of biomarkers linked to ions homeostasis in the gills, anterior midgut (AMG), posterior midgut (PMG), and hindgut (HG). The x axis represents each sampling point in weeks after the winter signal and after the seawater transfer of each experimental group. For the seawater phase, the figure represents the final sampling with different shapes illustrating group comparisons, and the color indicates the biomarker. The y axis of each graph is shown on a logarithmic scale. Circles represent the ratio of treatment comparisons based on the Tukey test. * p value < 0.05, ** p value < 0.01, *** p value < 0.001.
Fishes 10 00119 g008
Table 1. Sequence of the specific primers used for qPCR mRNA expression analysis. Primer sequence, GenBank accession number, and reference are indicated.
GeneGenBank Acc. No.Sequences (5′>3′)Reference
ef1αNM_001123629.1CCCCTCCAGGACGTTTACAAA[51]
CACACGGCCCACAGGTACA
b-actinNM_001123525.1AGGGACAACACTGCCTGGAT[51]
CCAAAGCCAACAGGGAGAAG
nkaα1aXM_045722983.1CCAGGATCACTCAATGTCACTCT(Modified from [14])
CAAAGGCAAATGAGTTTAATATC
nkaα1bXM_014150738.2GCTACATCTCAACCAACAACATTACAC[14]
TGCAGCTGAGTGCACCAT
nkaα1cXM_014152158.2AGGGAGACGTACTACTAGAAAGCAT[14]
CAGAACTTAAAATTCCGAGCAGCAA
cftrINM_001123533.1CCTTCTCCAATATGGTTGAAGAGGCAAG[14]
GAGGCACTTGGATGAGTCAGCAG
cftrIINM_001123534.1TGCTTAAGGTTAGTGCCTCAGG[52]
AAGGCTACTTCAGGTTAATCAC
nkcc1aNM_001123683.1GATGATCTGCGGCCATGTTC[14,16]
TCTGGTCATTGGACAGCTCTTTG
nbcXM_014140909.2TGGACCTGTTCTGGGTAGCAA[41]
AGCACTGGGTCTCCATCTTCAG
Table 2. Test results of the significant different comparisons between treatments for Atlantic salmon morphometric parameters, plasma ions and molecules, and NKA values obtained using Sidak HSD post hoc pairwise test in the SW phase.
VariableContrastWeeks After
SWT
RatioSEdfLCLUCLNullStatp value
Final weightLD-1/LL8–100.8410.057890.7160.9871−2.580.031
LD-2/LL8–100.8140.055890.6940.9561−3.050.009
RGRLD-2/LL8–100.8220.066Inf0.6820.9911−2.450.038
KLD-1/LL5–70.9340.017890.8940.9751−3.74<0.001
LD-1/LL8–100.9210.017890.8820.9621−4.48<0.001
LD-2/LL5–70.9210.017890.8820.9621−4.47<0.001
LD-2/LL8–100.9240.017890.8840.9651−4.33<0.001
HSILD-1/LD-25–71.1130.036891.0291.20313.260.004
LD-2/LL5–70.8560.028890.7920.9261−4.74<0.001
GSILD-1/LL8–100.7460.090460.5580.9981−2.440.048
CSILD-2/LL8–101.1190.048Inf1.0121.23712.620.024
Lactate in plasmaLD-1/LL 8–10 0.825 0.061 Inf 0.693 0.982 1 −2.59 0.026
SWT = seawater transfer, SE = standard error, df = degree of freedom, LCL = lower confidence limit, UCL = upper confidence limit, null = null hypothesis, stat = statistic value of the test.
Disclaimer/Publisher’s Note: The statements, opinions and data contained in all publications are solely those of the individual author(s) and contributor(s) and not of MDPI and/or the editor(s). MDPI and/or the editor(s) disclaim responsibility for any injury to people or property resulting from any ideas, methods, instructions or products referred to in the content.