
A Deep Learning Approach to Automated Treatment Classification in Tuna Processing: Enhancing Quality Control in Indonesian Fisheries
 and
and
Abstract
1. Introduction
- It provides an overview of advancements in fisheries and marine science research, emphasizing the application of machine learning and deep learning models, with a particular focus on tuna, through a comprehensive literature review.
- It introduces a non-destructive framework based on DL-CNN for identifying treatments of tuna loin by analyzing and interpreting the color characteristics of tuna loin meat.
- It evaluates the performance of prediction models for tuna loin treatments by utilizing multiple CNN architectures.
2. Related Works
2.1. Machine Learning
2.2. Deep Learning
3. Material and Methods
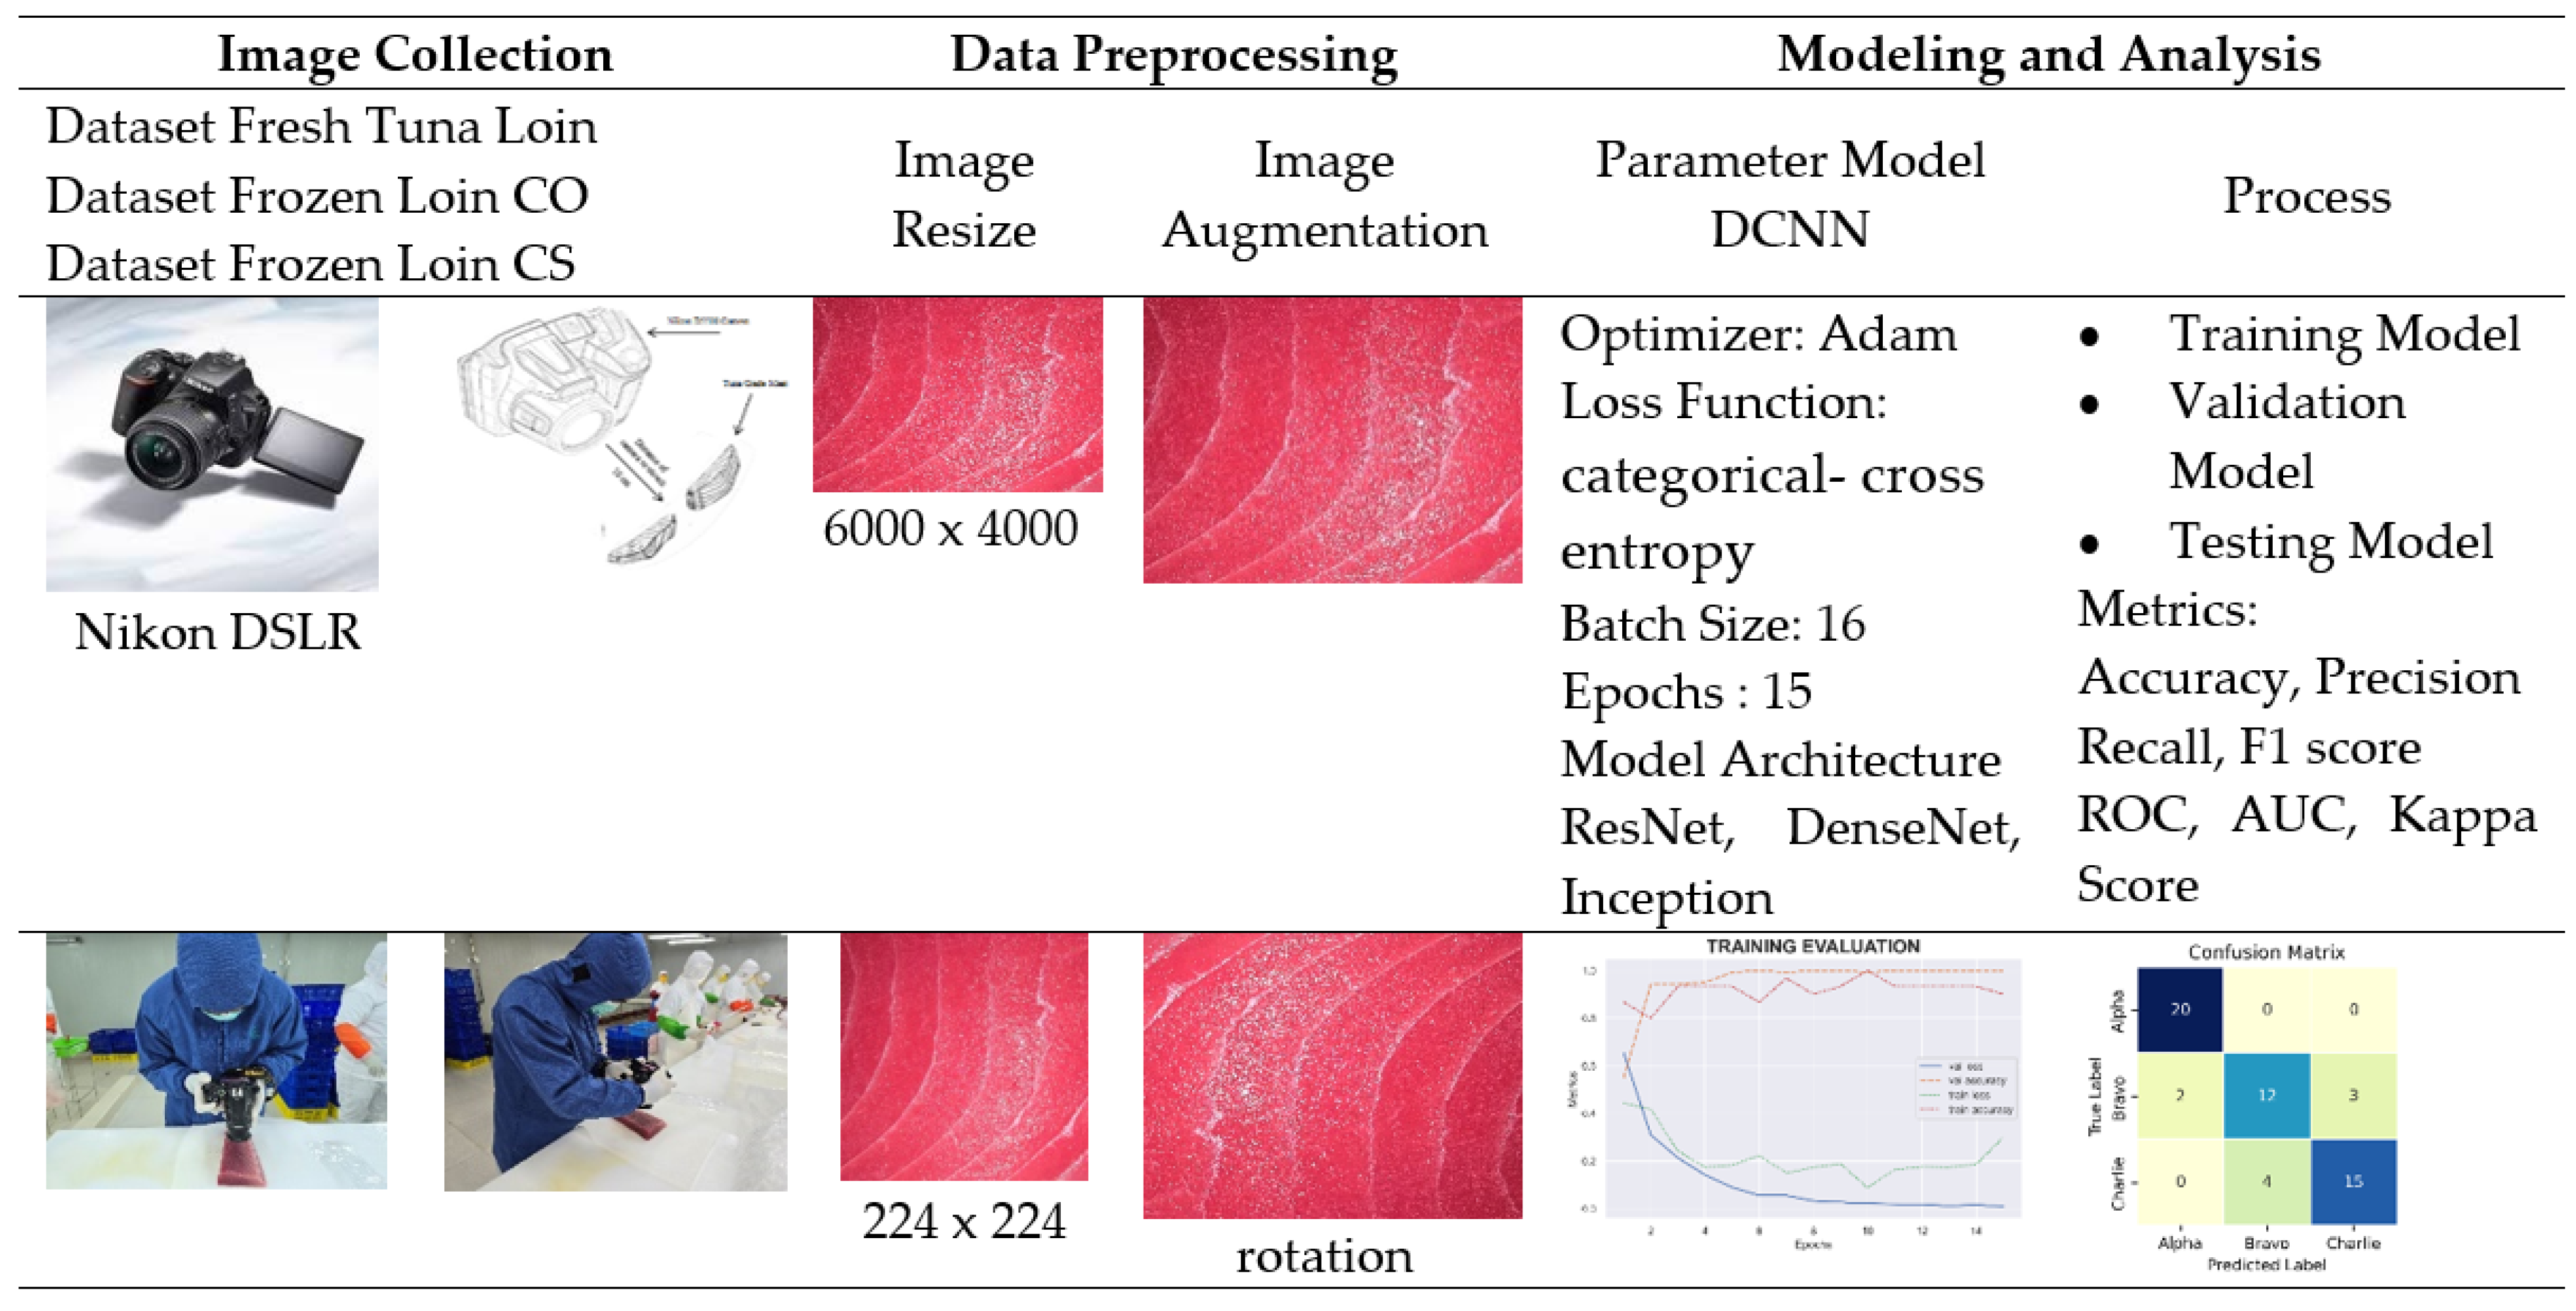
3.1. Research/System Overview
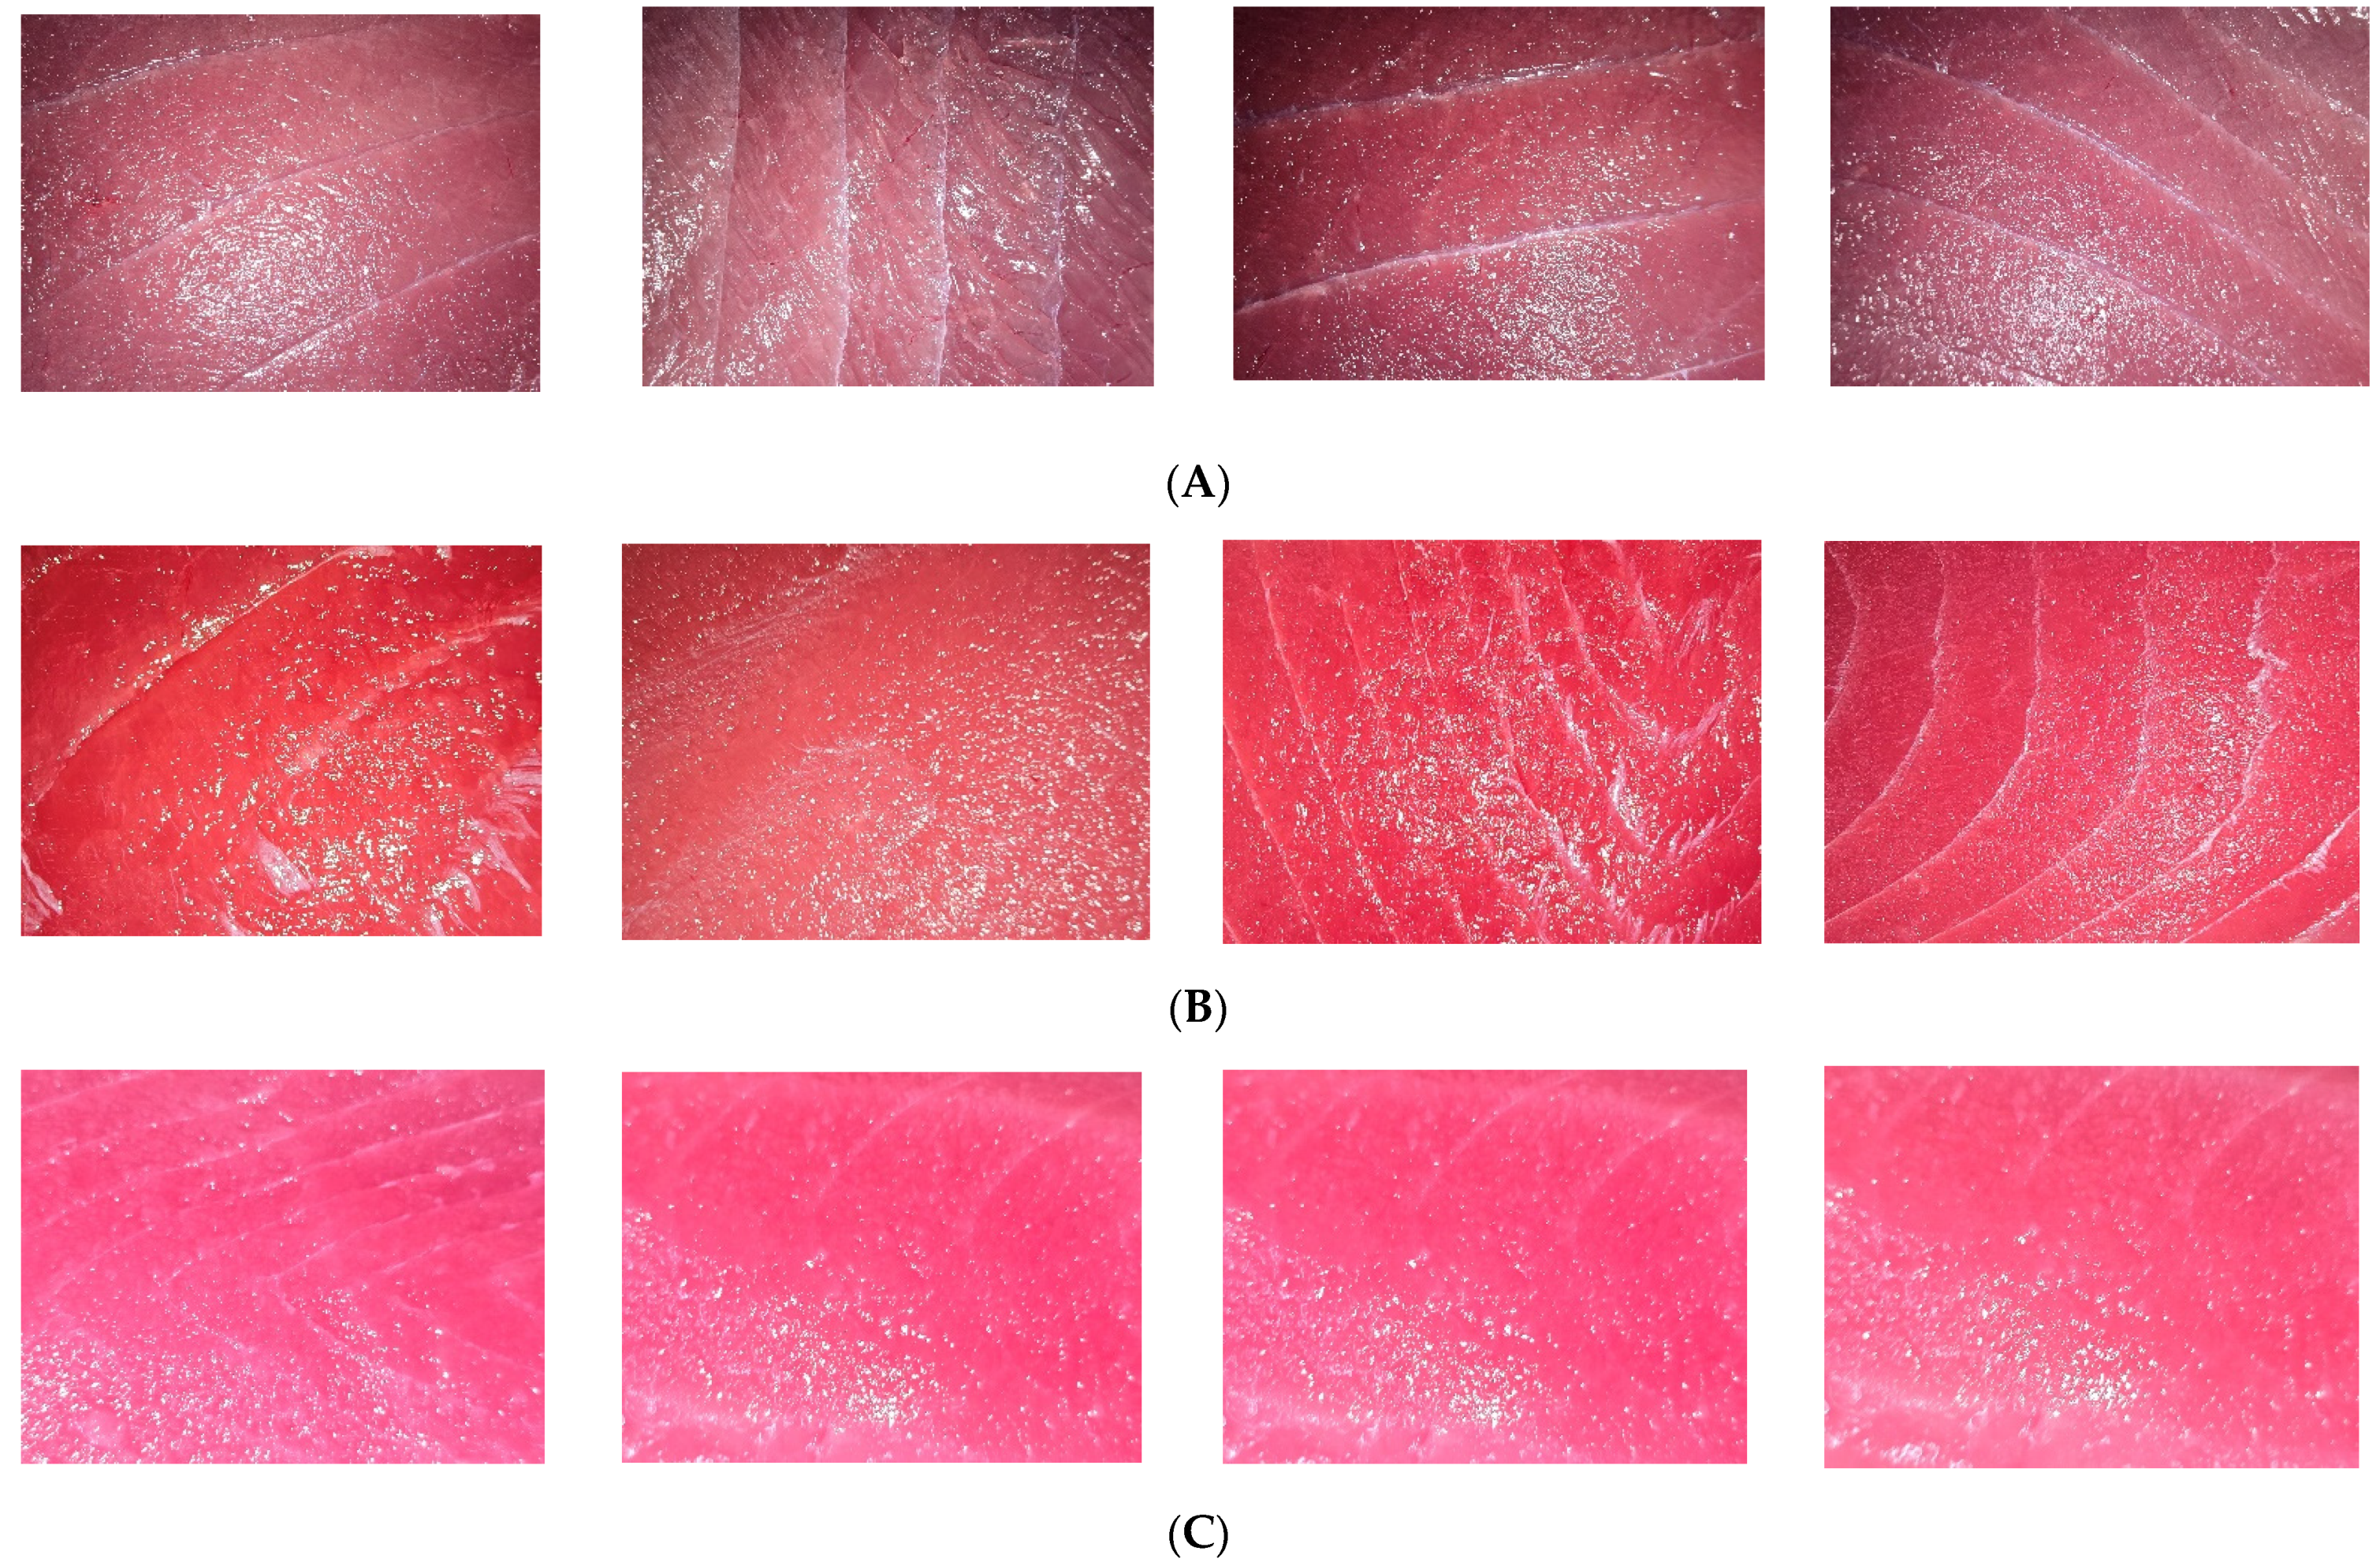
3.2. Image Datasets
3.3. Image Resizing and Image Data Augmentation
3.4. Model Architectures
3.4.1. DenseNet
3.4.2. ResNet
3.4.3. Inception
3.5. Metric Evaluation
3.6. Model Training and Testing
3.7. Implementation
4. Result and Discussion
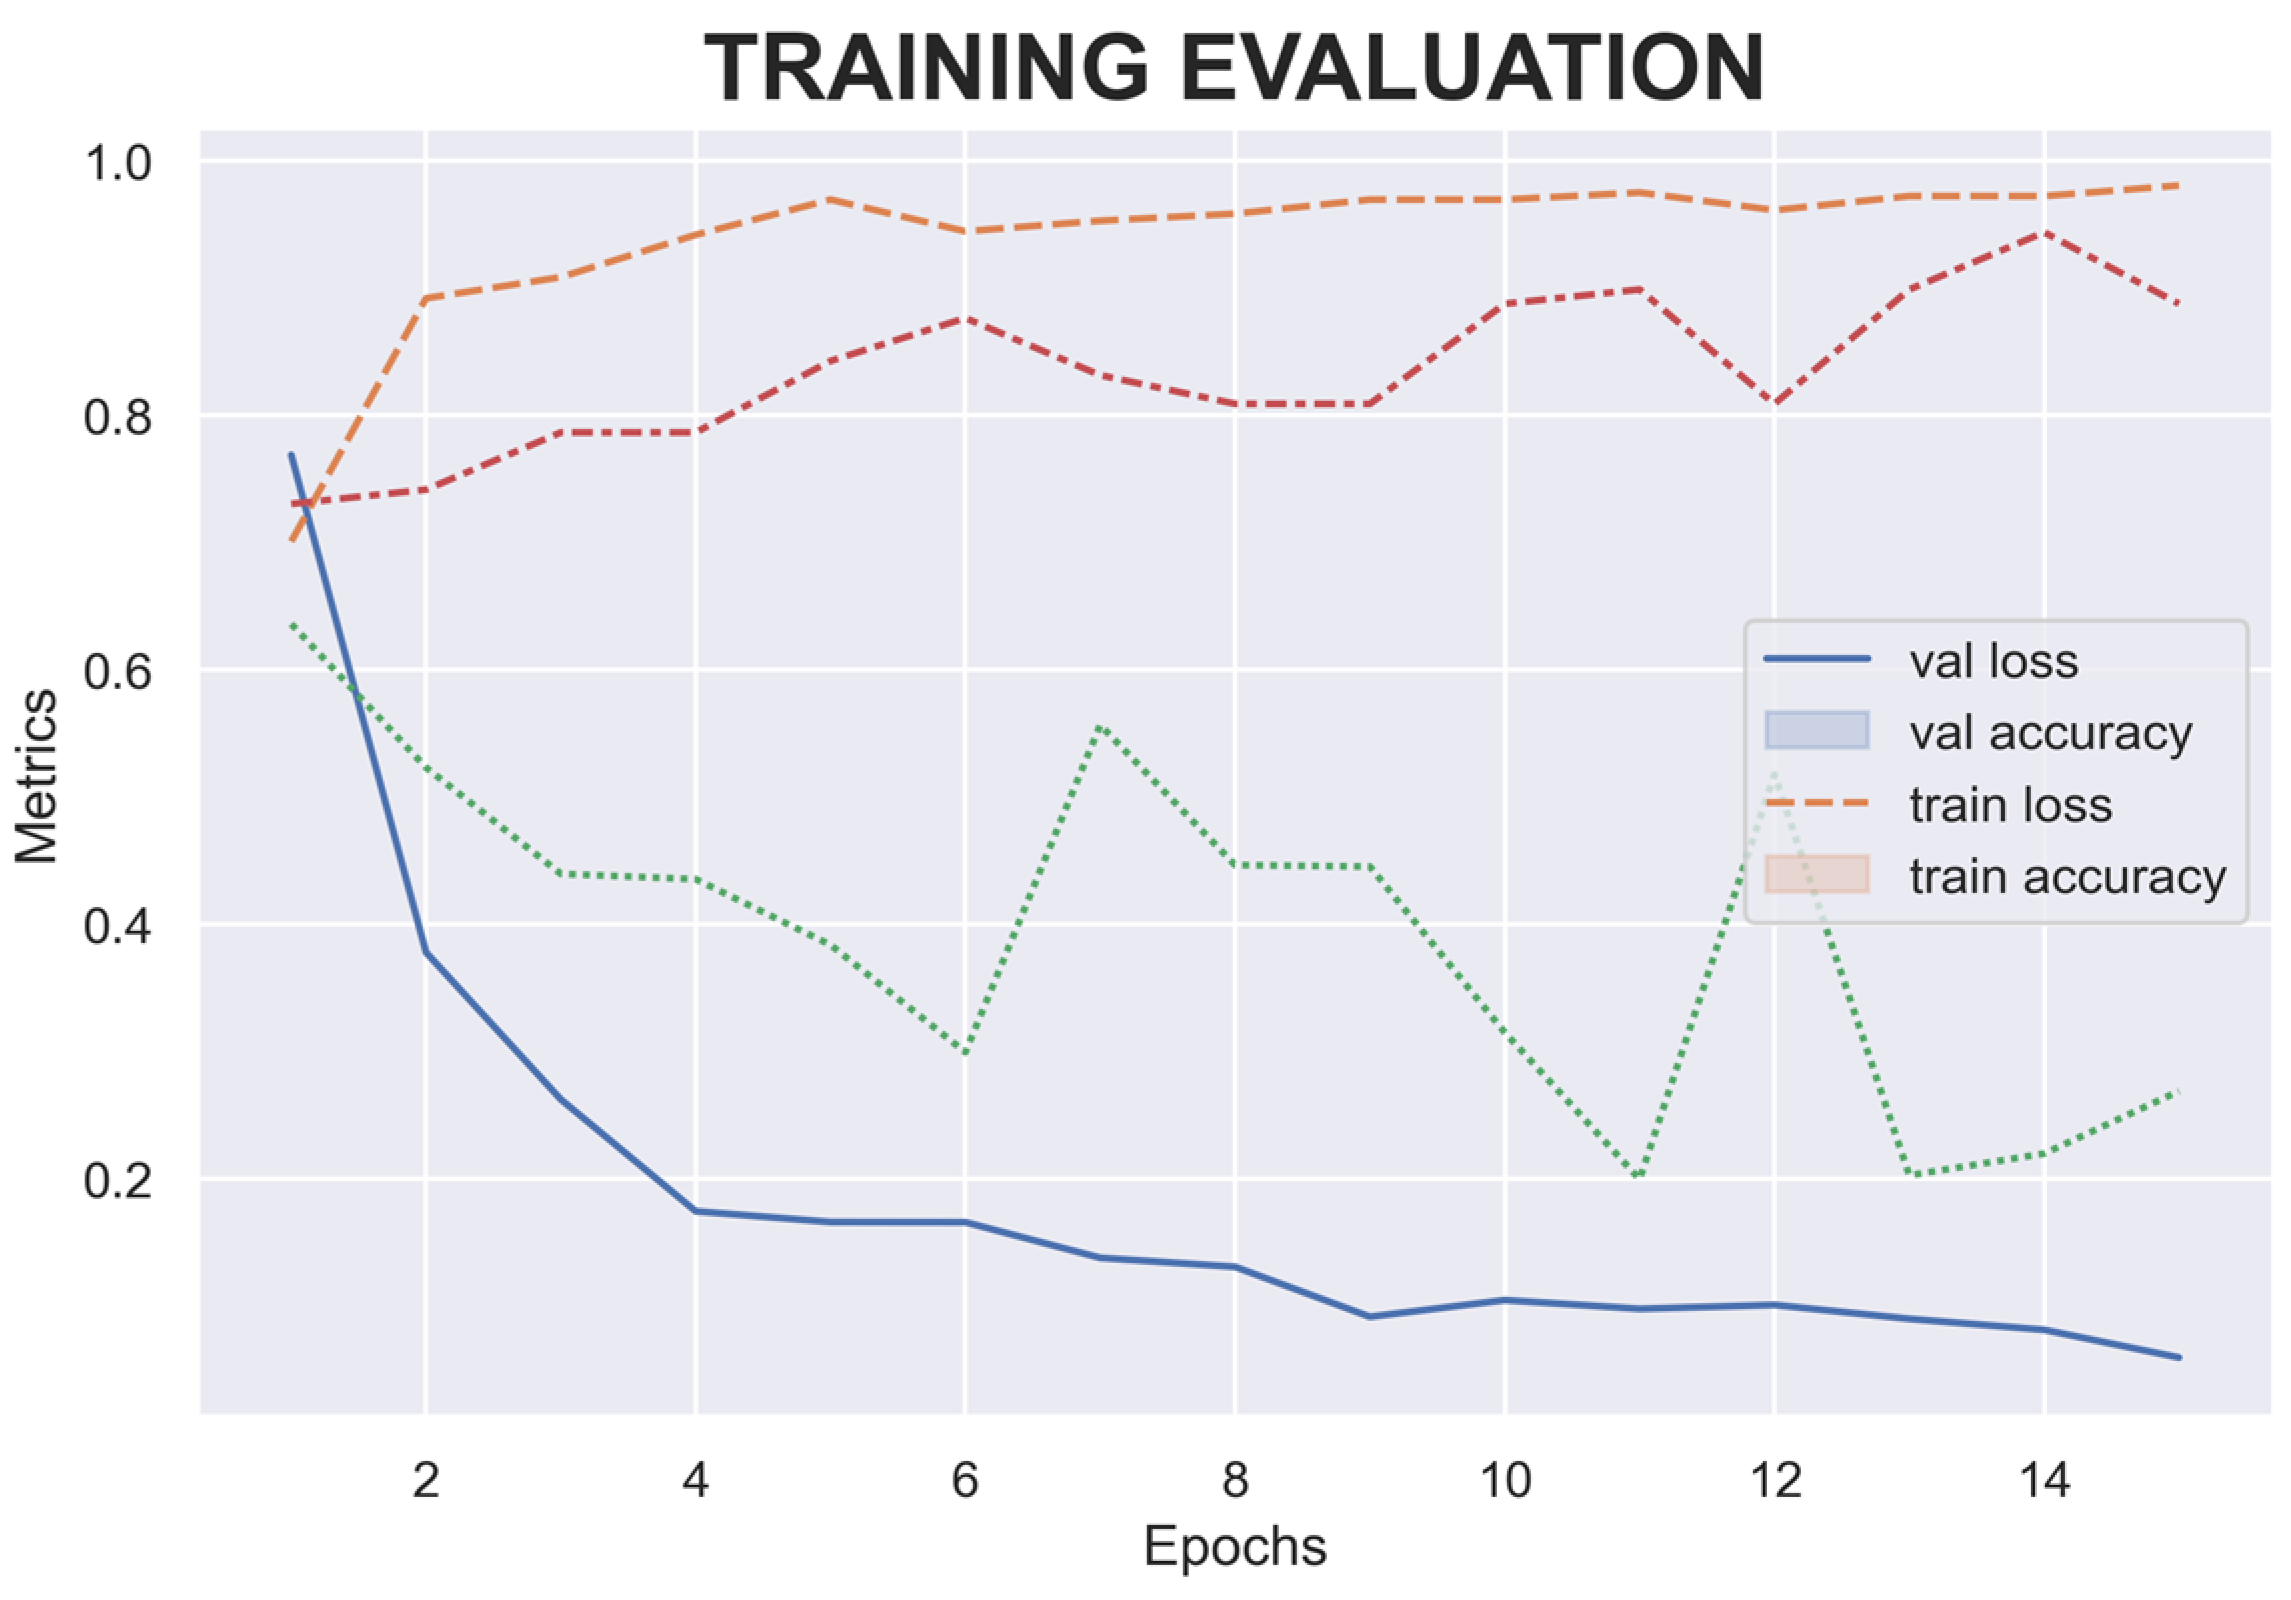
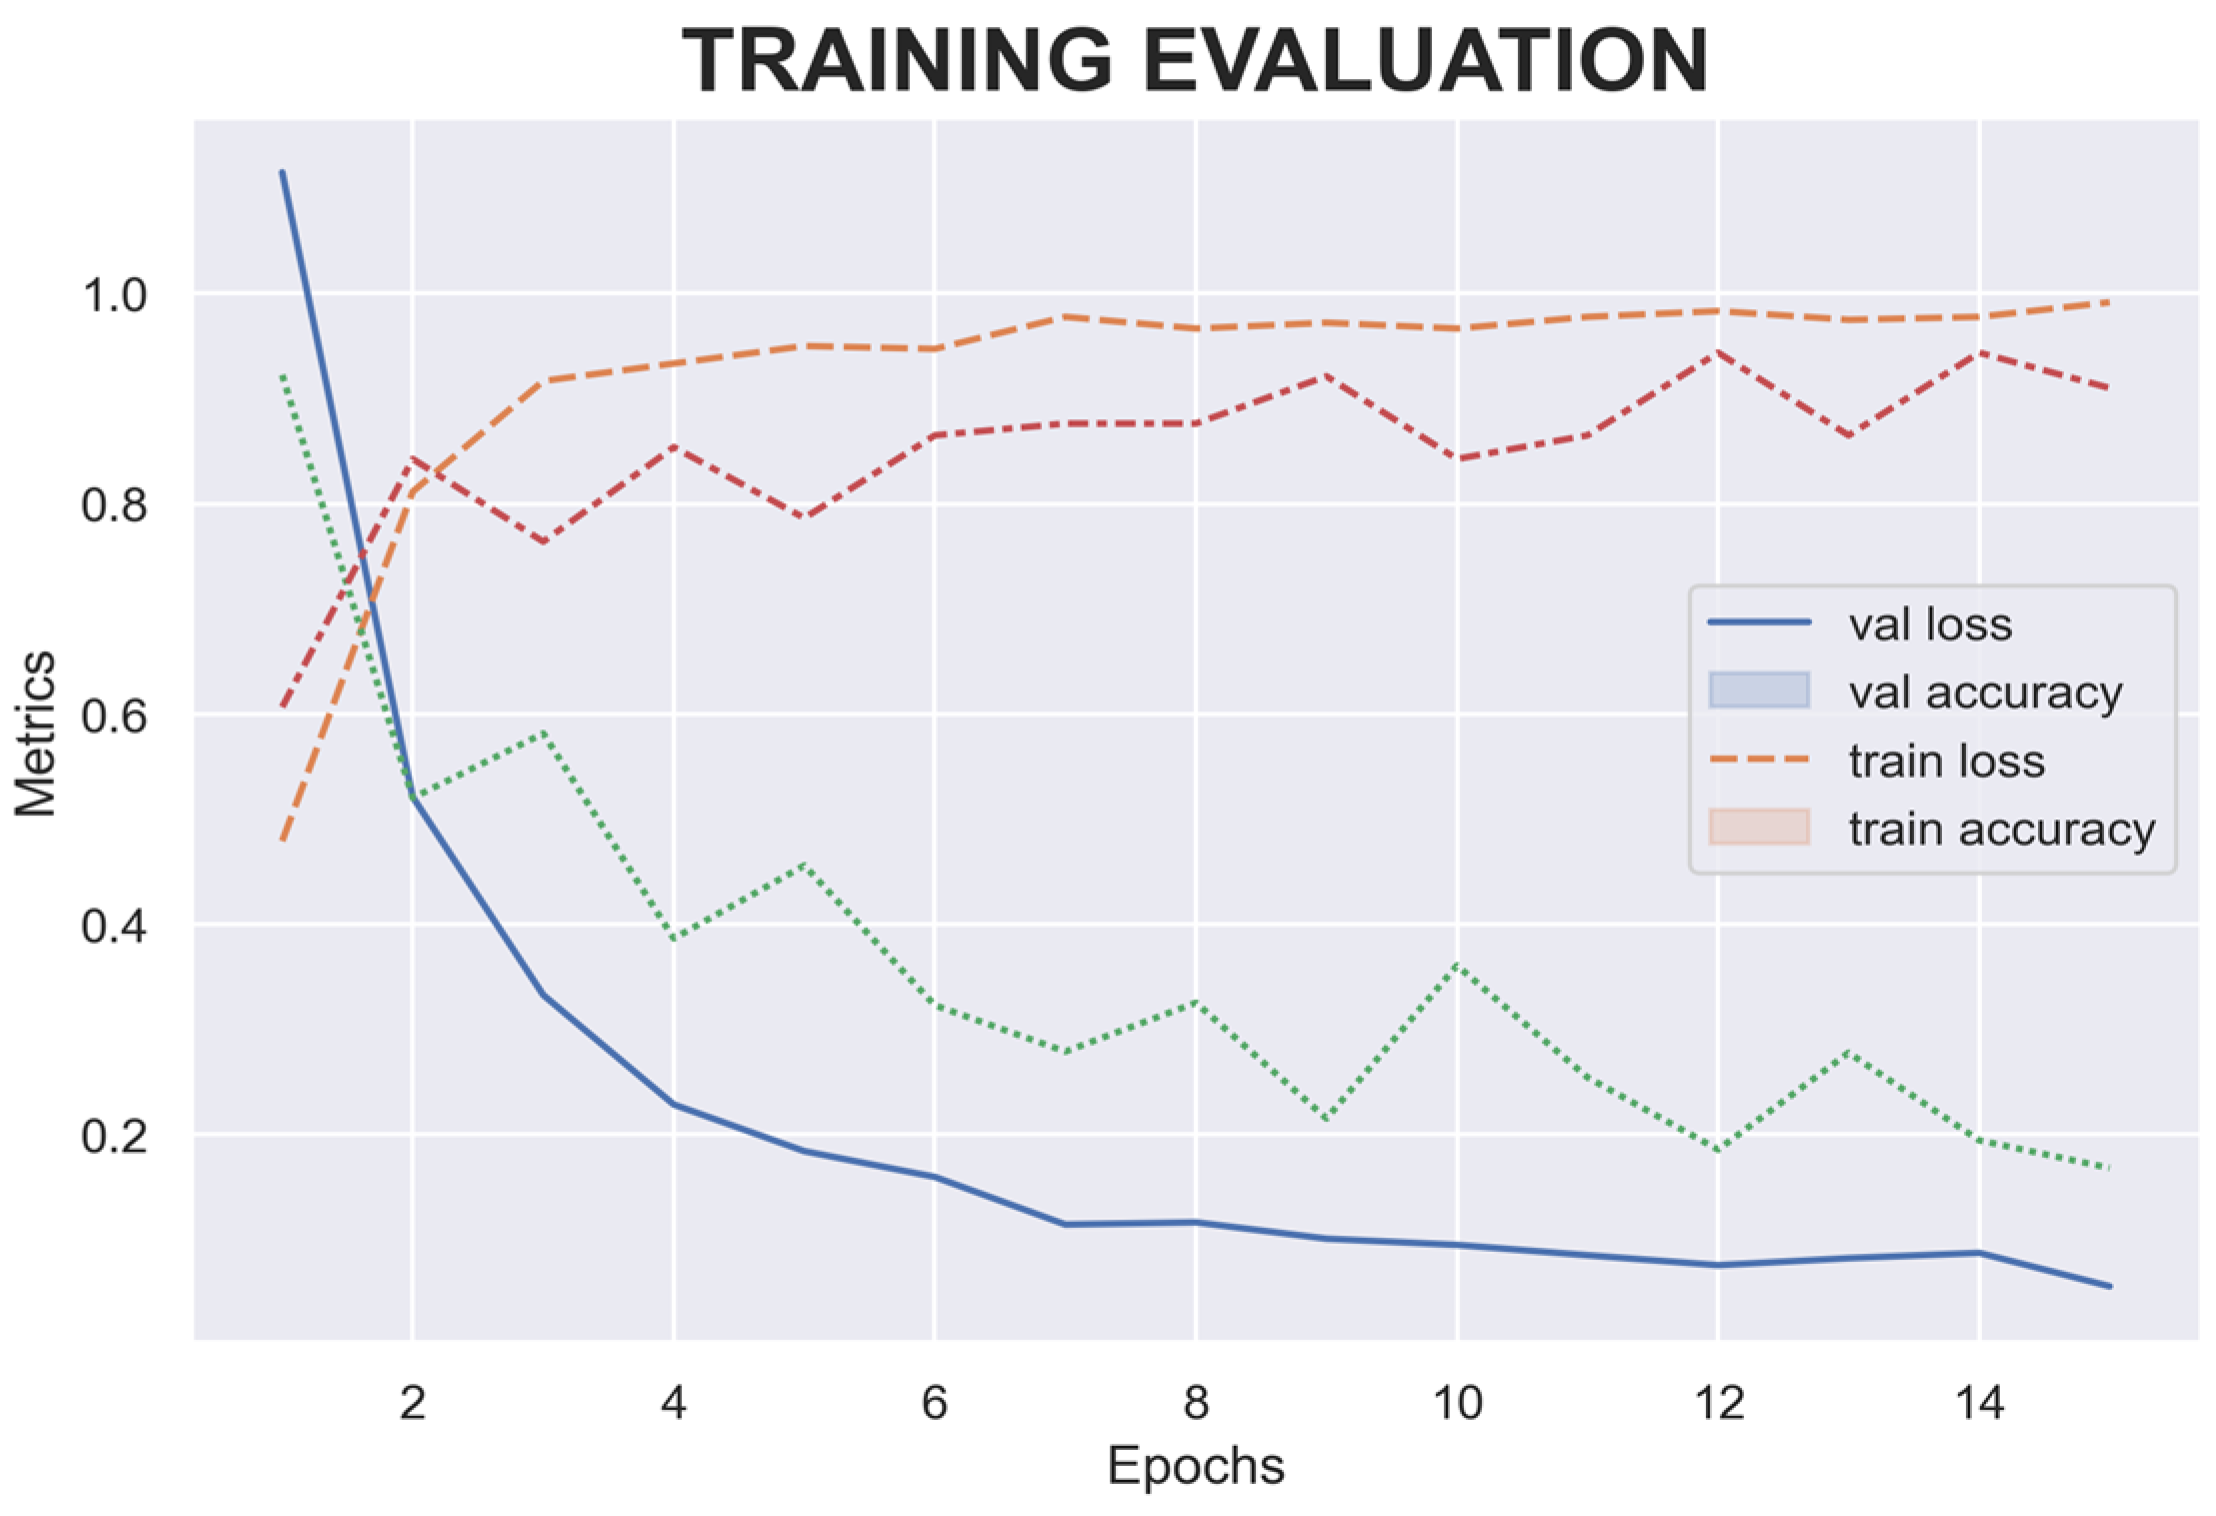
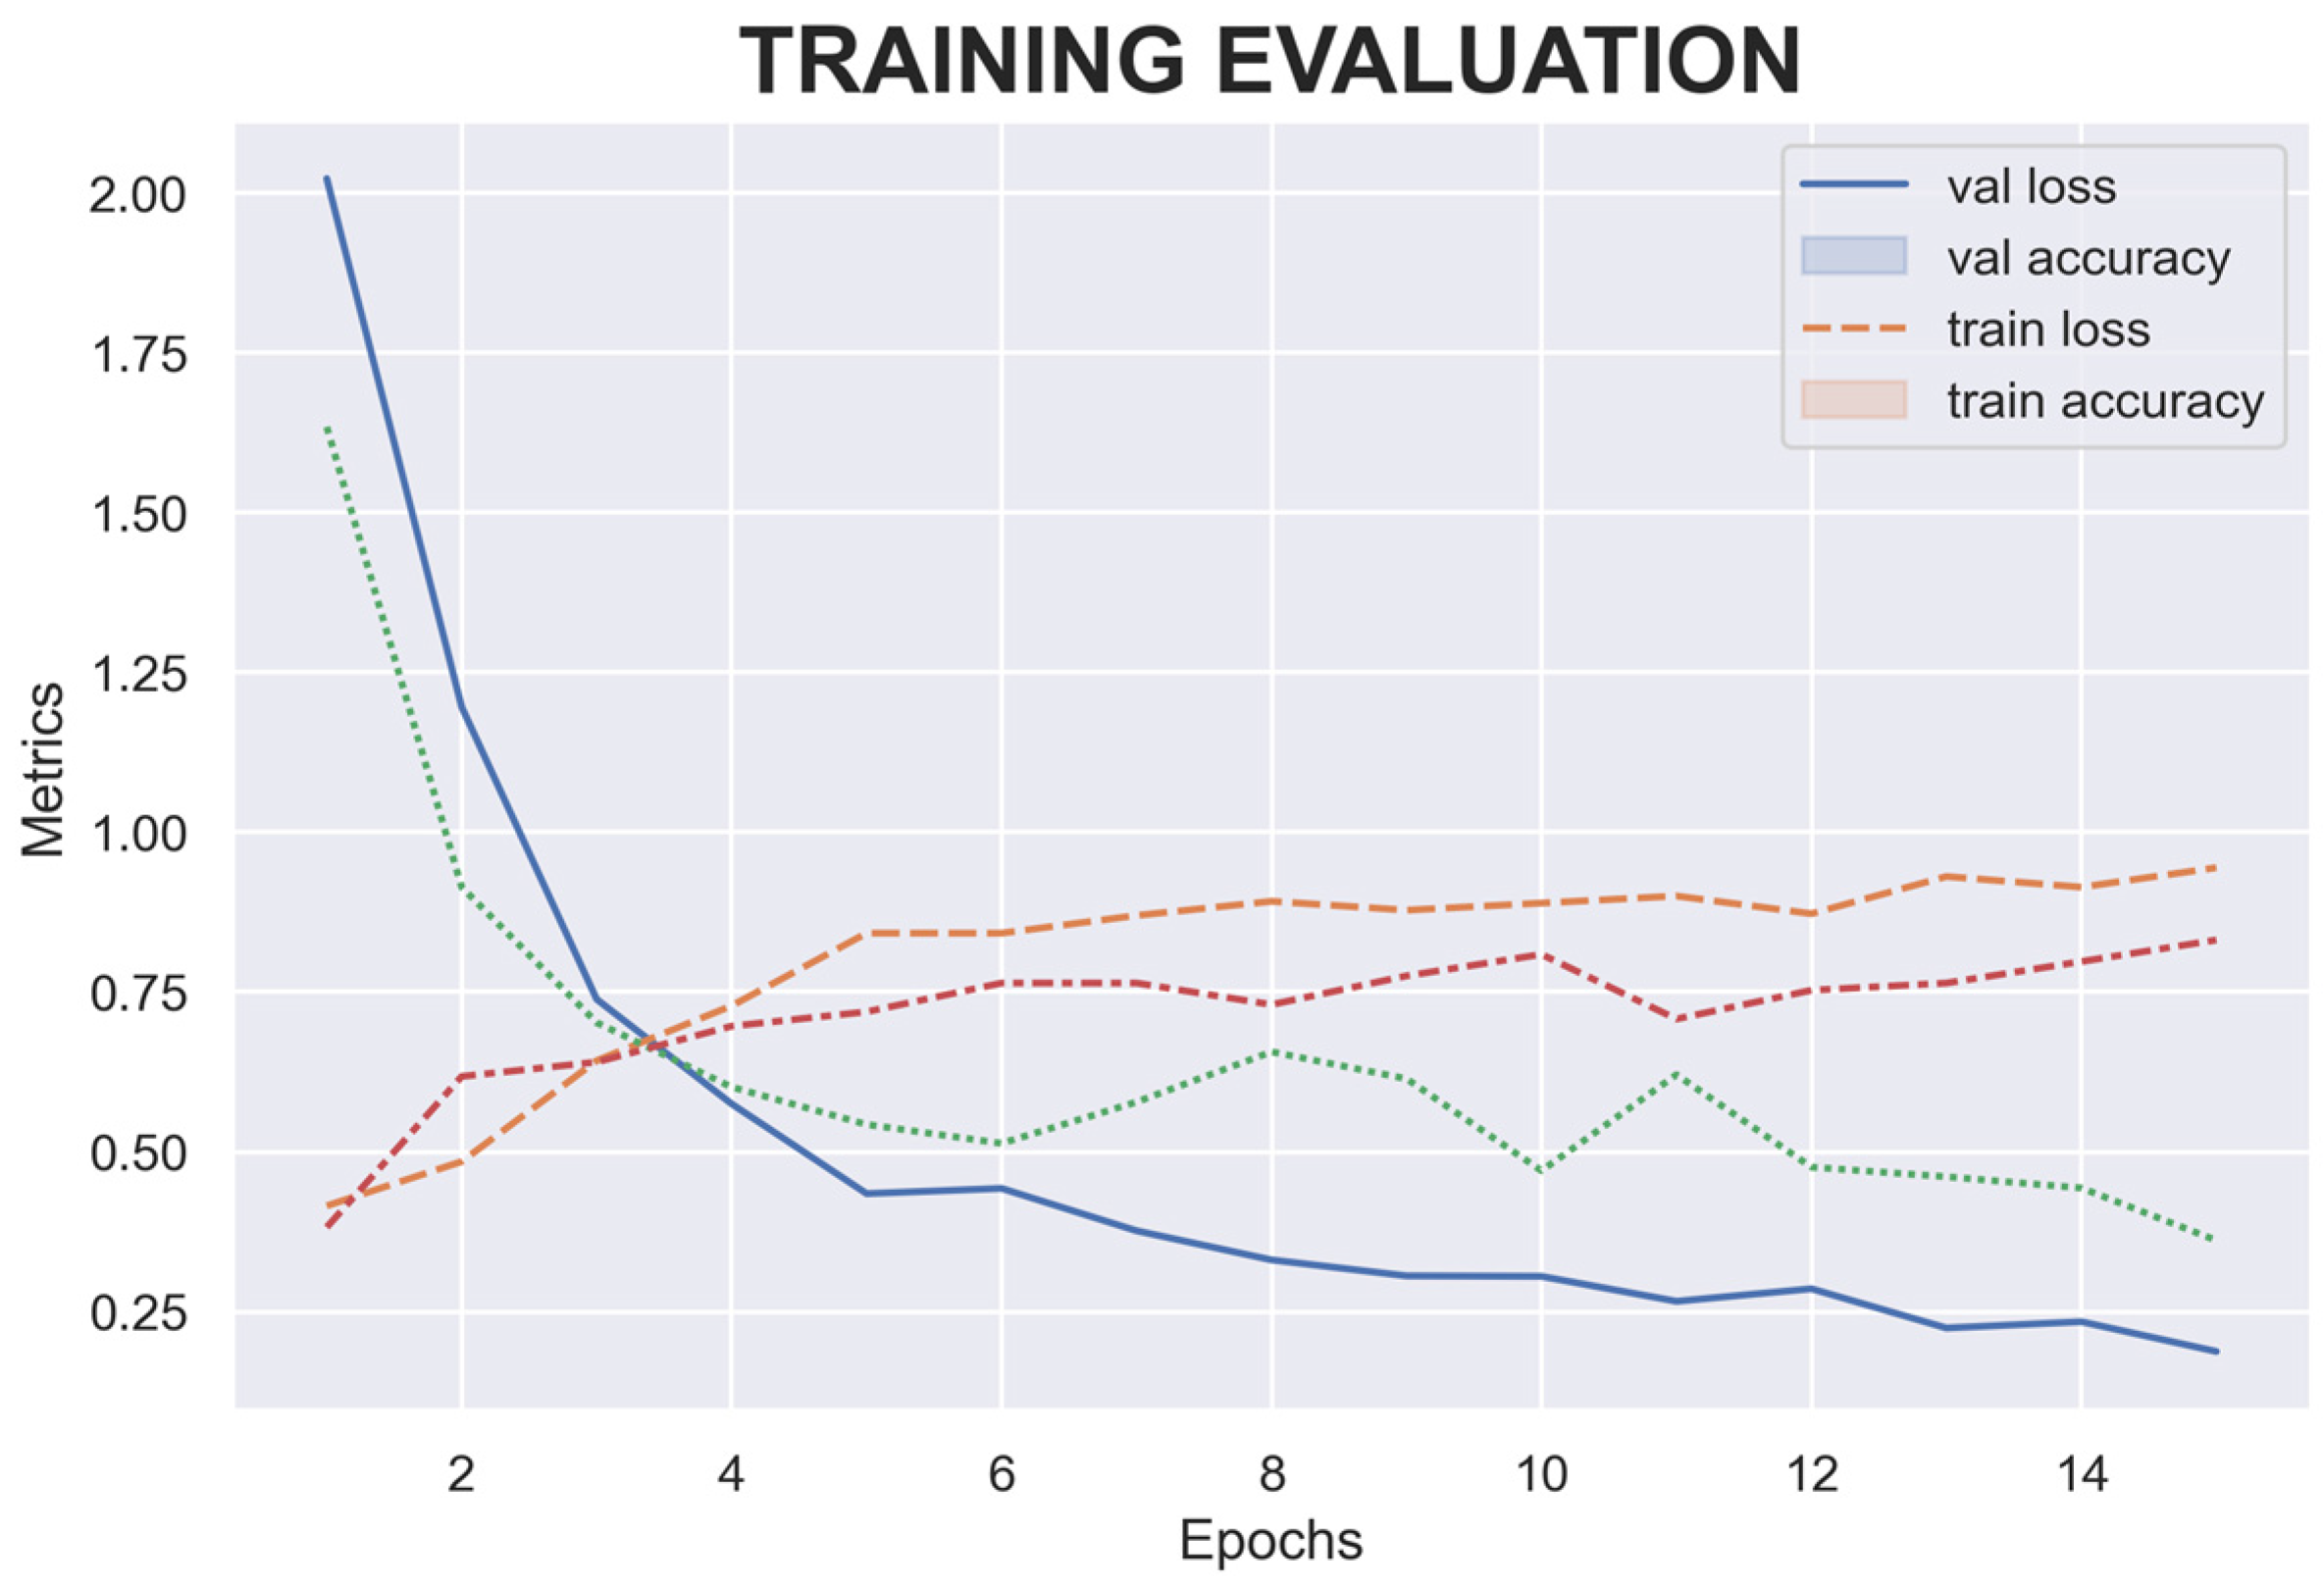
4.1. Training Model Result
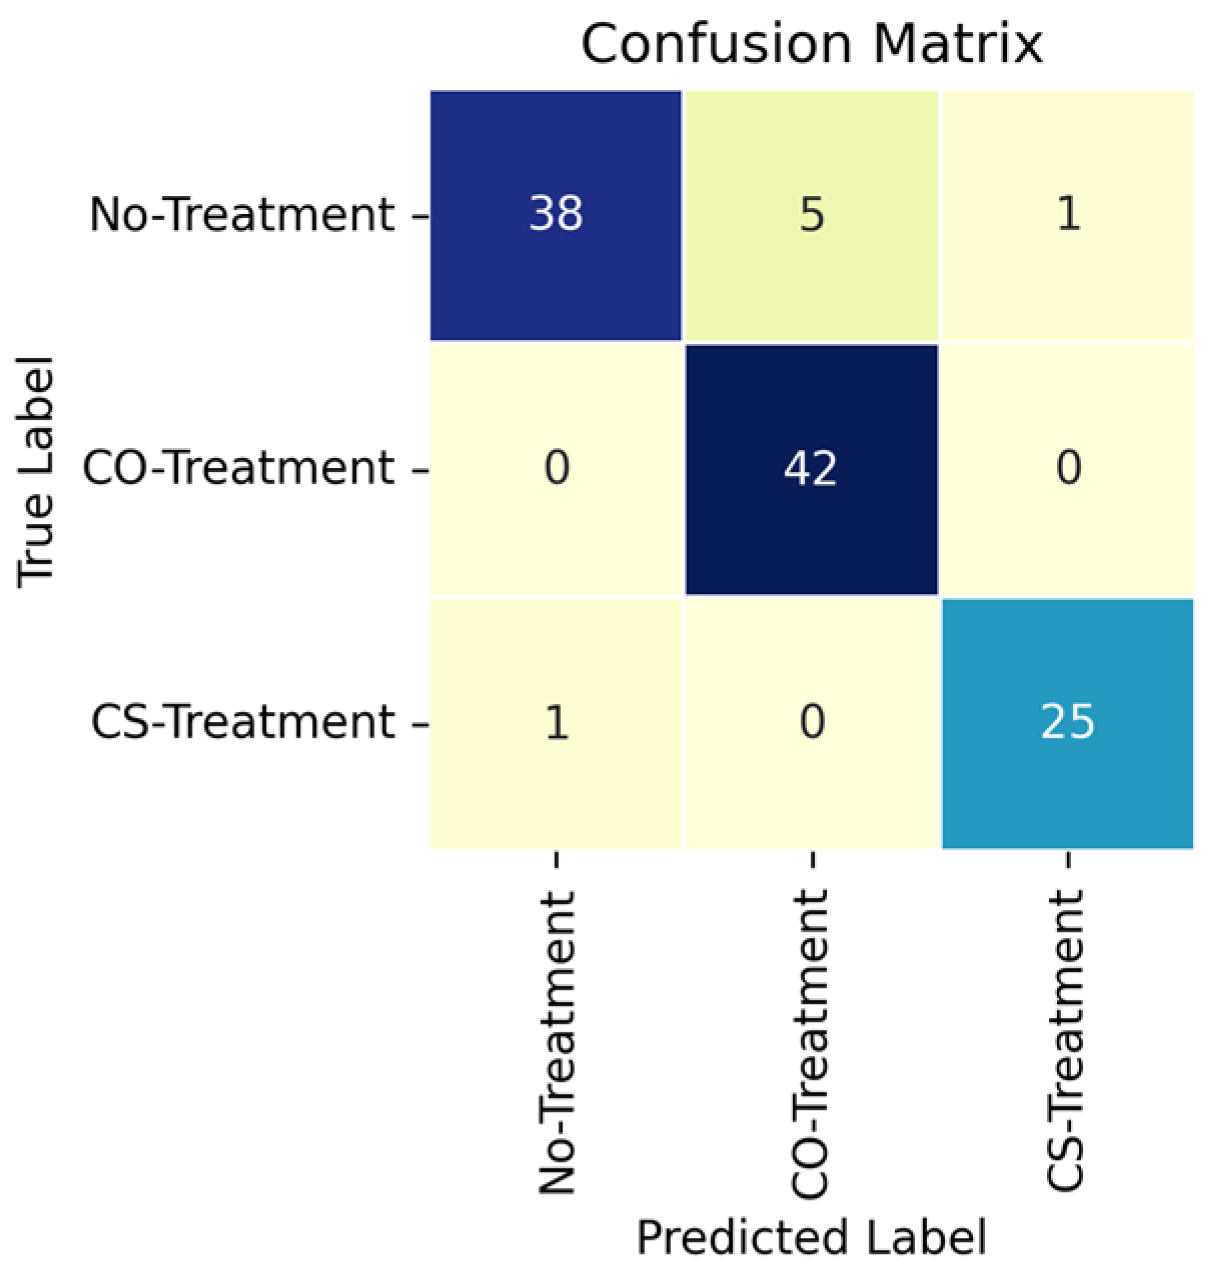
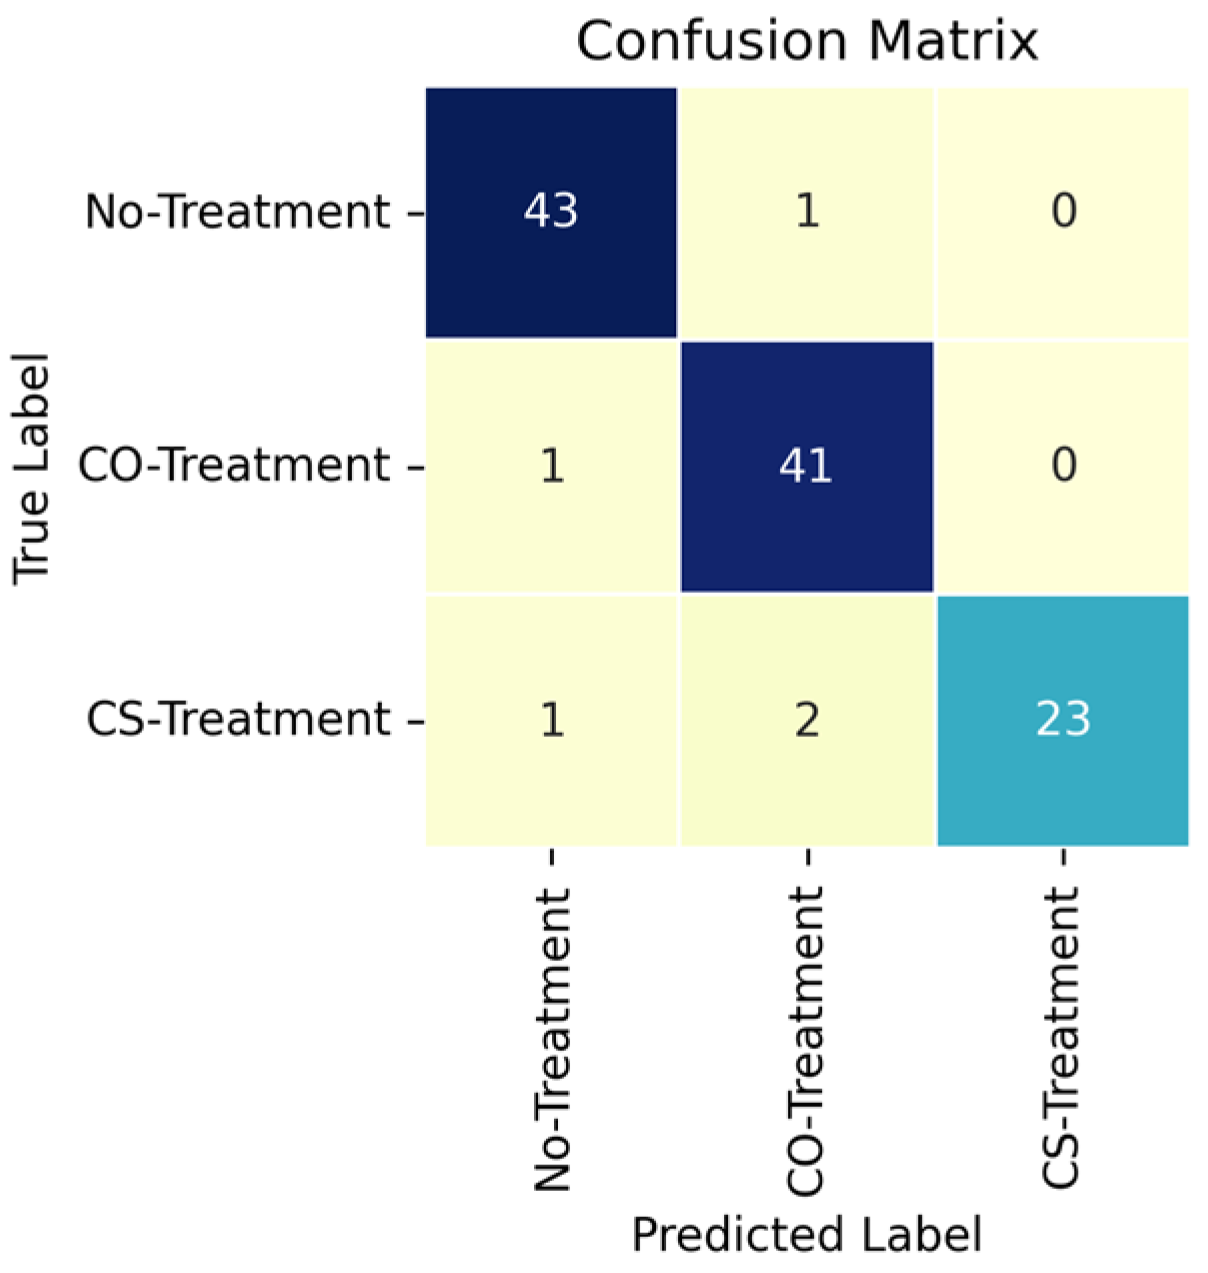
4.2. Model Performance
4.3. Model Implementation Test Results
5. Conclusions
Author Contributions
Funding
Institutional Review Board Statement
Informed Consent Statement
Data Availability Statement
Conflicts of Interest
References
- Gustiano, R.; Kurniawan, K.; Haryono, H. Optimizing the Utilization of Genetic Resources of Indonesian Native Freshwater Fish. Asian J. Conserv. Biol. 2021, 10, 189–196. [Google Scholar] [CrossRef]
- Tauda, I.; Hiariey, J.; Lopulalan, Y.; Bawole, D. Management policy of small-scale tuna fisheries based on island cluster in Maluku. IOP Conf. Ser. Earth Environ. Sci. 2021, 777, 012011. [Google Scholar] [CrossRef]
- Suryaningrum, T.D.; Ikasari, D.; Octavini, H. Evaluation of Fresh Tuna Loin Quality for Sashimi Processed on Boat during Handling and Distribution in Ambon. JPB Kelaut. Dan Perikan. 2017, 12, 163–178. [Google Scholar]
- Kılıçarslan, S.; Çiçekliyurt, M.M.H.; Kılıçarslan, S. Fish Freshness Detection Through Artificial Intelligence Approaches: A Comprehensive Study. Turk. J. Agric. Food Sci. Technol. 2024, 12, 290–295. [Google Scholar] [CrossRef]
- Sengar, N.; Dutta, M.K.; Travieso, C.M. Computer vision based technique for identification and quantification of powdery mildew disease in cherry leaves. Computing 2018, 100, 1189–1201. [Google Scholar] [CrossRef]
- Shi, C.; Qian, J.; Zhu, W.; Liu, H.; Han, S.; Yang, X. Nondestructive determination of freshness indicators for tilapia fillets stored at various temperatures by hyperspectral imaging coupled with RBF neural networks. Food Chem. 2019, 275, 497–503. [Google Scholar] [CrossRef]
- Dowlati, M.; de la Guardia, M.; Mohtasebi, S.S. Application MSV of machine-vision techniques to fish-quality assessment. TrAC Trends Anal. Chem. 2012, 40, 168–179. [Google Scholar] [CrossRef]
- Hong, H.; Yang, X.; You, Z.; Cheng, F. Visual quality detection of aquatic products using machine vision. Aquac. Eng. 2014, 63, 62–71. [Google Scholar] [CrossRef]
- Murakoshi, T.; Masuda, T.; Utsumi, K.; Tsubota, K.; Wada, Y. Glossiness and perishable food quality: Visual freshness judgment of fish eyes based on luminance distribution. PLoS ONE 2013, 8, e58994. [Google Scholar] [CrossRef]
- Issac, A.; Dutta, M.K.; Sarkar, B. Computer vision based method for quality and freshness check for fish from segmented gills. Comput. Electron. Agric. 2017, 139, 10–21. [Google Scholar] [CrossRef]
- Prasetyo, E.; Suciati, N.; Fatichah, C.; Pardede, E. Standardizing the fish freshness class during ice storage using clustering approach. Ecol. Inform. 2024, 80, 102533. [Google Scholar] [CrossRef]
- Lugatiman, K.; Fabiana, C.; Echavia, J.; Adtoon, J.J. Tuna meat freshness classification through computer vision. In Proceedings of the 2019 IEEE 11th International Conference on Humanoid, Nanotechnology, Information Technology, Communication and Control, Environment, and Management (HNICEM), Laoag, Philippines, 29 November–1 December 2019; pp. 1–6. [Google Scholar]
- Moon, E.J.; Kim, Y.; Xu, Y.; Na, Y.; Giaccia, A.J.; Lee, J.H. Evaluation of salmon, tuna, and beef freshness using a portable spectrometer. Sensors 2020, 20, 4299. [Google Scholar] [CrossRef] [PubMed]
- Medeiros, E.C.; Almeida, L.M.; Filho, J.G.D.A.T. Computer Vision and Machine Learning for Tuna and Salmon Meat Classification. Informatics 2021, 8, 70. [Google Scholar] [CrossRef]
- Saputra, S.; Yudhana, A.; Umar, R. Implementation of Naïve Bayes for fish freshness identification based on image processing. J. RESTI (Rekayasa Sist. Dan Teknol. Inf.) 2022, 6, 412–420. [Google Scholar] [CrossRef]
- Wu, T.; Yang, L.; Zhou, J.; Lai, D.C.; Zhong, N. An improved nondestructive measurement method for salmon freshness based on spectral and image information fusion. Comput. Electron. Agric. 2019, 158, 11–19. [Google Scholar] [CrossRef]
- Taheri-Garavand, A.; Nasiri, A.; Banan, A.; Zhang, Y.-D. Smart deep learning-based approach for non-destructive freshness diagnosis of common carp fish. J. Food Eng. 2020, 278, 109930. [Google Scholar] [CrossRef]
- Anas, D.F.; Jaya, I. Design and implementation of fish freshness detection algorithm using deep learning. IOP Conf. Ser. Earth Environ. Sci. 2021, 944, 12007. [Google Scholar] [CrossRef]
- Priya, K.A.; Kaladevi, A.C.; Perumal, R. Detection of Sardine Fish Freshness Using Deep Convolution Neural Network. Ann. Rom. Soc. Cell Biol. 2021, 25, 16063–16070. [Google Scholar]
- Rayan, M.A.; Rahim, A.; Rahman, M.A.; Marjan, M.A.; Ali, U.A.M.E. Fish freshness classification using combined deep learning model. In Proceedings of the 2021 International Conference on Automation, Control and Mechatronics for Industry 4.0 (ACMI), Rajshahi, Bangladesh, 8–9 July 2021; pp. 1–5. [Google Scholar]
- Ayuningtias, I.; Jaya, I.; Iqbal, M. Identification of yellowfin tuna (Thunnus albacares), mackerel tuna (Euthynnus affinis), and skipjack tuna (Katsuwonus pelamis) using deep learning. IOP Conf. Ser. Earth Environ. Sci. 2021, 944, 12009. [Google Scholar] [CrossRef]
- Prasetyo, E.; Suciati, N.; Fatichah, C. Yolov4-tiny and spatial pyramid pooling for detecting head and tail of fish. In Proceedings of the 2021 International Conference on Artificial Intelligence and Computer Science Technology (ICAICST), Yogyakarta, Indonesia, 29–30 June 2021; pp. 157–161. [Google Scholar]
- Prasetyo, E.; Purbaningtyas, R.; Adityo, R.D.; Suciati, N.; Fatichah, C. Combining MobileNetV1 and Depthwise Separable convolution bottleneck with Expansion for classifying the freshness of fish eyes. Inf. Process. Agric. 2022, 9, 485–496. [Google Scholar] [CrossRef]
- Hanifa, M.F.; Ramadhan, A.T.; Widiyono, N.A.; Mubarak, R.S.; Putri, A.A.; Priyanta, S. Fishku Apps: Fishes Freshness Detection Using CNN with MobilenetV2. IJCCS (Indones. J. Comput. Cybern. Syst.) 2023, 17, 67–78. [Google Scholar] [CrossRef]
- Pianta, R.; Downer, J.; Hamre, B. Quality in early education classrooms: Definitions, gaps, and systems. Future Child. 2016, 26, 119–137. [Google Scholar] [CrossRef]
- Goetsch, D.L.; Davis, S.B. Quality Management for Organizational Excellence; Pearson: Upper Saddle River, NJ, USA, 2014. [Google Scholar]
- Kumar, P.; Raju, N.V.S.; Kumar, M.V. Quality of quality definitions-an analysis. Int. J. Sci. Eng. Technol. 2016, 5, 142–148. [Google Scholar]
- SNI 01-4104.3-2006; Stages of Handling and Processing Frozen Tuna Loin for Fresh Tuna Raw Material. Indonesian National Standardization Agency: Jakarta, Indonesia, 2006.
- Olafsdottir, G.; Martinsdóttir, E.; Oehlenschläger, J.; Dalgaard, P.; Jensen, B.; Undeland, I.; Mackie, I.M.; Henehan, G.; Nielsen, J.; Nilsen, H. Methods to evaluate fish freshness in research and industry. Trends Food Sci. Technol. 1997, 8, 258–265. [Google Scholar] [CrossRef]
- Wlodarczak, P. Machine Learning and Its Applications; CRC Press: Boca Raton, FL, USA, 2019. [Google Scholar]
- Schmidhuber, J. Deep learning in neural networks: An overview. Neural Netw. 2015, 61, 85–117. [Google Scholar] [CrossRef]
- Deng, L.; Yu, D. Deep learning: Methods and applications. Found. Trends Signal Process. 2014, 7, 197–387. [Google Scholar] [CrossRef]
- Zhao, Z.-Q.; Zheng, P.; Xu, S.; Wu, X. Object detection with deep learning: A review. IEEE Trans. Neural Netw. Learn. Syst. 2019, 30, 3212–3232. [Google Scholar] [CrossRef]
- Krishna, S.T.; Kalluri, H.K. Deep learning and transfer learning approaches for image classification. Int. J. Recent Technol. Eng. 2019, 7, 427–432. [Google Scholar]
- Sengara, N.; Dutta, M.K.; Sarkar, B. Computer vision based technique for identification of fish quality after pesticide exposure. Int. J. Food Prop. 2017, 20, 1160–1173. [Google Scholar] [CrossRef]
- Fitriyah, H.; Syauqy, D.; Susilo, F.A. Automatic Detection of Yellowfin Tuna (Euthynnus affinis) Freshness Based on Eye Image Using Binary Similarity: Deteksi kesegaran ikan tongkol (Euthynnus affinis) secara otomatis berdasarkan citra mata menggunakan binary similarity. J. Teknol. Inf. Dan Ilmu Komput. (JTIIK) 2020, 7, 879–886. [Google Scholar] [CrossRef]
- Saputra, S.; Yudhana, A.; Umar, R. Fish Freshness Identification Using KNN Algorithm Based on Digital Image: Identifikasi kesegaran ikan menggunakan algoritma KNN berbasis citra digital. Kre-TIF J. Tek. Inform. 2022, 10, 1–9. [Google Scholar]
- Pujiarini, E.H.; Lenti, F.N. Convolutional Neural Network for Identification of Tilapia Fish Freshness Level Based on Eye Color Changes: Convolution neural network untuk identifikasi tingkat kesegaran ikan nila berdasarkan perubahan warna mata. J. Khatulistiwa Inform. 2023, 11, 21–25. [Google Scholar] [CrossRef]
- Kalista, A.; Redjo, A.; Rosidah, U. Application of Image Processing for Tilapia (Oreochromis niloticus) Freshness Level Assessment: Penerapan image processing untuk tingkat kesegaran ikan nila (Oreochromis niloticus). J. Pengolah. Has. Perikan. Indones. 2019, 22, 229–235. [Google Scholar]
- Hernandez, A.A. Classification of Nile Tilapia using Convolutional Neural Network. In Proceedings of the 2019 IEEE 9th International Conference on System Engineering and Technology (ICSET), Shah Alam, Malaysia, 7 October 2019; pp. 126–131. [Google Scholar] [CrossRef]
- Hu, J.; Li, D.; Duan, Q.; Han, Y.; Chen, G.; Si, X. Fish species classification by color, texture and multi-class support vector machine using computer vision. Comput. Electron. Agric. 2012, 88, 133–140. [Google Scholar] [CrossRef]
- Fouad MM, M.; Zawbaa, H.M.; El-Bendary, N.; Hassanien, A.E. Automatic Nile Tilapia fish classification approach using machine learning techniques. In Proceedings of the 2013 13th International Conference on Hybrid Intelligent Systems (HIS), Gammarth, Tunisia, 4–6 December 2013; pp. 173–178. [Google Scholar]
- Jose, J.A.; Kumar, C.S.; Sureshkumar, S. A deep multi-resolution approach using learned complex wavelet transform for tuna classification. J. King Saud Univ.-Comput. Inf. Sci. 2022, 34, 6208–6216. [Google Scholar] [CrossRef]
- Tolentino, L.K.S.; Orillo, J.W.F.; Aguacito, P.D.; Colango, E.J.M.; Malit, J.R.H.; Marcelino, J.T.G.; Nadora, A.C.; Odeza, A.J.D. Fish freshness determination through support vector machine. J. Telecommun. Electron. Comput. Eng. 2017, 9, 139–143. [Google Scholar]
- Navotas, I.C.; Santos, C.N.V.; Balderrama, E.J.M.; Candido, F.E.B.; Villacanas, A.J.E.; Velasco, J.S. Fish identification and freshness classification through image processing using artificial neural network. ARPN J. Eng. Appl. Sci. 2018, 13, 4912–4922. [Google Scholar]
- Diamante, R.A. Identification of fish freshness using image processing and machine learning techniques. Comput. Electron. Agric. 2018, 157, 363–373. [Google Scholar]
- Arora, M.; Mangipudi, P.; Dutta, M.K. A low-cost imaging framework for freshness evaluation from multifocal fish tissues. J. Food Eng. 2022, 314, 110777. [Google Scholar] [CrossRef]
- Yudhana, A.; Umar, R.; Saputra, S. Fish freshness identification using machine learning: Performance comparison of k-NN and Naïve Bayes classifier. J. Comput. Sci. Eng. 2022, 16, 153–164. [Google Scholar] [CrossRef]
- Aziz, M.A.; Fudholi, D.H.; Kurniawardhani, A. Non-destructive Fish Freshness Detection on Mobile Applications Using YOLOv4 and YOLOv4-Tiny: Deteksi kesegaran daging ikan bersifat non-destructive pada aplikasi mobile menggunakan YOLOv4 dan YOLOv4-Tiny. J. Tek. Inform. Dan Sist. Inf. 2023, 10, 126–141. [Google Scholar]
- Zhou, X.; Li, C.; Rahaman, M.; Yao, Y.; Ai, S.; Sun, C.; Wang, Q.; Zhang, Y.; Li, M.; Li, X.; et al. A comprehensive review for breast histopathology image analysis using classical and deep neural networks. IEEE Access 2020, 8, 90931–90956. [Google Scholar] [CrossRef]
- Elsharif, A.A.E.F.; Abu-Naser, S.S. Retina diseases diagnosis using deep learning. Int. J. Acad. Eng. Res. (IJAER) 2022, 6, 11–37. [Google Scholar]
- Nashrullah, F.; Wibowo, S.A.; Budiman, G. The Investigation of Epoch Parameters in ResNet-50 Architecture for Pornographic Classification: Investigasi Parameter Epoch Pada Arsitektur ResNet-50 Untuk Klasifikasi Pornografi. J. Comput. Electron. Telecommun. 2020. [Google Scholar] [CrossRef]
- Liu, F.; Xu, H.; Qi, M.; Liu, D.; Wang, J.; Kong, J. Depth-wise separable convolution attention module for garbage image classification. Sustainability 2022, 14, 3099. [Google Scholar] [CrossRef]
- Shahi, T.B.; Sitaula, C.; Neupane, A.; Guo, W. Fruit classification using attention-based MobileNetV2 for industrial applications. PLoS ONE 2022, 17, e0264586. [Google Scholar] [CrossRef]
- Shahi, T.B.; Xu, C.-Y.; Neupane, A.; Guo, W. Recent Advances in Crop Disease Detection Using UAV and Deep Learning Techniques. Remote Sens. 2023, 15, 2450. [Google Scholar] [CrossRef]
- Sitaula, C.; Shahi, T.B. Monkeypox Virus Detection Using Pre-Trained Deep Learning-Based Approaches. J. Med. Syst. 2022, 46, 78. [Google Scholar] [CrossRef]
- Carrington, A.M.; Manuel, D.G.; Fieguth, P.W.; Ramsay, T.; Osmani, V.; Wernly, B.; Bennett, C.; Hawken, S.; Magwood, O.; Sheikh, Y.; et al. Deep ROC Analysis and AUC as Balanced Average Accuracy, for Improved Classifier Selection, Audit and Explanation. IEEE Trans. Pattern Anal. Mach. Intell. 2021, 45, 329–341. [Google Scholar] [CrossRef]
- Afaq, S.; Rao, S. Significance of Epochs on Training a Neural Network. Int. J. Sci. Technol. Res. 2020, 9, 485–488. [Google Scholar]
- Natsir, A.M.F.M.; Achmad, A. Hazriani Classification of Export-Quality Tuna Using Convolutional Neural Network: Klasifikasi ikan tuna layak ekspor menggunakan convolutional neural network. J. Ilm. Sist. Inf. Dan Tek. Inform. (JISTI) 2023, 6, 172–183. [Google Scholar] [CrossRef]


| Ref. | Research Object | Image | Number of Samples | Method | Metric Evaluation |
|---|---|---|---|---|---|
| [15] | Fish (digital images of fish) | Fish eyes | 210 fisheye digital images divided into training (70%) and testing (30%) data | Naïve Bayes algorithm | Accuracy: 79.37% |
| [22] | Milkfish | Fish eyes | 234 images (78 very fresh fish; days 1 and 2; 80 fresh fish, days 3 and 4; 80 non-fresh fish, days 5 and 6) | Transfer learning convolutional neural network using 4 architectures: Xception, MobileNet VI, ResNet 50, and VGG 16 | Xception: 77% MobileNet VI: 81% ResNet 50: 87% VGG 16: 97% |
| [23] | Chanos chanos, Johnius trachycephalus, Nibea albiflora, Rastrelliger faughni, Upeneus moluccensis, Eleutheronema tetradactylum, Oreochromis mossambicus, Oreochromis niloticus | Fish eyes | Dataset includes 4392 fish eye images from 8 fish species, categorized as highly fresh (day 1 and 2), fresh (day 3 and 4), and not fresh (day 5 and 6) | Convolutional neural network (CNN), MobileNetV1 bottleneck with expansion (MB-BE) | Accuracy: 63.21% ResNet50: 84.86% |
| [24] | Tuna, milkfish, mackerel | Fish eyes | Captured datasets for both fresh and non-fresh fish, resized to 224 × 224 pixels | CNN, transfer learning with MobileNetv2 | Accuracy: Tuna: 97% Milkfish: 94% Mackerel: 93% |
| [18] | Euthynnus affinis, Chanos chanos, Rastrelliger | Fish eyes | 3378 images classified into good quality, medium quality, and poor quality (according to SNI 01-2729-2013) | Deep learning with Tiny Yolov2 architecture | Precision: 72.9%, Recall: 57.5%, Accuracy: 57.5% |
| [35] | Indian Rohu (L. rohita) | Fish eyes | Tested on a database of eight fish samples with three repetitions. Sampling is performed over six different days (6 days × 8 fish × 3 replicates = 144 samples) | Random forest classifier, decision tree | Accuracy: 96.87% Sensitivity: 100% |
| [36] | Skipjack tuna | Fish eyes | 30 images (12 fresh fish images; 18 non-fresh fish images) | Binary similarity | Accuracy: 60% |
| [37] | Selar fish | Fish eyes | 150 images with intervals of 1, 5, and 10 h | k-NN, RGB color features | Accuracy: 93.33% |
| [38] | Nile fish | Fish eyes | 50 | CNN | Accuracy: 93% |
| Ref. | Research Object | Image | Number of Samples | Method | Metric Evaluation |
|---|---|---|---|---|---|
| [39] | Nile fish | Gills | Image capture was performed on the gills of Nile fish with 3 repetitions using a white background. Image capture time was set for 12 h (with a 4 h interval). | Image processing program built in Visual Basic 6.0 | Non-destructive method using image processing to determine the freshness level of fish across several categories. For Nile fish, very fresh (high quality) had a red color percentage of 82.18%, fresh (good quality) 67.10%, limit of acceptability 38.52%, and spoiled 9.92%. |
| Ref. | Research Object | Image | Number of Samples | Method | Metric Evaluation |
|---|---|---|---|---|---|
| [5] | Rohu labeo or L. rohita (Rohu) | Skin | 30 fish sample images | Image processing techniques | Accuracy = 96.66% |
| [21] | Nile tilapia (Ikan nila) | Skin | 4000 data set (2000 fresh images; 2000 non-fresh images); for fresh fish: training data: 1500 images and test data: 50 images. For non-fresh fish: training data: 1500 images and test data: 50 images | Convolutional neural network (VGG-16 architecture), bi-directional neural network (LSTM), architecture of the CNN Bi-LSTM neural network | Accuracy: 98% Precision: 96% Recall: 100% Specificity: 96.15% F1 score: 97.96% Classification error: 2% |
| Ref. | Research Object | Image | Number of Samples | Method | Metric Evaluation |
|---|---|---|---|---|---|
| [12] | Yellowfin tuna | Meat | 60 samples; 1–2, 3–4, and 5–8 h | Computer vision, RGB extraction, KNN, and Waikato environment for knowledge analysis (WEKA) | Accuracy: 86.67% |
| [13] | Tuna, salmon, beef | Meat | Atlantic salmon: 15 samples; Pacific salmon: 15 samples; tuna: 17 samples; beef: 16 samples | Machine learning, portable spectrometer | Accuracy approximately 85% for salmon, 88% for tuna, and 92% for beef |
| [14] | Tuna and salmon | Meat | Tuna: 4 levels; salmon: 3 levels | Computer vision, machine learning | Accuracy: 100% |
| [16] | Salmon | Meat | 2336 salmon samples; 1869 samples were randomly selected as the training set, and 467 samples were used as the test set. | Convolutional neural network modeling | Accuracy: 74.2% |
| Ref. | Research Object | Image | Number of Samples | Method | Metric Evaluation |
|---|---|---|---|---|---|
| [21] | Thunnus albacares, Euthynnus affinis, Katsuwonus pelamis | Whole fish | 550 images (188 Thunnus albacares, 202 Katsuwonus pelamis, and 160 Euthynnus affinis) | Deep learning with YOLOv5 architecture | Values for training loss: 0.000253 Accuracy: 95% Precision: 98.1% Recall: 93.9% F1 score: 96% |
| [40] | Nile tilapia | Whole fish | Total dataset 2000 images; data training 900 images and data testing 100 images | Convolutional neural network with inception V3 architecture | Accuracy: 50% for 0 iterations; 73.5% for 10 iterations; 98% for more than 100 iterations; and 100% for over 200 iterations |
| [41] | Images of the following six species of freshwater fish common to China were obtained: grass carp (Ctenopharyngodon idellus), silver carp (Hypophthalmichthys molitrix), bighead carp (Aristichthys nobilis), snakehead murrel (Channa striata), Wuchang bream (Megalobrama amblycephala), and red-bellied pacu (Colossoma brachypomum) | Images of the fish | Images of the fish (1024 × 768 size) were captured with a Nokia N8-00 smartphone camera | Multi-class support vector machine using computer vision | Average accuracy: 97.77% |
| [42] | Tilapia | Whole fish | 96 images of tilapia fish and 55 images of non-tilapia fish | Feature extraction algorithms, namely, scale invariant feature transform (SIFT) and speeded up robust features (SURF), and machine learning classifiers, namely, artificial neural network (ANN), support vector machines (SVMs), and k-nearest neighbor (k-NN) | Accuracy: 94.4% |
| [19] | Sardine fish | Whole fish | 2127 images (1049 fresh sardine fish and 1078 non-fresh sardine fish) | Deep convolutional neural network | Sensitivity: 96.2% Specificity: 92.3% Positive predictive value: 92.6% Negative predictive value: 96% Accuracy: 99.5% F1 score: 94% |
| [43] | Bigeye tuna, skipjack tuna, yellowfin tuna | Whole fish | The dataset used in the study has a total of 657 images, consisting of 220 images of bigeye tuna, 215 images of skipjack tuna, and 222 images of yellowfin tuna | k-Nearest neighbor (kNN), support vector machine (SVM), kernel extreme learning machine (KELM), linear discriminant analysis (LDA), random forest classifiers, probabilistic neural network (PNN), and artificial neural network (ANN) | Accuracy: 94.58% Precision: 94.72% Recall: 89.64% F1score: 92.04% MCE: 5.42% |
| Ref. | Research Object | Image | Number of Samples | Method | Metric Evaluation |
|---|---|---|---|---|---|
| [44] | Milkfish, round scad, short mackerel scad | Fish eyes, fish gills | The database for the network includes 720 images for milkfish, 480 images for round scad, and 480 images for short mackerel scad | Support vector machine classifier | Accuracy: 98% |
| [45] | Milkfish, round scad, tilapia | Fish eyes, gills | 30 fish samples per species that were used to obtain a total of 800 images each for the eyes and gills | Artificial neural network, feed-forward neural network, digital image processing | Accuracy: milkfish 90%, round scad 93.33%, tilapia 100% |
| [46] | Milkfish (Chanos chanos) | Eye, gills, and body images | 72 cropped images used as a validation dataset for the body; 39 of those are validated as fresh milkfish’ gills | Confusion matrix, Coiflet wavelet transform, region of interest, support vector machine | Accuracy: 85.407% in region of interest detection and 98% in confusion matrix for classification |
| [47] | Labeo rohita (Rohu) fish | Gills, eyes, and skin | 288 sample images | Design of a new mathematical model for computation of a novel Q-score, computation of slopes and SC of all focal tissues, computation of weights of focal tissues and features, normalization of weighted parameters, computation of novel Q-score | Accuracy: 98.07% |
| [48] | Selarides leptolepis | Eyes, body | 160 images; the total image set is divided into 80 images in the fresh class and 80 images in the rotten class | k-NN and naïve Bayes classifier | Average accuracy: 97% Precision: 97% Recall: 97% Specificity: 97% AUC: 97% |
| [49] | Euthynnus affinis (Tongkol Deho), Priacanthus tayenus (Manglah), Rastrelliger brachysoma (Solok), Scomber australasicus (Mackerel), Caranx elanophygus (Kuwe Lilin), Nemipterus virgatus (Teribang), Restrelliger kanagurta (Banyar), and Atule mate (Kolong) | Eye and skin | N/A | Deep learning, Yolov4, Yolov4-tiny, mobile application | Accuracy: Yolov4: 99.17% Yolov4-tiny: 97.25% |
| Distance to object | 10 cm |
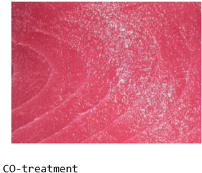
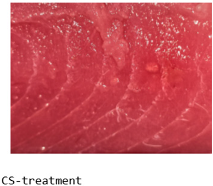
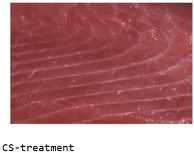
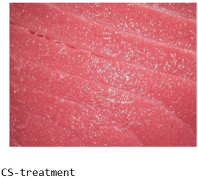
| Grade/treatment | Fresh tuna loin, tuna loin CO, and tuna loin CS |
| Image quality | JPEG normal (8.6 MB) [2.3] K (good, basic normal) |
| Lens | DX VR (AF-P NIKKOR 18–55 mm, 1:3.5–5.6 G) |
| Touch shutter | OFF |
| Image size | Large (L) |
| Release mode | Continuous H |
| Focus mode | Single-servo AF (AF-S) |
| Flash mode | Auto |
| Resolution | 6000 × 4000 |
| ISO image | Automatic ISO-A 6400 |
| Time setting | 2–20 s |
| Parameters | Value |
|---|---|
| Image size | 224 × 224 |
| Color mode | RGB |
| Class mode | Categorical |
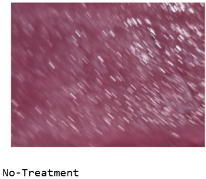
| Classes | {“No-Treatment”: 0, “CO-Treatment”: 1, “CS-Treatment”: 2} |
| Batch size | 64 |
| Epoch | 15 |
| Rotation range | 90 |
| Width shift range | 0.05 |
| Height shift range | 0.05 |
| Shear range | 0.05 |
| Horizontal flip | True |
| Vertical flip | True |
| Optimizer | Adam |
| Brightness range | [0.75, 1.25] |
| Rescale | 1/255 |
| Validation split | 0.2 |
| Loss | Categorical cross entropy |
| Data Set | Method | Accuracy | Precision | Recall | F1 Score | ROC | AUC | Kappa Score | |
|---|---|---|---|---|---|---|---|---|---|
| TPR | FPR | ||||||||
| No-Treatment | ResNet | 0.9375 | 0.9744 | 0.8636 | 0.9157 | 0.974 | 0.065 | 0.987 | 0.904 |
| DenseNet | 0.9554 | 0.9556 | 0.9773 | 0.9663 | 0.977 | 0.024 | 0.966 | 0.932 | |
| Inception | 0.9107 | 0.8889 | 0.9091 | 0.8989 | 0.952 | 0.029 | 0.920 | 0.804 | |
| CO-Treatment | ResNet | 0.9375 | 0.8936 | 1.0000 | 0.9438 | 1.000 | 0.000 | 0.987 | 0.904 |
| DenseNet | 0.9554 | 0.9318 | 0.9762 | 0.9535 | 0.953 | 0.022 | 0.966 | 0.932 | |
| Inception | 0.9107 | 0.9318 | 0.9762 | 0.9535 | 0.976 | 0.015 | 0.920 | 0.804 | |
| CS-Treatment | ResNet | 0.9375 | 0.9615 | 0.9615 | 0.9615 | 1.000 | 0.013 | 0.987 | 0.904 |
| DenseNet | 0.9554 | 1.0000 | 0.8846 | 0.9388 | 0.958 | 0.046 | 0.966 | 0.932 | |
| Inception | 0.9107 | 0.9130 | 0.8077 | 0.8571 | 0.840 | 0.054 | 0.920 | 0.804 | |
| Ref. | Method | Accuracy (%) |
|---|---|---|
| [16] | Convolutional neural network modeling | 74.2 |
| [14] | Computer vision, machine learning | 100 |
| [19] | Deep convolutional neural network | 99.5 |
| [38] | CNN | 93 |
| [40] | Inception V3 | 100 |
| [20] | Convolutional neural network (VGG-16) | 98 |
| [22] | Xception, MobileNet VI, ResNet 50, VGG 16 | Xception: 77 MobileNet VI: 81 ResNet 50: 87 VGG 16: 97 |
| [59] | VGG16 | 81.9 |
| [23] | MobileNet, ResNet50 | MobileNetV1: 63.21 Resnet50: 84.86 |
| [24] | CNN, transfer learning with MobileNetv2 | Tuna: 97 Milkfish: 94 Mackerel: 93 |
| [18] | Tiny Yolov2 | 57.5 |
| [21] | Yolov5 | 95 |
| [49] | Yolov4, Yolov4-tiny, mobile application | Yolov4: 99.17 Yolov4-tiny: 97.25 |
| Result | Actual Class | Predicted Class | Description |
|---|---|---|---|
 | No-Treatment | No-Treatment | Succeeded |
 | CO-Treatment | CO-Treatment | Succeeded |
 | CS-Treatment | CS-Treatment | Succeeded |
| Result | Actual Class | Predicted Class | Description |
|---|---|---|---|
 | No-Treatment | CS-Treatment | Failed |
 | CO-Treatment | CS-Treatment | Failed |
 | CS-Treatment | No-Treatment | Failed |
Disclaimer/Publisher’s Note: The statements, opinions and data contained in all publications are solely those of the individual author(s) and contributor(s) and not of MDPI and/or the editor(s). MDPI and/or the editor(s) disclaim responsibility for any injury to people or property resulting from any ideas, methods, instructions or products referred to in the content. |
© 2025 by the authors. Licensee MDPI, Basel, Switzerland. This article is an open access article distributed under the terms and conditions of the Creative Commons Attribution (CC BY) license (https://creativecommons.org/licenses/by/4.0/).
Share and Cite
Tupan, J.M.; Rieuwpassa, F.; Setha, B.; Latuny, W.; Goesniady, S. A Deep Learning Approach to Automated Treatment Classification in Tuna Processing: Enhancing Quality Control in Indonesian Fisheries. Fishes 2025, 10, 75. https://doi.org/10.3390/fishes10020075
Tupan JM, Rieuwpassa F, Setha B, Latuny W, Goesniady S. A Deep Learning Approach to Automated Treatment Classification in Tuna Processing: Enhancing Quality Control in Indonesian Fisheries. Fishes. 2025; 10(2):75. https://doi.org/10.3390/fishes10020075
Chicago/Turabian StyleTupan, Johan Marcus, Fredrik Rieuwpassa, Beni Setha, Wilma Latuny, and Samuel Goesniady. 2025. "A Deep Learning Approach to Automated Treatment Classification in Tuna Processing: Enhancing Quality Control in Indonesian Fisheries" Fishes 10, no. 2: 75. https://doi.org/10.3390/fishes10020075
APA StyleTupan, J. M., Rieuwpassa, F., Setha, B., Latuny, W., & Goesniady, S. (2025). A Deep Learning Approach to Automated Treatment Classification in Tuna Processing: Enhancing Quality Control in Indonesian Fisheries. Fishes, 10(2), 75. https://doi.org/10.3390/fishes10020075