Article

Genetic Diversity and Population Structure of Commercial Eel Conger myriaster (Anguilliformes: Congridae) Along the Coasts of China Based on Complete Mitochondrial Cyt b Sequences

Fishery College, Zhejiang Ocean University, Zhoushan 316022, China
*
Author to whom correspondence should be addressed.
Fishes 2025, 10(2), 41; https://doi.org/10.3390/fishes10020041
Submission received: 23 December 2024 / Revised: 20 January 2025 / Accepted: 21 January 2025 / Published: 23 January 2025
(This article belongs to the Special Issue Molecular Genetics and Genomics of Marine Fishes)

Abstract

:
To better understand the population genetic structure and molecular biological background of Conger myriaster, an economically important marine fish, a total of 217 complete mitochondrial cytochrome b (Cyt b) gene sequences with a length of 1142 bp were obtained to assess the genetic diversity, population differentiation, and demographic history of seven populations along the coastal waters of China. The analysis of population genetic diversity showed a high level of haplotype diversity and a low level of nucleotide diversity. The analysis of molecular variance (AMOVA) and the genetic differentiation coefficient (FST) showed that most of the variation came from within populations, and the geographic distribution of haplotypes revealed non-significant genetic differentiation among populations. Tracing the population dynamic history, the results of the neutrality test and mismatch analysis suggested that the populations of C. myriaster in coastal China seas had experienced demographic expansion, and the expansion time can be traced back to the middle Pleistocene period. These results provide supplemental information for the sustainable utilization of fishery resources of this species.
Key Contribution: By using the complete mtDNA Cyt b gene as a molecular marker, our study showed a pattern of high haplotype and low nucleotide diversity in seven C. myriaster populations along the coasts of China. Ocean currents facilitated gene exchange, which resulted in no significant genetic differentiation among populations. The genetic data indicated that the populations had experienced demographic expansion since the middle Pleistocene. The conclusions of this study could be valuable for species conservation and fishery management.

1. Introduction

Conger myriaster (Brevoort, 1856) [1], commonly known as whitespotted conger, is a warm-water demersal fish belonging to the order Anguilliformes and family Congridae and is widely distributed in the northwest Pacific Ocean, from the southern East China Sea to the coasts of Japan and the Korean peninsula [2]. As a bottom-dwelling eel, it mainly inhabits muddy and gravelly bottoms in coastal waters with depths of 5–50 m, and it possesses a critical position in the nearshore food web and marine ecosystem [3]. The breeding areas and migration patterns of C. myriaster have been evidenced by age-structured otolith chemistry profiles, which confirmed that C. myriaster in coastal China seas came from the same spawning area located in the western North Pacific Ocean [4]. The larvae and juveniles are passively transported from their spawning area to the East China Sea by the North Equatorial Current and the Kuroshio Current before being separated by the Yellow Sea Warm Current to different habitats during subsequent life stages. Whitespotted conger is an economically valuable marine fish with tender meat, delicious flavor, and rich nutrition, and it occupies a crucial proportion of the import and export trade of fishery resources in Asian countries. While eel farming has developed rapidly, the aquaculture of C. myriaster still remains at an early stage. Despite China having become one of the world’s most industrialized aquaculture countries, the huge demands for natural germplasm still rely on marine fishing [5,6,7,8].
Genetic diversity, defined as the range and sum of genetic variation within or among populations, is a fundamental constituent of biodiversity [9,10,11]. The level of genetic diversity and connectivity of populations can directly or indirectly reflect the environmental adaptability and evolutionary potential of species [12]. Therefore, it is important to examine the genetic diversity of wild populations to pinpoint high-quality seedstock and broodstock and to conserve critical genetic resources of C. myriaster. Within this context, gene flow dominates the population’s genetic structure, as well as long-term evolution, by changing the spatial distribution of genetic variation [13,14,15]. Environmental changes, together with human activities, induce substantial resource fluctuations and cause profound impacts on the population structure and spatio-temporal distribution of marine species. Full knowledge and understanding of population structure is the prerequisite and foundation for conservation management of native C. myriaster populations. Previous studies of C. myriaster focused on reproductive biology [16,17,18,19], feeding ecology [16,20,21], population morphometry [22,23,24], immunohistochemistry [17,18,20,25], as well as aquaculture technology [5,6,23]. In 2001, Ishikawa et al. [26] used the amplified fragment length polymorphism (AFLP) approach to examine mitochondrial and nuclear DNA diversities of C. myriaster in Japan, which opened the door to the population genetic studies of this species. In recent years, there have been some population genetics studies on C. myriaster, but samples were collected from only a part of China’s coastal areas. In addition, the use of partial mitochondrial DNA (mtDNA) control region (CR) and cytochrome oxidase subunit I (COI) gene fragments may fail to meet the intended application because of incomplete information [27,28].
Although C. myriaster is declared a “Least Concern (LC)” species in the International Union for Conservation of Nature (IUCN) Red List at present, it is still under over-fishing pressure in some Asian countries [29]. The use of genetic markers in recent studies has proven to be particularly effective in depicting the genetic characteristics and phylogeographic patterns of natural populations [30,31]. The mtDNA cytochrome b (Cyt b) gene is a popular molecular marker that has been widely applied in population genetics and phylogenetic studies due to its moderate evolutionary rate [32]. In the present study, the complete mtDNA Cyt b gene sequence was employed to investigate the genetic variation, genetic structure, and historical population dynamics of C. myriaster along the coastal waters of China. Our study aims to reveal the genetic diversification of C. myriaster and provide a basis for the conservation and sustainable utilization of fishery resources of this commercially important species.

2. Materials and Methods

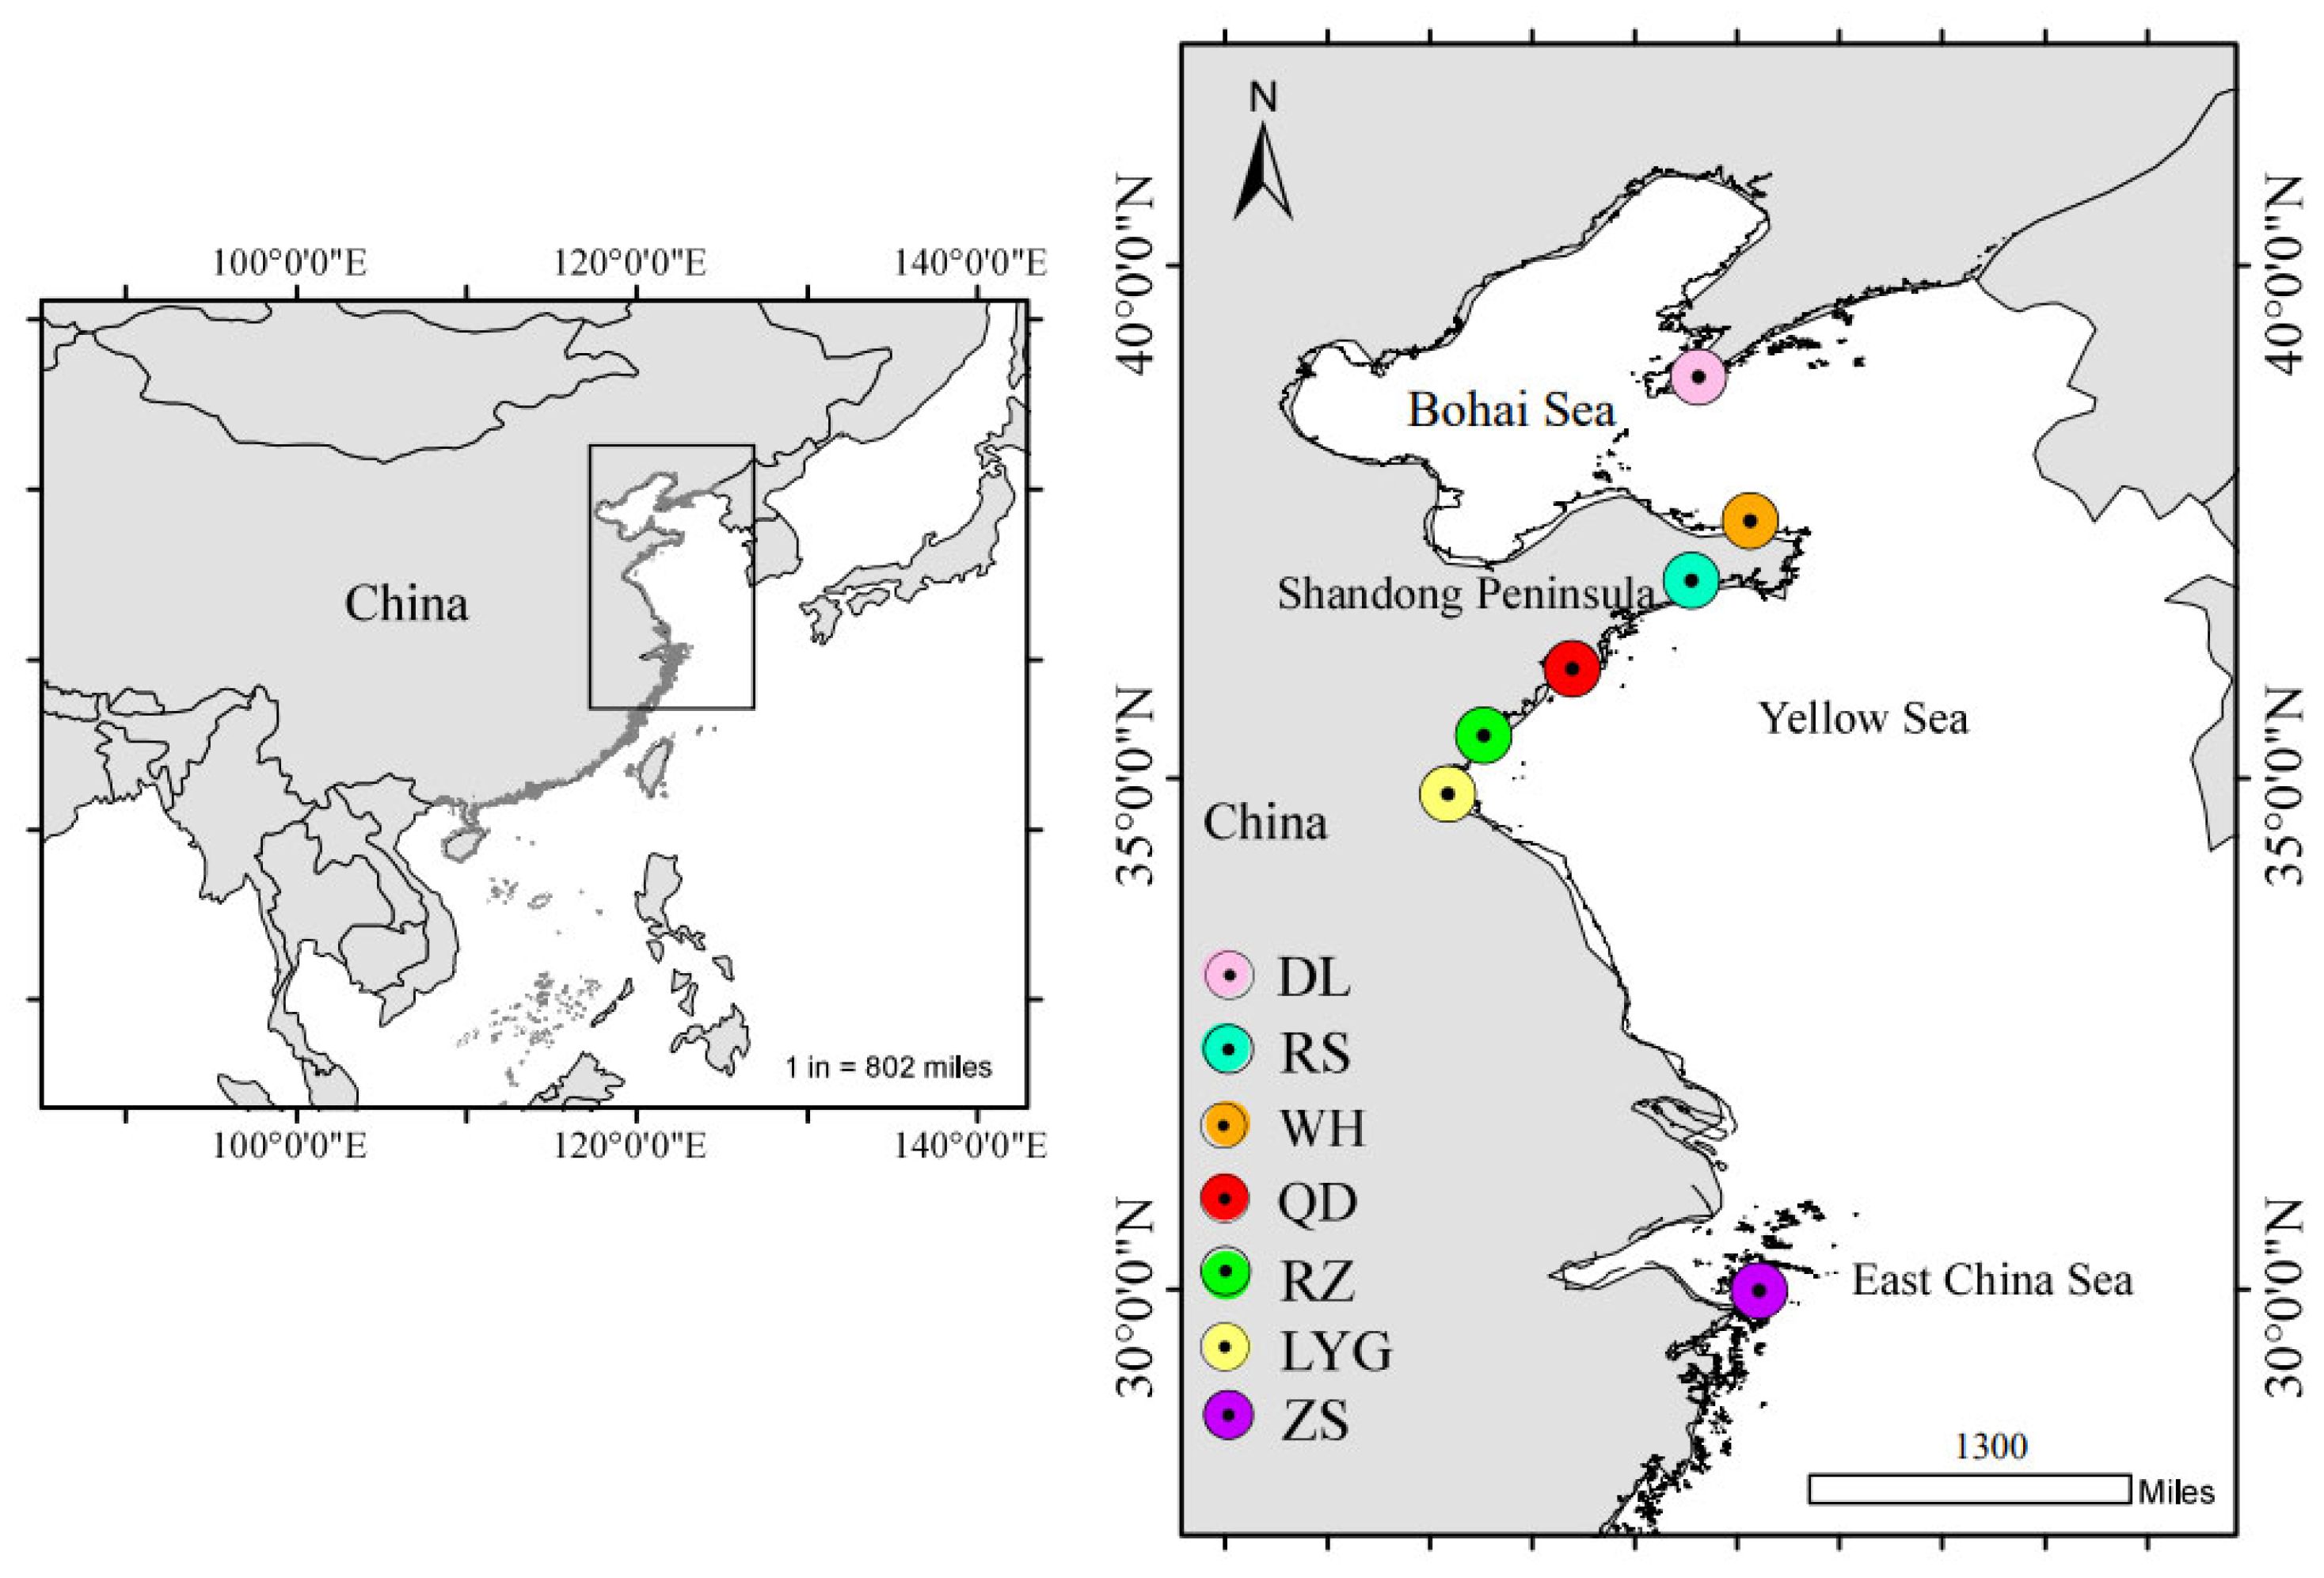
2.1. Sampling, DNA Extraction and PCR Amplification

A total of 217 adult C. myriaster individuals were collected by commercial trawling from seven geographical sites along coastal China, including Dalian (DL), Weihai (WH), Rushan (RS), Qingdao (QD), Rizhao (RZ), Lianyungang (LYG) and Zhoushan (ZS) during August 2022 to May 2023 (Table 1; Figure 1). Iced fresh fish were quickly transported to the Fishery Ecology and Biodiversity Laboratory (FEBL) of Zhejiang Ocean University. Fresh muscle of each sample was excised at the base of the dorsal fin and stored in anhydrous ethanol at −20 °C for subsequent genomic DNA isolation.
The traditional chloroform–Tris saturated phenol method was used to extract genomic DNA [33]. After determining the concentration of genomic DNA using a NanoDrop ND-1000 ultramicro spectrophotometer (NanoDrop, Wilmington, DE, USA) and assessing DNA integrity by 1% agarose gel electrophoresis, the full-length Cyt b gene was amplified using a set of primers: L13940 (5′-TTC TTT CCK ACT ATT ATW CAC CG-3′) and H15915-Thr (5′-ACC TCC GAT CTY CGG ATT ACA AGA C-3′) [34]. The PCR amplification system was comprised of a 25 µL reaction volume: 0.25 µL of Taq DNA polymerase (TransGen Biotech, Beijing, China) (5 U/µL), 2.5 µL of 10× PCR buffer (Mg2+ Plus), 2 µL of dNTPs (2.5 mM each), 1 µL of each primer (10 µM), 1 µL of template DNA (50 ng/µL) and 17.25 µL of ddH2O. The amplification reactions were performed in a Bio-Rad C1000 Touch thermal cycler (BioRad, Hercules, CA, USA) under the following conditions: 5 min initial denaturation at 94 °C, and 35 cycles of 45 s at 94 °C for denaturation, 45 s at 53 °C for annealing, and 45 s at 72 °C for extension, and a final extension at 72 °C for 10 min. All PCR products were electrophoresed with 1% agarose gel and photographed using the Tanon 2500 automatic gel imaging analyzer (Tanon, Shanghai, China). Qualified samples with clear electrophoretic bands were bi-directional sequenced by Sangon Biotech (Shanghai, China) Co., Ltd.

2.2. Data Analysis

The determined sequences were confirmed as the target sequences through BLAST alignment in NCBI and then edited manually with the SeqMan module of the DNAStar Lasergene 7.1.0 software package [35]. Arlequin 3.11 [36] and DnaSP 5.0 [37] were used to calculate genetic parameters, including nucleotide composition, number of polymorphic sites (S), haplotype diversity (Hd), nucleotide diversity (π) and average number of nucleotide differences (k), respectively [38,39]. The phylogenetic tree was constructed by the neighbor-joining (NJ) method with statistical robustness of the nodes determined by 1000 bootstrap replicates, and the genetic distance between populations was calculated using the Kimura 2-parameter (K2P) model in MEGA X [40,41,42,43]. To depict the phylogenetic and geographical relationships of the haplotypic sequences, a haplotype network was created with the median-joining method using PopART 1.7 [44,45]. Analysis of molecular variance (AMOVA) was performed to quantify the genetic variation and distribution at different hierarchical levels with 10,000 permutations, and the population genetic differentiation coefficient (FST) and its statistical significance were determined with Arlequin 3.5 [36,46].
Population demographic history was evaluated via the neutrality test (Tajima’s D test and Fu’s Fs test) and mismatch distribution analysis by Arlequin 3.5 [36,47,48]. The goodness-of-fit test was implemented by using the sum of squared deviation (SSD) and Harpending’s raggedness index (RI) to assess whether the populations underwent sudden demographic expansion [49]. The real time since population expansion was calculated through the formula t = τ/(2μk), where τ is the population expansion time parameter, μ is the mutation rate per nucleotide, and k is the sequence length. The expansion time (T) equals t multiplied by the generation time in years, 3.5 years [8,36,50].
The change in effective population size (Ne) through time was assessed by Bayesian Skyline Plot (BSP) operating in BEAST 2.7 [51]. A chain length of 10 million Markov chain Monte Carlo (MCMC) generations was performed, and the final plot was produced in Tracer v. 1.7.1 [52]

3. Results

3.1. Sequence Information

A total of 217 Cyt b sequences with the full length of 1142 bp were obtained after alignment. The average nucleotide contents of A, T, C, and G were 29.37%, 33.06%, 23.80%, and 13.78%, respectively, with the mean content of A + T (62.43%) higher than that of C + G (37.58%). There were 105 polymorphic sites, including 65 singleton variable sites and 40 parsimony informative sites observed among all individuals, with no insertion or deletion mutations.

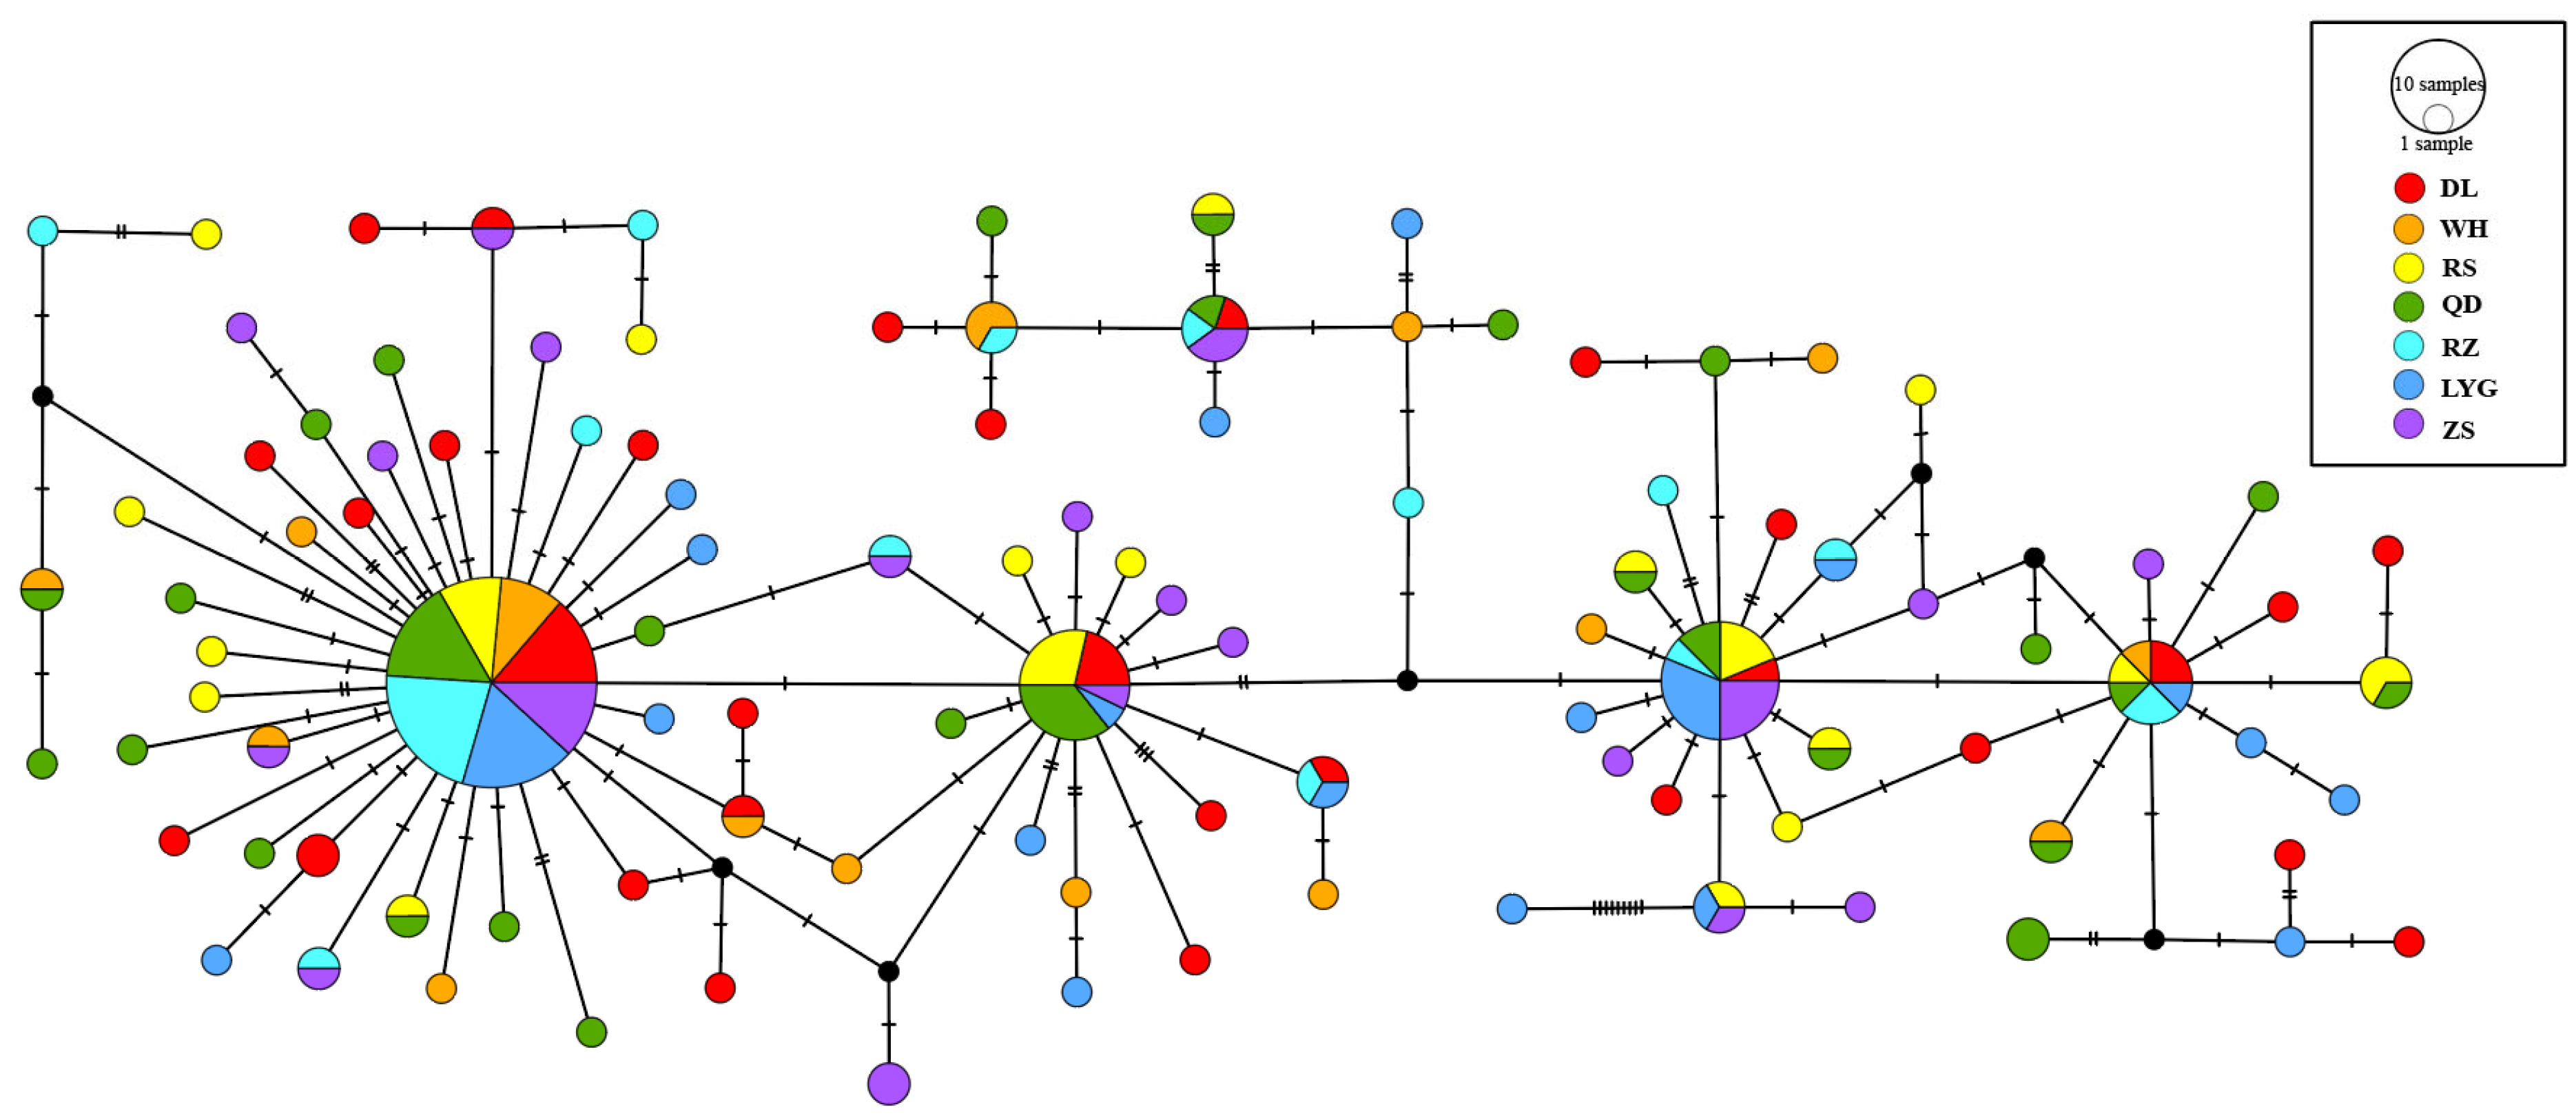
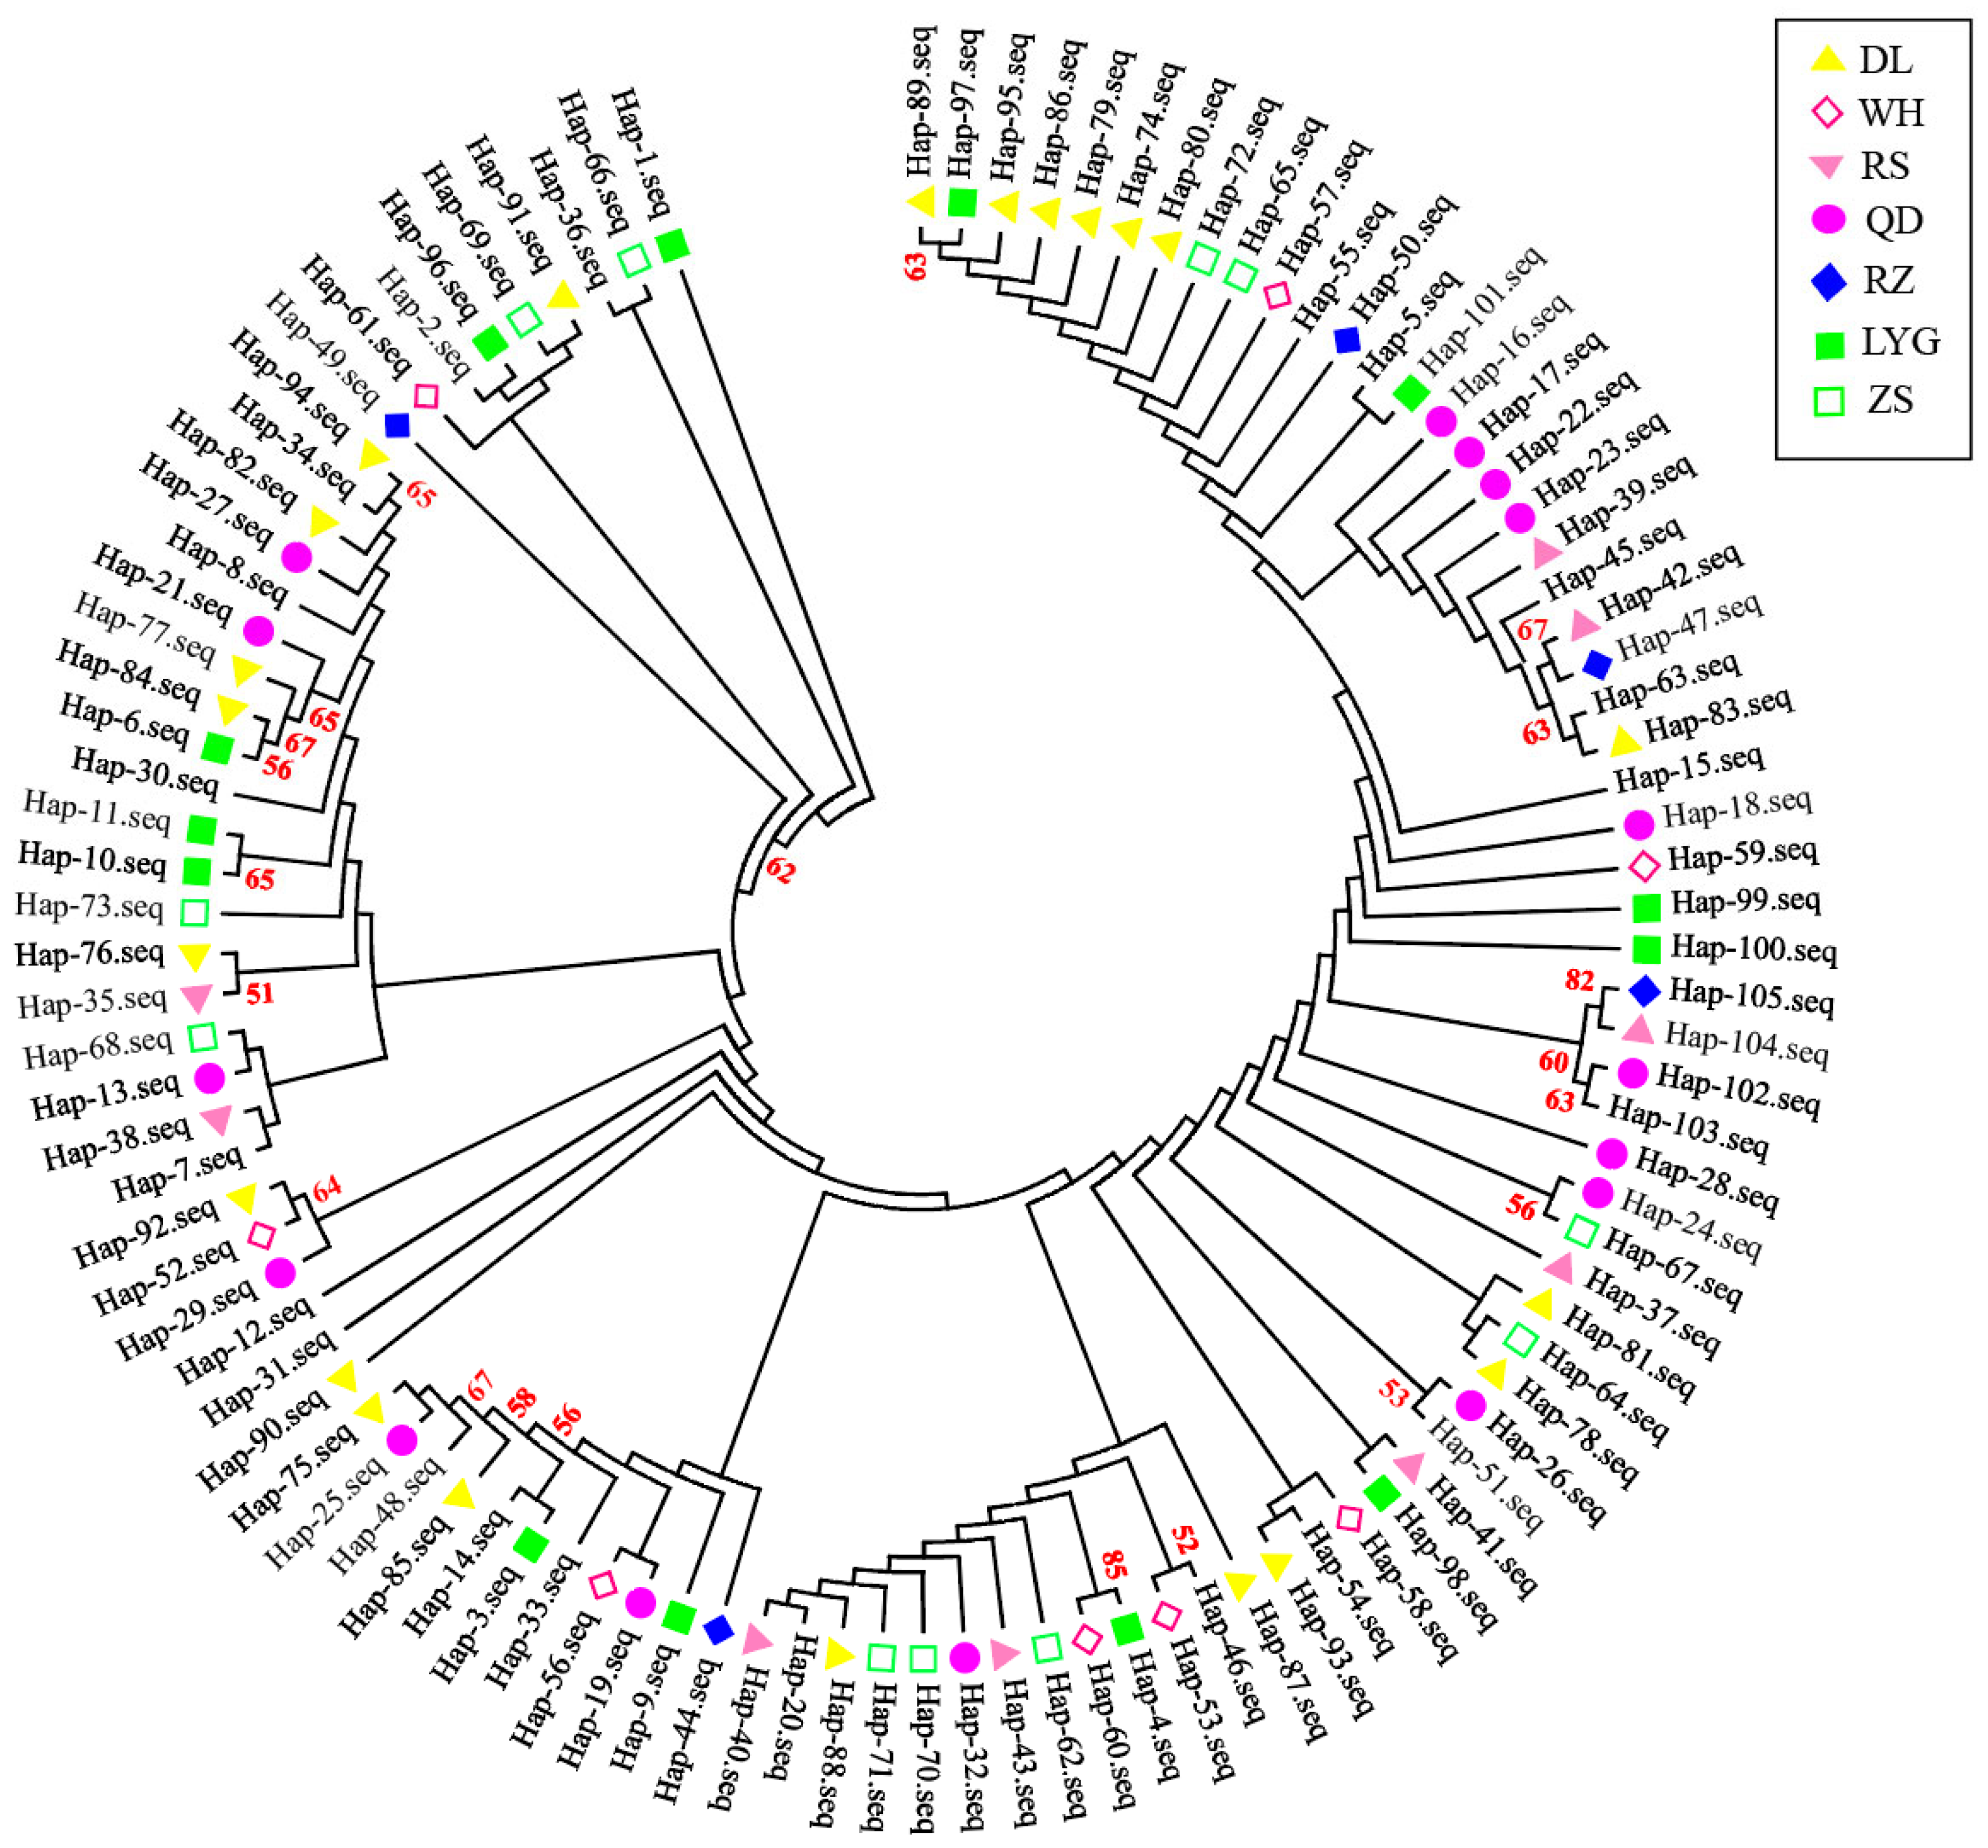
3.2. Haplotype Distribution and Genetic Diversity

There were 105 haplotypes defined in seven populations, and all were achieved in GenBank under accession numbers PQ317984–PQ318088. Among these haplotypes, only one haplotype (Hap 5) with the highest frequency was detected in all populations. For the remaining ones, Hap 2 and Hap 8 were shared by six populations, Hap 20 was shared by five populations, Hap 14 was shared by four populations, and Hap 36 and Hap 46 were shared by three populations. A total of 14 haplotypes (Hap 7, Hap 12, Hap 15, Hap 30, Hap 31, Hap 33, Hap 34, Hap 45, Hap 48, Hap 51, Hap 54, Hap 55, Hap 63, and Hap 103) were shared by two populations. In addition, 84 population-specific haplotypes were identified, respectively, in populations DL (22), WH (8), RS (9), QD (16), RZ (5), LYG (13), and ZS (11) (Figure 2). No obvious correlation was found between haplotype and geographical location in the phylogenetic NJ tree (Figure 3).
Detailed genetic diversity information for each population is shown in Table 2. Hd values ranged from 0.8133 to 0.9667, and π values ranged from 0.00279 to 0.00389, with average values of 0.9338 ± 0.013 and 0.00354 ± 0.0020, respectively. The highest genetic diversity was found in population DL among all studied populations (h = 30, Hd = 0.9667 ± 0.019, and π = 0.00389 ± 0.0022). Population RZ exhibited the lowest genetic diversity (h = 14, Hd = 0.8133 ± 0.080, and π = 0.00279 ± 0.0017).

3.3. Genetic Distance and Population Differentiation

The K2P genetic distance between populations DL and LYG was the greatest (0.00390), while populations RZ and ZS had the closest relationships (0.00297). No correlation was found between genetic distance and geographical distance. The FST values ranged from −0.02659 to 0.01335 without significant difference (p > 0.05), indicating no significant genetic differentiation among populations (Table 3).
The results of AMOVA for seven populations revealed that 100.80% of the variation was within populations. In order to clarify the pattern of differentiation between sampling locations, we divided the populations into three groups based on their geographical locations. The results showed that the genetic variations among groups, among populations within groups, and within populations were −0.25%, −0.66%, and 100.91%, respectively (Table 4). Additionally, over 50% of the pairwise FST values were negative, which affirmed that most of the variation originated within populations, and diversity levels within populations were higher than those among populations and groups (Table 3).

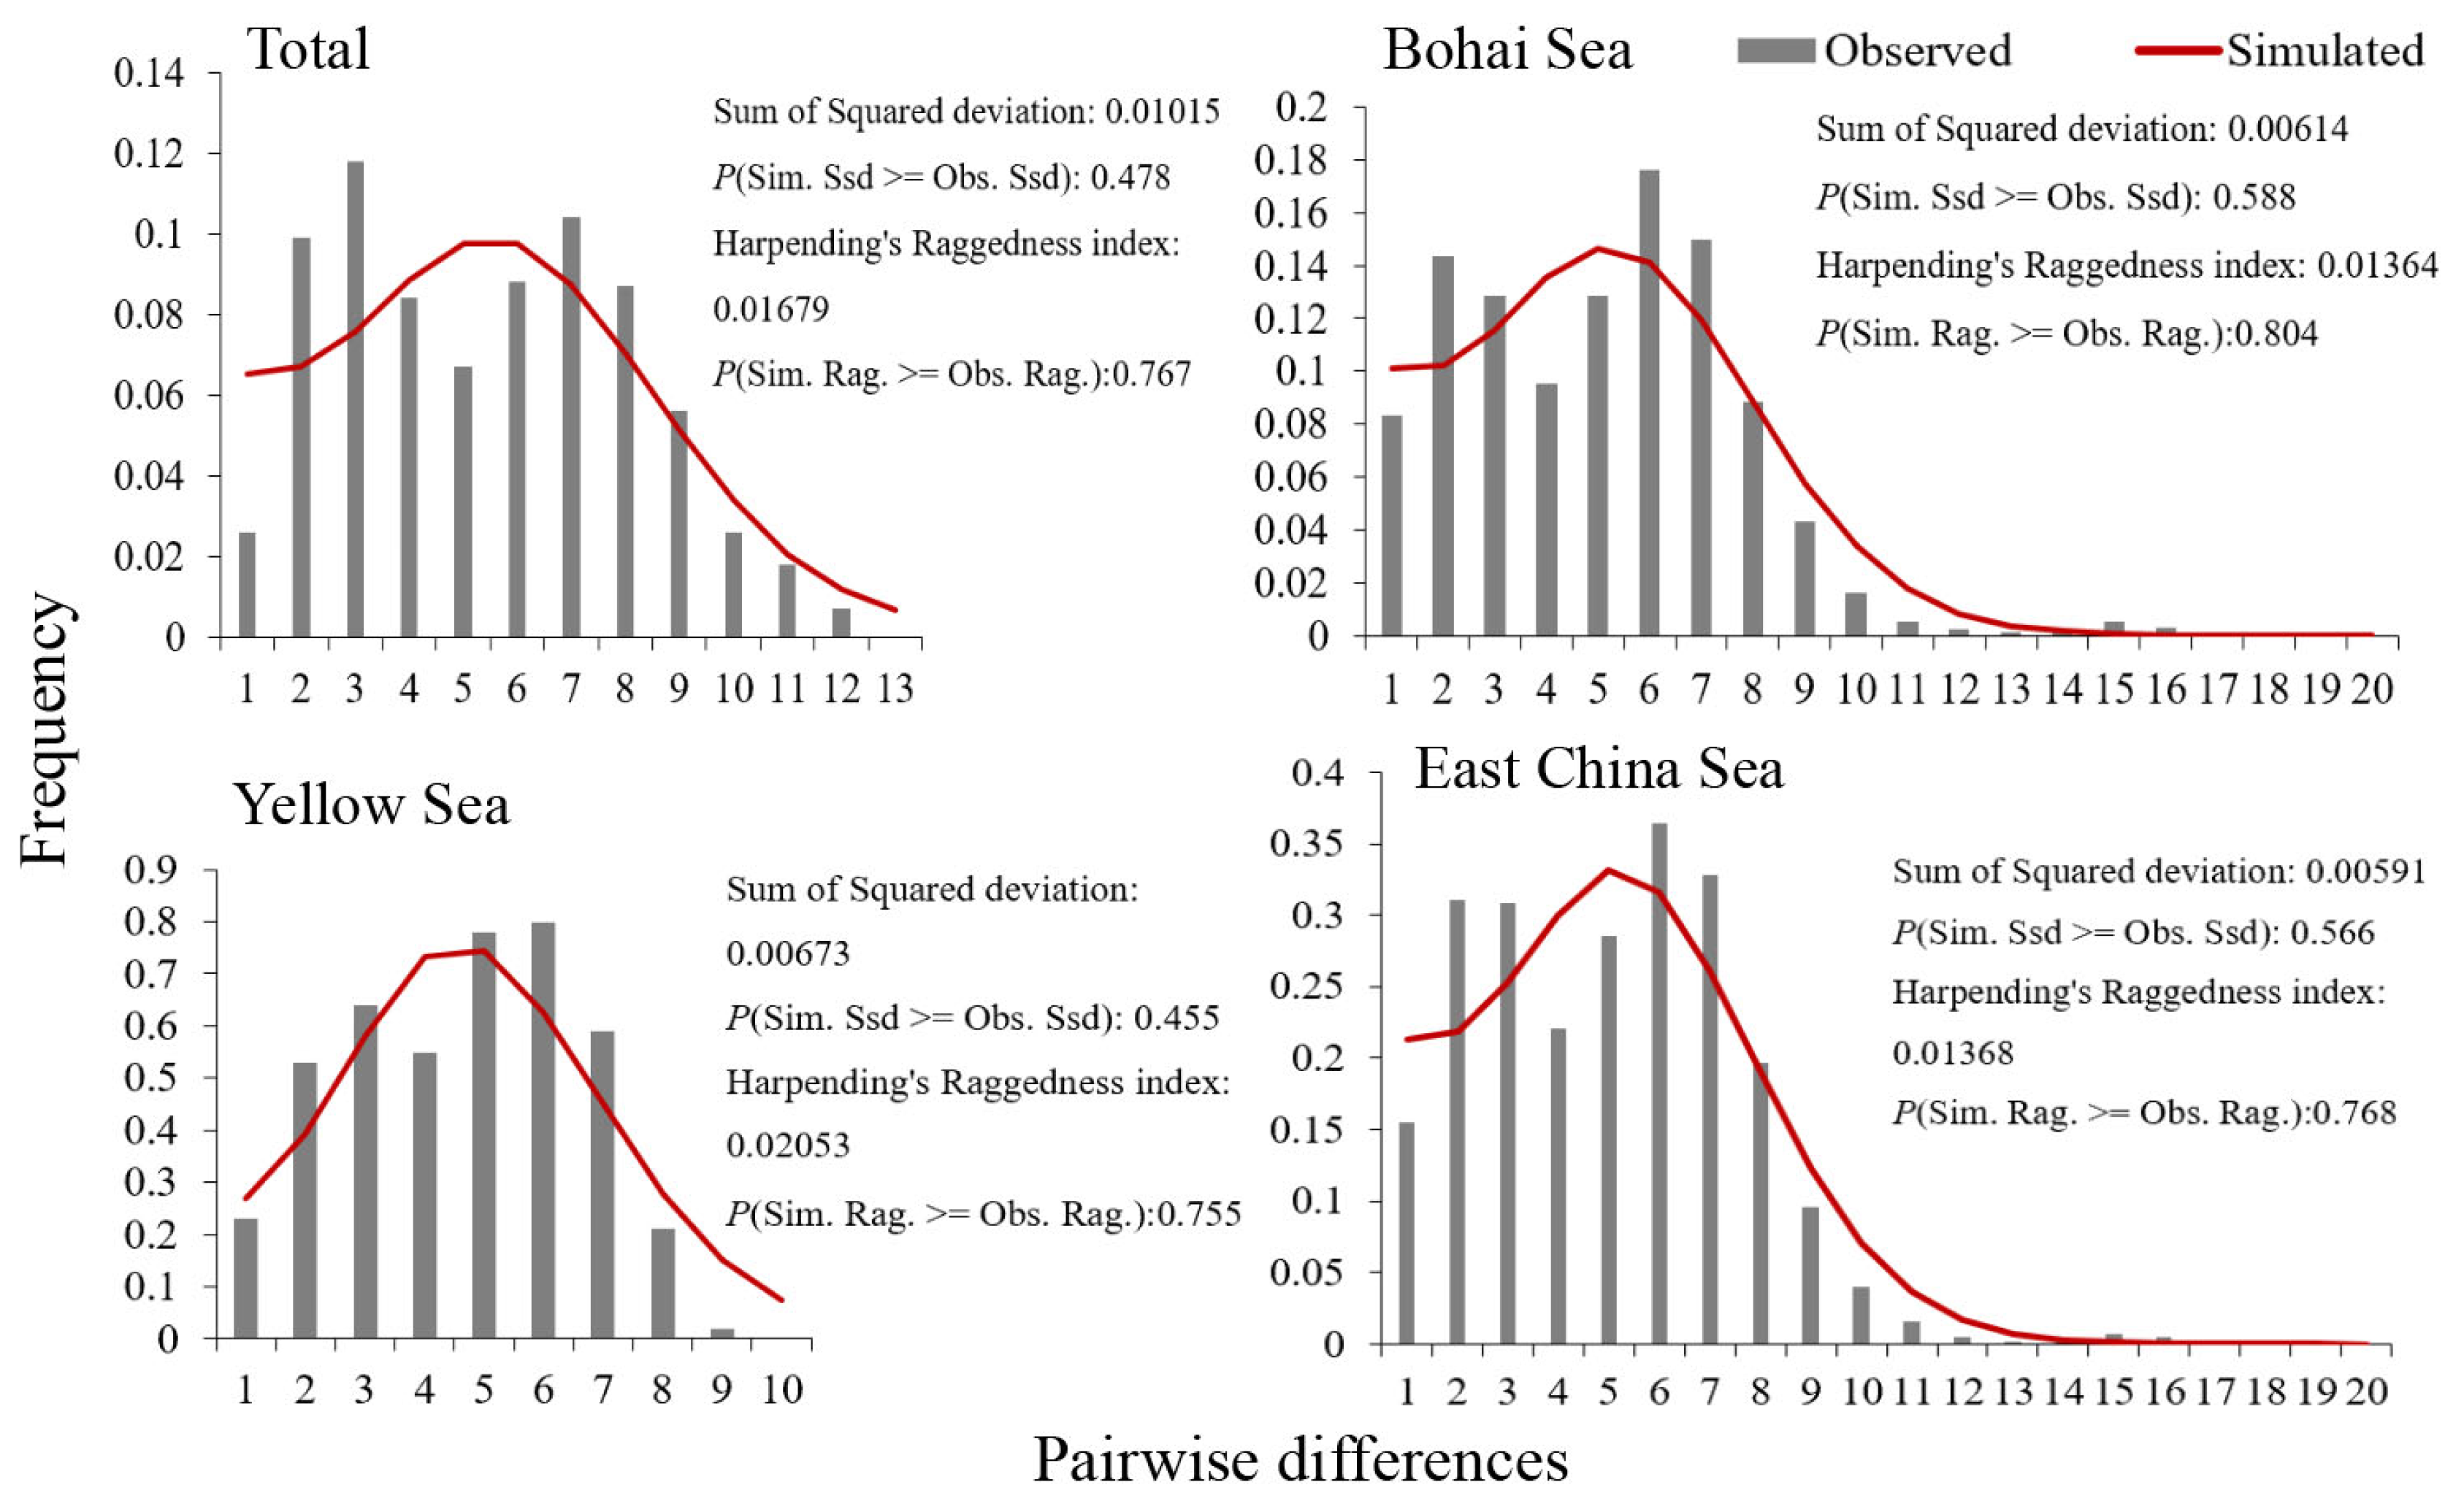
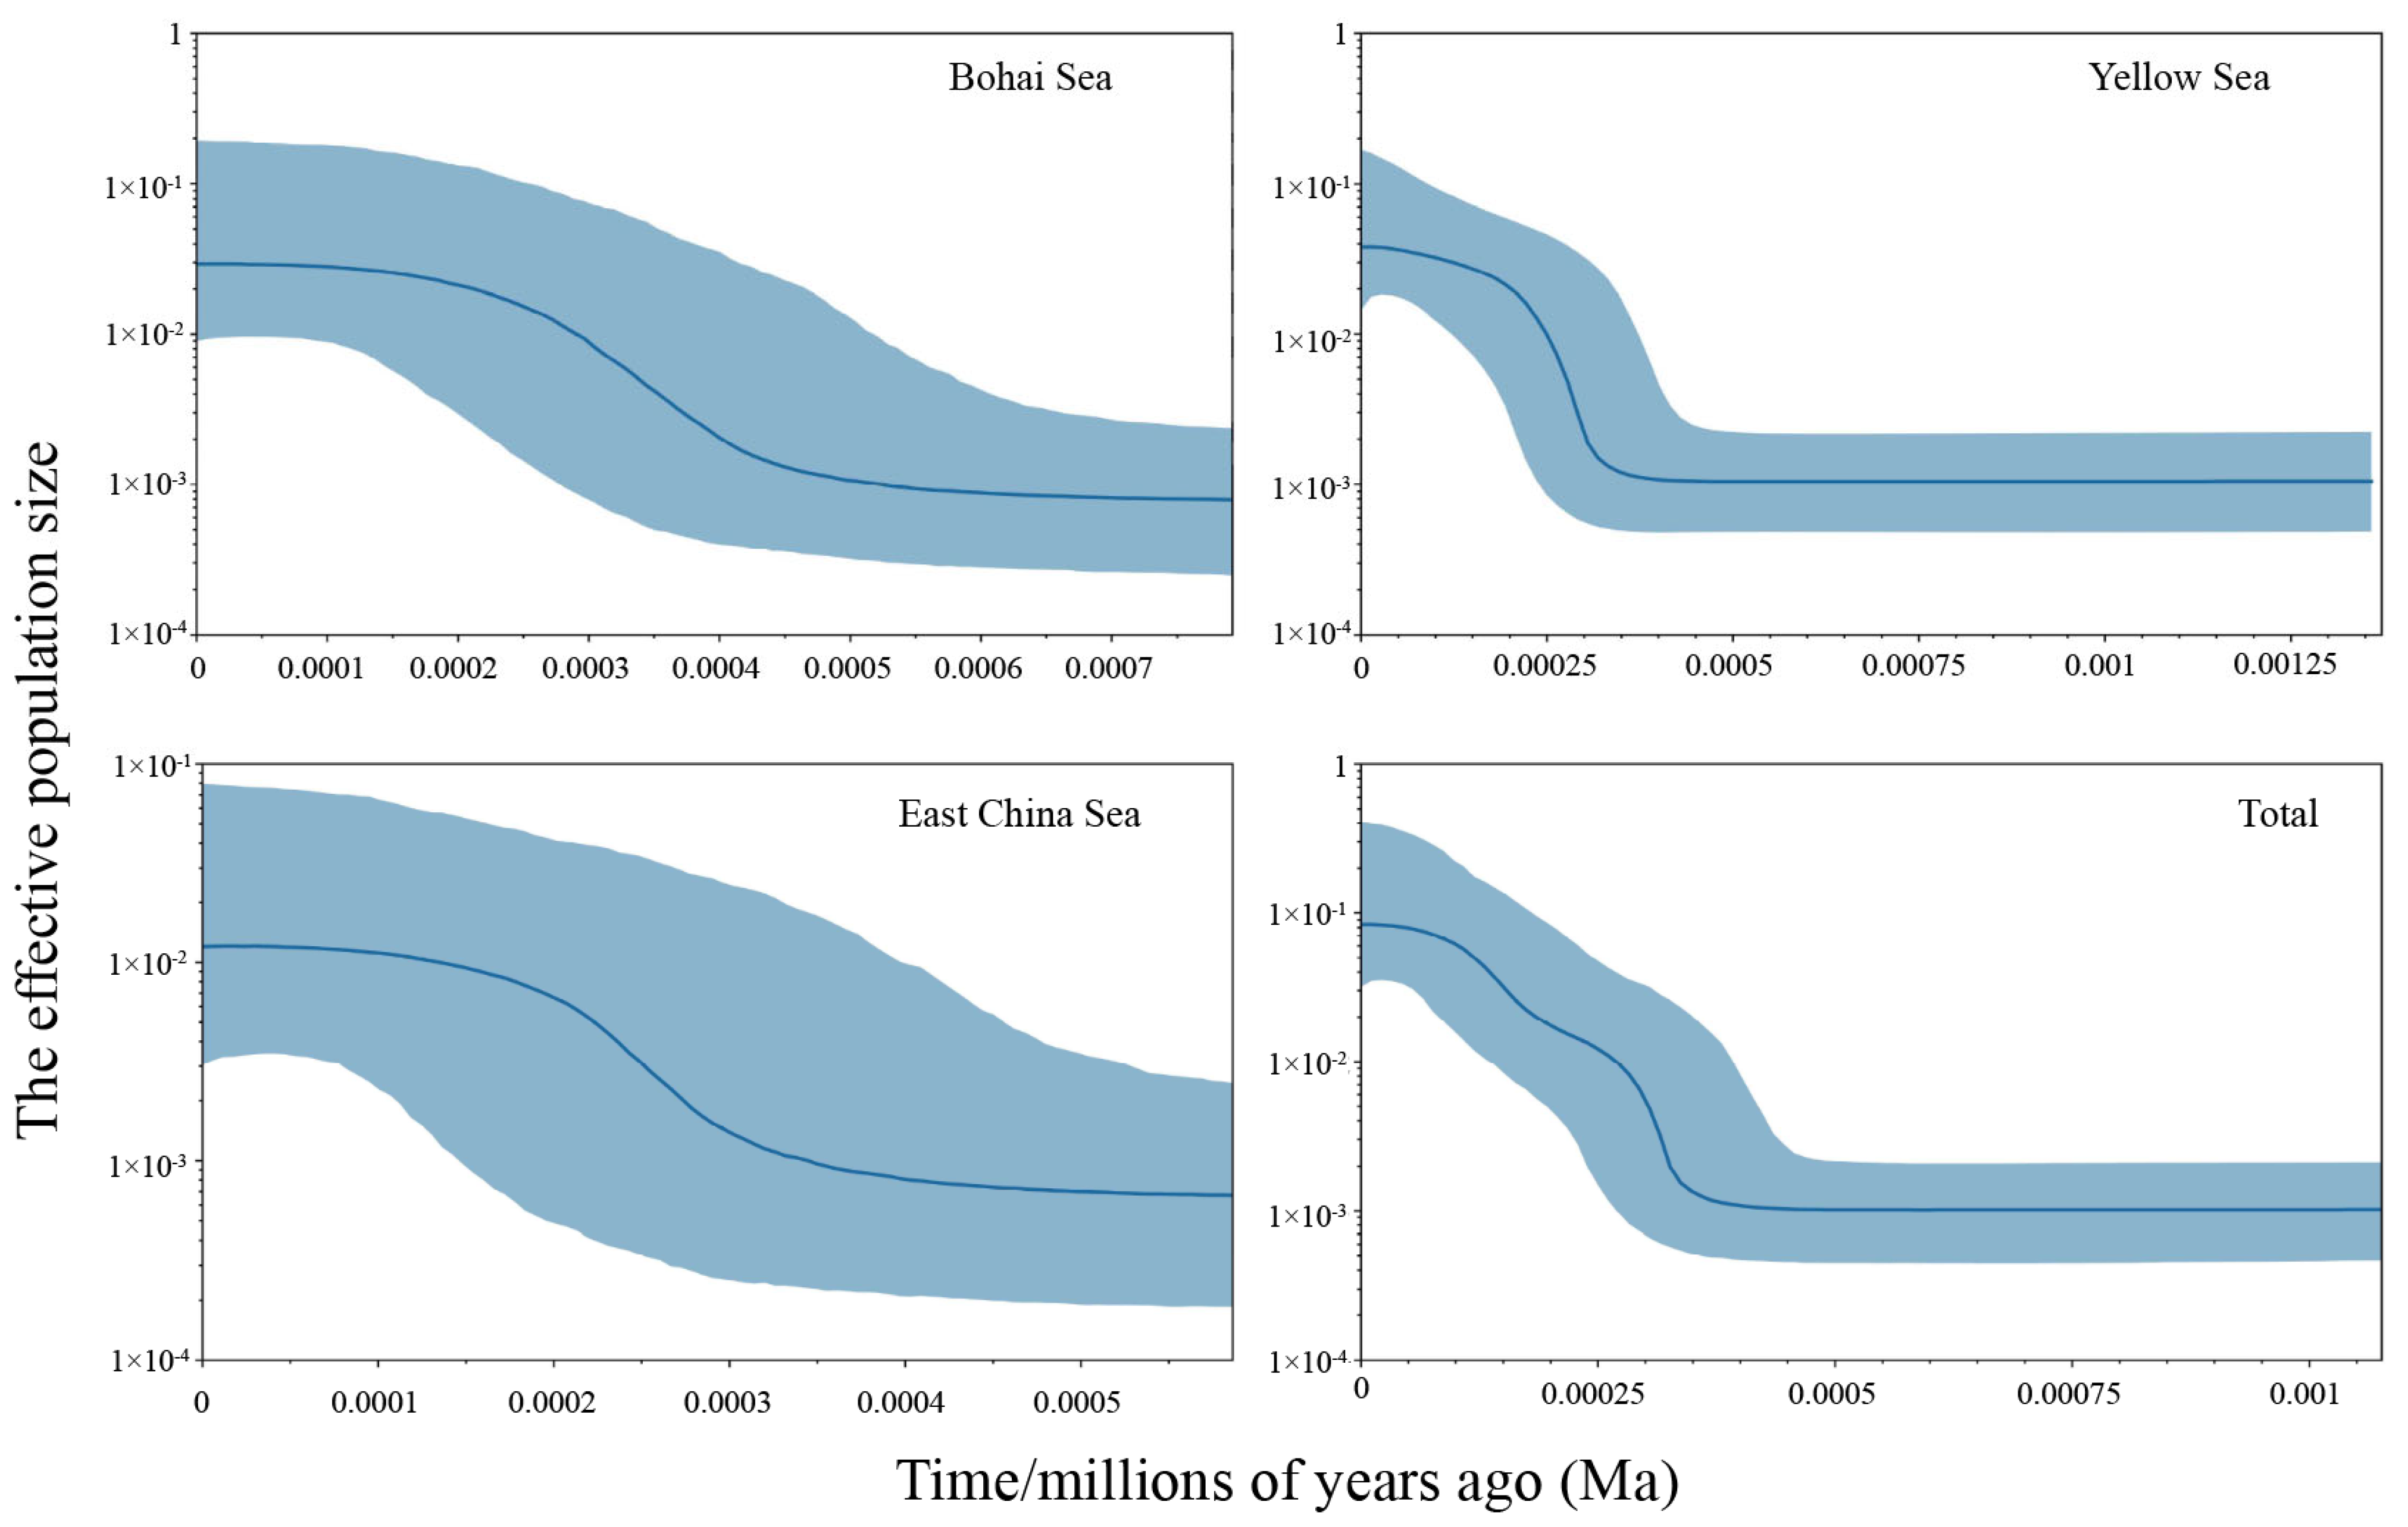
3.4. Demographic History

The DNA sequence information was utilized for Tajima’s D and Fu’s Fs tests to assess population expansion events under neutral conditions. In addition to the non-significantly negative Tajima’s D results for RZ (p = 0.077) and WH (p = 0.101), the other five populations possessed significant or highly significant negative values of Tajima’s D test. Further, the Fu’s Fs test results for all populations were extremely significantly negative, and the total Tajima’s D and Fu’s Fs test results were all negative values with high significance (Table 5). These results suggest that C. myriaster had experienced population selection or demographic expansion. The nucleotide mismatch distribution revealed a typically unimodal Poisson distribution with relatively small and statistically insignificant RI and SSD values (p > 0.05), indicating that the observed data did not statistically deviate from the demographic expansion model (Figure 4).
Using an average nucleotide mutation rate of 2.0% per million years for the Cyt b gene to estimate the population expansion time [53], with a generation time of 3.5 years [8], the overall expansion time of C. myriaster was estimated to be about 0.169–0.207 million years ago (Ma), i.e., during the Pleistocene period. Bayesian skyline plots showed that the Ne of C. myriaster along the coasts of China has maintained a sustained and stable increase over the last few hundred years, and there was no considerable difference in population expansion times among populations (Figure 5).

4. Discussion

4.1. Genetic Diversity and Variation

Genetic diversity, the foundation of biodiversity, expresses the degree of polymorphism within and among populations within a species [54]. In a sense, the diversity of a species can be represented by its unique genes. In recent years, with the continuous progress and improvement of sequencing technology, genetic diversity research based on DNA polymorphisms has become a hot topic in the field of biology. In our study, we detected a pattern of high haplotype diversity (Hd ≥ 0.5) and low nucleotide diversity (π < 0.5%) for C. myriaster populations along the coastal waters of China, which implies that they might have expanded rapidly after historical population bottlenecks [55,56]. Our research findings differed from the distribution of genetic variability with high haplotype diversity (Hd ≥ 0.5) and high nucleotide diversity (π > 0.5%) obtained by Zou et al. [27] based on the mtDNA CR marker. Evaluations of the genetic diversity of the same species using different molecular markers commonly come to somewhat different conclusions [57,58,59]. The above-mentioned discrepancy was presumably due to the fact that the non-coding CR evolves at a faster rate than the Cyt b gene [60]. Population genetic study of C. myriaster using the mtDNA CR and COI genes also showed a higher evolutionary rate and genetic diversity of mtDNA CR than the COI gene for the same populations [28]. Compared with European conger eel (C. conger), a sibling species of C. myriaster, a similar case with a high level of haplotype diversity and a low level of nucleotide diversity appeared in each population despite the use of CR sequences [61,62].

4.2. Genetic Structure and Population Homogeneity

Genetic distance reflects the evolutionary relationship between populations, and if distinct subspecies or population differentiation occurs, the mtDNA genetic distance between populations will be greater than 0.6 [63,64]. The FST value is another important parameter commonly used to evaluate the degree of genetic differentiation between populations [65]. It is suggested that 0–0.05 of the FST value indicates a low level of genetic differentiation [66,67]. The present results based on the Cyt b gene showed that the genetic distance between populations was much less than 0.6 and the absolute value of pairwise FST was less than 0.05 and non-significant (p > 0.05), both of which indicated that there was no significant genetic differentiation between populations of C. myriaster along the coasts of China. The topology of the phylogenetic tree and the haplotype network also supported this inference. In addition, the AMOVA results showed that genetic variation mainly came from individuals within populations, which confirmed the high genetic connectivity of C. myriaster populations.
Our present study revealed no clear genetic subdivision of C. myriaster populations, which agreed with the conclusions of Zou et al. and Ishikawa et al. [26,27]. Recent work has illustrated that the frequency of larval exchange can explain nearly 50% of the variance in observed genetic differences among sites over scales of tens of kilometers [68]. The formation of significant genetic structure in marine fish populations could be precluded by a relatively large effective population size, combined with the potential of high levels of larval dispersal and the absence of geographical barriers [27]. As a bottom-dwelling eel with metamorphic development, the habitat utilization and migratory behaviors of C. myriaster are both affected by marine currents [7,69]. Lacking swimming ability, the floating eggs and larvae are transported by external forces, especially ocean currents, and the planktonic leptocephalus period can increase the opportunity for long-distance dispersal [27]. Similar results have been found for other eels, such as American eel (Anguilla rostrata) [70] and European eel (A. anguilla) [71]. The spawning areas of the two eels showed considerable geographical overlap, and panmixia affects the population genetic structure of both species [71]. It has been demonstrated that C. myriaster in coastal China seas come from the same spawning area located in the western North Pacific Ocean [4], and the subsequent long-distance return of spawners to the North Pacific spawning area realizes ample opportunities for random mating.

4.3. Historical Population Dynamics

The neutrality test can assess whether rare alleles are present at high frequencies in a population and thus determine whether the population has experienced a history of directed selection or population expansion [72]. Although a non-significant negative Tajima’s D test result (p = 0.077, 0.101) was observed in populations RZ and WH, all populations had extremely significant negative values in Fu’s Fs test. Moreover, the unimodal mismatch distribution plots with small and not statistically significant RI and SSD values also indicated that the populations of C. myriaster in coastal China seas had experienced demographic expansion [47,48]. Not only that, the haplotype network had four major haplotypes, each with several haplotypes differing by a few mutational steps from them. Similarly, the phylogram had some major branches with many subbranches. These observations may be the signature of ancestral populations, perhaps from four glacial refugia. The ancestors might have expanded demographically and have gained recent haplotypes by mutation, which fitted with the demographic expansion that we inferred using the neutrality test.
The population expansion time of C. myriaster in different sea areas was during the Pleistocene period, when Earth experienced frequent climate fluctuations and a series of glacial–interglacial cycles [73]. Wang et al. [74] investigated the impacts of Pleistocene glacial–interglacial cycles on the phylogeographic structure and demographic dynamics of Japanese scad (Decapterus maruadsi) and found a recent population expansion due to increasing paleo-productivity and niche space during the Last Glacial Maximum to the early Holocene. Some other recent studies based on molecular phylogeography also showed that the climate change of the Pleistocene period had a large effect on the phylogeographic pattern of marine fishes in the Northwest Pacific Ocean [75,76]. The sea surface and structure of the margins of the North Pacific Ocean underwent drastic changes, which had an intense impact on the evolutionary history, distribution pattern, and population structure of C. myriaster [77]. The Bayesian skyline plots showed a small-scale increase in population size between 100 and 400 years ago, which might be related to the relatively low demand for marine fishery resources and the primitive fishing techniques in use at that time. Additionally, the limited conditions of trade and transportation restricted the market circulation of fish products and brought about lower fishing intensity [78,79].

5. Conclusions

In this study, we used the mtDNA Cyt b gene as a molecular marker to investigate the genetic diversity, population structure, and historical dynamics of seven C. myriaster populations along the coasts of China. The genetic variation pattern of C. myriaster was revealed to be a typically high level of haplotype diversity and a low level of nucleotide diversity. Complicated ocean currents support the large-scale dispersal of C. myriaster during the planktonic stage, and spawning in one common area increases the likelihood of gene exchange. These processes promote intra-population variation and, therefore, no significant genetic differentiation among populations. Results of the neutrality test and analysis of mismatch distribution suggested that the populations of C. myriaster in coastal China seas have experienced noticeable demographic expansion tracing back to the middle Pleistocene period. The genetic data could be meaningful for the subsequent conservation and sustainable management of this commercially important eel species.

Author Contributions

Conceptualization and writing—review and editing, T.Y.; methodology and writing—original draft preparation, P.X. All authors have read and agreed to the published version of the manuscript.

Funding

This research was supported by the Fundamental Research Funds for Zhejiang Provincial Universities and Research Institutes (2024J004), the Science and Technology Planning Project of Zhoushan (2022C41022), and the National Key Research and Development Program Project of China (2023YFD2401901).

Institutional Review Board Statement

The animal study protocol was approved by the Ethics Committee of Zhejiang Ocean University (approval code: ZJOU-ECAE20211878, approval date: 19 January 2022).

Informed Consent Statement

Not applicable.

Data Availability Statement

The data presented in this study are openly available in the GenBank database with the accession numbers PQ317984-PQ318088.

Conflicts of Interest

The authors declare no conflicts of interest.

References

  1. Brevoort, J.C. Notes on Some Figures of Japanese Fish Taken from Recent Specimens by the Artists of the U. S. Japan Expedition; FAO: Washington, DC, USA, 1856; pp. 253–288. [Google Scholar]
  2. Chen, D.G.; Zhang, M.Z. Marine Fishes of China; China Ocean University Press: Qingdao, China, 2015; pp. 187–188. (In Chinese) [Google Scholar]
  3. Kimura, Y.; Ishikawa, S.; Tokai, T.; Nishida, M.; Tsukamoto, K. Early life history characteristics and genetic homogeneity of Conger myriaster leptocephali along the east coast of central Japan. Fish. Res. 2004, 70, 61–69. [Google Scholar] [CrossRef]
  4. Mu, X.X.; Zhang, C.; Zhang, C.L.; Yang, J.; Ren, Y.P. Age-structured otolith chemistry profiles revealing the migration of Conger myriaster in China Seas. Fish. Res. 2021, 239, 105938. [Google Scholar] [CrossRef]
  5. Tang, Y.L.; Sun, G.W.; Zhao, T.Y.; Liang, Z.L.; Yang, B.Z.; Chen, B. Mesh size selectivity of Conger myriaster pot. J. Fish. Sci. China 2010, 17, 136–142. (In Chinese) [Google Scholar]
  6. Zhang, Y.M.; Zhang, S.H.; Zhuang, Q.H.; Song, W.Y. Factory farming technology of Conger myriaster. Breed. Feed 2020, 19, 38–39. (In Chinese) [Google Scholar]
  7. Katayama, S.; Ishida, T.; Shimizu, Y.; Yamanobe, A. Seasonal change in distribution of conger eel Conger myriaster off the Pacific coast south of Tohoku, north-eastern Japan. Fish. Sci. 2004, 70, 1–6. [Google Scholar] [CrossRef]
  8. Yang, H.; Shi, B.; Niu, H.X.; Zhang, D.Q.; Li, J. Advances and future prospects in Conger myriaster research. Mar. Sci. 2020, 44, 152–158. (In Chinese) [Google Scholar]
  9. Ennos, R.A.; Worrell, R.; Arkle, P.; Malcolm, D.C. Genetic diversity and conservation. In Genetic Variation and Conservation of British Native Trees and Shrubs Current Knowledge and Policy Implications; Forestry Commission Technical: Edinburgh, UK, 2000; pp. 1–8. [Google Scholar]
  10. Nonić, M.; Šijačić-Nikolić, M. Genetic diversity: Sources, threats, and conservation. In Life on Land. Encyclopedia of the UN Sustainable Development Goals; Leal Filho, W., Azul, A.M., Brandli, L., Lange Salvia, A., Wall, T., Eds.; Springer: Cham, Switzerland, 2021; pp. 1–15. [Google Scholar] [CrossRef]
  11. Hughes, R.A.; Brian, D.; Inouye, B.D.; Marc, T.J.J.; Underwood, N.; Vellend, M. Ecological consequences of genetic diversity. Ecol. Lett. 2008, 11, 609–623. [Google Scholar] [CrossRef]
  12. Pinsky, M.L.; Palumbi, S.R. Meta-analysis reveals lower genetic diversity in overfished populations. Mol. Ecol. 2014, 23, 29–39. [Google Scholar] [CrossRef]
  13. Truelove, N.K.; Box, S.J.; Aiken, K.A.; Blythe-Mallett, A.; Boman, E.M.; Booker, C.J.; Byfield, T.T.; Cox, C.E.; Davis, M.; Delgado, G.A.; et al. Isolation by oceanic distance and spatial genetic structure in an overharvested international fishery. Divers. Distrib. 2017, 23, 1292–1300. [Google Scholar] [CrossRef]
  14. Melis, R.; Vacca, L.; Cuccu, D.; Mereu, M.; Cau, A.; Follesa, M.C.; Cannas, R. Genetic population structure and phylogeny of the common octopus Octopus vulgaris Cuvier, 1797 in the western Mediterranean Sea through nuclear and mitochondrial markers. Hydrobiologia 2018, 807, 277–296. [Google Scholar] [CrossRef]
  15. Madduppa, H.H.; Timm, J.; Kochzius, M. Reduced genetic diversity in the clown anemonefish Amphiprion ocellaris in exploited reefs of Spermonde Archipelago, Indonesia. Front. Mar. Sci. 2018, 5, 80. [Google Scholar] [CrossRef]
  16. Kawazu, M.; Kameda, T.; Kurogi, H.; Yoda, M.; Ohshimo, S.; Sakai, T.; Tsukamoto, Y.; Mochioka, N. Biological characteristics of Conger myriaster during the initial stage of spawning migration in the East China Sea. Fish. Sci. 2015, 81, 663–671. [Google Scholar] [CrossRef]
  17. Wang, G.X.; Li, K.; Liu, R.C.; Jiang, Z.X.; Ba, X.B.; Song, Z.C.; Liu, L.P. Analysis of lipid metabolism in main tissues of artificially induced ovarian development tissues of Conger myriaster. J. Fish. China 2024, 48, 91–101. (In Chinese) [Google Scholar]
  18. Shi, B.; Wang, C.G.; Tang, X.H.; Zhao, X.Y.; Yan, K.W.; Ma, X.D. A study on sperm ultrastructure in the whitespotted conger, Conger myriaster. Mar. Sci. 2023, 47, 112–120. (In Chinese) [Google Scholar]
  19. Li, Z.; Liu, R.; Liu, J.; Jiang, Z.; Ba, X.; Li, K.; Liu, L. Effects of flowing water stimulation on hormone regulation during the maturation process of Conger myriaster ovaries. Front. Physiol. 2024, 15, 1404834. [Google Scholar] [CrossRef]
  20. Zhang, Y.Y.; Wang, Y.; Huang, X.H.; Zheng, J.; Qi, L.B.; Fu, B.S.; Qin, L. Nutritional value of different parts from sea eel (Astroconger myriaster) determined by untargeted-lipidomic approach. Food Res. Int. 2023, 173, 113402. [Google Scholar] [CrossRef]
  21. Zhao, X.; Shi, B.; Wang, C.; Cheng, H.; Wang, C.; Ma, X.; Yan, K.; Chen, Y. Effects of dietary supplementation of compound probiotics on growth, non-specific immunity, intestinal digestive enzyme, and microbiota of whitespotted conger (Conger myriaster) in recirculating aquaculture system. Aquacult. Int. 2024, 32, 2713–2738. [Google Scholar] [CrossRef]
  22. Xiao, P.Y.; Jiang, X.Z.; Yang, L.; Zhao, Y.; Yang, T.Y. Multiple analysis for morphometric traits on body mass of different Conger myriaster populations in the Yellow Sea and the Bohai Sea of China. J. Ecol. 2024, 44, 131–138. (In Chinese) [Google Scholar]
  23. Chen, Y.; Yan, K.W.; Shi, B.; Wang, C.G.; Zhao, X.Y.; Ma, X.D. Morphometric analysis and influence of important morphological traits on the body weight and net body weight of Conger myriaster in an industrialized culture model. Prog. Fish. Sci. 2024, 45, 83–96. (In Chinese) [Google Scholar]
  24. Xiao, P.; Yang, T. Population morphometry of Conger myriaster (Anguilliformes: Congridae) along the coast of China: Implications for population structure and fishery management. Animals 2024, 14, 2007. [Google Scholar] [CrossRef]
  25. Nakamura, O.; Watanabe, T.; Kamiya, H.; Muramoto, K. Galectin containing cells in the skin and mucosal tissues in Japanese conger eel, Conger myriaster: An immunohistochemical study. Dev. Comp. Immunol. 2001, 25, 431–437. [Google Scholar] [CrossRef] [PubMed]
  26. Ishikawa, S.; Kimura, Y.; Tokai, T.; Tsukamoto, K.; Nishida, M. Genetic variation in the mitochondrial and nuclear DNA of the Japanese conger Conger myriaster. Fish. Sci. 2001, 67, 1081–1087. [Google Scholar] [CrossRef]
  27. Zou, C.; Wang, L.; Kong, L.; Wang, Y.; Wu, Z.; Xu, J.; Song, A.; Liu, H.; You, F. High levels of genetic diversity and connectivity of whitespotted conger Conger myriaster in the East China Coast. Mar. Biodivers. 2020, 50, 47. [Google Scholar] [CrossRef]
  28. Yin, J.; Mu, X.X.; Zhang, C.L.; Xu, B.D.; Xue, Y.; Ren, Y.P. Comparison of morphological and genetic characteristics of Conger myriaster populations in China. J. Fish. China 2020, 44, 358–367. (In Chinese) [Google Scholar]
  29. McCosker, J.; Smith, D.G.; Tighe, K. Conger myriaster. The IUCN Red List of Threatened Species 2019, e.T199034A2552131. Available online: https://dx.doi.org/10.2305/IUCN.UK.2019-1.RLTS.T199034A2552131.en (accessed on 17 August 2024).
  30. Vieira, A.R.; Rodrigues, A.S.B.; Sequeira, V.; Neves, A.; Paiva, R.B.; Paulo, O.S.; Gordo, L.S. Genetic and morphological variation of the forkbeard, Phycis phycis (Pisces, Phycidae): Evidence of panmixia and recent population expansion along its distribution area. PLoS ONE 2016, 11, e0167045. [Google Scholar] [CrossRef]
  31. Porrini, L.P.; Iriarte, P.J.F.; Iudica, C.M.; Abud, E.A. Population genetic structure and body shape assessment of Pagrus pagrus (Linnaeus, 1758) (Perciformes: Sparidae) from the Buenos Aires coast of the Argentine Sea. Neotrop. Ichthyol. 2015, 13, 431–438. [Google Scholar] [CrossRef]
  32. Zardoya, R.; Meyer, A. The complete nucleotide sequence of the mitochondrial genome of the lungfish (Protopterus dolloi) supports its phylogenetic position as a close relative of land vertebrates. Genetics 1996, 142, 1249–1263. [Google Scholar] [CrossRef]
  33. Maniatis, T.; Fritsch, E.F.; Sambrook, J. Molecular Cloning: A Laboratory Manual; Cold Spring Harbor Laboratory: New York, NY, USA, 1982; pp. 129–178. [Google Scholar]
  34. Inoue, J.G.; Miya, M.; Tsukamoto, K.; Nishida, M. Complete mitochondrial DNA sequence of Conger myriaster (Teleostei: Anguilliformes): Novel gene order for vertebrate mitochondrial genomes and the phylogenetic implications for anguilliform families. J. Mol. Evol. 2001, 52, 311–320. [Google Scholar] [CrossRef]
  35. Burland, T.G. Dnastar’s Lasergene sequence analysis software. In Bioinformatics Methods and Protocols. Methods in Molecular Biology™; Misener, S., Krawetz, S.A., Eds.; Humana Press: Totowa, NJ, USA, 2000; Volume 132, pp. 71–91. [Google Scholar]
  36. Excoffier, L.; Lischer, H.E.L. Arlequin suite ver 3.5: A new series of programs to perform population genetics analyses under Linux and Windows. Mol. Ecol. Resour. 2010, 10, 564–567. [Google Scholar] [CrossRef]
  37. Librado, P.; Rozas, J. DnaSP v5: A software for comprehensive analysis of DNA polymorphism data. Bioinformatics 2009, 25, 1451–1452. [Google Scholar] [CrossRef]
  38. Nei, M. Molecular Evolutionary Genetics; Columbia University Press: New York, NY, USA, 1987; pp. 10–88. [Google Scholar]
  39. Lynch, M.; Crease, T.J. The analysis of population survey data on DNA sequence variation. Mol. Biol. Evol. 1990, 7, 377–394. [Google Scholar] [CrossRef]
  40. Kumar, S.; Stecher, G.; Li, M.; Knyaz, C.; Tamura, K. MEGA X: Molecular Evolutionary Genetics Analysis across computing platforms. Mol. Biol. Evol. 2018, 35, 1547–1549. [Google Scholar] [CrossRef] [PubMed]
  41. Felsenstein, J. Confidence limits on phylogenies: An approach using the bootstrap. Evolution 1985, 3, 783–791. [Google Scholar] [CrossRef]
  42. Saitou, N.; Nei, M. The neighbor-joining method: A new method for reconstructing phylogenetic trees. Mol. Biol. Evol. 1987, 4, 406–425. [Google Scholar] [CrossRef] [PubMed]
  43. Kimura, M. A simple method for estimating evolutionary rates of base substitutions through comparative studies of nucleotide sequences. J. Mol. Evol. 1980, 16, 111–120. [Google Scholar] [CrossRef]
  44. Leigh, J.W.; Bryant, D. PopART: Full-feature software for haplotype network construction. Methods Ecol. Evol. 2015, 6, 1110–1116. [Google Scholar] [CrossRef]
  45. Bandelt, H.J.; Forster, P.; Röhl, A. Median-joining networks for inferring intraspecific phylogenies. Mol. Biol. Evol. 1999, 16, 37–48. [Google Scholar] [CrossRef]
  46. Raymond, M.; Rousset, F. An exact test for population differentiation. Evolution 1995, 49, 1280–1283. [Google Scholar] [CrossRef]
  47. Tajima, F. Statistical method for testing the neutral mutation hypothesis by DNA polymorphism. Genetics 1989, 123, 585–595. [Google Scholar] [CrossRef]
  48. Fu, Y.X. Statistical tests of neutrality of mutations against population growth, hitchhiking and background selection. Genetics 1997, 147, 915–925. [Google Scholar] [CrossRef]
  49. Rogers, A.R.; Harpending, H. Population growth makes waves in the distribution of pairwise genetic differences. Mol. Biol. Evol. 1992, 9, 552–569. [Google Scholar] [CrossRef] [PubMed]
  50. Wang, D.; Luo, J.Y.; Xiong, F.; Liu, H.Y.; Zhai, D.D. Genetic structure of Pseudobrama simoni populations in the mainstream and tributaries of three Gorges Reservoir. J. Hydroecol. 2023, 44, 124–131. (In Chinese) [Google Scholar]
  51. Suchard, M.A.; Lemey, P.; Baele, G.; Ayres, D.L.; Drummond, A.J.; Rambaut, A. Bayesian phylogenetic and phylodynamic data integration using BEAST 1.10. Virus Evol. 2018, 4, 16. [Google Scholar] [CrossRef] [PubMed]
  52. Rambaut, A.; Drummond, A.J.; Xie, D.; Baele, G.; Suchard, M.A. Posterior summarization in Bayesian phylogenetics using Tracer 1.7. Syst. Biol. 2018, 67, 901–904. [Google Scholar] [CrossRef] [PubMed]
  53. Bermingham, E.S.; McCafferty, A. Molecular Systematics of Fishes; Academic Press: New York, NY, USA, 1997; pp. 113–126. [Google Scholar]
  54. Ji, Z.W.; Su, B. Principles and Methodologies of Genetic Diversity Studies; Zhejiang Science and Technology Publishing House: Hangzhou, China, 1999; pp. 1–2. (In Chinese) [Google Scholar]
  55. Grant, W.A.S.; Bowen, B.W. Shallow population histories in deep evolutionary lineages of marine fishes: Insights from sardines and anchovies and lessons for conservation. J. Hered. 1998, 89, 415–426. [Google Scholar] [CrossRef]
  56. Ojango, J.M.; Mpofu, N.; Marshall, K.; Andersson-Eklund, L. Quantitative methods to improve the understanding and utilisation of animal genetic resources. In Animal Genetics Training Resource, Version 3; Ojango, J.M., Malmfors, B., Okeyo, A.M., Eds.; International Livestock Research Institute: Nairobi, Kenya; Swedish University of Agricultural Sciences: Uppsala, Sweden, 2011. [Google Scholar]
  57. Bian, G.M.; Wang, N.L.; Hu, Z.H.; Wang, Y.B.; Hu, C.S.; Chai, X.J. A comparative analysis on the genetic diversity of Trichiurus lepturus. Acta Hydrobiol. Sin. 2019, 43, 282–290. (In Chinese) [Google Scholar]
  58. Guo, D.D.; Liu, F.; Niu, B.L.; Lou, B. Genetic diversity of wild and cultured populations of little yellow croaker (Larimichthys polyactis) based on mitochondrial Cytb gene and D-loop region. Acta Agricul. Zhejiangensis 2022, 34, 1856–1865. (In Chinese) [Google Scholar]
  59. Peng, M.; Xiao, S.; Yao, J.X.; Pan, C.Y.; Li, M.; Gao, X.M.; Feng, P.F.; Li, M.Y.; Zeng, D.G.; Zhu, W.L.; et al. Genetic structure of four Sillago sihama populations in southern China based on mitochondrial sequences. J. Hydroecol. 2023, 44, 108–116. (In Chinese) [Google Scholar]
  60. Meyer, A. Evolution of mitochondrial DNA in Fishes. In Biochemistry and Molecular Biology of Fishes; Hochachka, P.W., Mommsen, T.P., Eds.; Elsevier: Amsterdam, The Netherlands, 1993; Volume 2, pp. 1–38. [Google Scholar]
  61. Laura, M.; Ling, S.; Lee, Y.B.; Eva, G.V. Population genetic structure of the European conger (Conger conger) in North East Atlantic and West Mediterranean Sea. Fish. Res. 2016, 174, 245–249. [Google Scholar] [CrossRef]
  62. Correia, A.T.; Ramos, A.A.; Barros, F.; Silva, G.; Hamer, P.; Morais, P.; Cunha, R.L.; Castilho, R. Population structure and connectivity of the European conger eel (Conger conger) across the north-eastern Atlantic and western Mediterranean: Integrating molecular and otolith elemental approaches. Mar. Biol. 2012, 159, 1509–1525. [Google Scholar] [CrossRef]
  63. Billington, N.; Hebert, P.B.N. Mitochondria1 DNA diversity in fishes and its implications for introductions. Can. J. Fish. Aquat. Sci. 1991, 48, 88–94. [Google Scholar] [CrossRef]
  64. Yang, X.G.; Wang, Y.Q.; Zhou, K.Y.; Liu, Z.Q. Authentication of Oviductus ranae and its original animals using molecular marker. Biol. Pharm. Bull. 2002, 25, 1035–1039. [Google Scholar] [CrossRef]
  65. Holsinger, K.; Weir, B. Genetics in geographically structured populations: Defining, estimating and interpreting FST. Nat. Rev. Genet. 2009, 10, 639–650. [Google Scholar] [CrossRef] [PubMed]
  66. Wright, S. Variability within and among natural populations. In Evolution and the Genetics of Populations; University of Chicago Press: Chicago, IL, USA, 1978; Volume 4, pp. 253–256. [Google Scholar]
  67. Balloux, F.; Lugon-Moulin, N. The estimation of population differentiation with microsatellite markers. Mol. Ecol. 2002, 11, 155–165. [Google Scholar] [CrossRef] [PubMed]
  68. White, C.; Selkoe, K.A.; Watson, J.; Siegel, D.A.; Zacherl, D.C.; Toonen, R.J. Ocean currents help explain population genetic structure. Proceedings. Biol. Sci. 2010, 277, 1685–1694. [Google Scholar] [CrossRef]
  69. Gorie, S.; Tanda, M.; Nagasawa, K. Habitat preference and feeding habits of juvenile white-spotted conger Conger myriaster in the eastern Seto Inland Sea, Japan. Aquac. Sci. 2010, 58, 167–179. [Google Scholar] [CrossRef]
  70. Ulmo-Diaz, G.; Engman, A.; McLarney, W.O.; Lasso Alcalá, C.A.; Hendrickson, D.; Bezault, E.; Feunteun, E.; Prats-Léon, F.L.; Wiener, J.; Maxwell, R.; et al. Panmixia in the American eel extends to its tropical range of distribution: Biological implications and policymaking challenges. Evol. Appl. 2023, 16, 1872–1888. [Google Scholar] [CrossRef]
  71. Als, T.D.; Hansen, M.M.; Maes, G.E.; Castonguay, M.; Riemann, L.; Aarestrup, K.; Munk, P.; Sparholt, H.; Hanel, R.; Bernatchez, L. All roads lead to home: Panmixia of European eel in the Sargasso Sea. Mol. Ecol. 2011, 20, 1333–1346. [Google Scholar] [CrossRef]
  72. Zhai, D.D.; Wang, D.; He, T.Q.; Cai, F.T.; Duan, X.B.; Hu, X.K.; Zhu, B.; Xie, Z.G.; Xia, M.; Liu, H.Y.; et al. Genetic diversity and population historical dynamics of Ochetobus elongatus in the middle reaches of the Yangtze River. Acta Hydrobiol. Sin. 2024, 48, 1736–1744. (In Chinese) [Google Scholar]
  73. Kelletat, D.H. Pleistocene Epoch. In Encyclopedia of Coastal Science; Finkl, C.W., Makowski, C., Eds.; Encyclopedia of Earth Sciences Series; Springer: Cham, Switzerland, 2019; pp. 1379–1381. [Google Scholar]
  74. Wang, Q.H.; Wu, R.X.; Li, Z.L.; Niu, S.F.; Zhai, Y.; Huang, M.; Li, B. Effects of late Pleistocene climatic fluctuations on the phylogeographic and demographic history of Japanese scad (Decapterus maruadsi). Front. Mar. Sci. 2022, 9, 878506. [Google Scholar] [CrossRef]
  75. Liu, J.X.; Gao, T.X.; Zhuang, Z.M.; Jin, X.S.; Yokogawa, K.; Zhang, Y.P. Late Pleistocene divergence and subsequent population expansion of two closely related fish species, Japanese anchovy (Engraulis japonicus) and Australian anchovy (Engraulis australis). Mol. Phylogenet. Evol. 2006, 40, 712–723. [Google Scholar] [CrossRef]
  76. Han, Z.Q.; Gao, T.X.; Yanagimoto, T.; Sakurai, Y. Deep phylogeographic break among white croaker Pennahia argentata (Sciaenidae, Perciformes) populations in North-western Pacific. Fish. Sci. 2008, 74, 770–780. [Google Scholar] [CrossRef]
  77. Liu, M. Population Genetics of Pacific Herring and Pacific Cod in North Pacific. Ph.D. Dissertation, Ocean University of China, Qingdao, China, 2010. (In Chinese). [Google Scholar]
  78. Zhang, Z.D.; Yang, J.S. A Brief History of Marine Fisheries in China; Ocean Press: Beijing, China, 1983; pp. 5–14. (In Chinese) [Google Scholar]
  79. Brian, F. Fishing: How the Sea Fed Civilization; Yale University Press: London, UK, 2017; pp. 216–290. [Google Scholar]
Figure 1. Sampling map for C. myriaster populations, reprinted from [24]. (DL, WH, RS, QD, RZ, LYG, and ZS stand for the Dalian, Weihai, Rushan, Qingdao, Rizhao, Lianyungang, and Zhoushan populations, respectively.).
Fishes 10 00041 g001
Figure 2. Median-joining networks for Cyt b haplotypes in C. myriaster populations. Each circle represents one unique haplotype, and the circle size represents haplotype frequency. The colored area represents the proportion of the haplotype in each population. The hash marks on a connecting line represent the number of inter-haplotype nucleotide substitutions.
Fishes 10 00041 g002
Figure 3. Neighbor-joining tree of 105 haplotypes based on Cyt b gene sequences of C. myriaster populations. Numbers of nodes are the bootstrap values, and any haplotype with the same color and geometry represents a haplotype unique for the same population.
Fishes 10 00041 g003
Figure 4. DNA sequence mismatch distribution analysis for C. myriaster populations based on Cyt b gene sequences.
Fishes 10 00041 g004
Figure 5. Bayesian skyline plots to estimate the historical demography of C. myriaster populations (the solid lines show median values, and the shaded intervals show the 95% highest posterior density).
Fishes 10 00041 g005
Table 1. Sampling information of C. myriaster in this study, reprinted from [24].
Sampling SitesSea RegionsGeographic CoordinatesSampling DateSample SizeTotal Length (TL)
Range/cmMean ± SD/cm
Dalian (DL)Bohai Sea38°55′ N; 121°37′ EMay 20234033.7–51.745.7 ± 3.9
Weihai (WH)Yellow Sea37°31′ N; 122°7′ ESeptember 20222028.9–36.632.7 ± 2.2
Rushan (RS)36°56′ N; 121°32′ EOctober 20222927.6–45.735.0 ± 4.3
Qingdao (QD)36°4′ N; 120°23′ ESeptember 20224130.6–39.235.0 ± 2.1
Rizhao (RZ)35°25′ N; 119°32′ EAugust 20222533.9–48.438.2 ± 3.3
Lianyungang (LYG)34°36′ N; 119°13′ EApril 20233230.6–50.439.1 ± 3.7
Zhoushan (ZS)East China Sea29°59′ N; 122°12′ EOctober 20223030.6–45.140.8 ± 3.9
Table 2. Genetic diversity indices for different C. myriaster populations.
PopulationSample Size (n)Number of Polymorphic Sites (S)Number of Haplotypes (h)Haplotype Diversity (Hd)Nucleotide Diversity (π)Average Number of Nucleotide Differences (k)
DL4039300.9667 ± 0.0190.00389 ± 0.00224.445 ± 2.2381
WH2022150.9421 ± 0.0430.00368 ± 0.00214.205 ± 2.1792
RS2929190.9507 ± 0.0240.00357 ± 0.00214.074 ± 2.0916
QD4134280.9512 ± 0.0230.00372 ± 0.00214.250 ± 2.1512
RZ2519140.8133 ± 0.0800.00279 ± 0.00173.180 ± 1.7012
LYG3235200.9073 ± 0.0410.00388 ± 0.00224.423 ± 2.2406
ZS3025200.9471 ± 0.0270.00317 ± 0.00183.621 ± 1.8881
Total2171051050.9338 ± 0.0130.00354 ± 0.00204.047 ± 2.0281
Table 3. Genetic distance based on the K2P model (below the diagonal) and pairwise FST (above the diagonal) of C. myriaster populations.
PopulationDLWHRSQDRZLYGZS
DL0.01908
(0.90918)
−0.00067
(0.35254)
−0.01079
(0.82617)
−0.01630
(0.88379)
0.00008
(0.35449)
−0.00660
(0.56055)
WH0.003730.00164
(0.32129)
−0.01906
(0.87793)
−0.02659
(0.92969)
0.00151
(0.34570)
−0.01083
(0.56445)
RS0.003740.00364−0.01010
(0.68848)
0.01114
(0.22949)
−0.01836
(0.98438)
−0.01551
(0.80566)
QD0.003780.003650.00362−0.00913
(0.59570)
−0.00632
(0.54395)
−0.01011
(0.67871)
RZ0.003300.003160.003230.003240.01335
(0.18848)
−0.00713
(0.48828)
LYG0.003900.003800.003670.003790.00339−0.01094
(0.65918)
ZS0.003530.003400.003330.003430.002970.00350
Note: p-values are in parentheses.
Table 4. Analysis of molecular variance (AMOVA) for Cyt b sequences in C. myriaster populations.
Packet TypeSource of Variationd.f.Sum of SquaresVariance ComponentPercentage of VariationΦST
Seven populationsAmong populations69.3400−0.01642 Va−0.80−0.00803
(p = 0.86208)
Within populations210432.9002.06143 Vb100.80
Total216442.2402.04501
Three groupsAmong groups22.656−0.00513 Va−0.25−0.00911
(p = 0.86079)
Among populations within groups46.684−0.01348 Vb−0.66
Within populations210432.9002.06143 Vc100.91
Total216442.2402.04282
Table 5. Statistical tests for the neutrality of C. myriaster populations based on Cyt b sequences.
TestDLWHRSQDRZLYGZSTotal
Tajima’s D−1.80828−1.23315−1.62576−1.61079−1.32344−1.77369−1.51744−2.37500
Tajima’s D p-value0.0190.1010.0450.0340.0770.0160.0360.000
Fu’s Fs−25.22147−7.80182−10.51011−21.73441−6.16888−10.09990−13.17388−25.55153
Fu’s Fs p-value0.0000.0010.0000.0000.0000.0000.0000.000
Disclaimer/Publisher’s Note: The statements, opinions and data contained in all publications are solely those of the individual author(s) and contributor(s) and not of MDPI and/or the editor(s). MDPI and/or the editor(s) disclaim responsibility for any injury to people or property resulting from any ideas, methods, instructions or products referred to in the content.

