Article

Substituting Fishmeal with Bacillus licheniformis-Fermented Fish By-Products Protein Hydrolysates in Nile Tilapia Diet (Oreochromis niloticus): Impacts on Growth Performance, Humoral Immunity, Oxidative Defense, and Digestive Enzymes

by
Faezeh Taghizadeh Tabasi
1,
Omid Safari
1,*,
Mehrdad Sarkheil
1,
Najme Gord Noshahri
2 and
Marina Paolucci
3
1
Department of Fisheries, Faculty of Natural Resources and Environment, Ferdowsi University of Mashhad, Mashhad P.O. Box 91773-1363, Iran
2
Industrial Microbial Biotechnology Department, Research Institute for Industrial Biotechnology, Academic Center for Education, Culture, and Research (ACECR)-Khorasan Razavi Province, Mashhad P.O. Box 91775-1376, Iran
3
Department of Sciences and Technologies, University of Sannio, 82100 Benevento, Italy
*
Author to whom correspondence should be addressed.
Fishes 2025, 10(11), 556; https://doi.org/10.3390/fishes10110556
Submission received: 13 August 2025 / Revised: 20 October 2025 / Accepted: 29 October 2025 / Published: 3 November 2025

Abstract

This study was conducted in two phases: first, to assess the impact of microbial fermentation on enhancing the nutritional quality of fish by-products, and second, to evaluate the effects of replacing fishmeal with these fermented by-products in the diet of Nile tilapia (Oreochromis niloticus) on growth performance, blood parameters, antioxidant indices, immunity, digestive enzyme activity, and carcass composition. In the initial phase, proteolytic activity of five bacterial strains including Bacillus subtilis (ATCC: 6051), B. licheniformis (IBRCM: 10204), Lactiplantibacillus plantarum (PTCCs: 1058 and 1745), and Lactobacillus casei (PTCC: 1608) was evaluated using growth assays in skimmed milk culture media and analyzed using Image-J software. B. licheniformis exhibited the highest proteolytic activity and was selected for fermentation. Resulting hydrolyzed proteins were characterized by peptides with molecular weights below 11 kDa. In the second phase, fishmeal was replaced with fermented by-products at five levels (0 (control), 25, 50, 75, and 100%). Two hundred ten Nile tilapia with an average weight of 2.83 ± 0.05 g were stocked in fifteen 200 L plastic tanks at three replicates, with 14 fish per tank, and fed daily at a rate of 7% of their body weight for 63 days. With increasing levels of fishmeal replacement (25% to 75%), significant improvements (p < 0.05) were observed in final weight gain, body weight gain, specific growth rate, protein production value, and protein efficiency ratio. Additionally, blood plasma concentrations of hormones T3 and T4, immunoglobulin level, the activities of complement (ACH50), and antioxidant enzymes (catalase and superoxide dismutase) increased significantly in fish fed the diets with fermented by-products compared to those of the control diet (p < 0.05). The optimal replacement levels for specific growth rate and feed conversion ratio were identified as 86.28% and 83.91%, respectively.
Key Contribution: Bacillus licheniformis-fermented fish by-products can generate hydrolysates with peptides < 11 kDa, enabling effective replacement of fishmeal in Nile tilapia diets. Substituting fermented by-products at 25–75% levels enhances growth performance, PER, and PPV. Optimal replacement levels for production efficiency are approximately 86.3% for specific growth rate and 83.9% for feed conversion ratio, indicating substantial potential for partial to near-complete fishmeal substitution with fermented by-products in Nile tilapia on growth and health indices.

1. Introduction

Aquaculture has emerged as a pivotal strategy for global food security, experiencing substantial growth from 14.9 million tons in 1986 to 87.5 million tons in 2020 [1]. Among cultured fish species, Nile tilapia (O. niloticus) stands out, ranking third in global production with 4407.2 thousand tons produced in inland waters [2]. Owing to its rapid growth rate, high protein content, and economic viability, Nile tilapia has become a cornerstone of freshwater aquaculture and is poised to be a primary source of animal protein in the future [3].
Approximately 70% of aquatic animals are processed into waste, including heads, skin, fins, scales, viscera, and entrails, resulting in significant environmental damage. The considerable value of these by-products is also frequently overlooked [4]. Aquatic animal waste is a valuable source of bioactive compounds such as proteins, fish oil, carotenoids, caroteno proteins, and polysaccharides like chitin and chitosan [5,6]. However, fish by-products are not a suitable raw material for conversion into fishmeal due to their low quality and limited shelf life, deterring producers from utilizing it [7]. Sustainable aquaculture requires high-quality protein sources, and fishmeal derived from marine fish has traditionally been considered the most effective option [2]. Overfishing has led to ecological and environmental consequences, raising concerns about sustainability within the aquaculture industry [8,9]. The increasing demand for fishmeal has prompted research into identifying alternative protein sources [2,10]. Notably, official statistics from the Food and Agriculture Organization in 2020 indicate that 27% of fishmeal and 48% of fish oil were derived from fish waste [2].
In recent years, the utilization of biological methods, such as fermentation, for the conversion of waste materials into value-added products has garnered considerable attention from researchers. Fermentation, based on moisture content and the type of microorganism employed, is classified into two primary categories: solid-state fermentation and submerged fermentation. Fermentation has been recognized as an effective technique for the production of bioactive peptides, wherein bacteria facilitate the hydrolysis of proteins into smaller peptide units [11]. Microbial proteases are predominantly synthesized during submerged fermentation, with comparatively lower yields observed in solid-state fermentation, typically during the growth phase, specifically post-exponential or stationary phases. Submerged fermentation is often preferred due to its ease of engineering, uniform distribution of microbial cells within the culture medium, and reduced fermentation time. The judicious selection of both the enzyme-inducing substrate and the microbial strain is deemed essential for the efficient production of the desired product [12]. Probiotic bacterial species, including various Bacillus spp., such as B. subtilis [13] and B. licheniformis [14], as well as Lactobacillus spp., encompassing L. plantarum [15] and L. casei [16], have been effectively utilized in the fermentation of fish waste.
Among the key advantages of fermentation is the enhancement of antioxidant peptide efficacy, which, in conjunction with glutathione (GSH), provides protection against oxidative stress-induced damage [17]. Investigation into the antioxidant and antimicrobial properties of Sardinella aurita fish fermented with B. subtilis revealed that the isolated fermented protein exhibited significant antimicrobial activity against a broad spectrum of Gram-positive bacteria, as well as desirable antioxidant activity against oxidation and free radicals [13]. Furthermore, peptides derived from fermentation processes demonstrate potent antioxidant and antimicrobial properties. For instance, two peptides obtained from fermented anchovy, with sequences PQLLLLLL and LLLLLLL, exhibit strong antioxidant activity [18]. In another study, fermentation of Indian carp head with lactic acid bacteria demonstrated both antioxidant and antimicrobial activities [19].
Despite the growing interest in sustainable aquafeed alternatives, data on the use of fermented Nile tilapia by-products in fish diets remain scarce. However, the beneficial effects of incorporating fermented feed ingredients on fish growth performance have been well-documented. Previous studies have demonstrated significant improvements using various substrates fermented with microbial agents such as Saccharomyces cerevisiae, Bacillus subtilis, and Aspergillus oryzae including soybean meal [20,21], sunflower meal [22], date palm seed meal [23], olive cake [24], wheat bran [25], and Spirulina platensis [26]. These findings highlight the potential of microbial fermentation to enhance the nutritional quality and functional value of unconventional feed resources. The improvement in growth performance is likely attributed to the enhanced amino acid composition and protein content, as well as the reduction of anti-nutritional compounds, crude fiber, cellulose, and non-starch polysaccharides as a result of the fermentation process [27]. Various microorganisms (Bacillus sp., Lactobacillus sp., Saccharomyces sp.) have been employed for the production of a wide range of microbial metabolites such as enzymes, amino acids, bacteriocins, organic acids, pigments, polyphenols, and vitamins. Such metabolites are beneficial for the health of the animal’s gut or digestive system and improve the activity of digestive enzymes as well as the nutritional value of raw materials. In addition, various enzymes such as proteinase, amylase, cellulase, and catalase are produced by these microbes, which break down large compounds into simpler biomolecules, thereby improving growth performance in fish.
In summary, it can be stated that the fermentation process is contingent upon the number and type of microbial strain (bacteria and fungi), inoculum concentration, and the physical and chemical factors of the fermentation environment (fermentation time, temperature, concentration, and initial pH of the culture medium). The proximate composition of fish waste is also dependent on the fish processing method (manual vs. mechanical), species type, fishing season, and the type of fish feed. Limited information is available regarding the fermentation of waste generated in the tilapia farming industry and its utilization in the aquaculture feed sector. It appears that fermented products, due to improved digestion and absorption processes, lead to enhanced growth performance and other hematological and immunological responses. However, these effects are also dependent on the fish species, diet (herbivorous, carnivorous, omnivorous), and the specific biological responses assessed. In this context, the fermentation of Nile tilapia waste with Bacillus licheniformis bacteria has not yet been investigated.
Alternative protein sources to fishmeal in aquafeed diets should possess high protein content and essential amino acid profiles, while minimizing non-starch polysaccharides, fiber, particularly insoluble carbohydrates, and anti-nutritional compounds. They should also exhibit palatability and high digestibility. This research aims to investigate the effect of submerged fermentation on the protein and chemical composition of Nile tilapia (Oreochromis niloticus) waste and to evaluate the impact of replacing fishmeal with fermented protein derived from this waste on growth performance and hematological parameters in Nile tilapia. The partial replacement of fishmeal with fermented protein in the aquafeed industry can significantly contribute to improving the economic and environmental sustainability of the aquaculture sector.

2. Materials and Methods

This research was conducted in two phases: an in vitro experiment (Experiment 1) and an in vivo experiment (Experiment 2). Experiment 1 aimed to evaluate the impact of microbial fermentation on improving the nutritional value of fish waste and the resulting hydrolyzed protein. Experiment 2 was designed to investigate the effects of replacing fishmeal with fermented protein derived from this waste in the diet on growth performance, hematological parameters, antioxidant and immune indices, and digestive enzyme activity, as well as the chemical composition of the carcass in Nile tilapia.

2.1. Preparation of Microorganisms and Investigation of Protease Properties

Five lyophilized bacterial strains—Bacillus subtilis (ATCC 6051), B. licheniformis (IBRCM 10204), Lactiplantibacillus plantarum subsp. plantarum (PTCC 1058), L. plantarum subsp. plantarum (PTCC 1745), and Lactobacillus casei (PTCC 1608)—were sourced from the Iranian Microbial Resources Center and the Microbial Bank (Tehran, Tehran Province, Iran). Strains were activated in MRS and LB media (Merck®, Darmstadt, Germany) for Lactobacillus sp. and Bacillus sp., respectively, per manufacturer instructions. Protease activity was assessed using skim milk agar with trypan blue; clear halos indicated proteolytic capability [28,29]. Lactobacillus spp. protease activity was evaluated in a modified MRS medium replacing meat extract and peptone with skim milk. B. licheniformis demonstrated the highest halo-to-colony diameter ratio and was selected for fish waste fermentation.

2.1.1. Submerged Fermentation of Fish By-Product

The tilapia by-products were sourced from a fish processing and sales market, specifically from Nile tilapia fish raised for aquaculture, weighing between 600 to 800 g in Mashhad (Khorasan Razavi Province, Iran) and stored at −20 °C in a freezer for next experiments. Initially, the fish by-product, including heads, tails, skin, fins, scales, and vertebrae (excluding intestine and viscera), was thoroughly minced using an industrial meat grinder (Ebtekar Steel®, Isfahan, Isfahan Province, Iran). Subsequently, water was added at a ratio of 20% w/v, and the mixture was heated at 120 °C for 15 min to autoclave and remove fats. The mixture was then dried in a vacuum oven (SDR-0121®, Isfahan, Isfahan Province, Iran) at 60 °C for 24 h. Finally, the dried material was completely powdered using an electric grinder (Zisko®, Hartmannsdorf, Germany). The fermentation medium, consisting of 1% glucose, 0.5% sodium chloride, and 10% dried fish waste, was prepared. The initial pH of the medium was in the range of 7.2 ± 0.1 using a calibrated pH meter (Ohaus ST 2200 F, Shanghai, Chaina). The prepared basal medium was autoclaved at 121 °C for 15 min. The spectrophotometric absorbance of B. licheniformis at OD600 was read at 0.5 using a Nano Drop spectrophotometer (Bio Tec®, San Diego, CA, USA). Subsequently, a 5% bacterial inoculum was introduced into the culture medium under a laminar flow hood (Zhal Tajhiz®, Tehran, Tehran Province, Iran) and incubated at 35 °C with shaking at 150 rpm. Samples were collected from the culture medium at 0, 24, 48, and 72 h during the fermentation process. Additionally, a sterile medium blank was included for background correction. Finally, the fermented fish waste was dried in a vacuum oven (SDR0121, Isfahan, Isfahan Province, Iran) at 60 °C for three days.

2.1.2. Bacterial Growth During Fermentation

Bacterial population during fermentation was determined using the colony counting method. Following the enumeration of colonies on each plate, the resulting count was multiplied by the dilution factor, and the result was reported as the number of colony forming units per ml of the sample [30].
The present study focused on the nutritional/functional evaluation of batch-fermented products intended for use in aquaculture feeds. Safety assessments specific to downstream production-scale safety, including comprehensive pathogen screening and mycotoxin risk assessment, were beyond the scope of this investigation. All fermentation was conducted under controlled laboratory conditions with defined starter cultures and verified sterile handling procedures to minimize contamination risk (ACECR, Mashhad, Khorasan Razavi Province, Iran).

2.1.3. Soluble Protein Assay

To prepare samples for soluble protein concentration measurement, 200 μL of supernatant from the culture medium at various time points (blank, 24, 48, and 72 h) were mixed with 200 μL of trichloroacetic acid (Merck®, Darmstadt, Germany) and incubated at room temperature for 20 min. Subsequently, the supernatant was separated by centrifugation (Hermle, Gosheim, Germany) at 10,000 rpm for 10 min. The soluble protein concentration resulting from bacterial activity was determined using the Bradford method [31].
To determine the molecular weight of the hydrolyzed protein, protein analysis was performed on a polyacrylamide gel fish during the fermentation process. The approximate molecular weight of the peptides resulting from the breakdown of waste protein was determined using a pre-stained protein weight marker (SinaClon Co., Tehran, Tehran Province, Iran; Cat. No: SL7001) in the range of 10–250 kDa.

2.2. Conditions of Experimental Treatments

A basal diet containing 377.1 g kg−1 crude protein, 100.8 g kg−1 crude fat, and 448.8 g kg−1 carbohydrates [32] was formulated using several locally available feed ingredients (e.g., fishmeal, soybean meal, wheat flour, corn flour, and corn gluten meal). Fermented by-product protein was substituted for fishmeal protein in the control diet at four levels: 25, 50, 75, and 100% (Table 1). Considering the low protein content of fermented tilapia waste compared to fish meal, carboxymethyl cellulose (CMC) was used as a filler in the range of 5–36 g kg−1 (Table 1). In this study, a total of five dietary treatments, each at three replicates, were used.

2.2.1. Feeding Trial

All procedures in this study were conducted in accordance with the ethical guidelines of the Ferdowsi University of Mashhad’s Institutional Animal Care and Use Committee, under the code IR.UM.REC.1401.142. Two hundred ten mixed-sex Nile tilapia (O. niloticus) fish with an average weight of 2.83 ± 0.05 g were obtained (Shahrood, Semnan Province, Iran) and transported to the laboratory (Aquatics Lab, FUM, Mashhad, Khorasan Razavi Province, Iran). The fish were acclimated for two weeks in a 500 L tank and fed with a control diet. Subsequently, they were randomly distributed into fifteen 200 L tanks at a stocking density of 14 fish per tank at three replicates. The fish were fed with the experimental diets four times a day (8:00, 10:00, 12:00, and 16:00) at a rate of 7% of their body weight for 63 days. To correct consumed feed content, the remaining feed was siphoned 2 h after feeding, oven-dried, and weighed daily. Biometric measurements of the test fish were performed every 21 days to adjust the subsequent feeding rate. Daily, 25% of the water in the rearing tanks was replaced with fresh and aerated water.
During the feeding trial, water quality parameters (mean ± standard deviation) were monitored. Physical and chemical water quality parameters, including temperature (daily), dissolved oxygen, electrical conductivity (EC), and pH (weekly until the end of the experiment), were measured using a portable meter (model AZ-860, Taichung, Taiwan). Measurements were performed using a spectrophotometer (model DR 5000TM, Loveland, CO, USA) at wavelengths of 425 and 500 nm. Total ammonia nitrogen (TAN) and nitrite concentrations in the water used for rearing Nile tilapia were measured at the start of the experiment in triplicate using the Nessler and cadmium reduction methods, respectively. The measured values were as follows: total ammonia nitrogen (TAN), 0; nitrite, 3.26 ± 0.081 mg L−1; water temperature, 28.3 ± 1.5 °C; dissolved oxygen, 6.11 ± 0.11 mg L−1; pH, 7.88 ± 0.008; and electrical conductivity, 1105.77 ± 9.83 μS cm−1. These values were maintained within the acceptable range for Nile tilapia [33].

2.2.2. Biological Indices

Growth indices, nutritional efficiency indices, hepatosomatic indices, and viscerosomatic indices were calculated based on standard formulas as follows [34]:
Weight gain (WG, g) = Final body weight (FBW, g) − initial body weight (IBW, g)
Specific growth rate (SGR; % BW day−1) = 100 × [(LnWf − LnWi)/time (day)]
Feed conversion ratio (FCR) = Feed given (g)/Weight gain (g)
Condition factor (K; %) = (Wf (g)/Lf 3 (cm)) × 100
Protein effciency ratio (PER) = (Wf(g) − Wi (g))/Crude protein intake (g)
Protein productive value (PPV; %) = (Whole-body protein gain (g))/Protein consumption (g)) × 100
Hepatosomatic index (HSI; %) = (Hepatopancreas weight (g)/total body weight (g)) × 100
Viscerosomatic index (VSI; %) = (Viscera weight (g)/total body weight (g)) × 100

2.2.3. Blood Sampling

After the feeding trial period, the fish were fasted for 24 h and then randomly sampled. After anesthetizing the fish with clove oil (0.5 mg L−1; Clove Aqua®, Imad Khorasani aquaculture cooperative, Mashhad, Khorasan Razavi Province, Iran), blood samples were collected from the caudal peduncle (nine fish per treatment) using 25 heparinized syringes one by one without pooling. Following centrifugation (5000 rpm for 10 min), the resulting plasma was transferred to a −80 °C freezer [35]. The concentrations of triiodothyronine (T3) and thyroxine (T4) and immune parameters levels, including lysozyme activity, complement (ACH50), and total immunoglobulin were measured in the fish plasma as described below.
Thyroid hormone (T3 and T4) concentrations were measured using a MY BioSource kit (San Diego, CA, USA) and ELISA method in blood plasma at wavelengths of 450 and 600 nm, respectively [36]. Lysozyme activity was measured using a MY BioSource assay kit (CA, USA) via ELISA at a wavelength of 450 nm. Complement (ACH50) levels were determined based on the method described [37], using a MY BioSource assay kit (CA, USA) and ELISA at a wavelength of 414 nm. Total immunoglobulin level was assessed following the method described [38], using a MY BioSource assay kit (CA, USA) at a wavelength of 450 nm.

2.2.4. Measuring the Enzyme Activities of Hepatopancreas Tissue

After a 24 h fasting prior to sampling, the experimental fish was fainted deeply in clove oil (0.5 mg L−1; Clove Aqua®, Imad Khorasani aquaculture cooperative, Mashhad, Khorasan Razavi Province, Iran). Then, the hepatopancreas tissue of nine fish per treatment was homogenized in phosphate buffer solution (Merck®, Darmstadt, Germany) using a homogenizer one by one without pooling in order to assess the antioxidant indices of catalase and superoxide dismutase, as well as the enzymes aspartate aminotransferase and alanine aminotransferase. Following centrifugation and separation of the supernatant, catalase enzyme activity was measured using a MY BioSource kit (CA, USA) at a wavelength of 450 nm, based on the method described [39]. Superoxide dismutase enzyme activity was measured using a MY BioSource kit (CA, USA) at a wavelength of 570 nm, following the methods described [40,41] Aspartate aminotransferase and alanine aminotransferase enzyme activities were measured using a MY BioSource kit (CA, USA) at a wavelength of 450 nm, according to the methods described [42,43].

2.2.5. Measuring Digestive Enzyme Activities

Experimental fish were fasted for 24 h prior to sampling and fainted deeply in clove oil (0.5 mg L−1; Clove Aqua®, Imad Khorasani aquaculture cooperative, Mashhad, Khorasan Razavi Province, Iran). Then, foregut tissue (nine fish per treatment) was excised and homogenized in a 0.2 M NaCl solution (Merck®, Darmstadt, Germany) using a homogenizer. The resulting supernatant was stored at −80 °C until analysis [44]. Enzyme activity was expressed as milligrams per unit. Protease activity was evaluated using azocasein as substrate at 366 nm [45]. Amylase activity was measured using a MY BioSource kit with starch as a substrate [46] at 450 nm. Lipase activity was measured using α-naphthyl caprylate as substrate at final reading 540 nm [47].

2.2.6. Proximate Chemical Composition

The proximate chemical composition of the feedstuffs, experimental diets, and initial and final fish carcasses were determined at triplicate (nine fish per treatment) using standard methods [48]. The analysis of dry matter (oven drying, 105 °C), crude protein (N × 6.25, Kjeldahl system: Buchi Labortechnik AG, Flawil, Switzerland), crude fat (Soxhlet system HT 1043: Foss Tecator, AB, USA), crude fiber (after digestion with H2SO4 and NaOH) was determined using a Fibertec apparatus and ash content by incineration in an electric furnace at 550 °C.

2.2.7. Statistical Analysis

All samplings were determined using a simple random sampling method [49]. Data were presented as mean ± standard deviation (SD). Statistical analysis was performed using SPSS version 22. Following confirmation of the two main assumptions of parametric tests (homogeneity of variance and normality of data) [50], one-way ANOVA was used to assess the main effects. Differences between means were determined using Duncan’s multiple range test at a significance level of 5%. Graphs were generated using Excel 2010.

3. Results

3.1. Protease Halo and Colony Diameter

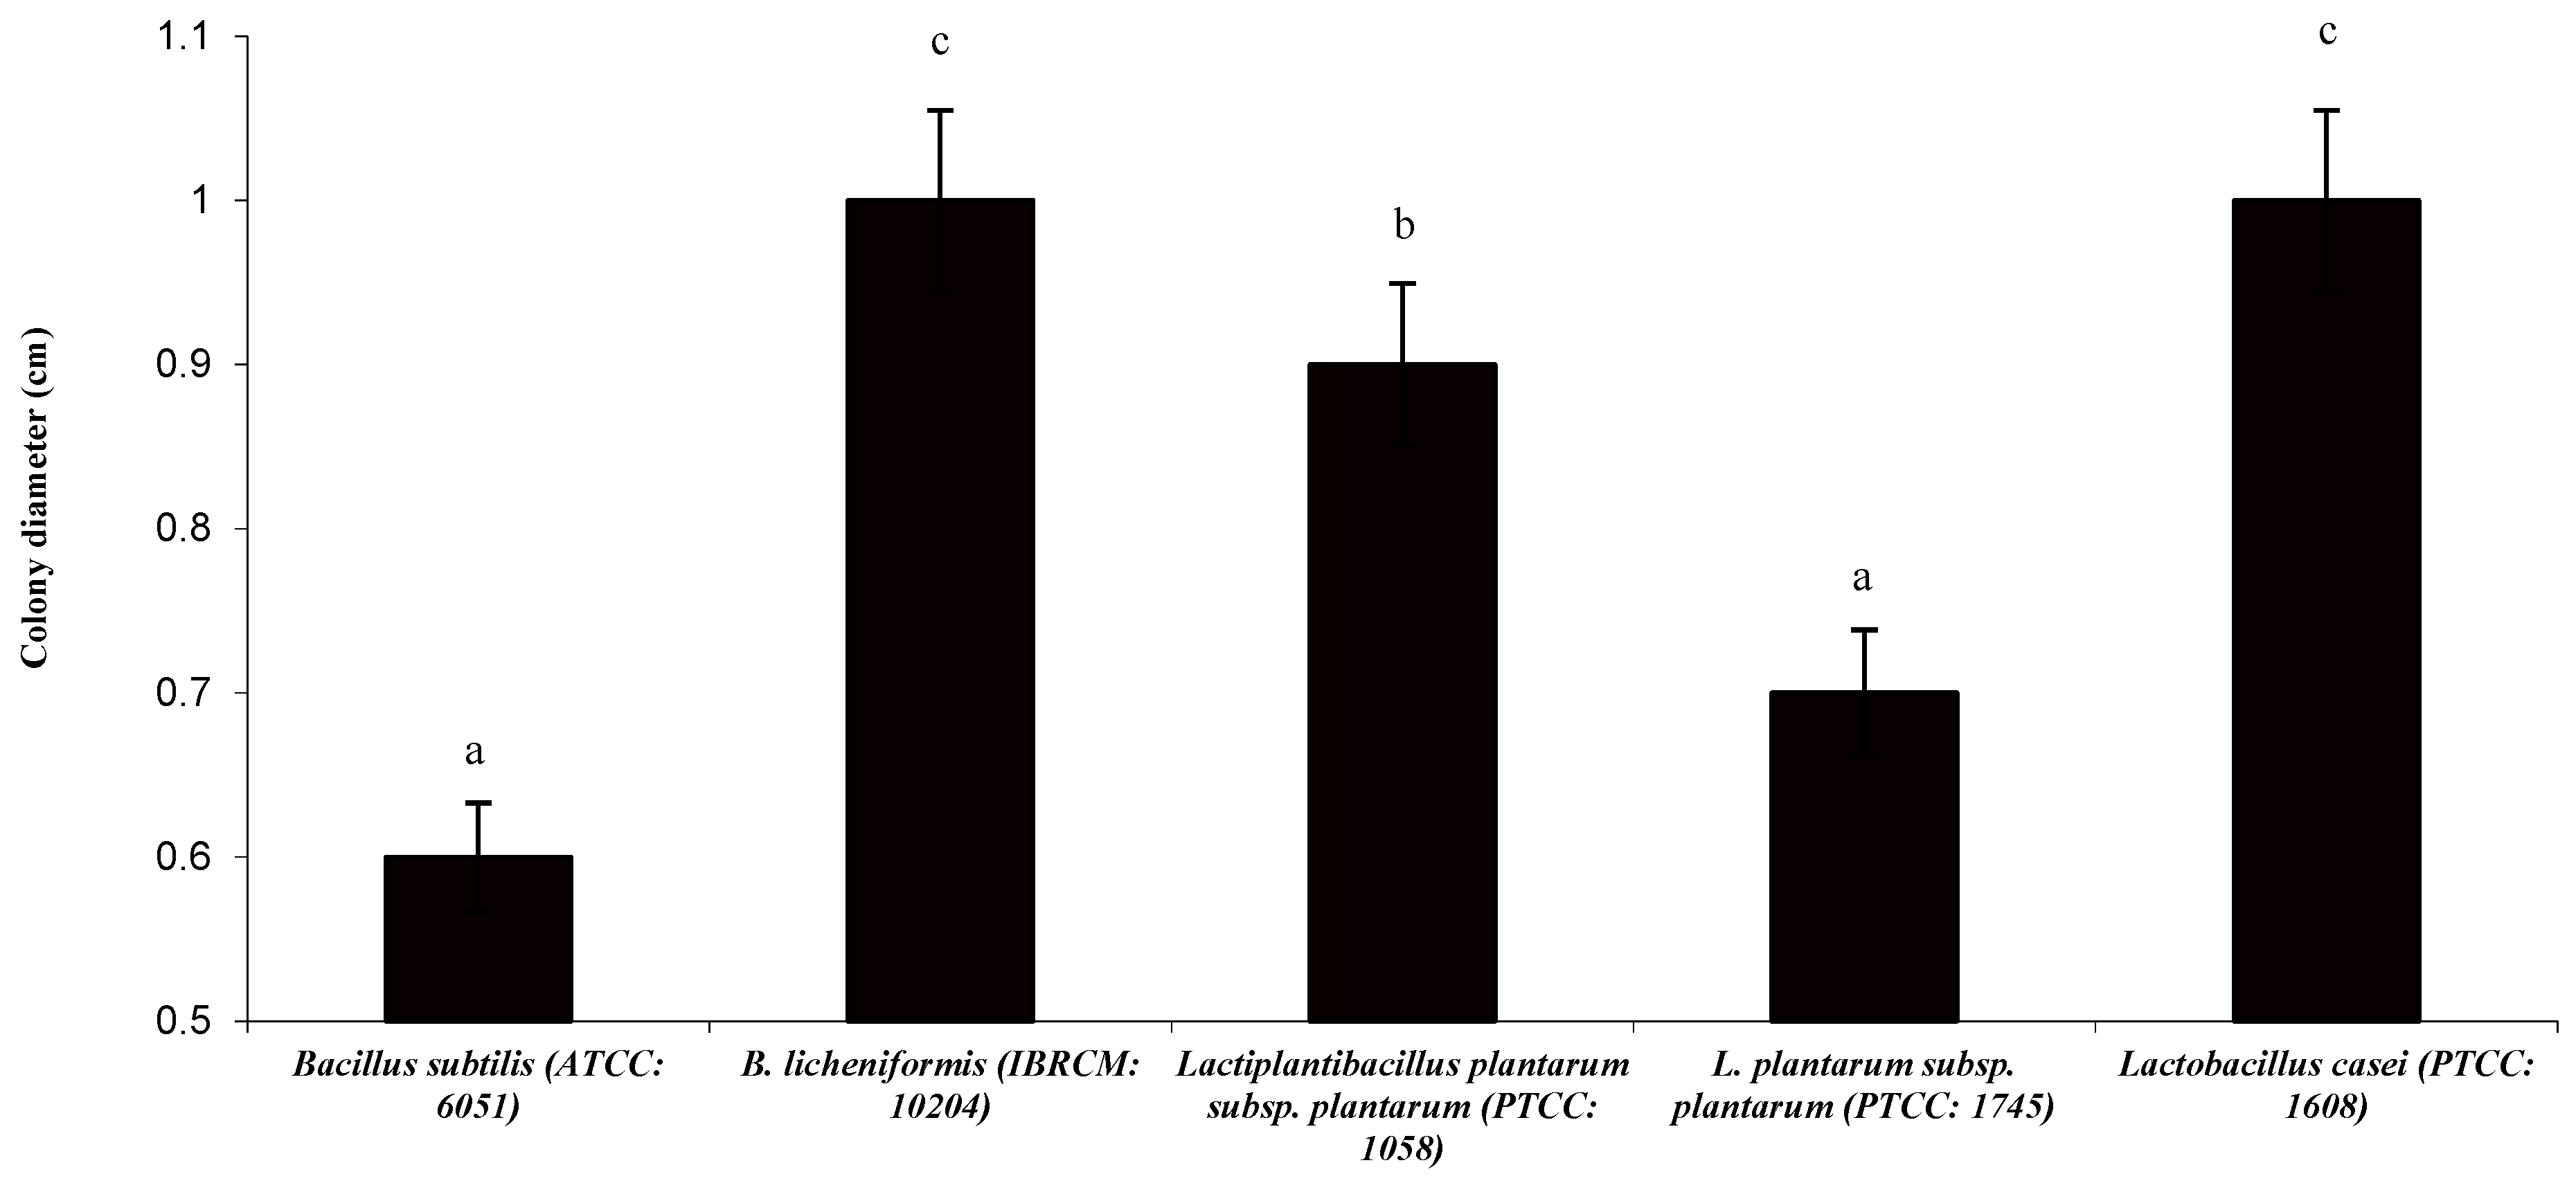
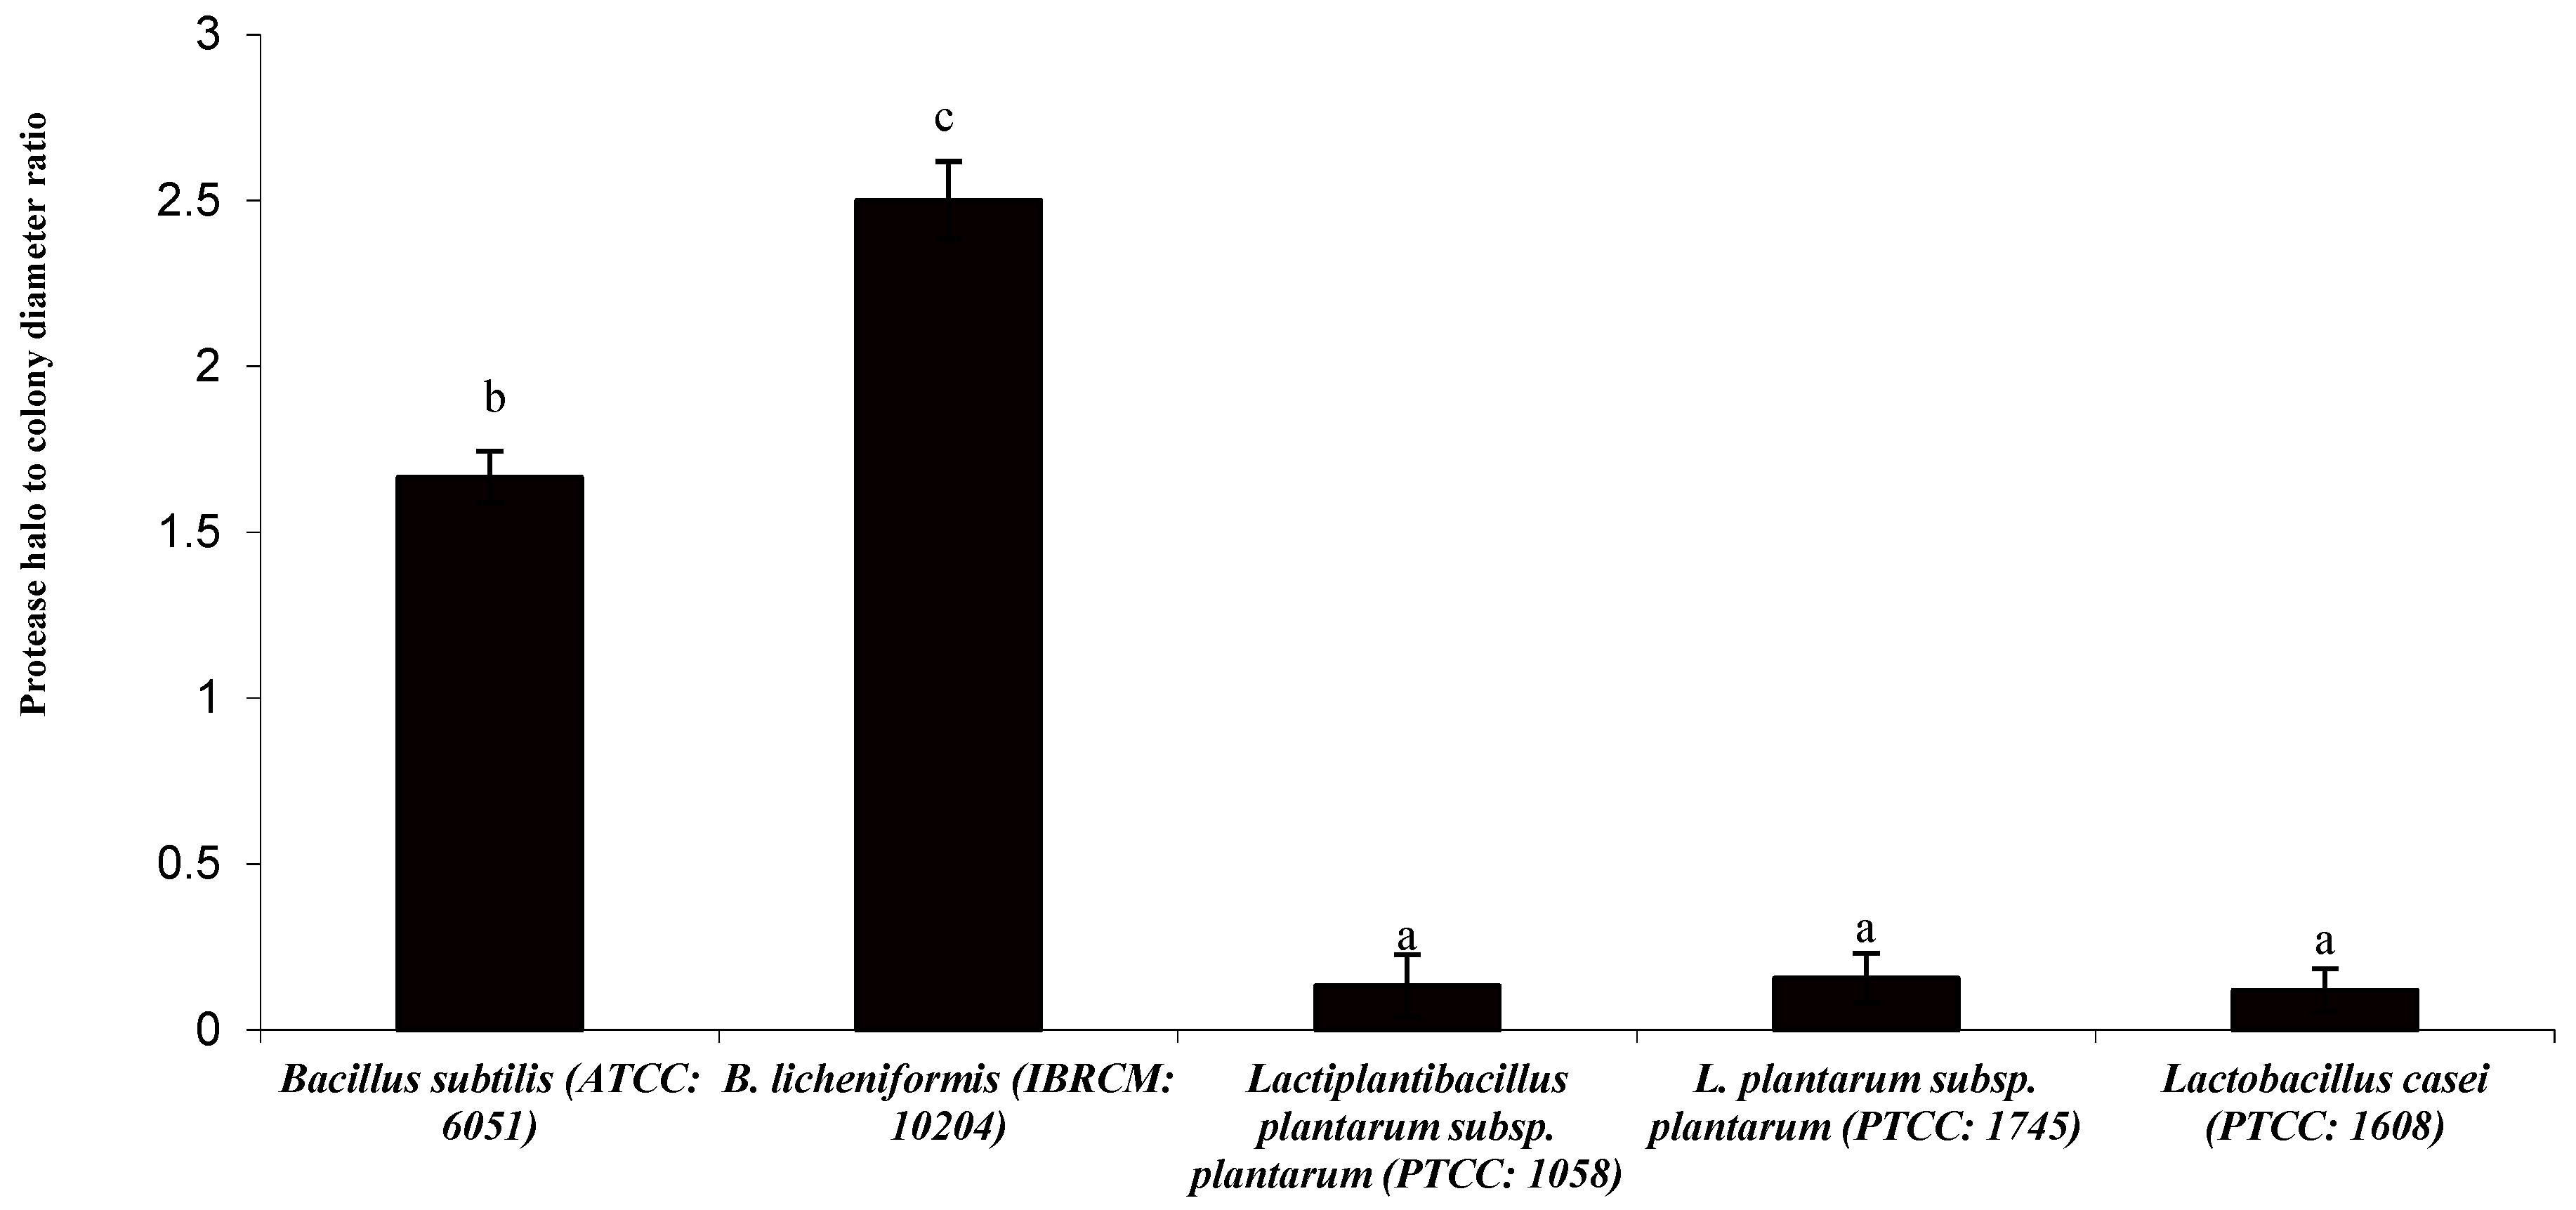
According to Figure 1, B. licheniformis showed the highest protease halo diameter (p < 0.05). The highest colony diameter belonged to the B. licheniformis and L. casei (Figure 2) (p < 0.05). The highest ratio of protease halo to colony diameter was observed in B. licheniformis (Figure 3) (p < 0.05).

3.2. Soluble Protein Concentration and Bacterial Growth

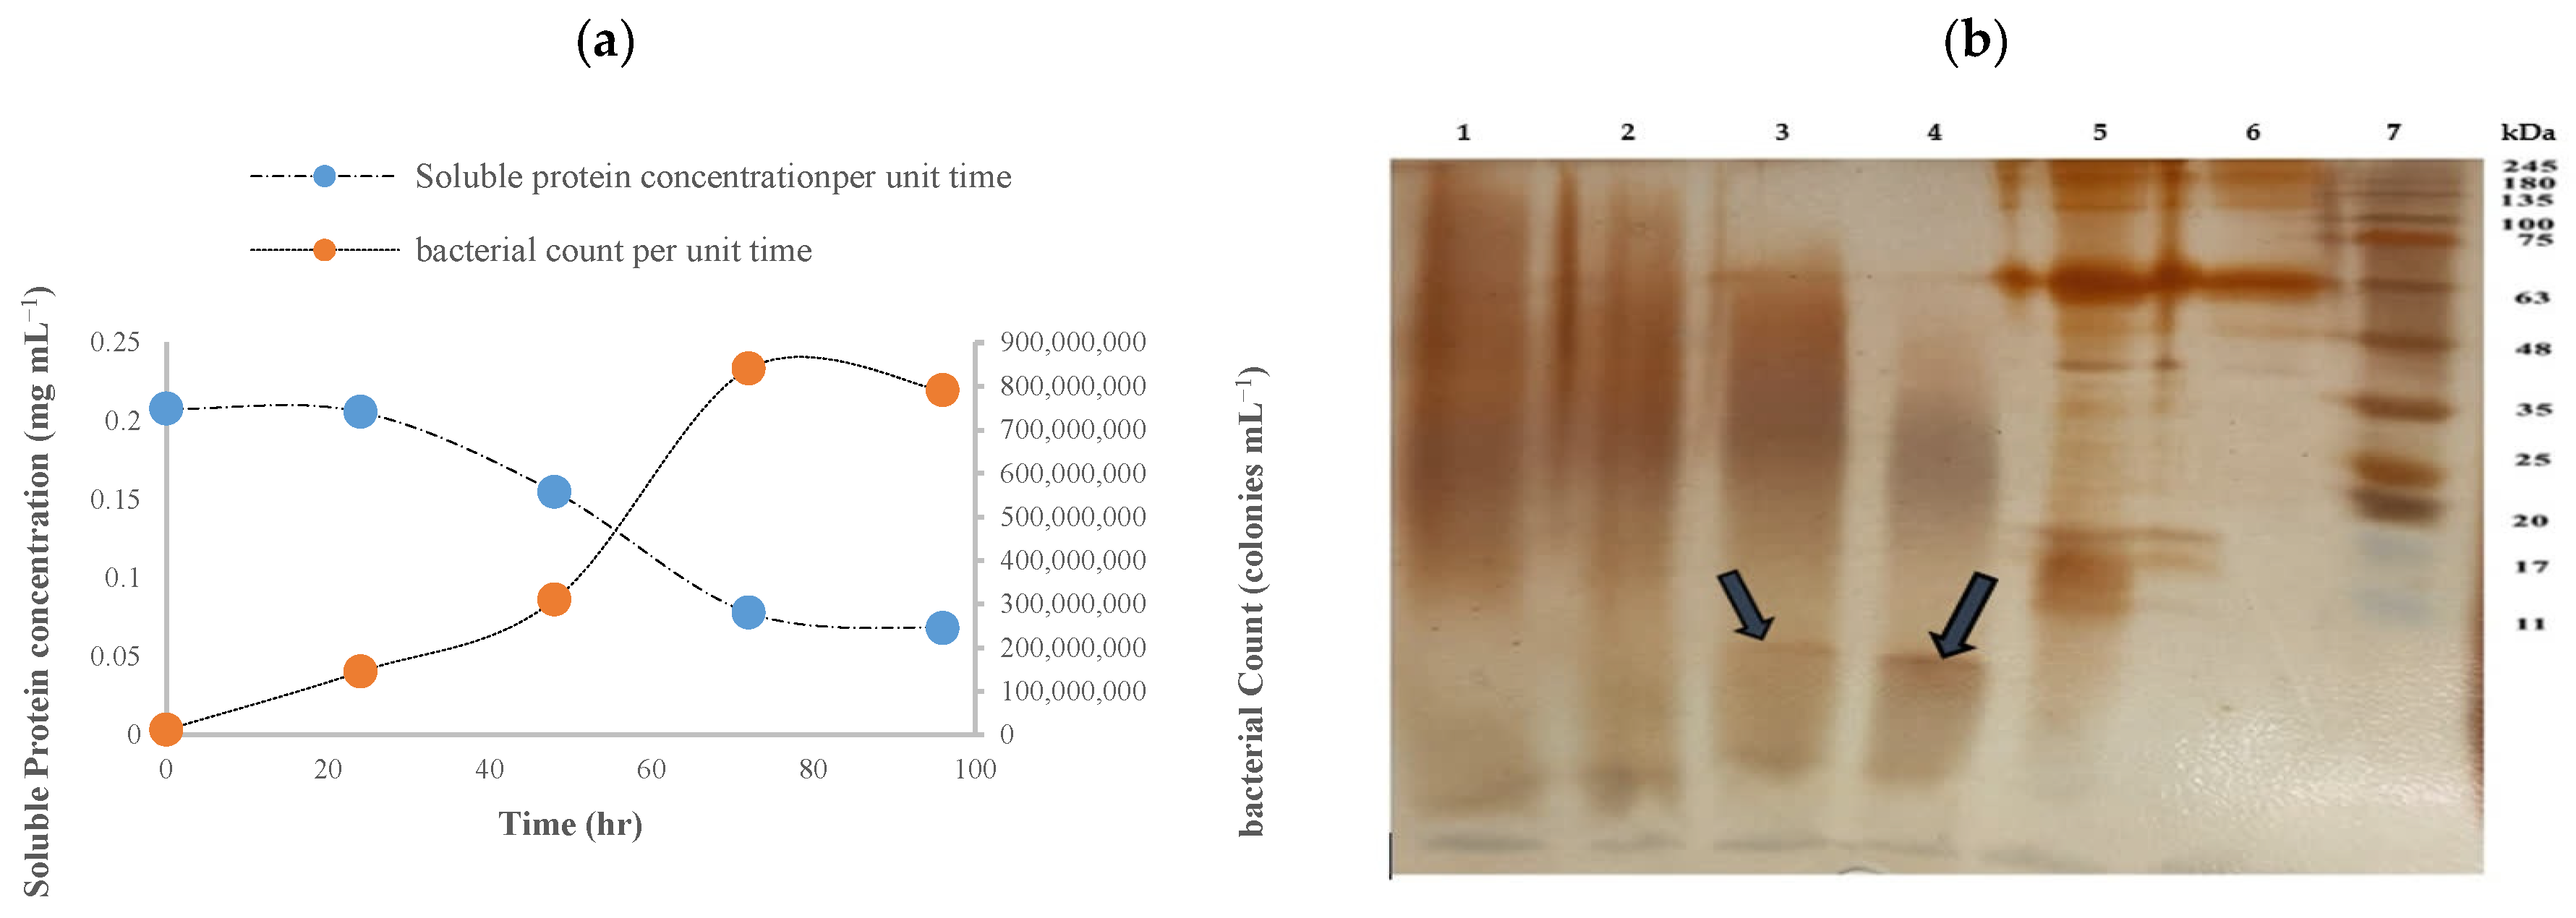
As shown in Figure 4a, the soluble protein concentration (mg mL−1) and bacterial colony count over time (h) during fermentation at blank, 24, 48, 72, and 96 h are presented. The soluble protein concentration decreases with increasing bacterial colony count. Considering the increase in bacterial colony count from 0 (Immediately after bacterial inoculation) to 72 h and the decrease from 72 to 96 h during fermentation, 72 h was selected as the optimal time for mass production of the fermented product (Figure 4a).

3.3. Polyacrylamide Gel Electrophoresis of Soluble Protein

To investigate the effect of fermentation with B. licheniformis on the molecular weight of hydrolyzed protein, polyacrylamide gel electrophoresis was performed. Figure 4b showed the protein bands resulting from the fermentation of fish by-product with B. licheniformis at blank, 24, 48, and 72 h during fermentation. With increasing fermentation time, more protein is broken down into peptides. At 48 and 72 h post fermentation, protein bands of lower than 11 kDa were observed. Crude protein, ether extract, and ash contents of Nile tilapia by-product were measured 336.12, 446.54, and 64.86 g kg−1, respectively. B. licheniformis fermented by-product contained 576.1 g kg−1 crude protein, 50.4 g kg−1 ether extract, and 87.12 g kg−1 ash.

3.4. Growth Performance and Carcass Chemical Composition

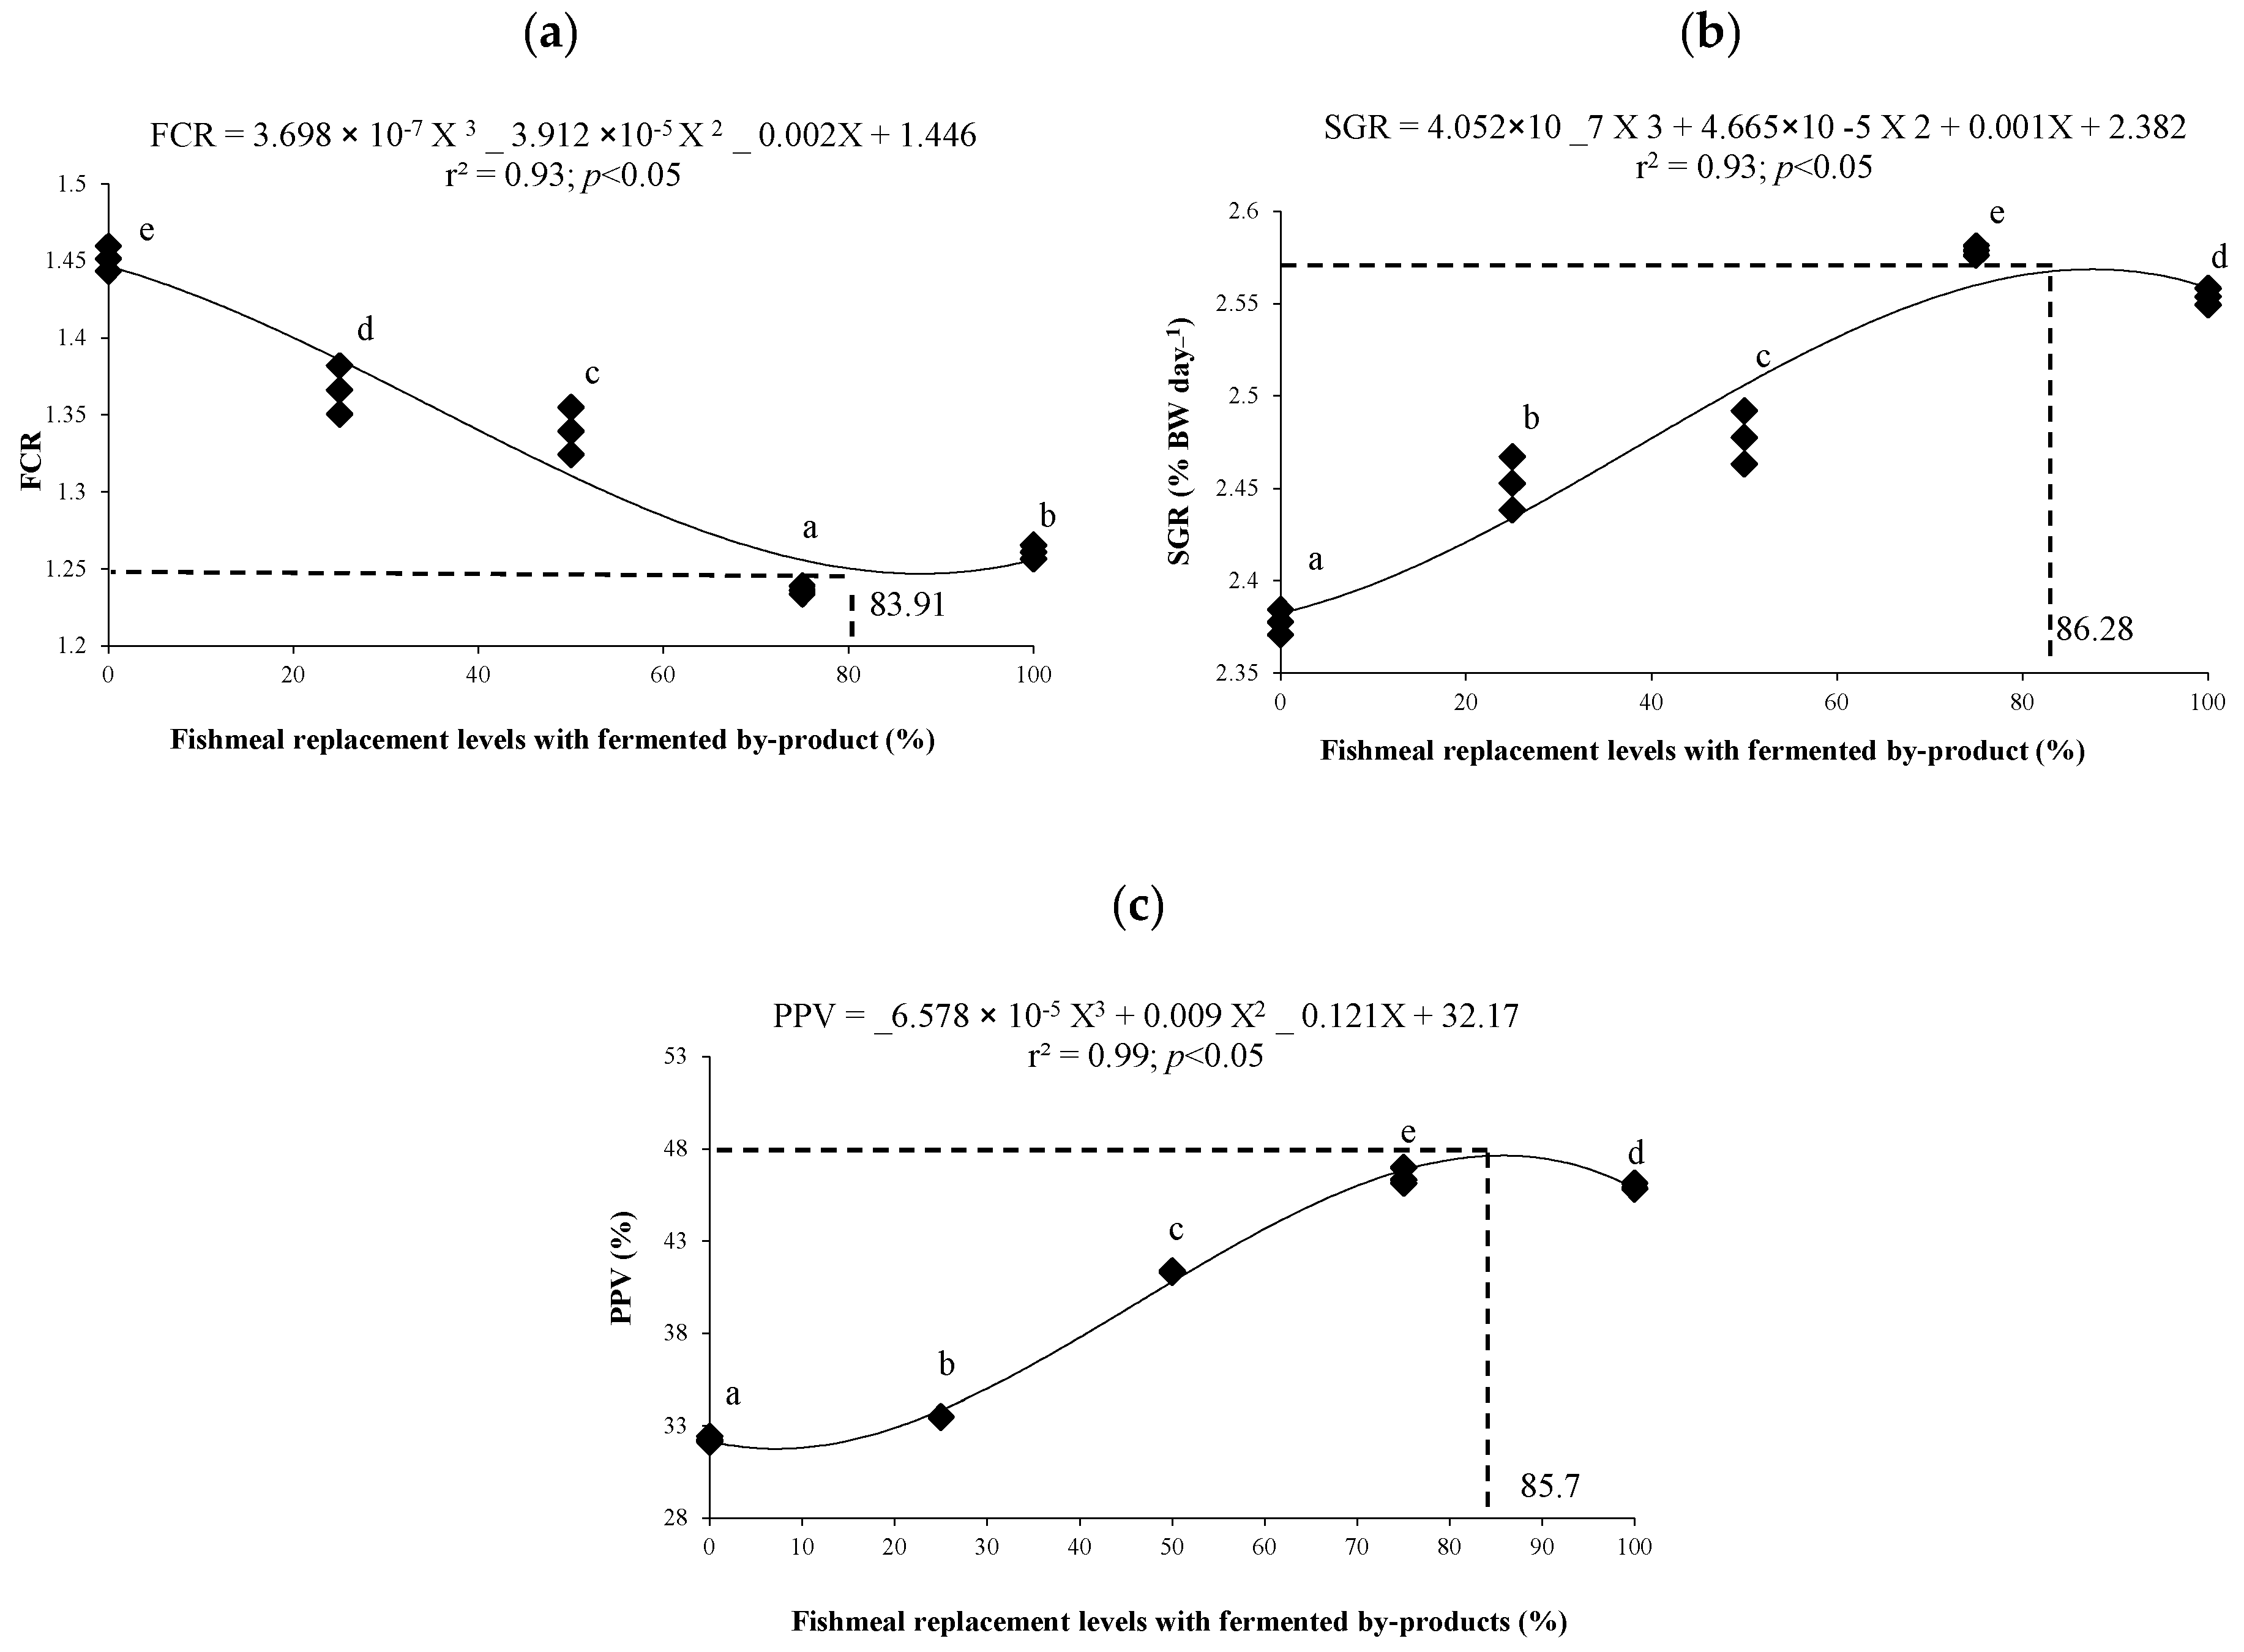
As shown in Table 2, with increasing use of fermented by-product at levels of 25 to 75% in the diet of Nile tilapia, a significant increasing trend (p < 0.05) was observed in the indices of final weight gain, body weight gain, specific growth rate, protein production value, and protein efficiency ratio. With increasing replacement of fermented by-product at levels of 75 to 100%, body weight gain, specific growth rate, and protein production value significantly decreased (p < 0.05). With increasing replacement levels of fermented by-product with fishmeal, the viscerosomatic index significantly decreased (p < 0.05). Although, no statistically significant difference (p > 0.05) was observed between replacement levels of 50 to 100% (Table 2). Based on the broken-line regression model, the optimal replacement level was calculated to be 83.91% for feed conversion ratio (Figure 5a), 86.28% for specific growth rate (Figure 5b), and 85.7% for protein productive value (Figure 5c). As shown in Table 3, the highest level of carcass crude protein was observed in fish fed the diet with 100% replacement of fermented by-product (p < 0.05). The highest level of carcass crude fat was observed in fish fed the control diet (p < 0.05) (Table 3).

3.5. Thyroid Hormone Concentrations

In the present study, it was observed that increasing the replacement of fermented by-product at levels of 25 to 100% in the diet of Nile tilapia resulted in a significant increase (p < 0.05) in the concentrations of T3 and T4 hormones in the blood plasma of fish fed with fermented by-product compared to those of fed the control diet. However, in the replacement levels of 75 to 100% of fermented by-product, no statistically significant difference (p > 0.05) was observed in the concentrations of the mentioned hormones (Table 4).

3.6. Immune Responses

The results of measuring immune responses were shown in Table 5. With increasing use of fermented by-product at levels of 25 to 100% in the diet of Nile tilapia, the activity of lysozyme and ACH50, as well as the level of total immunoglobulin in the plasma, showed a significant increase (p < 0.05) compared those of fed the control diet. However, with increasing replacement level from 75 to 100%, the level of ACH50 and total immunoglobulin significantly decreased (p < 0.05).

3.7. Hepatopancreas Enzymes and Antioxidant Indices

In the present study, it was observed that with increasing replacement level of fermented by-product at levels of 25 to 100% in the diet of Nile tilapia, the activities of antioxidant enzymes including catalase and superoxide dismutase, as well as liver enzymes aspartate aminotransferase and alanine aminotransferase, showed a significant increasing trend (p < 0.05) compared to fish fed the control diet (Table 6). Based on the broken-line regression model, the optimal replacement level was calculated to be 80.2% for SOD.

3.8. Digestive Enzyme Activities

As can be seen in Table 7, with increasing replacement levels of fermented by-product at levels of 25 to 100% in the diet of Nile tilapia, the activities of digestive enzymes including amylase, protease, and lipase in the intestinal tissue significantly increased (p < 0.05) compared to fish fed the control diet (Table 7).

4. Discussion

4.1. Bacteria Growth and Selection

In the present study, it was observed that with increasing fermentation time from 0 (immediately after bacterial inoculation) to 72 h, the number of bacteria (colonies mL−1) increased, and then decreased from 72 to 96 h. Nitrogen plays an important role in bacterial growth and can significantly affect the bacterial growth curve. Nitrogen source limitation leads to the accumulation of waste products and a decrease in the bacterial population. In the cell death phase, the reduction of nitrogen and other nutrients, as well as the accumulation of toxic substances, lead to a decrease in the bacterial population and cell death [51]. Examination of the amount of hydrolyzed protein during fermentation showed that simultaneously with the increase in bacterial colony count from blank (before inoculation with bacteria) to 72 h, the amount of soluble protein also significantly decreased, which indicated the consumption of protein by the bacteria during fermentation. Based on the data shown on the protease halo diameter and colony diameter of bacteria grown on the selected media in the present study, B. licheniformis showed the maximum growth and, consequently, it was selected for mass production of fermented Nile tilapia by-product in Experiment 2. Nutritional sources such as carbon and nitrogen sources, as well as mineral elements, affect the production of microbial protease by bacteria. The need for a source of organic and inorganic nitrogen is required for the production of amino acids, nucleic acids, proteins, and other cellular components of the bacteria [51]. The nitrogen source for the growth of B. licheniformis was supplied from fish by-product and soluble protein resulting from the activity of the bacteria itself, which is consistent with the results obtained from measuring the amount of protein by the Bradford method and indicated a decrease in the amount of soluble protein during fermentation. The results of the examination of hydrolyzed protein at 48 and 72 h during fermentation on a polyacrylamide gel showed the presence of peptides with a molecular weight of less than 11 kDa. This research is also consistent with the results of some other researchers. During the fermentation of L. klunzingeri fish with B. licheniformis [5], and Keropok Lekor by-products by indigenous Lactobacillus casei [16], it was reported that microbial fermentation leads to the achievement of hydrolyzed protein rich in peptides with low molecular weight. The fermentation of A. irradians clam with B. licheniformis isolated peptides with a molecular weight of less than 3 kDa [52].

4.2. Growth Performance and Nutritional Efficiency Indices

This study demonstrated that increasing the replacement of fermented by-product in the diet of Nile tilapia led to a significant increase in the indices of final weight, body weight gain, specific growth rate, protein production value, and protein efficiency ratio compared to fish fed the control diet. However, the indices of body weight gain and protein productive value significantly decreased with increasing replacement level of fermented by-product from 75 to 100%. The feed conversion ratio and viscerosomatic index of Nile tilapia showed a significant decreasing trend with increasing percentage replacement of fermented waste in the diet compared to fish fed the control diet. It should be noted that, based on available resources, there is no information regarding the use of fermented Nile tilapia by-product in the diet. The results of this research are consistent with previous studies. Hassan et al. [22] reported that replacing at least 25% of sunflower meal with fermented sunflower meal using S. cerevisiae yeast and B. subtilis bacteria had a positive impact on the growth performance and feed conversion ratio of O. niloticus fish. Dawood et al. [23] reported that using different levels of fermented date palm kernel (0% as control, 5%, 10%, 15%, and 25%) in the diet of O. niloticus improved growth performance and feed conversion ratio in fish fed diets containing fermented kernel compared to the control group. In a study by Ismail et al. [53], fermentation of olive cake with A. oryzae in the diet of O. niloticus improved growth performance, which reported that the use of fermented products in the diet of O. niloticus up to an optimal level leads to improved growth performance and feed efficiency in fish. Fermentation, by breaking down more complex compounds into simpler forms and reducing anti-nutritional compounds, improves growth rate and digestibility in fish [54].
When it comes to fermenting products with bacteria to determine which bacteria have better fermentation effects, which is more accurate than using only the hydrolysis products of fermented products to judge the breeding effect, more information and research is needed in the future. Fermentation leads to the bioavailability of protein and the release of bioactive compounds, which may have beneficial effects on health when consumed [25]. Numerous studies have shown changes in protein efficiency ratio as a result of feeding fermented diets [55,56], which is consistent with the measured protein efficiency ratio in the present study. Fermentation, by improving the acid solubility and water solubility of large proteins, increases the digestibility and nutritional value of compounds and also makes essential amino acids available to the fish. Increasing low-molecular-weight proteins leads to increased protease enzyme activity and, as a result, improves the protein production value index and leads to protein deposition in the muscle tissue of animals [57]. In the present study, it was observed that with increasing replacement of fermented by-product in the diet, the levels of carcass crude protein and ash in Nile tilapia significantly increased, and the level of carcass crude fat significantly decreased. This research is consistent with the results of some other researchers [20,53,58]. Based on the growth performance data (e.g., SGR and FCR) in the present study, 84–87% of fishmeal (crude protein content: 50.1 g kg−1) replacement with fermented Nile tilapia by-product (crude protein content: 50.4 g kg−1) was possible. This equaled to the range of 198.67–205.77 g kg−1 fermented by-product in the diet contained peptides with molecular weight lower than 11 kDa. Increments in the inclusion level of fermented by-product higher than 205.77 g kg−1 led to a decrease in the growth performance. It may be related to the nature of produced bioactive peptides such as antimicrobial, antioxidant, antihypertensive, antidiabetic, and anti-inflammatory functions [59], which need to be investigated further in the future.

4.3. Blood Biochemical Indices

This study observed that increasing the replacement of fermented by-product in the diet of Nile tilapia fish led to an increase in the concentration of triiodothyronine and thyroxine hormones in the blood plasma of fish fed with fermented waste compared to the control diet. However, in the replacement of 75 to 100% of fermented by-product, no statistically significant difference was observed in the concentration of the mentioned hormones. Fish endocrine systems are sensitive to changes in nutrient intake. Aquatic animal by-product (e.g., skin, head, fins, tail, viscera, and bones) is important due to its high content of protein, essential amino acids, vitamins, and minerals [60]. Several studies have investigated the effect of maternal injection of thyroid hormones on increasing growth and survival rate in newly hatched larvae of fish such as sturgeon [61] and tilapia (O. mossambicus) [62]; this effect varies depending on the fish species and the concentration of thyroid hormone consumed. Triiodothyronine and thyroxine hormones, like other vertebrates, are secreted from the thyroid gland in fish. These hormones play an important role in growth rate, development, reproduction, metabolism, osmotic regulation, skin pigment accumulation, and metamorphosis in fish [61]. The fermentation process, by increasing the digestibility and improving the bioavailability of food compounds such as proteins, fats, and carbohydrates, provides more nutrients to the metabolic process and the Krebs cycle, and thus increases the concentration of triiodothyronine and thyroxine enzymes. These hormones, as an endocrine gland, affect the metabolism of compounds such as proteins, fats, and carbohydrates. Thyroid hormones directly affect growth through their respective receptors or indirectly through interaction and positive effects with other hormones [63].
The present study revealed that increasing the replacement of fermented by-product in the diet of Nile tilapia led to a significant increase in the activity of antioxidant enzymes such as catalase and superoxide dismutase (SOD) compared to the control group. This observation aligns with previous findings. Sherif et al. [26] reported increased catalase and SOD activity in O. niloticus fed diets containing varying levels of S. platensis fermented with S. cerevisiae. Similarly, Hajirezaee et al. [64] demonstrated enhanced catalase and SOD activity in Cyprinus carpio fed the diets supplemented with L. rhamnosus and betaine. While the specific bioactive compounds present in the fermented tilapia waste were not quantified in the current study, it is plausible that certain low-molecular-weight peptides and other bioactive molecules generated during fermentation contributed to the observed increase in antioxidant enzyme activity. These compounds may act as free radical scavengers, thereby mitigating oxidative stress. Indeed, the antioxidant properties of protein hydrolysates derived from fermentation have been documented in several studies [17,65]. Although further research is warranted to specifically investigate the impact of bioactive peptides from fermented Nile tilapia by-product on antioxidant indices, the existing literature suggests a positive influence of protein hydrolysates on antioxidant enzyme systems in other vertebrates [5,65], highlighting a potential area for future investigation in fish.
Furthermore, this study found that increasing the dietary inclusion of fermented tilapia by-product significantly increased the activity of the hepatopancreatic enzymes aspartate aminotransferase (AST) and alanine aminotransferase (ALT) compared to the control group. The effects of fermented feed ingredients on AST and ALT activities in aquatic animals have been reported to vary. Hassan et al. [22] observed the lowest AST and ALT activities in the serum of fish fed a control diet and 25% fermented sunflower meal (fermented separately with B. subtilis or S. cerevisiae), while the highest activities were observed in fish fed 75% fermented sunflower meal. AST and ALT activities are closely related to amino acid metabolism in fish, and transaminase activity increases with enhanced amino acid metabolism. It is conceivable that certain low-molecular-weight compounds present in the fermented by-product may have stimulated amino acid metabolism in the experimental fish [66,67]. Additionally, the high nucleic acid content in the bacterial biomass of the fermented waste could have influenced the activity of these enzymes [68].
The present study demonstrated that increasing the dietary inclusion of fermented tilapia by-product significantly increased the activities of lysozyme and ACH50, as well as the levels of total immunoglobulin. However, ACH50 and total immunoglobulin levels significantly decreased with increasing replacement from 75 to 100%. The application of fermentation technology in aquatic animal diets has been shown to enhance the proliferation of beneficial gut bacteria while suppressing the growth of pathogenic bacteria [69]. The observed increase in immune indices in tilapia fed with fermented by-product is consistent with previous studies [26,70]. It has been reported that fermented feed, by improving growth, feed utilization, and intestinal health, enhances the immune system’s resistance to diseases in fish [71,72]. Wang et al. [58] fermented soybean meal with Pediococcus pentosaceus and used it in the diet of O. niloticus at two levels: control and 100%. The results showed that feeding with fermented soybean meal protein improved the intestinal microbial flora of O. niloticus. Wang et al. [58] suggested that the increased immunity in fish fed with fermented soybean may be due to the increased attachment and colonization of probiotics within the intestinal epithelium, reducing the risk of pathogen colonization and leading to resistance against pathogens. Beneficial bacteria in the fermentation process improves gut health in fish through two mechanisms: firstly, by preventing the colonization of harmful bacteria in the gut, and secondly, by activating non-specific immunity through the secretion of antimicrobial compounds and glycoproteins [73].
The present study revealed that increasing the dietary inclusion of fermented tilapia waste in Nile tilapia significantly increased the activity of the digestive enzymes amylase and protease in the intestinal tissue. This observation aligns with the findings of previous research [26,64]. Beneficial bacteria utilized in fermentation are known to play a crucial role in improving intestinal digestive activity in fish by producing vitamins and digestive enzymes. These beneficial bacteria enhance the intestinal bacterial flora and stimulate the activity of intestinal digestive enzymes by producing protein-hydrolyzing enzymes and breaking down macromolecules [74]. In the present study, the increased activity of intestinal digestive enzymes may be attributed to the extracellular enzymes produced by the bacteria after colonization in the intestine [75]. It is likely that the fermentation process improves gut health in fish through two mechanisms: (1) by promoting the colonization of beneficial bacteria in the intestine and (2) by activating non-specific immunity through the secretion of antimicrobial compounds and glycoproteins [73]. Enhanced gut health, in turn, contributes to increased activity of digestive enzymes [54]. However, the present study did not examine the microbial flora of the intestine, and therefore more studies are needed in the future.

5. Conclusions

In the current trial, B. licheniformis showed the highest protease halo diameter and colony diameter among five bacteria strains. B. licheniformis-fermented Nile tilapia by-product was substituted with fishmeal content of the control diet at the inclusion levels of 25, 50, 75, and 100% in the diet of Nile tilapia fry. The highest final weights (14.25–14.34 g) were observed in fish fed the diets containing 75–100% fishmeal replacement levels with fermented by-product. With an increment in the inclusion level of fermented by-product in the diet, PPV and SOD enhanced up to 85.7 and 80.2% fishmeal replacement level, respectively, based on the broken-line regression model.

Author Contributions

F.T.T.: Investigation, Project administration, Data curation, Writing—original draft; O.S.: Conceptualization, Supervision, Funding acquisition, Writing—review and editing; M.S.: Supervision, Writing—review and editing; N.G.N.: Methodology, Formal analysis, Writing—review and editing; M.P.: Formal analysis, Writing—review and editing. All authors have read and agreed to the published version of the manuscript.

Funding

This research was funded by Ferdowsi University of Mashhad, grant number: 3/58528.

Institutional Review Board Statement

All procedures in this study were conducted in accordance with the ethical guidelines of the Ferdowsi University of Mashhad’s Institutional Animal Care and Use Committee, under the code IR.UM.REC.1401.142, Approval date is 22 October 2022.

Informed Consent Statement

Not applicable.

Data Availability Statement

The original contributions presented in this study are included in the article. Further inquiries can be directed to the corresponding author.

Acknowledgments

The authors would like to express their gratitude to the staff of the Faculty of Natural Resources and Environment at Ferdowsi University of Mashhad (FUM) for providing the facilities and equipment necessary for this study. AI software has not been used to prepare the manuscript.

Conflicts of Interest

The authors declare no conflicts of interest.

References

  1. FAO. The State of World Fisheries and Aquaculture; Food and Agriculture Organization of the United Nations: Rome, Italy, 2022. [Google Scholar]
  2. FAO. The State of World Fisheries and Aquaculture; FAO Fisheries and Aquaculture Department: Rome, Italy, 2020. [Google Scholar]
  3. El-Sayed, A.M.; Fitzsimmons, K. From Africa to the world-the journey of Nile tilapia. Rev. Aquac. 2022, 15, 6–21. [Google Scholar] [CrossRef]
  4. Ozogul, F.; Cagalj, M.; Šimat, V.; Ozogul, Y.; Tkaczewska, J.; Hassoun, A.; Kaddour, A.A.; Kuley, E.; Rathod, N.B.; Phadke, G.G. Recent developments in valorisation of bioactive ingredients in discard/seafood processing by-products. Trends Food Sci. Technol. 2021, 116, 559–582. [Google Scholar] [CrossRef]
  5. Rabiei, S.; Rezaei, M.; Asgharzade, S.; Nikoo, M.; Rafieia-Kopai, M. Antioxidant and cytotoxic properties of protein hydrolysates obtained from enzymatic hydrolysis of Klunzinger’s mullet (Liza klunzingeri) muscle. Braz. J. Pharm. Sci. 2021, 55, e18304. [Google Scholar] [CrossRef]
  6. Shahidi, F.; Ambigaipalan, P. Omega-3 polyunsaturated fatty acids and their health benefts. Annu. Rev. Food Sci. Technol. 2018, 9, 345–381. [Google Scholar] [CrossRef]
  7. Safari, R.; Reyhani Poul, S.; Yaghoubzadeh, Z.; Bankehsaz, Z.; Taghavi, M.J.; Safari, E. Investigation of some chemical and microbial properties of biosilage produced from rainbow trout (Oncorhynchus mykiss) wastes. J. Fish. 2021, 74, 575–586. [Google Scholar] [CrossRef]
  8. Ahmed, N.; Thompson, S.; Glaser, M. Global aquaculture productivity, environmental sustainability, and climate change adaptability. Environ. Manag. 2019, 63, 159–172. [Google Scholar] [CrossRef] [PubMed]
  9. Longo, S.B.; Clark, B.; York, R.; Jorgenson, A.K. Aquaculture and the displacement of fisheries captures. Conserv. Biol. 2019, 33, 832–841. [Google Scholar] [CrossRef]
  10. Siddik, M.A.B.; Howieson, J.; Ilham, I.; Fotedar, R. Growth, biochemical response and liver health of juvenile barramundi (Lates calcarifer) fed fermented and nonfermented tuna hydrolysate as fishmeal protein replacement ingredients. Aquat. Biol. PeerJ 2018, 6, e4870. [Google Scholar]
  11. Chai, K.F.; Voo, A.Y.H.; Chen, W.N. Bioactive peptides from food fermentation: A comprehensive review of their sources, bioactivities, applications, and future development. Compr. Rev. Food Sci. Food Saf. 2020, 19, 3825–3885. [Google Scholar] [CrossRef]
  12. Barzkar, N.; Khan, Z.; Tamadoni Jahromi, S.; Pourmozaffar, S.; Gozari, M.; Nahavandi, R. A critical review on marine serine protease and its inhibitors: A new wave of drugs? Int. J. Biol. Macromol. 2021, 170, 674–687. [Google Scholar] [CrossRef]
  13. Jemil, I.; Jridi, M.; Nasri, R.; Ktari, N.; Salem, R.B.S.-B.; Mehiri, M.; Hajji, M.; Nasri, M. Functional, antioxidant and antibacterial properties of protein hydrolysates prepared from fish meat fermented by Bacillus subtilis A26. Process. Biochem. 2014, 49, 963–972. [Google Scholar] [CrossRef]
  14. Mao, X.; Liu, P.; He, S.; Xie, J.; Kan, F.; Yu, C.; Li, Z.; Xue, C.; Lin, H. Antioxidant properties of bioactive substances from shrimp head fermented by Bacillus licheniformis OPL-007. Appl. Biochem. Biotechnol. 2013, 171, 1240–1252. [Google Scholar] [CrossRef]
  15. Soltan, M.A.; El- Laithy, S.M. Evaluation of fermented silage mae from fish, tomato and potato by-products as a feed ingredient for Nil Tilapia, Oreochromis niloticus. Egypt. J. Aquat. Biol. Fish. 2008, 12, 25–41. [Google Scholar] [CrossRef]
  16. Abd Rashid, N.Y.; Abdul Manan, M.; Faizal Pa’ee, K.; Saari, N.; Faizal Wong, F.W. Evaluation of antioxidant and antibacterial activities of fish protein hydrolysate produced from Malaysian fish sausage (Keropok Lekor) by-products by indigenous Lactobacillus casei fermentation. J. Clean. Prod. 2022, 347, 131303. [Google Scholar] [CrossRef]
  17. Rajendran, S.R.C.K.; Mohan, A.; Khiari, Z.; Udenigwe, C.C.; Mason, B. Yield, physicochemical, and antioxidant properties of Atlantic salmon visceral hydrolysate: Comparison of lactic acid bacterial fermentation with flavourzyme proteolysis and formic acid treatment. J. Food Process. Preserv. 2018, 42, e13620. [Google Scholar] [CrossRef]
  18. Choksawangkarn, W.; Phiphattananukoon, S.; Jaresitthikunchai, J.; Roytrakul, S.; Resources, N. Antioxidative peptides from fish sauce by-product: Isolation and characterization. Agric. Nat. Resour. 2018, 5, 460–466. [Google Scholar] [CrossRef]
  19. Ruthu, N.; Murthy, P.S.; Rai, A.K.; Bhaskar, N. Fermentative recovery of lipids and proteins from freshwater fish head waste with reference to antimicrobial and antioxidant properties of protein hydrolysate. J. Food Sci. Technol. 2014, 51, 1884–1892. [Google Scholar] [CrossRef]
  20. El-Dakar, A.; Elgamal, A.; Amer, M.A.; Mohammed, A.S.; Abdel-Aziz, M.F. Evaluation of fermented soybean meal by Bacillus subtilis as an alternative to fishmeal on the growth, and physiological status of Nile tilapia Oreochromis niloticus fingerlings. Heliyon 2023, 9, e19602. [Google Scholar] [CrossRef]
  21. Hassaan, M.S.; Soltan, M.A.; Abdel-Moez, A.M. Nutritive value of soybean meal after solid state fermentation with Saccharomyces cerevisiae for Nile tilapia, Oreochromis niloticus. Anim. Feed. Sci. Technol. 2015, 201, 89–98. [Google Scholar] [CrossRef]
  22. Hassaan, M.S.; Soltan, M.A.; Mohammady, E.Y.; Elashry, M.A.; El-Haroun, E.R.; Davies, S.J. Growth and physiological responses of Nile tilapia, Oreochromis niloticus fed dietary fermented sunflower meal inoculated with Saccharomyces cerevisiae and Bacillus subtilis. Aquaculture 2018, 495, 592–601. [Google Scholar] [CrossRef]
  23. Dawood, M.A.; Eweedah, N.M.; Khalafalla, M.M.; Khalid, A.; El Asely, A.; Fadl, S.E.; Amin, A.A.; Paray, B.A.; Ahmed, H.A. Saccharomyces cerevisiae increases the acceptability of Nile tilapia (Oreochromis niloticus) to date palm seed meal. Aquac. Rep. 2020, 17, 100314. [Google Scholar] [CrossRef]
  24. Ismail, T.; Hegazi, E.; Nassef, E.; El-Din, M.T.S.; Dawood, M.A.; Abdo, S.E.; Gewaily, M.S. Gut immune-related gene expression, histomorphometry and hematoimmunological assays in Nile tilapia (Oreochromis niloticus) fed Aspergillus oryzae fermented olive cake. Fish Shellfish Immunol. 2021, 117, 299–310. [Google Scholar] [CrossRef]
  25. Mohammady, E.Y.; Aboseif, A.M.; Soaudy, M.R.; Ramadan, E.A.; Hassaan, M.S. Appraisal of fermented wheat bran by Saccharomyces cerevisiae on growth, feed utilization, blood indices, intestinal and liver histology of Nile tilapia, Oreochromis niloticus. Aquaculture 2023, 575, 739755. [Google Scholar] [CrossRef]
  26. Sherif, E.M.; El-Razek, I.M.A.; El-Sharawy, M.E.; Amer, A.A.; Zaineldin, A.I.; Gewaily, M.S.; Ashry, A.M.; Younis, N.A.; Ahmed, H.A.; Dawood, M.A. Growth performance, antioxidative status, and immune response of Nile tilapia (Oreochromis niloticus) fed dietary fermented Spirulina platensis. Aquac. Rep. 2024, 39, 102324. [Google Scholar] [CrossRef]
  27. Nkhata, S.G.; Ayua, E.; Kamau, E.H.; Shingiro, J.B. Fermentation and germination improve nutritional value of cereals and legumes through activation of endogenous enzymes. Food Sci. Nutr. 2018, 6, 2446–2458. [Google Scholar] [CrossRef] [PubMed]
  28. Baron, E.J.; Finegold, S.M. Baily and Scott’s Diagnostic Microbiology, 8th ed.; The C.V. Mosby Company: St. Louis, MO, USA; Baltmore, MD, USA; Philadelphia, PA, USA; Toronto, ON, Canada, 1990; p. 451456. [Google Scholar]
  29. Sneath, P.H.A.; Sharpe, M.E.; Holt, J.G. Bergey’s Manual of Systematic Bacteriology, 1st ed.; The Williams & Wilkins Company: Baltimore, MD, USA, 1984; Volume 2, pp. 1104–1139. [Google Scholar]
  30. Downes, F.P.; Lto, K. Compendium of Methods for the Microbiological Analytic Examination of Foods, 4th ed.; APHA: Washington, DC, USA, 2001. [Google Scholar]
  31. Bradford, M.M. A rapid and sensitive method for the quantitation of microgram quantities of protein utilizing the principle of protein-dye binding. Anal. Biochem. 1976, 72, 248–254. [Google Scholar] [CrossRef] [PubMed]
  32. National Research Council (NRC). Nutrient Requirements of Fish; National Academy Press: Washington, DC, USA, 1996. [Google Scholar]
  33. El-Sayed, A.-F.M. Environmental Requirements. In Tilapia Culture; CABI Publishing: Oxford, UK, 1950; pp. 34–46. [Google Scholar]
  34. Khanzadeh, S.; Shahsavani, D.; Safari, O. Synergistic effects of synbiotic and hydrolyzed yeast extract in the diet on growth performance, hemato-immunological responses, and digestive enzyme activities of Nile tilapia (Oreochromis niloticus) fry. Aquac. Int. 2025, 33, 236. [Google Scholar] [CrossRef]
  35. Refstie, S.; Olli, J.J.; Standal, H. Feed intake, growth, and protein utilisation by post-smolt Atlantic salmon (Salmo salar) in response to graded levels of fish protein hydrolysate in the diet. Aquaculture 2004, 239, 331–349. [Google Scholar] [CrossRef]
  36. Squires, E.J. Applied Animal Endocrinology; CABI Publishing: Oxford, UK, 2003; p. 234. [Google Scholar]
  37. Amar, E.C.; Kiron, V.; Satoh, S.; Okamoto, N.; Watanabe, T. Effects of dietary β-carotene on the immune response of rainbow trout Oncorhynchus mykiss. Fish. Sci. 2000, 66, 1068–1075. [Google Scholar] [CrossRef]
  38. Siwicki, A.K.; Anderson, D.P.; Rumsey, G.L. Dietary intake of immunostimulants by rainbow trout affects non-specific immunity and protection against furunculosis. Vet. Immunol. Immunopathol. 1994, 41, 125–139. [Google Scholar] [CrossRef]
  39. Goth, L. A simple method for determination of serum catalase activity and revision of reference range. Clin. Chim. Acta 1991, 196, 143–151. [Google Scholar] [CrossRef]
  40. Beauchamp, C.; Fridovich, I. Superoxide Dismutase: Improved Assays and an Assay Applicable to Acrylamide Gels. Anal. Biochem. 1971, 44, 276. [Google Scholar] [CrossRef] [PubMed]
  41. Bolann, B.; Ulvik, R. Improvement of a direct spectrophotometric assay for routine determination of superoxide dismutase activity. Clin. Chem. 1992, 37, 1993–1999. [Google Scholar] [CrossRef]
  42. Bergmeyer, H.U.; Hodar, M.; Rej, R. Approved recommendation (1985) on IFCC method for the measurement of catalytic concentration of enzymes Part 3. IFCC method for alanine aminotransferase (Lalanine:2- oxoglutarate aminotransferase, EC 2.6.1.2). J. Clin. Chem. Clin. Biochem. 1986, 24, 497–508. [Google Scholar]
  43. Moss, D.W.; Henderson, A.R. Clinical enzymology. In Tietz Textbook of Clinical Chemistry, 3rd ed.; Burtis, C.A., Ashwood, E.R., Eds.; W.B. Saunders Company: Philadelphia, PA, USA, 1999; pp. 617–721. [Google Scholar]
  44. Furné, M.; García-Gallego, M.; Hidalgo, M.C.; Morales, A.E.; Domezain, A.; Domezain, J.; Sanz, A. Effect of starvation and refeeding on digestive enzyme activities in sturgeon (Acipenser naccarii) and trout (Oncorhynchus mykiss). Comp. Biochem. Physiol. Part A Mol. Integr. Physiol. 2008, 149, 420–442. [Google Scholar] [CrossRef] [PubMed]
  45. Gimenez, A.F.; García-Carreño, F.; del Toro, M.N.; Fenucci, J. Digestive proteinases of red shrimp Pleoticus muelleri (Decapoda, Penaeoidea): Partial characterization and re lationship with molting. Comp. Biochem. Physiol. 2001, 130, 331–338. [Google Scholar] [CrossRef] [PubMed]
  46. Worthington, C.C. Worthington Enzyme Manual Related Biochemical, 3rd ed.; Worthington Biochemical Corporation: Freehold, NJ, USA, 1991; pp. 38–42. [Google Scholar]
  47. López-López, S.; Nolasco, H.; Vega-Villasante, F. Characterization of digestive gland esterase–lipase activity of juvenile redclaw crayfish Cherax quadricarinatus. Comp. Biochem. Physiol. Part B Biochem. Mol. Biol. 2003, 135, 337–347. [Google Scholar] [CrossRef]
  48. Association of Official Analytical Chemists (AOAC). Official Methods of Analysis, 16th ed.; Association of Official Analytical Chemists Arlington: Washington, DC, USA, 2005. [Google Scholar]
  49. Lichon, M.J. Sample preparation. In Handbook of Food Analysis; Nollet, L.M.L., Ed.; Marcel Dekker: New York, NY, USA, 1996; Volume 1, pp. 1–19. [Google Scholar]
  50. Zar, J.H. Biostatistical Analysis; Prentice-Hall, Inc.: Upper Saddle River, NJ, USA, 1999. [Google Scholar]
  51. De Souza, P.M.; Bittencourt, M.L.A.; Caprara, C.C.; de Freitas, M.; de Almeida, R.P.C. A biotechnology perspective of fungal proteases. Braz. J. Microbiol. 2015, 46, 337–346. [Google Scholar] [CrossRef]
  52. Zhi, T.; Li, X.; Sadiq, F.A.; Mao, K.; Gao, J.; Mi, S.; Liu, X.; Deng, W.; Chitrakar, B.; Sang, Y. Novel antioxidant peptides from protein hydrolysates of scallop (Argopecten irradians) mantle using enzymatic and microbial methods: Preparation, purifcation, identifcation and characterization. LWT 2022, 164, 113636. [Google Scholar] [CrossRef]
  53. Ismail, T.; Hegazi, E.; Dawood, M.A.; Nassef, E.; Bakr, A.; Paray, B.A.; Van Doan, H. Using of betaine to replace fsh meal with soybean or/and corn gluten meal in Nile tilapia (Oreochromis niloticus) diets: Histomorphology, growth, fatty acid, and glucose-related gene expression traits. Aquac. Rep. 2020, 17, 100376. [Google Scholar] [CrossRef]
  54. Siddik, M.A.B.; Julien, B.B.; Islam, S.M.M.; Francis, D.S. Fermentation in aquafeed processing: Achieving sustainability in feeds for global aquaculture production. Rev. Aquac. 2024, 16, 1244–1265. [Google Scholar] [CrossRef]
  55. Li, S.; Ding, G.; Song, F.; Sang, C.; Wang, A.; Chen, N. Comparison of dehulled, fermented and enzyme-treated soybean meal in diets for largemouth bass, Micropterus salmoides: Effects on growth performance, feed utilization, immune response and intestinal morphology. Anim. Feed. Sci. Technol. 2020, 267, 114548. [Google Scholar] [CrossRef]
  56. Zhang, B.; Zhang, Y.; Cui, M.; Zhang, M.; Xu, J.; Zhang, Z.; Sui, Z.; Wang, L.; Zhang, C.; Li, C.; et al. Comparison of the performance of raw and Lactobacillus paracasei fermented soybean meal in diets for turbot (Scophthalmus maximus L.): Growth, intestinal morphology, apoptosis, tight junction, and microbiota. Aquac. Rep. 2022, 24, 101184. [Google Scholar] [CrossRef]
  57. Xu, C.; Liu, W.; Zhang, D.; Liu, J.; Zheng, X.; Zhang, C.; Yao, J.; Zhu, C.; Chi, C. Effects of partial fish meal replacement with two fermented soybean meals on the growth of and protein metabolism in the Chinese mitten crab (Eriocheir sinensis). Aquac. Rep. 2020, 17, 100328. [Google Scholar] [CrossRef]
  58. Wang, Z.; Dong, W.X.; Qiao, F.; Du, Z.Y.; Zhang, M.L. Comparison of Pediococcus pentosaceus YC64-fermented soybean meal and raw soybean meal in diets for Nile tilapia: Growth performance, feed utilization, and intestine health. Aquac. Rep. 2024, 38, 102321. [Google Scholar] [CrossRef]
  59. Du, Z.; Li, Y. Review and perspective on bioactive peptides: A roadmap for research, development, and future opportunities. J. Agric. Food Res. 2022, 9, 100353. [Google Scholar] [CrossRef]
  60. Gao, R.; Yu, Q.; Shen, Y.; Chu, Q.; Chen, G.; Fen, S.; Yang, M.; Yuan, L.; McClements, D.J.; Sun, Q. Production, bioactive properties, and potential applications of fish protein hydrolysates: Developments and challenges. Trends Food Sci. Technol. 2021, 110, 687–699. [Google Scholar] [CrossRef]
  61. Abdollahpour, H.; Falahatkar, B. Improve growth performance in Sterlet Sturgeon Acipenser ruthenus larvae subsequent thyroxine injection to brood stock. In Proceedings of the 8th International Symposium on Sturgeons, Vienna, Austria, 10–15 September 2017. [Google Scholar]
  62. Lam, T.J. Thyroxine enhances larval development and survival in Sarotherodon (Tilapia) mossambicus Ruppell. Aquaculture 1980, 21, 287–291. [Google Scholar] [CrossRef]
  63. MacKenzie, D.S.; VanPutte, C.M.; Leiner, K.A. Nutrient regulation of endocrine function in fish. Aquaculture 1998, 161, 3–25. [Google Scholar] [CrossRef]
  64. Hajirezaee, S.; Ramezani, S.; Ahani, S. Betaine and the probiotic, Lactobacillus rhamnosus in the diet of the Common carp, Cyprinus carpio: Effects on growth, digestive enzyme activities, antioxidant system, humoral and mucosal immunity and resistance to Streptococcus iniae. Aquac. Rep. 2024, 38, 102282. [Google Scholar] [CrossRef]
  65. Jemil, I.; Nasri, R.; Abdelhedi, O.; Aristoy, M.-C.; Salem, R.B.S.-B.; Kallel, C.; Marrekchi, R.; Jamoussi, K.; ElFeki, A.; Hajji, M.; et al. Beneficial effects of fermented sardinelle protein hydrolysates on hypercaloric diet induced hyperglycemia, oxidative stress and deterioration of kidney function in wistar rats. J. Food Sci. Technol. 2017, 54, 313–325. [Google Scholar] [CrossRef] [PubMed]
  66. Feng, G.P.; Zhuang, P.; Zhang, L.Z.; Liu, J.Y.; Duan, M.; Zhao, F.; Yan, W.G. Effects of water temperature on metabolic enzyme and antioxidase activities in juvenile Chinese sturgeon (Acipenser sinensis). Acta Hydrobiol. Sin. 2012, 36, 137–142, (In Chinese with English Abstract). [Google Scholar] [CrossRef]
  67. Luo, Y.W.; Ai, Q.H.; Mai, K.S.; Zhang, W.B.; Xu, W.; Zhang, Y.J. Effects of dietary rapeseed meal on growth performance, digestion and protein metabolism in relation to gene expression of juvenile cobia (Rachycen troncanadum). Aquaculture 2012, 368–369, 109–116. [Google Scholar] [CrossRef]
  68. Sharif, M.; Zafar, M.H.; Aqib, A.I.; Saeed, M.; Farag, M.R.; Alagawany, M. Single cell protein: Sources, mechanism of production, nutritional value and its uses in aquaculture nutrition. Aquaculture 2021, 531, 735885. [Google Scholar] [CrossRef]
  69. Maas, R.M.; Verdegem, M.C.; Stevens, T.L.; Schrama, J.W. Effect of exogenous enzymes (phytase and xylanase) supplementation on nutrient digestibility and growth performance of Nile tilapia (Oreochromis niloticus) fed different quality diets. Aquaculture 2020, 529, 735723. [Google Scholar] [CrossRef]
  70. Hendam, B.M.; Munir, M.B.; Eissa, M.E.; El-Haroun, E.; van Doan, H.; Chung, T.H.; Eissa, E.-S.H. Effects of water additive probiotic, Pediococcus acidilactici on growth performance, feed utilization, hematology, gene expression and disease resistance against Aspergillus flavus of Nile tilapia (Oreochromis niloticus). Anim. Feed. Sci. Technol. 2023, 303, 115696. [Google Scholar] [CrossRef]
  71. Siddik, M.A.B.; Howieson, J.; Fotedar, R. Beneficial effects of tuna hydrolysate in poultry by-product meal diets on growth, immune response intestinal health and disease resistance to Vibrio harveyi in juvenile barramundi, Lates calcarifer. Fish Shellfish Immunol. 2019, 89, 61–70. [Google Scholar] [CrossRef]
  72. Zhang, X.; Sun, Z.; Cai, J. Effects of dietary fish meal replacement by fermented moringa (Moringa oleifera Lam.) leaves on growth performance, nonspecific immunity and disease resistance against Aeromonas hydrophila in juvenile gibel carp (Carassius auratus gibelio var. CAS III). Fish Shellfish Immunol. 2020, 102, 430–439. [Google Scholar] [CrossRef]
  73. Knoop, K.A.; Newberry, R.D. Goblet cells: Multifaceted players in immunity at mucosal surfaces. Mucosal Immunol. 2018, 11, 1551–1557. [Google Scholar] [CrossRef]
  74. Hemaiswarya, S.; Raja, R.; Ravikumar, R.; Carvalho, I.S. Mechanism of action of probiotics. Braz. Arch. Biol. Technol. 2013, 56, 113–119. [Google Scholar] [CrossRef]
  75. Das, P.; Mandal, S.; Khan, A.; Manna, S.K.; Ghosh, K. Distribution of extracellular enzyme-producing bacteria in the digestive tracts of 4 brackish water fish species. Turk. J. Zool. 2014, 38, 79–88. [Google Scholar] [CrossRef]
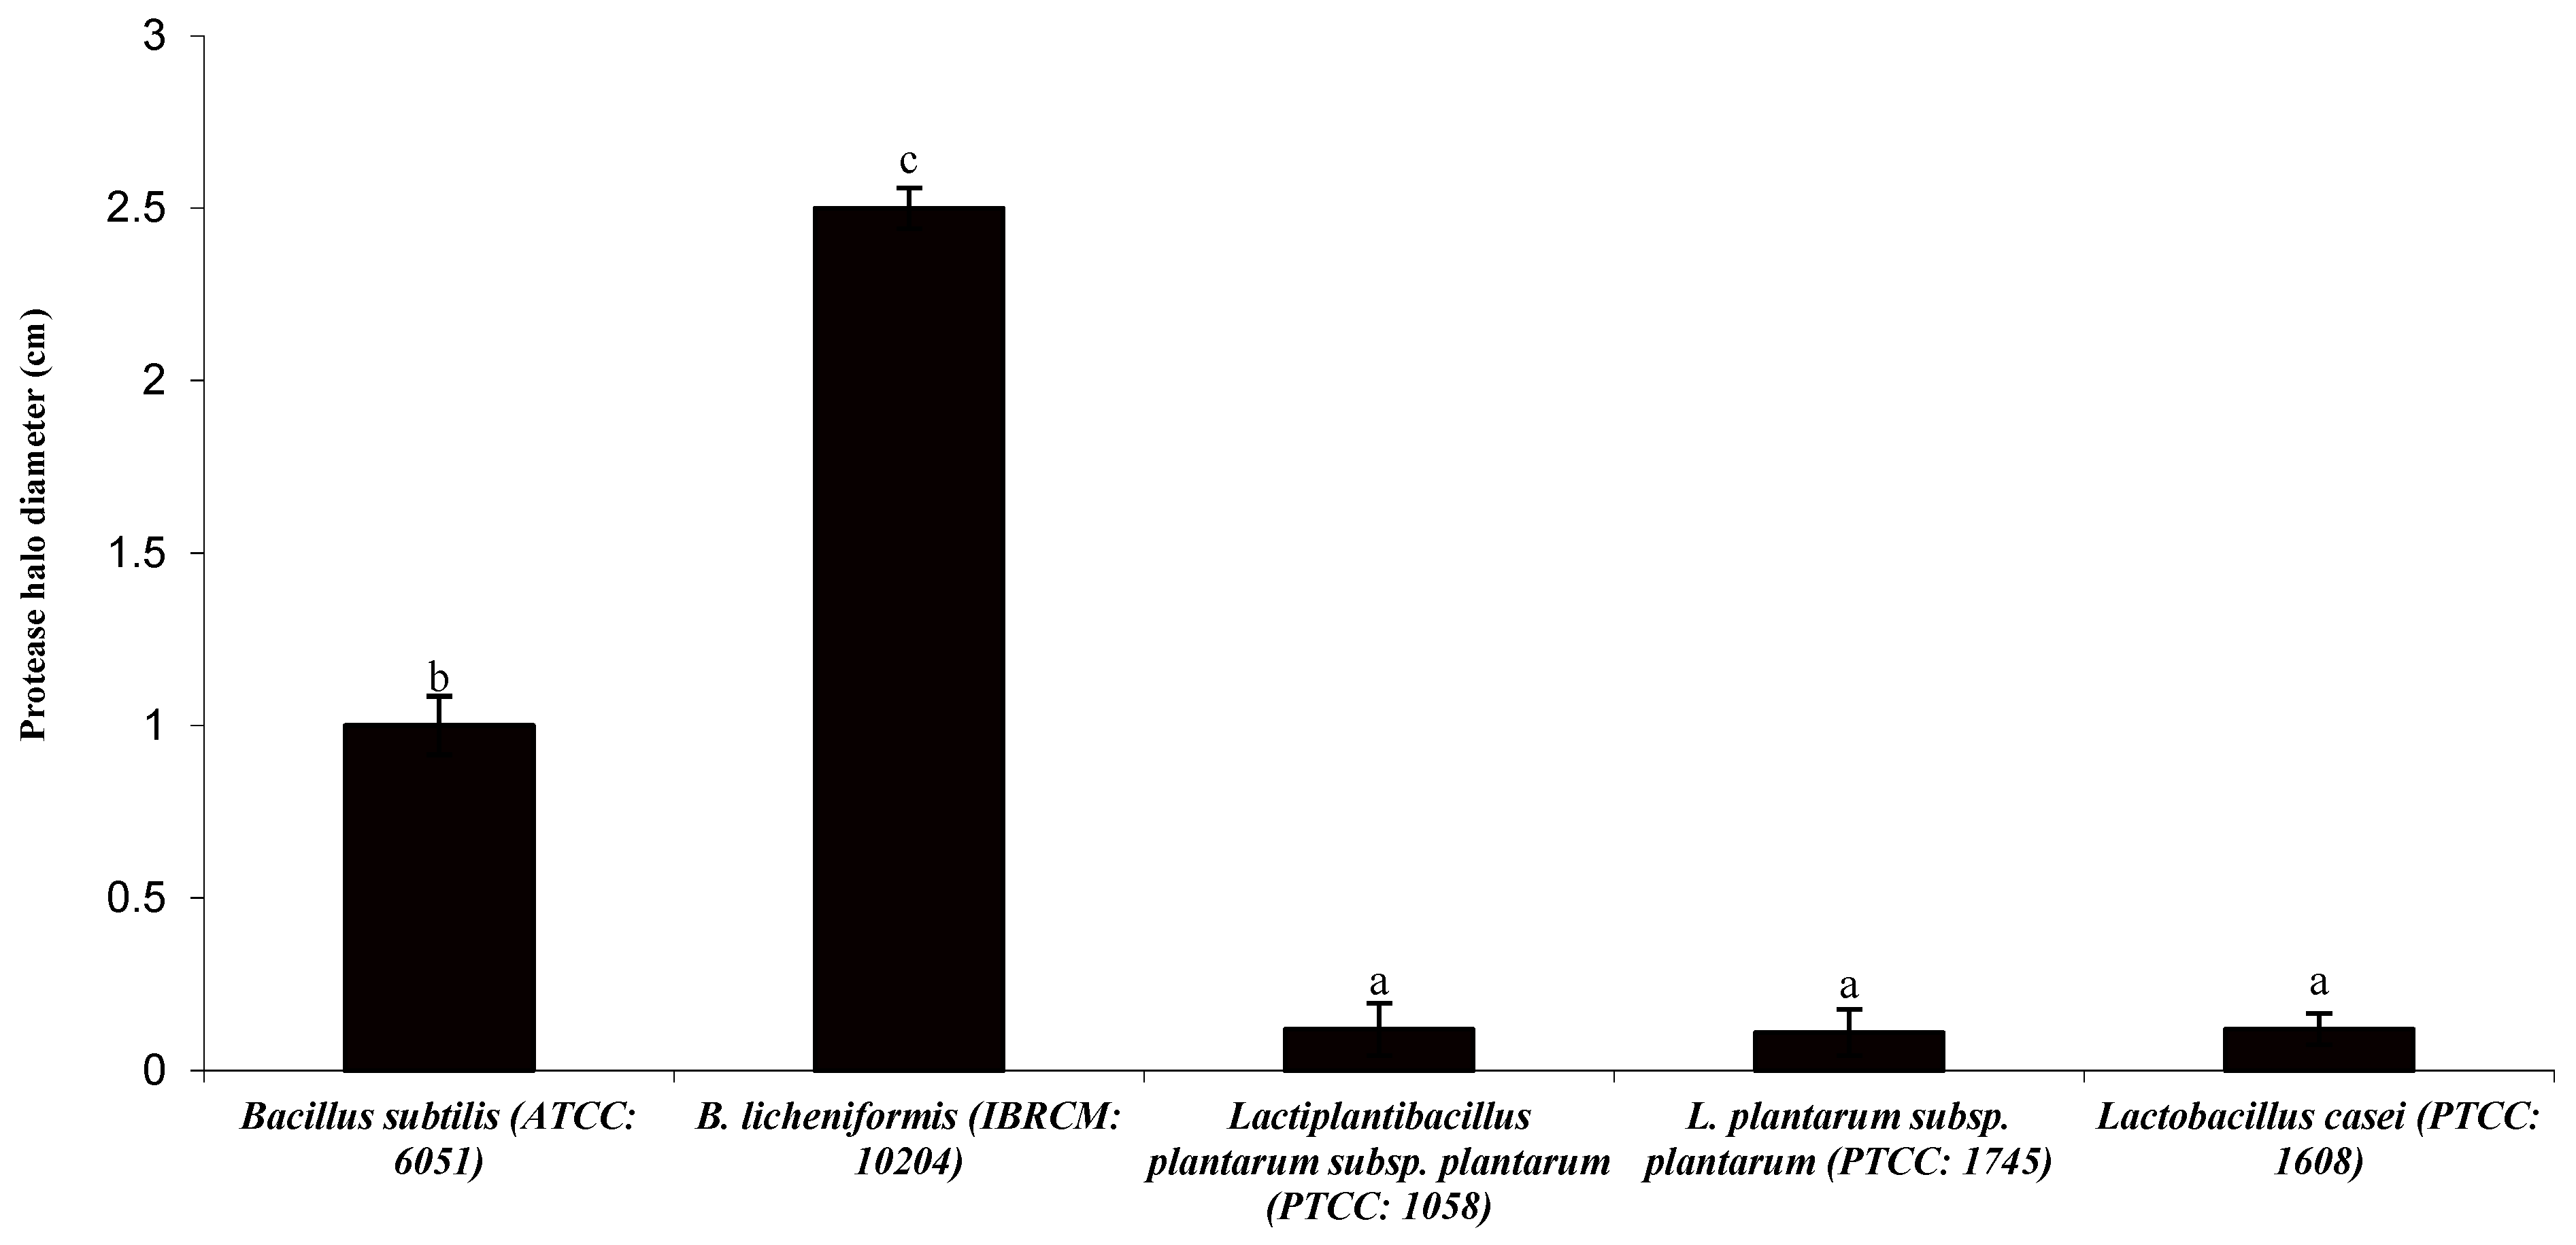
Figure 1. The mean (±SD) of protease halo diameter (cm) of bacteria grown on the selected media at three replicates. The letters a–c showed one-way ANOVA comparison at p < 0.05.
Fishes 10 00556 g001
Figure 2. The mean (±SD) of colony diameter (cm) of bacteria grown on the selected media at three replicates. The letters a–c showed one-way ANOVA comparison at p < 0.05.
Fishes 10 00556 g002
Figure 3. The mean (±SD) of protease halo (cm) to colony diameter (cm) ratio of bacteria grown on the selected media at three replicates. The letters a–c showed one-way ANOVA comparison at p < 0.05.
Fishes 10 00556 g003
Figure 4. (a) Soluble protein concentration (mg mL−1) and bacterial count (colonies mL−1) versus time (h), (b) Display of hydrolyzed protein from Nile tilapia by-product using polyacrylamide gel; bands numbered 1, 2, 3, and 4 corresponded to peptide bands blank sample, 24, 48, and 72 h post-fermentation. Bands numbered 5 and 6 related to bovine albumin protein at concentrations of 1 and 10 mg mL−1, respectively, and band number 7 corresponded to the marker. The arrows indicate the presence of protein bands below 11 kilo Dalton (kDa) at 48 and 72 h of fermentation time, respectively.
Fishes 10 00556 g004
Figure 5. The mean (± SD) effects of using different levels of fermented by-products in the diet on (a) FCR, (b) SGR (% BW day−1), and (c) PPV (%) of Nile tilapia fed the experimental diets for 63 days at three replicates. The letters a–e showed one-way ANOVA comparison at p < 0.05.
Fishes 10 00556 g005
Table 1. Formulation and chemical composition of the control diet and different levels of fishmeal replacement (25, 50, 75, and 100%) with fermented by-product.
Feed Ingredient (g kg−1)ControlDifferent Fishmeal Replacement Levels with Fermented By-Product (%)
255075100
Fishmeal a200150100500
Fermented by-product α057.5115.5173.2231.0
Soybean meal a270270270270270
Wheat gluten a145145145145145
Wheat flour a127127127127127
Corn flour a127127127127127
Fish oil a4040404040
Soybean oil a4040404040
Mineral supplement b*7.57.57.57.57.5
Vitamin supplement b**7.57.57.57.57.5
Carboxymethyl cellulose (CMC) c3628.320.512.85
Chemical composition (g kg−1) d
Dry matter921.3928.7928.7930.6929.3
Crude protein377.1377.1377.1377.1377.1
Crude fat100.8100.7100.7100.7100.7
Crude fiber353534.734.634.5
Nitrogen-free extract413.8412.9412.3412.0411.8
Ash73.374.375.275.675.9
a Saramad Fish Aquafeed Co., Borazjan, Iran. Fishmeal contained 691.2 g kg−1 crude protein and 50.1 g kg−1 ether extract. Fermented by-product contained 576.1 g kg−1 crude protein and 50.4 g kg−1 ether extract. b Kimia Roshd Co. Isfahan, Iran. c Sigma, Darmstadt, Germany. d All proximate chemical composition of feed ingredients and control diet was measured according to AOAC (2005) protocols with the exception of NFE. NFE = dry matter − (crude protein + crude fat + crude fiber + ash). α 25%: fishmeal replacement with fermented fish by-product by 25%; 50%: fishmeal replacement with fermented fish by-product by 50%; 75%: fishmeal replacement with fermented fish by-product by 75%; 100%: fishmeal replacement with fermented fish by-product by 100%; * Mineral supplements (per Kg) containing magnesium, 100 mg; zinc, 60 mg; iron, 40 mg; copper, 5 mg; cobalt, 0.1 mg; iodine, 1 mg; antioxidant (butylhydroxytoluene), 100 mg. ** Vitamin supplements (per Kg) containing vitamin E, 30 mg; vitamin K, 3 mg; thiamine, 2 mg; riboflavin, 7 mg; pyridoxine, 3 mg; Pantothenic acid, 18 mg; niacin, 40 mg; folacin, 1.5 mg; choline, 600 mg; biotin, 0.7 mg; and cyanocobalamin, 0.02 mg.
Table 2. Growth performance and feed utilization parameters of Nile tilapia (O. niloticus) fed the diets supplemented with different levels of fermented by-products for 63 days (mean ± SD, n = 3) *.
ControlFishmeal Replacement Levels with Fermented by-Products (%)
255075100
Initial weight (g)2.83 ± 0.032.81 ± 0.052.81± 0.072.83 ± 0.062.85 ± 0.06
Final weight (g)12.46 ± 0.10 a13.16 ± 0.20 b13.40 ± 0.32 b14.35 ± 0.31 c14.24 ± 0.27 c
Weight gain (g)347.27 ± 1.93 a368.93 ± 4.27 b376.31± 4.31 c407.66 ± 0.85 e399.72 ± 1.41 d
Condition factor (%)2.44 ± 0.192.50 ± 0.382.23 ± 0.432.22 ± 0.072.29 ± 0.30
Protein efficiency ratio1.94 ± 0.03 a2.14 ± 0.01 b2.30 ± 0.03 c2.76 ± 0.02 d2.89 ± 0.02 e
Hepatosomatic index (%)2.88 ± 1.062.31 ± 0.562.36 ± 0.672.50 ± 1.002.70 ± 1.10
Viscerosomatic index (%)8.85 ± 2.38 b7.68 ± 1.63 ab6.93 ± 1.40 a6.89 ± 1.35 a6.70 ± 1.68 a
* The values with different letters in the same row are significantly different (ANOVA, p < 0.05).
Table 3. Proximate chemical composition of Nile tilapia (O. niloticus) carcass fed the diets supplemented with different levels of fermented by-product for 63 days (mean ± SD, n = 3) *.
ControlFishmeal Replacement Levels with Fermented By-Products (%)
255075100
Dry matter (%)95.53 ± 0.11 a95.63 ± 0.06 a95.77 ± 0.15 ab95.90 ± 0.3 ab96.10 ± 0.36 b
Crude protein (%)57.33 ± 0.06 a57.87 ± 0.06 b58.43 ± 0.15 c59.87 ± 0.4 d60.50 ± 0.36 e
Crude lipid (%)9.13 ± 0.20 e8.73 ± 0.06 d8.40 ± 0.10 c7.93 ± 0.15 b7.50 ± 0.10 a
Ash (%)6.80 ± 0.10 a7.40 ± 0.10 b7.80 ± 0.10 c8.60 ± 0.10 d8.87 ± 0.06 e
Carbohydrates (%)26.73 ± 0.23 d26.00 ± 0.17 c25.37 ± 0.15 b23.60 ± 0.6 a23.13 ± 0.29 a
* The values with different letters in the same row are significantly different (ANOVA, p < 0.05).
Table 4. The concentrations of triiodothyronine and thyroxine hormones (ng mL−1) in the blood plasma of Nile tilapia (O. niloticus) fed the diets supplemented with different levels of fermented by-products for 63 days (mean ± SD, n = 3) *.
ControlFishmeal Replacement Levels with Fermented By-Products (%)
255075100
Triiodothyronine
(ng mL−1)
1.33 ± 0.01 a1.40 ± 0.02 b1.60 ± 0.02 c1.87 ± 0.01 d1.85 ± 0.01 d
Thyroxine (ng mL−1)2.26 ± 0.03 a2.37 ± 0.02 b2.50 ± 0.02 c2.90 ± 0.02 d2.90 ± 0.03 d
* The values with different letters in the same row are significantly different (ANOVA, p < 0.05).
Table 5. Lysozyme (mg mL−1), ACH50 (Unit mL−1), and total immunoglobulin levels (mg mL−1) of blood plasma of Nile tilapia (O. niloticus) fed the diets supplemented with different levels of fermented products for 63 days (mean ± SD, n = 3) *.
ControlFishmeal Replacement Levels with Fermented By-Products (%)
255075100
Lysozyme
(mg mL−1)
2.47 ± 0.01 a2.60 ± 0.02 b2.77 ± 0.02 c2.93 ± 0.01 d3.00 ± 0.02 e
ACH50
(Unit mL−1)
3.12 ± 0.01 a3.36 ± 0.01 b3.60 ± 0.02 c3.79 ± 0.03 e3.74 ± 0.01 d
Total immunoglobulin
(mg mL−1)
2.11 ± 0.01 a2.34 ± 0.01 b2.46 ± 0.01 c2.65 ± 0.01 e2.62 ± 0.01 d
* The values with different letters in the same row are significantly different (ANOVA, p < 0.05).
Table 6. The activities (Unit L−1) of catalase, superoxide dismutase, aspartate aminotransferase, and alanine aminotransferase in the hepatopancreas tissue of Nile tilapia (O. niloticus) fed the diets supplemented with different levels of fermented by-products for 63 days (mean ± SD, n = 3) *.
ControlFishmeal Replacement Levels with Fermented By-Products (%)
255075100
Catalase (Unit L−1)1.11 ± 0.02 a1.19 ± 0.02 b1.37 ± 0.01 c1.47 ± 0.02 e1.40 ± 0.02 d
superoxide dismutase
(Unit L−1)
2.36 ± 0.01 a2.40 ± 0.01 b2.58 ± 0.01 c2.80 ± 0.01 c2.70 ± 0.01 d
Aspartate aminotransferase (Unit L−1)0.97 ± 0.005 a1.05 ± 0.025 b1.12 ± 0.01 c1.16 ± 0.01 d1.22 ± 0.03 e
Alanine aminotransferase (Unit L−1)1.34 ± 0.02 a1.38 ± 0.01 b1.58 ± 0.01 c1.80 ± 0.02 d1.79 ± 0.03 d
* The values with different letters in the same row are significantly different (ANOVA, p < 0.05).
Table 7. The activities (Unit mg−1 protein) of amylase, protease and Lipase in the intestinal tissue of Nile tilapia (O. niloticus) fed the diets supplemented with different levels of fermented by-products for 63 days (mean ± SD, n = 3) *.
ControlFishmeal Replacement Levels with Fermented By-Products (%)
255075100
Amylase
(Unit mg−1 protein)
1.34 ± 0.005 a1.38 ± 0.01 b1.44 ± 0.01 c1.60 ± 0.02 d1.60 ± 0.01 d
Protease
(Unit mg−1 protein)
1.66 ± 0.01 a1.80 ± 0.02 b1.97 ± 0.02 c2.16 ± 0.06 d2.10 ± 0.01 d
Lipase
(Unit mg−1 protein)
1.81 ± 0.01 a2.02 ± 0.03 b2.27 ± 0.03 c2.61 ± 0.10 d2.54 ± 0.01 d
* The values with different letters in the same row are significantly different (ANOVA, p < 0.05).
Disclaimer/Publisher’s Note: The statements, opinions and data contained in all publications are solely those of the individual author(s) and contributor(s) and not of MDPI and/or the editor(s). MDPI and/or the editor(s) disclaim responsibility for any injury to people or property resulting from any ideas, methods, instructions or products referred to in the content.