Abstract
The overexploitation of wild populations for the marine ornamental trade necessitates optimized captive breeding, particularly for iconic species like the clownfish Amphiprion ocellaris. This study investigated the social behavior and cognitive abilities of juvenile clownfish in relation to artificial rearing practices. Using modified three-tank tests, we assessed social preference and cognition ability in two size groups: Small-bodied Group (SG: 2.0–2.5 cm) and Large-bodied Group (LG: 3.5–4 cm). The results indicated that clownfish have the following: (a) Strong Social Preference: Both SG and LG exhibited significant preference for areas near conspecifics (SPI > 0), with SG showing significantly higher SPI values than LG. (b) Developmental Stage Differences: SG demonstrated a stronger tendency to cluster tightly near conspecifics. LG showed wider exploration patterns and greater movement. (c) Cognition Ability: SG showed renewed interest towards a novel fish after habituation to a familiar fish, while LG displayed a stronger preference for the familiar fish. These findings suggest that clownfish juveniles possess advanced sociality and basic cognition ability. Furthermore, the observed shift in social interaction preference with developmental stages informs optimal timing for grading practices to minimize artificial rearing stress. This study provides some behavioral insights for optimizing large-scale artificial rearing protocols for clownfish, reducing pressure on wild populations.
Key Contribution:
This article demonstrates that clownfish juveniles possess advanced sociality and basic cognition ability, providing a scientific basis for optimizing captive breeding protocols to enhance fish welfare, improve cultivation efficiency, and ultimately alleviate pressure on wild populations.
1. Introduction
Marine ornamental species are highly sought after due to their striking coloration and distinctive behaviors, driving a global trade in marine aquarium species that has developed into a multibillion-dollar industry. This industry, which originated in the 1930s, has seen substantial growth over the past several decades [1,2,3,4]. The market, valued at approximately $24 to $40 million annually in the 1980s [5], now up to $15 to 30 billion [1,3,4,6,7]. However, the collection of marine ornamental fish poses significant ecological threats to coral reef ecosystems, including the reduction in biodiversity and degradation of habitats in source regions due to overharvesting [8]. Additionally, the illegal use of destructive capture methods, such as cyanide fishing in Southeast Asia, remains a pressing concern [9,10]. These practices not only cause severe and long-lasting damage to coral reefs, but they also endanger the fish collectors and result in high mortality rates among captured fish. It is estimated that only 30 to 40% of marine ornamental fish survive from capture to their final market destination [4].
As a result, the pressure on wild marine ornamental species resources has increased, leading to more species being listed as “Endangered” on the IUCN Red List [11], including corals (Actinozoa), giant clams (Tridacna spp.), and the yellow tang (Zebrasoma flavescens). The clownfish (Amphiprion ocellaris) is a representative species of marine ornamental fish and one of the main characters in the movie “Finding Nemo”. Clownfishes belong to the family Pomacentridae. They exist as a group where the breeding female dominates, and the second-largest fish become the dominant male while the rest of the individuals stay as non-dominant males [12]. This species is known for its symbiotic relationship with sea anemones and corals, a critical interaction for maintaining the ecological balance and biodiversity of coral reef ecosystems [13]. Therefore, there is an urgent need to focus on the conservation of clownfish in the wild, including enhancing artificial breeding practices to reduce the exploitation of natural populations.
Social behavior refers to a series of interactions among individuals of the same species that influence their present or future behavior [14]. In fish, social behaviors include reproductive activities (e.g., courtship and mating), cooperative interactions, shoaling behavior, and the establishment of social hierarchies, all of which are mediated through inter-individual interactions [15].
Fish reared in captivity exhibit significant differences from their wild counterparts. Aquaculture environments often present challenges and stressors for fish, such as high stocking densities, suboptimal rearing conditions, and imbalanced diets. The traditional view of fish as unintelligent and behaviorally rigid is being increasingly challenged, with growing research into fish learning and cognition. Brown [16] provided an overview of fish intelligence, highlighting their sophisticated cognitive abilities and behaviors, such as tool use, spatial navigation, stimulus discrimination, cooperative behavior, social recognition, and long-term memory. Notably, gobies have even passed the mirror self-recognition test [17], further establishing fish as important subjects for behavioral research.
The study of fish behavior has garnered increasing attention. In reality, studies of fish behavior offer several advantages for artificial aquaculture [18]. Additionally, behavioral research on fish has proven effective in managing parasites, as exemplified by the control of the ectoparasitic salmon louse (Lepeophtheirus salmonis) in Atlantic salmon (Salmo salar) [19,20,21]. In the case of clownfish aquaculture, existing studies primarily focus on nutrition and feed, reproductive techniques and skin coloration [21,22,23,24,25,26,27,28]. However, foundational research on large-scale breeding methods remains insufficient, particularly in the context of behavior-based studies. Given this, questions arise: Is the clownfish suitable for intensive farming in controlled environments? How can the optimal timing for grading be determined? Therefore, investigating whether the clownfish possesses social behavior, social preferences, and cognitive capabilities is essential for optimizing production. To address these inquiries, this study was designed to explore the behavioral characteristics of the clownfish, provide theoretical insights and data support for its large-scale aquaculture, and enrich its biological database.
2. Materials and Methods
2.1. Experimental Materials
Clownfish used in this experiment were sourced from a population maintained long-term in the Fish Behavior and Molecular Biology Laboratory at the School of Marine Science and Engineering, Qingdao Agricultural University. They were cultured in recirculating aquaculture system (total water volume of 2000 L) with a temperature-controlled system under a photoperiod of 12 h lightness and 12 h darkness. Clownfish were fed with Haitong commercial feed (CP% ≥ 55, CEE% ≥ 8. from Santong Biotechnology Co. Ltd., Weifang, China) The seawater was refreshed once a month. The dissolved oxygen was 6.5–7.6 mg L−1, according to the daily measurement results (YSI Incorporated, Ohio 45387, USA). The fish were categorized into two size groups: Small Group (2.0–2.5 cm in length, 3.25 ± 0.12 g) (SG) and Large Group (3.5–4 cm in length, 6.37 ± 0.41 g) (LG). The water temperature was controlled at 26 ± 1 °C, with a lighting schedule from 8:00 A.M. to 5:00 P.M. Feeding was conducted twice daily at 9:00 A.M. and 4:00 P.M., with uneaten feed and waste removed 30 min post-feeding.
The experimental setup consisted of a glass aquarium (60 × 30 × 40 cm) as illustrated in Figure 1 (total water volume of 24 L). Video recording was performed using a high-definition action camera GoPro 10 (Gopro, Inc., 3025 Clearview Way, San Mateo, CA 94402, USA) from above the aquarium.
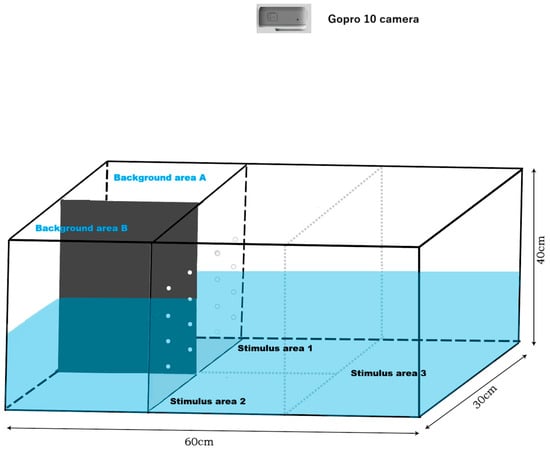
Figure 1.
Representative diagram of the experimental behavioral monitoring aquarium. A black acrylic sheet was used to separate background area A and background area B, where stimulus fish were placed, preventing visual contact between the two areas. Stimulus areas 1, 2, and 3 were separated from background area A and background area B by a transparent acrylic panel with holes, allowing for water flow and visibility while housing the experimental fish. Stimulus areas 1, 2, and 3 were not separated by dividers, permitting the experimental fish to move freely among these three areas.
2.2. Sociality Test
In this study, a modified three-tank experiment was conducted to assess the social behavior of the test clownfish. The experiment evaluated the preferences of the test fish under varying background conditions by altering the presence and number of stimulus fish. The camera was positioned above the experimental tank to capture footage of the test fish. After placing a test fish in the testing area (Stimulus areas 1, 2, and 3) for a 5 min acclimation period, a stimulus fish was randomly introduced into either background area A or background area B. Recording began for a 5 min duration, during which the behavior of the test fish was monitored. The area containing the stimulus fish was labeled as “background area A”, while the area without a stimulus fish was labeled as “background area B”. This experiment was referred to as “1V0”. In the other experiment, a single stimulus fish was randomly assigned to one area, while four stimulus fish were introduced into the other area. Recording then continued for 5 min to track the behavior of the test fish. In this experiment, the area with four stimulus fish was defined as “background area A”, and the area with one stimulus fish was defined as “background area B”. This experiment was referred to as “1V4”. Additionally, in these two experiments, the part adjacent to background area A in the test area was named Stimulus area 1, the part adjacent to background area B in the test area was named Stimulus area 2, and the remaining test area was named Stimulus area 3 (Figure 1).
The Social Preference Index (SPI) was calculated by subtracting the time spent by the test fish in non-social areas (Stimulus area 2 and Stimulus area 3 in this experiment) from the time spent in the social area (Stimulus area 1 in this experiment), followed by dividing the resulting value by the total recorded time [SPI = (tsc − tnsc)/ttotal], where tsc represents the time spent in the social area, tnsc represents the time spent in the non-social areas, and ttotal represents the total duration of the observation.
2.3. Cognition Ability Test
Cognitive Ability Test was employed to evaluate the social cognitive abilities of the test fish. This experiment aimed to determine whether the test fish’s interest and exploration duration would decrease after repeated exposure to the same stimulus fish and whether the introduction of a new stimulus fish would renew the fish’s interest and interaction behavior.
The camera was positioned above the experimental tank to capture recordings. After placing a test fish in the testing area (Stimulus areas 1, 2, and 3) for a 5 min acclimation period, a stimulus fish (designated as fish α) was introduced into one background area, defined as background area A, while the empty area was designated as background area B. The behavior of the test fish was recorded for 6 min, after which fish α was removed, and recording continued for an additional 5 min. Fish α was then reintroduced into background area A, and this procedure was repeated four times. In the fifth round, fish α was replaced with a new stimulus fish (designated as fish β), and the same process was repeated. In the sixth round, both fish α and fish β were placed in background area A and background area B, respectively, and the process was repeated as before. For consistency, the area adjacent to background area A was defined as Stimulus area 1, the area adjacent to background area B as Stimulus area 2, and the remainder area as Stimulus area 3 (Figure 1). So far, the first experiment has been completed. Each experiment was conducted in five replicates. To mitigate stress and eliminate potential chemical residues, the water in the tank was completely replaced with new water after each experiment.
2.4. Data Analysis
Upon completion of video recording, EthoVisionXT 17 (Noldus Information Technology BV., Wageningen, The Netherlands) has been used to analyze the exploration duration, frequency of area entries and distribution of the experimental fish (a total of 80 videos with a total duration of 1160 min). Data analysis was conducted using SPSS 23.0 software (SPSS Inc., Chicago, IL, USA). Data for the results of Exploration Duration in Sociality Test, Frequency of Area Entries in Sociality Test, Social Preference Index in Sociality Test were analyzed by one-way ANOVA. Data for the results of Exploration Duration in Cognition Ability Test were analyzed by one-way ANOVA, followed by Duncan’s multiple comparison. All data were presented as mean ± standard deviation (Mean ± SD), and p < 0.05 was considered to be statistically significant (Table S1).
3. Results
3.1. Sociality Test
3.1.1. Exploration Duration
As shown in Figure 2, the exploration duration trends of the two size groups of clownfish in the Sociality Test for both the 1V0 and 1V4 setups were generally consistent. Figure 2a,c demonstrate that the small-bodied clownfish predominantly explored Stimulus area 1, occupying more than 90% of the total exploration duration. T-test results indicated that the exploration duration in Stimulus area 1 was significantly longer than in Stimulus area 2 and Stimulus area 3 (p < 0.001), with the difference being more pronounced when the stimulus fish was present in the 1V0 configuration. In the 1V4 setup, the exploration duration of small-bodied fish in Stimulus area 2 increased; however, the difference in exploration duration between Stimulus area 2 and Stimulus area 3 was not statistically significant (p > 0.05).
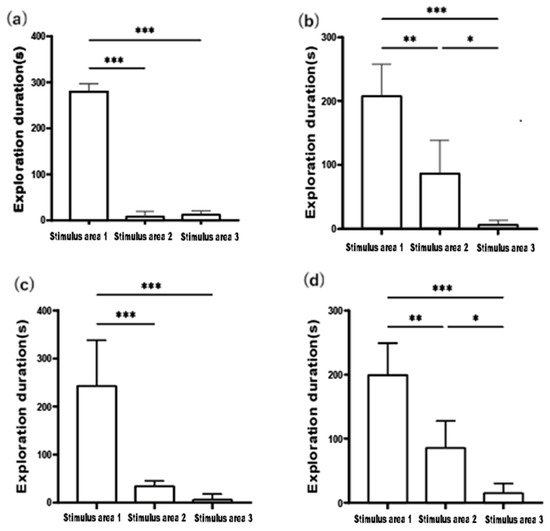
Figure 2.
Exploration duration trends of the two size groups of clownfish in the Sociality Test for both the 1V0 and 1V4. (a) exploration duration of small-bodied A. ocellaris in 1v0 Sociality Test, (b) exploration duration of large-bodied A. ocellaris in 1v0 Sociality Test, (c) exploration duration of small-bodied A. ocellaris in 1v4 Sociality Test, (d) exploration duration of large-bodied A. ocellaris in 1v4 Sociality Test. The total number of fish used in this experiment is 32. The asterisks *, ** and *** mean p < 0.05, p < 0.01 and p < 0.001, respectively.
Figure 2b,d illustrate that large-bodied clownfish spent the most time exploring Stimulus area 1. The exploration duration in Stimulus area 1 was significantly longer than in Stimulus area 2 and Stimulus area 3 (p < 0.001). Moreover, the exploration duration of large-bodied fish in Stimulus area 2 was significantly higher than in Stimulus area 3 (p < 0.05). The exploration duration in Stimulus area 2 for large-bodied fish was slightly greater than that of the small-bodied group. This behavior could be attributed to two possible factors: (1) the large-bodied fish may have been searching for an optimal path to interact with the stimulus fish; (2) they might have been inspecting additional locations to check for the presence of other individuals.
3.1.2. Frequency of Area Entries
As illustrated in Figure 3a,b, the small-bodied experimental fish exhibited low frequency of area entries during both the 1V0 and 1V4 Sociality Test with no significant differences observed (p > 0.05). This suggests that the small-bodied fish hardly moving among the three areas, predominantly staying at in Stimulus area 1. In contrast, the large-bodied experimental fish demonstrated significantly higher exploration frequencies in Stimulus area 1 and Stimulus area 2 compared to Stimulus area 3, with exploration in Stimulus area 1 being significantly greater than in Stimulus area 3 (p < 0.05) (Figure 3b,d). This indicates that the large-bodied fish allocated a considerable portion of their exploratory behavior to Stimulus area 1 and Stimulus area 2, rather than concentrating solely on Stimulus area 1. Both small- and large-bodied fish exhibited very limited exploration activity in Stimulus area 3.
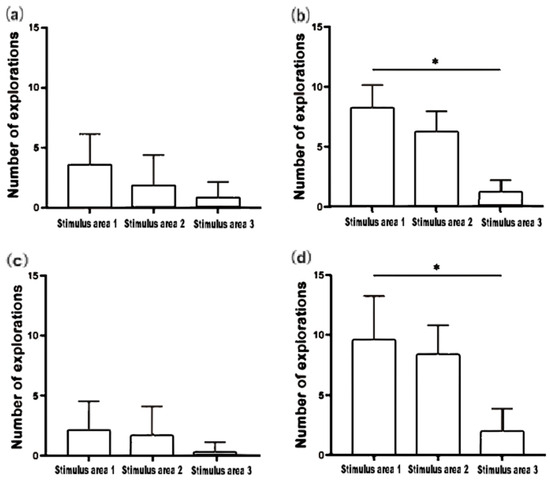
Figure 3.
Frequency of area entries of small-bodied A. ocellaris in 1v0 Sociality Test (a), frequency of area entries of large-bodied A. ocellaris in 1v0 Sociality Test (b), frequency of area entries of small-bodied A. ocellaris in 1v4 Sociality Test (c), frequency of area entries of large-bodied A. ocellaris in 1v4 Sociality Test (d). The total number of fish used in this experiment is 32. The asterisks * means p < 0.05.
3.1.3. Distribution Maps
For the analysis of recorded videos, a frame was extracted every 30 s to generate a single data point, which was used to construct the distribution maps shown in Figure 4a,b presents the position distributions of the small and large-bodied experimental fish, respectively, in the 1V0 test group. Figure 4c,d displays the position distributions of the small and large-bodied fish, respectively, in the 1V4 test group.
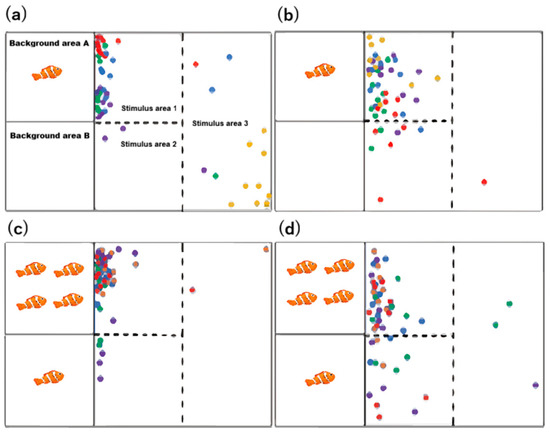
Figure 4.
Distribution maps of small-bodied A. ocellaris in 1v0 Sociality Test (a), distribution maps of large-bodied A. ocellaris in 1v0 Sociality Test (b), distribution maps of small-bodied A. ocellaris in 1v4 Sociality Test (c), distribution maps of large-bodied A. ocellaris in 1v4 Sociality Test (d). A frame was extracted every 30 s to generate a single data point. Different colored dots represent different experimental fish. The total number of fish used in this experiment is 32.
In the 1V0 experiment, the experimental fish predominantly concentrated in Stimulus area 1, where they engaged with the stimulus fish in background area A, with minimal presence in Stimulus area 2 and Stimulus area 3. Similarly, in the 1V4 experiment, the fish remained largely concentrated in Stimulus area 1, focusing on interactions with the greater number of stimulus fish in background area A. A comparison between the two size groups revealed that the large-bodied fish exhibited a more dispersed distribution, with a significantly wider exploration range compared to the small-bodied fish, particularly in the 1V4 experiment.
3.1.4. Social Preference Index (SPI)
As depicted in Figure 5, all four SPI values are greater than 0, with the highest reaching 0.619, indicating a pronounced social preference for conspecific individuals or groups in both size groups of clownfish during the experiment. Notably, the SPI values of the small-bodied clownfish were significantly higher than those of the large-bodied fish. Specifically, the SPI of the small-bodied fish in the 1V4 experiment was significantly greater than the SPI values observed for the large-bodied fish in both experimental conditions.
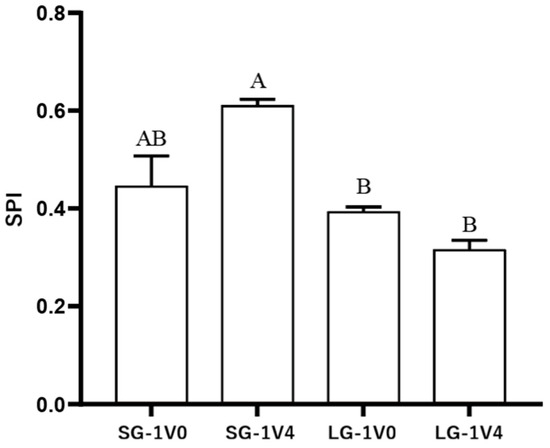
Figure 5.
Social preference index (SPI) of four groups A. ocellaris in Sociality Test. Different letters indicate significant differences among four groups (mean ± SD). SG-1V0 means small-bodied group in test 1V0, SG-1V4 means small-bodied group in test 1V4, LG-1V0 means large-bodied group in test 1V0, LG-1V4 means large-bodied group in test 1V4.
3.2. Cognition Ability Test
As illustrated in Figure 6, in the presence of stimulus fish α, the small-bodied clownfish exhibited a significantly higher proportion of time exploring Stimulus area 1 compared to Stimulus area 2 and Stimulus area 3 during the first four trials, with the exception of the second trial. An overall increasing trend in the time spent in Stimulus area 1 was observed across successive trials, particularly in the third and fourth trials, where the proportion of time spent in Stimulus area 1 exceeded 90%.
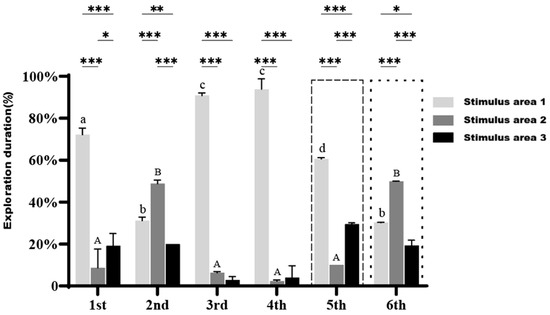
Figure 6.
Exploration duration of small-bodied A. ocellaris in Cognition Ability Test under the presence of stimulus fish across different regions. Different letters indicate significant differences in exploration duration for the same region across six treatments (mean ± SD). Asterisks *, **, and *** represent p < 0.05, p < 0.01, and p < 0.001, respectively, indicating significant differences in exploration duration among the three regions within the same treatment. The total number of fish used in this experiment is 15.
In the fifth trial, when stimulus fish α was replaced with fish β, the proportion of time spent in Stimulus area 1 by the test fish significantly decreased compared to the third and fourth trials (p < 0.05). Meanwhile, the time spent exploring Stimulus area 2 and Stimulus area 3 noticeably increased but remained significantly lower than the time spent in Stimulus area 1 (p < 0.001).
In the sixth trial, with both stimulus fish α and β present simultaneously, the time spent exploring Stimulus area 2 was significantly higher than that in Stimulus area 1 and Stimulus area 3 (p < 0.01), indicating that the small-bodied clownfish displayed greater interest and curiosity toward the “new companion” (stimulus fish β).
After the removal of the stimulus fish in the six trials, the exploration duration of the small-bodied clownfish across the three areas are presented in Figure 7. The fish continued to spend the most time in Stimulus area 1 (except during the second trial), significantly more than in Stimulus area 2 and Stimulus area 3. This trend generally increased over time, with a marked rise in the fourth trial compared to the first three trials. However, compared to when the stimulus fish were present, the percentage of time spent in Stimulus area 1 decreased overall, while the time spent in Stimulus area 2 and Stimulus area 3 increased, suggesting that the fish were searching for the missing stimulus fish.
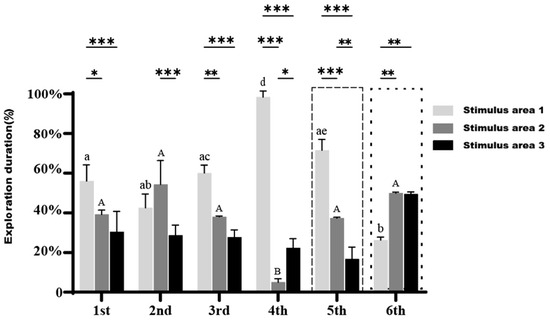
Figure 7.
Exploration duration of small-bodied A. ocellaris in Cognition Ability Test without stimulus fish across different regions. Different letters indicate significant differences in exploration duration for the same region across six treatments (mean ± SD). Asterisks *, **, and *** represent p < 0.05, p < 0.01, and p < 0.001, respectively, indicating significant differences in exploration duration among the three regions within the same treatment. The total number of fish used in this experiment is 15.
In the fifth trial, when the stimulus fish β was removed, the time spent exploring Stimulus area 1 significantly decreased compared to the fourth trial (p < 0.05), and the time distribution across areas resembled that of the first three trials. In the sixth trial, after the removal of both stimulus fish α and β, the percentage of time spent exploring Stimulus area 2 and Stimulus area 3 was significantly higher than that in Stimulus area 1 (p < 0.01), with exploration duration in Stimulus area 3 surpassing that in Stimulus area 1.
As shown in Figure 8, in the presence of stimulus fish α, the large-bodied clownfish consistently spent a significantly higher percentage of time exploring Stimulus area 1 compared to Stimulus area 2 and Stimulus area 3 across the first four trials, without exception. A slight increasing trend in the time spent in Stimulus area 1 was observed with each successive trial. In the fifth trial, when stimulus fish α was replaced with fish β, the percentage of time spent exploring Stimulus area 1 increased significantly compared to the previous four trials (p < 0.05), reaching 90.3%.
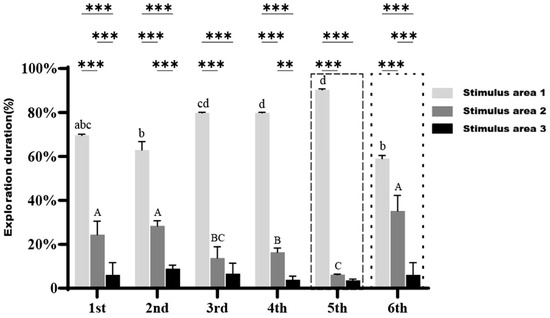
Figure 8.
Exploration duration of large-bodied A. ocellaris in Cognition Ability Test under the presence of stimulus fish across different regions. Different letters indicate significant differences in exploration duration for the same region across six treatments (mean ± SD). Asterisks ** and *** represent p < 0.01 and p < 0.001, respectively, indicating significant differences in exploration duration among the three regions within the same treatment. The total number of fish used in this experiment is 15.
In the sixth trial, where both stimulus fish α and β were present, the combined percentage of time spent exploring Stimulus area 1 and Stimulus area 2 reached 94%, with nearly no exploration of Stimulus area 3. The time spent in Stimulus area 1 remained significantly higher than in Stimulus area 2, indicating that large-bodied clownfish exhibited a stronger interest in the “familiar companion”, in contrast to the behavior of small-bodied clownfish, which showed a preference for the “new companion”.
After the removal of the stimulus fish in the six trials, the exploration duration of the large-bodied clownfish across the three areas are presented in Figure 9. During the first and fourth trials, the fish spent the majority of their time in Stimulus area 1, whereas in the second and third trials, they primarily explored Stimulus area 2, with significant differences observed between the areas (p < 0.05).
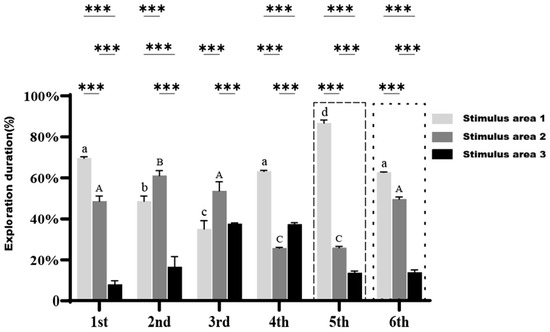
Figure 9.
Exploration duration of large-bodied A. ocellaris in Cognition Ability Test without stimulus fish across different regions. Different letters indicate significant differences in exploration duration for the same region across six treatments (mean ± SD). Asterisks *** represent p < 0.001, respectively, indicating significant differences in exploration duration among the three regions within the same treatment. The total number of fish used in this experiment is 15.
In the fifth trial, following the removal of stimulus fish β, the time spent in Stimulus area 1 increased significantly (p < 0.05), which was notably higher than the time spent in Stimulus area 1 after the removal of stimulus fish α in the previous four trials. In the sixth trial, after both stimulus fish α and β were removed, the fish restricted their exploration almost exclusively to Stimulus area 1 and Stimulus area 2, with the combined exploration duration exceeding 90%. This indicated that large-bodied clownfish were more adept at identifying that stimulus fish were likely to be found only in these two areas, demonstrating a distinct difference in spatial awareness and exploration patterns compared to small-bodied clownfish.
4. Discussion
4.1. Clownfish Demonstrate Distinct Social Preferences and Shoaling Behavior
Sociality is an essential aspect of animal behavior [29], characterized by cooperative interactions among individuals and widely observed across various taxa in the animal kingdom [30]. This phenomenon is typically marked by the tendency of conspecifics to form cohesive groups and engage in reciprocal, cooperative behaviors [31,32]. Most animal taxa exhibit a propensity for group formation and social organization. The benefits associated with group living are well documented, including improved foraging efficiency and enhanced protection from predators [33]. In fish species, social behaviors often manifest through aggregation, schooling, and a focus on coexistence [34,35,36,37], significantly influencing foraging strategies and reproductive success, especially among coral reef fishes [38,39,40].
The present study investigated the social preferences of large and small-bodied clownfish, revealing a significant tendency to explore background where conspecifics are present (the “fish-present” scenario) compared to background devoid of conspecifics (the “fish-absent” scenario). Furthermore, these fish exhibited a marked preference for larger groups over smaller ones. These findings suggest that clownfish demonstrate a strong shoaling toward social aggregation with conspecifics, indicating the presence of advanced sociality and basic cognition ability that enables them to distinguish between different group sizes. Similar phenomena have also been found in zebrafish (Danio rerio) and other species [41,42,43,44,45]. Clownfish demonstrates intricate social behaviors, including the ability to differentiate between large and small groups of fish, as well as a pronounced tendency to cluster with conspecifics. Our study revealed that smaller individuals (less than 3 cm) exhibit a stronger propensity for clustering, which may be closely linked to their ecological and social adaptation strategies.
Group living, or shoaling, offers several advantages to animals, including increased opportunities for mate selection, enhanced foraging success, improved swimming efficiency, and heightened defense mechanisms against predators [46,47,48,49,50]. In most teleost fish, individuals form groups mainly as a strategy to reduce the risk of predation, thereby improving their adaptability to environmental challenges [51,52]. The increased tendency to cluster observed in smaller clownfish likely arises from the greater survival benefits associated with group living. Smaller individuals are more vulnerable to predation, and shoaling can create “confusion effects” and “dilution effects”, which effectively lower the likelihood of being targeted by predators [53]. Additionally, shoaling fish can detect nearby predators more quickly and share this information throughout the group, thereby enhancing collective vigilance [54,55]. Shoaling also facilitates synchronized movement, allowing individuals within the group to execute complex escape maneuvers more effectively [56]. Thus, shoaling significantly influences the behavioral ecology of the clownfish.
4.2. Developmental Stage-Based Differences Exist in Their Cognition and Behavior
Cognition, defined as the ability to acquire, process, and utilize environmental information, encompasses various processes such as memory, learning, and decision-making [57,58]. Although the brains of fish are anatomically simpler compared to those of mammals, fish exhibit cognitive capacities that enable them to process complex information and generate adaptive behavioral responses [59]. This has led to increasing scientific interest in understanding how fish, with their relatively simple neural structures, are capable of sophisticated cognitive behaviors [60,61,62,63]. For instance, many fish adjust their behaviors based on the number of individuals in their social group [64]. Males, for example, may modulate sperm release in response to the number of males and females present, thereby optimizing their reproductive success [65].
It is important to recognize that optimal cognitive functioning is closely linked to improved well-being. Individuals with healthy and intact cognitive abilities demonstrate greater behavioral flexibility, allowing them to respond more effectively to changes in their environment [66]. This includes enhanced capabilities in acquiring resources, identifying escape routes and shelters, avoiding predators, selecting mates, and engaging in social interactions [67]. Consequently, individuals exhibiting complex cognitive behaviors are likely to experience a wider range of emotions, including potentially negative emotional states such as “separation anxiety” [59,68]. This study further indicate cognitive ability differences occurs between clownfish at different developmental stages. Notably, after the removal of stimulus fish, the larger experimental fish predominantly explored Stimulus area 1 and Stimulus area 2 while completely avoiding Stimulus area 3. In contrast, the smaller fish did not exhibit this level of discernment or “intelligence”. This observed difference may be attributable to factors such as age or sex, as clownfish are known to undergo sex reversal [69], and the smaller individuals may not yet have reached sexual differentiation.
Social preference is defined as an individual’s inclination to associate with others of the same species [70]. In zebrafish, this social behavior is assessed by examining the individual’s response to social stimuli or interactions. Social animals frequently engage with conspecifics, and their ability to modulate behavioral expressions in order to optimize these interactions—referred to as social ability—has significant implications for Darwinian fitness. A critical component of social ability is the individual’s capacity to recognize and differentiate between other individuals, which enables them to recall past interactions and adapt their future behaviors accordingly.
At a cognitive level, social recognition relies on recognition memory, a process that is not limited to social stimuli but also applies to object recognition. In a laboratory setting, social memory can be assessed by observing changes in spontaneous exploratory behavior when individuals are re-exposed to familiar versus novel conspecifics. While social recognition memory has been extensively studied in rodents, zebrafish have also shown consistent recognition of previously encountered (or familiar) conspecifics, thereby extending evidence of this cognitive function to cyprinid fish. Zebrafish exhibit a strong tendency to explore novel individuals rather than familiar ones, a behavior believed to enhance male mating opportunities by increasing encounters with potential new mates. Our research revealed that smaller individuals of the clownfish exhibit a higher frequency of exploration toward novel stimulus fish, while larger individuals tend to explore previously familiar stimulus fish. This suggests that as the clownfish matures, there is a gradual shift in preference toward interacting with familiar conspecifics or “old friends”.
4.3. Some Implications for Aquaculture Practices
The artificial rearing of marine ornamental fish, which includes the processes of spawning, hatching, settlement, and growth in a controlled environment, is a crucial strategy for supporting the marine ornamental fish trade [71]. Despite its potential, several significant challenges impede the widespread production of marine ornamental fish [71,72,73]. A primary bottleneck in this production is the successful rearing of juvenile fish [73,74,75,76]. Enhancing research efforts in marine ornamental fish aquaculture is essential for overcoming these challenges and increasing the availability of captive-bred (CB) species.
This finding may also be relevant to the optimization of management strategies in large-scale captive breeding programs, particularly regarding the appropriate timing for grading processes based on the social preferences of the fish. There are numerous successful examples of utilizing innate fish behavior patterns to enhance aquaculture management practices. By eliciting specific behavioral responses to controlled stimuli, effective behavioral control and manipulation can be achieved. For instance, the avoidance response of rainbow trout (Oncorhynchus mykiss) to carbon dioxide has been used to facilitate the transfer of fish from one rearing tank to another [77,78]. Similarly, the behavioral responses of Atlantic salmon (Salmo salar) to light and water flow direction have been employed to promote self-transportation within aquaculture facilities [79].
In the practice of clownfish farming, our study suggests that grading processes should be implemented before the fish reach larger sizes. This approach can effectively mitigate stress, behavioral conflicts, and other negative effects associated with delayed partitioning. Larger clownfish exhibit a preference for familiar conspecifics, likely due to their reliance on known environments and social groups to reduce stress and enhance survival rates. Conversely, smaller individuals demonstrate a preference for novel conspecifics, possibly because they have not yet developed a dependence on familiar environments or social groups. Similar successful strategies have been employed in other aquaculture practices, such as utilizing the phototactic behavior of Atlantic salmon to regulate swimming depth, thereby minimizing contact with parasites. By understanding and leveraging the natural behaviors of fish, aquaculture efficiency can be improved while simultaneously enhancing fish welfare [19,20,21].
In summary, optimizing tank partitioning strategies by taking into account the social preferences of clownfish at various developmental stages can significantly enhance outcomes for large-scale artificial rearing. This approach not only mitigates the risk of damage caused by behavioral conflicts during breeding but also fosters better health and growth in the fish, resulting in increased aquaculture efficiency and improved overall welfare of the species.
4.4. Limitations and Future Research Directions
Research on fish behavior is essential for advancing and guiding the aquaculture industry. As a preliminary investigation into the behavior of clownfish, this study has several limitations. Notably, behavioral variations among individuals of different sizes may be influenced by their sex-reversal characteristics. Future research should incorporate gender effects, as previous studies indicate that sex reversal in clownfish typically occurs between 2.5 cm and 4 cm in body length. This physiological phenomenon can significantly impact various aspects of fish behavior, including social structure, reproductive behaviors, predation, and social interactions. Furthermore, future studies should explore the underlying mechanisms driving behavioral differences in clownfish. This includes examining factors such as enzyme activity, neurotransmitter levels, and genetic influences to gain a comprehensive understanding of the behavioral adaptations associated with sex reversal and other variables.
5. Conclusions
This study demonstrates that juvenile clownfish A. ocellaris exhibit strong social preferences and basic cognition ability, which are influenced by developmental stages. Smaller juveniles show a stronger tendency to cluster near conspecifics and display heightened interest in novel social stimuli, while larger juveniles exhibit broader exploration patterns and a preference for familiar individuals. These findings suggest that clownfish juveniles possess advanced sociality and basic cognition ability. Furthermore, the shift in social preference with developmental stages provides a behavioral basis for optimizing grading practices, reducing stress during artificial rearing. This study offers some insights for developing behavior-informed aquaculture protocols to enhance the sustainability of clownfish production and reduce reliance on wild populations.
Supplementary Materials
The following supporting information can be downloaded at: https://www.mdpi.com/article/10.3390/fishes10110549/s1, Table S1: The Groups Compared and Statistical Test Used in each experiment.
Author Contributions
Conceptualization, G.W. and K.X.; Methodology, G.W., C.W. and K.X.; formal analysis, G.W., J.L. (Jixiang Liu), J.Y., S.M., Z.W., Y.H., X.L. (Xiaohan Li), W.Y., X.L. (Xiaohan Li), X.L. (Xinyu Li), J.L. (Jiahao Li), K.X. and W.X.; writing—original draft, writing—review and editing, J.Y. and W.X.; supervision, K.X. and G.W.; funding acquisition, G.W., K.X. and C.W. All authors have read and agreed to the published version of the manuscript.
Funding
This research was supported by the Key R&D Program of Shandong Province (2024TZXD048); the Shandong Modern Agricultural Industrial Technology System (SDAIT-22-05, 10, 15); Qingdao Science and Technology Benefit-to-the-People Demonstration Project (25-1-5-xdny-7-nsh); Shandong Marine Science and Technology Achievement Transfer and Transformation Center “Champion Project” (2024JBGS03). This research was also financially supported also by “First class fishery discipline” programme and a special talent programme “One Thing One Decision (Yishi Yiyi)” programme in Shandong Province, China. The funders had no role in the study design, data collection and analysis, decision to publish, or preparation of the manuscript.
Institutional Review Board Statement
Our study is approved by the Laboratory Animal Ethic Committee of School of Marine Science and Engineering, Qingdao Agricultural University (QAU-SMSE-202207; 8 July 2022).
Data Availability Statement
The original contributions presented in this study are included in the article. Further inquiries can be directed to the corresponding author.
Acknowledgments
We thank Marian YL Wong from University of Wollongong in Australia for her guidance and inspiration for this research during my time as a visiting scholar.
Conflicts of Interest
The authors declare no conflicts of interest.
References
- Leal, M.C.; Vaz, M.C.M.; Puga, J.; Rocha, R.J.M.; Brown, C.; Rosa, R.; Calado, R. Marine ornamental fish imports in the European Union: An economic perspective. Fish Fish. 2016, 17, 459–468. [Google Scholar] [CrossRef]
- Murray, J.M.; Watson, G.J.; Giangrande, A.; Licciano, M.; Bentley, M.G. Managing the marine aquarium trade: Revealing the data gaps using ornamental polychaetes. PLoS ONE 2012, 7, e29543. [Google Scholar] [CrossRef]
- Rhyne, A.L.; Tlusty, M.F.; Schofield, P.J.; Kaufman, L.; Morris, J.A.; Bruckner, A.W. Revealing the appetite of the marine aquarium fish trade: The volume and biodiversity of fish imported into the United States. PLoS ONE 2012, 7, e35808. [Google Scholar] [CrossRef]
- Wabnitz, C. From Ocean to Aquarium: The Global Trade in Marine Ornamental Species; UNEP/Earthprint: Nairobi, Kenya, 2003. [Google Scholar]
- Wood, E. Exploitation of Coral Reef Fishes for the Aquarium Trade; Marine Conservation Society Press: Ross-on-Wye, UK, 1985. [Google Scholar]
- FAO. Trade and Market News. In Proceedings of the 3rd International Ornamental Fish Trade and Technical Conference, Kuala Lumpur, Malaysia, 25–26 February 2021. [Google Scholar]
- Palmtag, M.R. The Marine Ornamental Species Trade. In Marine Ornamental Species Aquaculture; Calado, R., Olivotto, I., Oliver, M.P., Holt, G.J., Eds.; Wiley: Hoboken, NJ, USA, 2017; pp. 3–14. [Google Scholar]
- Dammannagoda, S.T. Sustainable Fishing Methods in the Asia Pacific Region. In Sustainable Aquaculture; Springer: Berlin/Heidelberg, Germany, 2018; pp. 95–122. [Google Scholar]
- Cohen, F.P.; Valenti, W.C.; Calado, R. Traceability issues in the trade of marine ornamental species. Rev. Fish. Sci. 2013, 21, 98–111. [Google Scholar] [CrossRef]
- Vagelli, A.A. The Banggai Cardinalfish: Natural History, conservation, and Culture of Pterapogon Kauderni; Wiley-Blackwell: Hoboken, NJ, USA, 2011; p. 224. [Google Scholar]
- IUCN. The IUCN Red List of Threatened Species, 2019. Available online: http://www.iucnredlist.org/ (accessed on 1 July 2021).
- Fautin, D.G.; Allen, G.R. Field Guide to Anemone Fishes and their Host Sea Anemones; Western Australian Museum: Perth, Australia, 1992. [Google Scholar]
- Carneiro, M.D.D.; Medeiros, R.S.D.; Monserrat, J.M.; Rodrigues, R.V.; Sampaio, L.A. Growth and oxidative stress of clownfish Amphiprion ocellaris reared at different salinities. Fishes 2024, 9, 30. [Google Scholar] [CrossRef]
- Robinson, G.E.; Fernald, R.D.; Clayton, D.F. Genes and social behavior. Science 2008, 322, 896–900. [Google Scholar] [CrossRef]
- Gonçalves-de-Freitas, E.; Teresa, F.B.; Gomes, F.S.; Giaquinto, P.C. Social Behavior and Welfare in Fish. In Fish Welfare; Wiley-Blackwell: Hoboken, NJ, USA, 2019; pp. 85–102. [Google Scholar]
- Brown, C. Fish intelligence, sentience and ethics. Anim. Cogn. 2015, 18, 1–17. [Google Scholar] [CrossRef]
- Kohda, M.; Hotta, T.; Takeyama, T.; Awata, S.; Tanaka, H.; Asai, J.Y.; Jordan, A.L. If a fish can pass the mark test, what are the implications for consciousness and self-awareness testing in animals? PLoS Biol. 2019, 17, e3000021. [Google Scholar] [CrossRef]
- Georgia, M.; Samantha, B.; Frode, O.; Tim, D. Challenges and benefits of applying fish behaviour to improve production and welfare in industrial aquaculture. Rev. Aquac. 2020, 13, 934–948. [Google Scholar] [CrossRef]
- Oppedal, F.; Juell, J.E.; Johansson, D. Thermo-and photoregulatory swimming behaviour of caged Atlantic salmon: Implications for photoperiod management and fish welfare. Aquaculture 2007, 265, 70–81. [Google Scholar] [CrossRef]
- Oppedal, F.; Dempster, T.; Stien, L.H. Environmental drivers of Atlantic salmon behaviour in sea-cages: A review. Aquaculture 2011, 311, 1–18. [Google Scholar] [CrossRef]
- Stien, L.H.; Fosseidengen, J.E.; Malm, M.E.; Sveier, H.; Torgersen, T.; Wright, D.W.; Oppedal, F. Low intensity light of different colours modifies Atlantic salmon depth use. Aquac. Eng. 2014, 62, 42–48. [Google Scholar] [CrossRef]
- Díaz-Jiménez, L.; Hernández-Vergara, M.P.; Pérez-Rostro, C.I.; Olvera-Novoa, M.Á. The effect of two carotenoid sources, background colour and light spectrum on the body pigmentation of the clownfish Amphiprion ocellaris. Aquac. Res. 2021, 52, 3052–3061. [Google Scholar] [CrossRef]
- Lee, M.C.; Huang, C.Y.; Huang, J.; Chang, C.Y.; Lee, P.T.; Nan, F.H. The Effect of dietary supplementation with haematococcus pluvialis for enhanced pigmentation in Amphiprion ocellaris. Aquac. Res. 2023, 2023, 5542730. [Google Scholar] [CrossRef]
- Nhan, H.T.; Tran, M.X.; Liew, H.J.; Tran, T.T.H.; Jha, R. Effects of natural dietary carotenoids on skin coloration of false Clownfish (Amphiprion ocellaris Cuvier, 1830). Aquaculture 2019, 25, 662–668. [Google Scholar] [CrossRef]
- Nguyen, H.T.T.; Tran, A.N.T.; Ha, L.T.L.; Ngo, D.N.; Dang, B.T.; Geffen, A.J. Host choice and fitness of anemonefish Amphiprion ocellaris (Perciformes: Pomacentridae) living with host anemones (Anthozoa: Actiniaria) in captive conditions. J. Fish Biol. 2019, 94, 937–947. [Google Scholar] [CrossRef]
- Phillips, E.; DeAngelis, R.; Gogola, J.V.; Rhodes, J.S. Spontaneous alloparental care of unrelated offspring by non-breeding Amphiprion ocellaris in absence of the biological parents. Sci. Rep. 2020, 10, 4610. [Google Scholar] [CrossRef]
- Roux, N.; Logeux, V.; Trouillard, N.; Pillot, R.; Magré, K.; Salis, P.; Lecchini, D.; Besseau, L.; Laudet, V.; Romans, P. A star is born again: Methods for larval rearing of an emerging model organism, the False Clownfish Amphiprion ocellaris. J. Exp. Zool. B Mol. Dev. Evol. 2021, 336, 376–385. [Google Scholar] [CrossRef]
- Soman, M.; Chadha, N.K.; Madhu, K.; Madhu, R.; Sawant, P.B.; Francis, B. Optimization of temperature improves embryonic development and hatching efficiency of false clown fish, Amphiprion ocellaris Cuvier, 1830 under captive condition. Aquaculture 2021, 536, 736417. [Google Scholar] [CrossRef]
- Dunbar, R.I. The social role of touch in humans and primates: Behavioural function and neurobiological mechanisms. Neurosci. Biobehav. Rev. 2010, 34, 260–268. [Google Scholar] [CrossRef] [PubMed]
- Tinbergen, N. Social Behaviour in Animals (Psychology Revivals): With Special Reference to Vertebrates; Psychology Press: London, UK, 2013. [Google Scholar]
- Wilson, E.O. Sociobiology: The New Synthesis, 25th ed.; Harvard University Press: Cambridge, MA, USA, 2000; p. 720. [Google Scholar]
- Aviles, L.; Harwood, G. A quantitative index of sociality and its application to group-living spiders and other social organisms. Ethology 2012, 118, 1219–1229. [Google Scholar] [CrossRef]
- Gonçalves, C.; Kareklas, K.; Teles, M.C.; Varela, S.A.; Costa, J.; Leite, R.B.; Paixao, T.; Oliveira, R.F. Phenotypic architecture of sociality and its associated genetic polymorphisms in zebrafish. Genes Brain Behav. 2022, 21, e12809. [Google Scholar] [CrossRef] [PubMed]
- Haulsee, D.E.; Fox, D.A.; Breece, M.W.; Brown, L.M.; Kneebone, J.; Skomal, G.B.; Oliver, M.J. Social network analysis reveals potential fission-fusion behavior in a shark. Sci. Rep. 2016, 6, 34087. [Google Scholar] [CrossRef] [PubMed]
- Kasumyan, A.; Pavlov, D. Evolution of schooling behavior in fish. J. Ichthyol. 2018, 58, 670–678. [Google Scholar] [CrossRef]
- Parrish, J.K.; Viscido, S.V.; Grunbaum, D. Self-organized fish schools: An examination of emergent properties. Biol. Bull. 2002, 202, 296–305. [Google Scholar] [CrossRef]
- Roose, R.; Oliver, M.; Haulsee, D.; Breece, M.; Carlisle, A.; Fox, D. The sociality of Atlantic sturgeon and sand tiger sharks in an estuarine environment. Anim. Behav. 2022, 193, 181–191. [Google Scholar] [CrossRef]
- Hing, M.L.; Klanten, O.S.; Dowton, M.; Brown, K.R.; Wong, M.Y. Repeated cyclone events reveal potential causes of sociality in coral-dwelling Gobiodon fishes. PLoS ONE 2018, 13, e0202407. [Google Scholar] [CrossRef] [PubMed]
- Nowicki, J.P.; Walker, S.P.; Coker, D.J.; Hoey, A.S.; Nicolet, K.J.; Pratchett, M.S. Pair bond endurance promotes cooperative food defense and inhibits conflict in coral reef butterflyfish. Sci. Rep. 2018, 8, 6295. [Google Scholar] [CrossRef]
- Thompson, C.A.; Matthews, S.; Hoey, A.S.; Pratchett, M.S. Changes in sociality of butterflyfishes linked to population declines and coral loss. Coral Reefs 2019, 38, 527–537. [Google Scholar] [CrossRef]
- Agrillo, C.; Petrazzini, M.E.M.; Bisazza, A. Numerical abilities in fish: A methodological review. Behav. Process. 2017, 141, 161–171. [Google Scholar] [CrossRef]
- Gómez-Laplaza, L.M.; Gerlai, R. Can angelfish (Pterophyllum scalare) count? Discrimination between different shoal sizes follows Weber’s law. Anim. Cogn. 2011, 14, 1–9. [Google Scholar] [CrossRef]
- Gómez-Laplaza, L.M.; Gerlai, R. Spontaneous discrimination of small quantities: Shoaling preferences in angelfish (Pterophyllum scalare). Anim. Cogn. 2011, 14, 565–574. [Google Scholar] [CrossRef]
- Gómez-Laplaza, L.M.; Gerlai, R. Quantification abilities in angelfish (Pterophyllum scalare): The influence of continuous variables. Anim. Cogn. 2013, 16, 373–383. [Google Scholar] [CrossRef]
- Gomez-Laplaza, L.M.; Gerlai, R. Discrimination of large quantities: Weber’s law and short-term memory in angelfish, Pterophyllum scalare. Anim. Behav. 2016, 112, 29–37. [Google Scholar] [CrossRef]
- Fu, S.J.; Li, J.Q. The effect of simulated predation stimulation on shoaling behavior of Spinibarbus sinensis with different sociability. Chin. J. Ecol. 2022, 41, 2382. [Google Scholar]
- Hemelrijk, C.K.; Reid, D.; Hildenbrandt, H.; Padding, J. The increased efficiency of fish swimming in a school. Fish Fish. 2015, 16, 511–521. [Google Scholar] [CrossRef]
- Killen, S.S.; Fu, C.; Wu, Q.; Wang, Y.X.; Fu, S.J. The relationship between metabolic rate and sociability is altered by food deprivation. Funct. Ecol. 2016, 30, 1358–1365. [Google Scholar] [CrossRef]
- Rodgers, G.M.; Downing, B.; Morrell, L.J. Prey body size mediates the predation risk associated with being “odd”. Behav. Ecol. 2015, 26, 242–246. [Google Scholar] [CrossRef]
- Tanaka, H.; Frommen, J.G.; Kohda, M. Helpers increase food abundance in the territory of a cooperatively breeding fish. Behav. Ecol. Sociobiol. 2018, 72, 51. [Google Scholar] [CrossRef]
- Schmitt, M.H.; Stears, K.; Wilmers, C.C.; Shrader, A.M. Determining the relative importance of dilution and detection for zebra foraging in mixed-species herds. Anim. Behav. 2014, 96, 151–158. [Google Scholar] [CrossRef]
- Ulrich, Y.; Saragosti, J.; Tokita, C.K.; Tarnita, C.E.; Kronauer, D.J. Fitness benefits and emergent division of labour at the onset of group living. Nature 2018, 560, 635–638. [Google Scholar] [CrossRef]
- Murali, G.; Kumari, K.; Kodandaramaiah, U. Dynamic colour change and the confusion effect against predation. Sci. Rep. 2019, 9, 274. [Google Scholar] [CrossRef]
- Ginnaw, G.M.; Davidson, I.K.; Harding, H.R.; Simpson, S.D.; Roberts, N.W.; Radford, A.N.; Ioannou, C.C. Effects of multiple stressors on fish shoal collective motion are independent and vary with shoaling metric. Anim. Behav. 2020, 168, 7–17. [Google Scholar] [CrossRef]
- Zhang, N.; Li, J.; Fu, C. Percentage of starved individuals in a group and simulated predation risk on the collective behavior of Chindongo demasoni. Acta Hydrobiol. Sin. 2023, 47, 989–996. [Google Scholar]
- Grabowska-Zhang, A.; Sheldon, B.; Hinde, C. Long-term familiarity promotes joining in neighbour nest defence. Biol. Lett. 2012, 8, 544–546. [Google Scholar] [CrossRef]
- Brandão, M.L.; Dorigão-Guimarães, F.; Bolognesi, M.C.; Gauy, A.C.D.S.; Pereira, A.V.S.; Vian, L.; Carvalho, T.B.; Gonçalves-de-Freitas, E. Understanding behaviour to improve the welfare of an ornamental fish. J. Fish Biol. 2021, 99, 726–739. [Google Scholar] [CrossRef] [PubMed]
- Shettleworth, S.J. Cognition, Evolution, and Behavior; Oxford University Press: Oxford, UK, 2009. [Google Scholar]
- Braithwaite, V.A.; Huntingford, F.; van den Bos, R. Variation in emotion and cognition among fishes. J. Agric. Environ. Ethics 2013, 26, 7–23. [Google Scholar] [CrossRef]
- Braithwaite, V.A. Cognitive ability in fish. Fish Physiol. 2006, 24, 1. [Google Scholar]
- Bshary, R. Machiavellian intelligence in fishes. Fish Cogn. Behav. 2011, 13, 277–297. [Google Scholar]
- O’Connell, L.A.; Hofmann, H.A. The vertebrate mesolimbic reward system and social behavior network: A comparative synthesis. J. Comp. Neurol. 2011, 519, 3599–3639. [Google Scholar] [CrossRef] [PubMed]
- Pouca, C.V.; Brown, C. Contemporary topics in fish cognition and behaviour. Curr. Opin. Behav. Sci. 2017, 16, 46–52. [Google Scholar] [CrossRef]
- Agrillo, C.; Bisazza, A. Understanding the origin of number sense: A review of fish studies. Philos. Trans. R. Soc. B 2018, 373, 20160511. [Google Scholar] [CrossRef]
- Pilastro, A.; Scaggiante, M.; Rasotto, M.B. Individual adjustment of sperm expenditure accords with sperm competition theory. Proc. Natl. Acad. Sci. USA 2012, 99, 9913–9915. [Google Scholar] [CrossRef]
- Ebbesson, L.; Braithwaite, V. Environmental effects on fish neural plasticity and cognition. J. Fish Biol. 2012, 81, 2151–2174. [Google Scholar] [CrossRef]
- Brandão, M.L.; Braithwaite, V.A.; Goncalves-de-Freitas, E. Isolation impairs cognition in a social fish. Appl. Anim. Behav. Sci. 2015, 171, 204–210. [Google Scholar] [CrossRef]
- Huntingford, F.A.; Adams, C.; Braithwaite, V.; Kadri, S.; Pottinger, T.; Sandøe, P.; Turnbull, J. Current issues in fish welfare. J. Fish Biol. 2006, 68, 332–372. [Google Scholar] [CrossRef]
- Wong, M.; Uppaluri, C.; Medina, A.; Seymour, J.; Buston, P. The four elements of within-group conflict in animal societies: An experimental test using the clown anemonefish, Amphiprion percula. Behav. Ecol. Sociobiol. 2016, 70, 1467–1475. [Google Scholar] [CrossRef]
- Liu, X.; Zhang, Y.; Lin, J.; Xia, Q.; Guo, N.; Li, Q. Social preference deficits in juvenile zebrafish induced by early chronic exposure to sodium valproate. Front. Behav. Neurosci. 2016, 10, 201. [Google Scholar] [CrossRef] [PubMed]
- Olivotto, I. Clownfsh. In Marine Ornamental Species Aquaculture; Calado, R., Olivotto, I., Oliver, M.P., Eds.; Wiley: Hoboken, NJ, USA, 2017; pp. 177–199. [Google Scholar]
- Moorhead, J.A.; Zeng, C. Development of captive breeding techniques for marine ornamental fish: A review. Rev. Fish. Sci. 2010, 18, 315–343. [Google Scholar] [CrossRef]
- Olivotto, I.; Planas, M.; Simões, N.; Holt, G.J.; Avella, M.A.; Calado, R. Advances in breeding and rearing marine ornamentals. J. World Aquac. Soc. 2011, 42, 135–166. [Google Scholar] [CrossRef]
- Callan, C.K.; Burgess, A.I.; Rothe, C.R.; Touse, R. Development of improved feeding methods in the culture of yellow tang Zebrasoma flavescens. J. World Aquac. Soc. 2018, 49, 493–503. [Google Scholar] [CrossRef]
- DiMaggio, M.A.; Cassiano, E.J.; Barden, K.P.; Ramee, S.W.; Ohs, C.L.; Watson, C.A. First record of captive larval culture and metamorphosis of the Pacific blue tang, Paracanthurus hepatus. J. World Aquac. Soc. 2017, 48, 393–401. [Google Scholar] [CrossRef]
- Rhyne, A.L.; Tlusty, M.F.; Szczebak, J.T. Early Culture Trials and an Overview on US Marine Ornamental Species Trade. In Marine Ornamental Species Aquaculture; Calado, R., Olivotto, I., Oliver, M.P., Eds.; Wiley: Hoboken, NJ, USA, 2017; pp. 51–70. [Google Scholar]
- Clingerman, J.; Bebak, J.; Mazik, P.M.; Summerfelt, S.T. Use of avoidance response by rainbow trout to carbon dioxide for fish self-transfer between tanks. Aquac. Eng. 2007, 37, 234–251. [Google Scholar] [CrossRef]
- Summerfelt, S.T.; Bebak, J.A.; Tsukuda, S.M. CO2 and pH effects on fish in aquaculture. Aquac. Eng. 2009, 35, 157–164. [Google Scholar]
- Lekang, O.I.; Fjæra, S.O.; Thomassen, J.M. Voluntary fish transport in land-based fish farms. Aquac. Eng. 1996, 15, 13–25. [Google Scholar] [CrossRef]
Disclaimer/Publisher’s Note: The statements, opinions and data contained in all publications are solely those of the individual author(s) and contributor(s) and not of MDPI and/or the editor(s). MDPI and/or the editor(s) disclaim responsibility for any injury to people or property resulting from any ideas, methods, instructions or products referred to in the content. |
© 2025 by the authors. Licensee MDPI, Basel, Switzerland. This article is an open access article distributed under the terms and conditions of the Creative Commons Attribution (CC BY) license (https://creativecommons.org/licenses/by/4.0/).