Article

Mutual Effects of Carassius carassius and Microcystis aeruginosa on Growth Dynamics and Water Quality

1
Institute of Aquatic Sciences, Xizang Autonomous Region Academy of Agricultural and Animal Husbandry Sciences, Lasa 850032, China
2
College of Animal Science and Technology, Henan Agricultural University, Zhengzhou 450046, China
3
Zhengzhou Aquatic Technical Extension Station, Zhengzhou 450006, China
*
Authors to whom correspondence should be addressed.
Fishes 2025, 10(10), 486; https://doi.org/10.3390/fishes10100486
Submission received: 20 August 2025 / Revised: 25 September 2025 / Accepted: 27 September 2025 / Published: 1 October 2025

Abstract

An experimental study was conducted in the laboratory to investigate the interactive effects of fish and algae on growth patterns and water quality. Body length and body weight of Carassius carassius, Microcystis aeruginosa (M. aeruginosa) density, and concentrations of nutrients were monitored continuously over a period of 92 days. It was noted that fish growth was significantly higher in the absence of M. aeruginosa compared to its presence (p < 0.05). This can be partly attributed to toxin production by M. aeruginosa. The densities and growth rates of M. aeruginosa in groups with Carassius carassius were significantly higher than those in fishless groups (p < 0.05), and this was attributable to fish metabolism and bioturbation, which led to a considerable increase in ammonia and total dissolved nitrogen concentrations, as well as a significant impact on proportions of nutrients. The growth rate of Carassius carassius firstly increased and then decreased with increasing M. aeruginosa densities, and a quantitative relationship was established using the Gompertz equation and Logistic equation (R2 = 0.914–0.955). Based on the above results, we concluded that interactions between fish and algae are greatly related to their consequences on water qualities, by employing equations, a more detailed interpretation of the processes occurring in the fish–algae system can be achieved.
Key Contribution: This study evaluated the correlations between crucian carp, Microcystis aeruginosa, and water qualities. Logistic equation and Gompertz equation were used to describe variations in Microcystis aeruginosa and crucian carp growth with time, respectively, and to further explore the relationships between crucian carp growth rate and Microcystis aeruginosa densities. This study is important because it experimentally indicates that Microcystis aeruginosa greatly affected concentrations of nutrients and crucian carp growth, and we developed quantified relationships between growth rates of crucian carp and M. aeruginosa densities.

1. Introduction

Owing to the swiftly expanding global population, the demand for Omega-3 fatty acids and high-quality proteins is on the rise, driving the rapid growth of the aquaculture industry [1]. Fish has become a widely traded food commodity due to its high nutritional content [2]. In China, the crucian carp (Carassius carassius) is among the most commercially important omnivorous freshwater fish species [3].
Aquaculture activities have significantly increased nutrient levels in water environments [4]. In Cyprinus carpio ponds, 57–71% of nitrogen and 44–58% of phosphorus originated from aquaculture feed [5]. The nutrients derived from fish farming could promote the proliferation of harmful algae [6], resulting in eutrophication and decreasing fish productivity [6,7].
Algae in aquatic ecosystems play a crucial role as indicators for assessing water quality [8]. Their abundance and wide distribution in aquaculture systems can directly affect the water chemistry of the aquatic ecosystem. Microcystis aeruginosa (M. aeruginosa) exhibits strong environmental adaptability and high nutrient utilization efficiency. It is a cosmopolitan species commonly found as a dominant algal taxa in eutrophic aquatic systems [9], it is an organism that is commonly utilized in biological experiments and remains functional [10], and frequently produces microcystins, leading to toxicological impacts [11].
Mathematical models such as the Logistic equation and the Monod equation [12] have been widely adopted in microalgae research to investigate the microalgae growth process in detail [13]. Furthermore, essential parameters associated with fish growth processes were determined by utilizing equations like the Gompertz equation and the Logistic equation [14].
Although fish and algae coexist frequently in aquatic environments, only a limited number of studies have examined the interactions between them in their coexisting system. Algae may absorb nutrients in water and lessen the impact of aquaculture activities on water quality [15], which is beneficial to aquaculture animals’ growth [16]. However, microcystins produced by M. aeruginosa cause gill lesions [17] and accumulate [18] in the nervous system of fish, which can further affect the growth and development of fish [19]. The nutrients excreted by fish can promote the growth of algae, which has a significant effect on the community structure [20]. Gaining a deeper insight into the interactions between fish and algae growth is crucial for the sustainable development of aquaculture. To the best of our knowledge, quantified relationships between fish growth rate and algae density have not yet been revealed in published studies.
In light of the aforementioned literature and our initial research findings, we hypothesized that the interactions among fish, algae, and water qualities can be modeled using equations. To verify this, this study selects crucian carp and M. aeruginosa as the target organisms to investigate interactions between crucian carp, M. aeruginosa, and water qualities. Due to the advantages of the Gompertz and Logistic equations, such as their ease of interpretation and application, as well as the clear biological significance of their parameters, they are commonly used in ecology and related fields to describe population growth. In this study, these two equations were applied separately to model the growth of crucian carp and M. aeruginosa over time, further exploring the quantitative relationship between the growth rate of fish and the density of algae.

2. Materials and Methods

2.1. Experimental Materials

This experiment was carried out in compliance with the ARRIVE guidelines and relevant regulations. Animal experiments were approved by the Animal Experiment Ethics Committee of Henan Agricultural University (HNND2025031317, 13 March 2025). In the event that abnormal behavior in the experimental animals was observed during the experiment (which is not anticipated), the experiment was reviewed and possibly halted.
Crucian carps were procured from a local market in Zhengzhou, Henan province. In each aquarium, 3 healthy crucian carps (6 months old) were reared [21]. Their initial average individual weights and lengths were 18.26 ± 1.0 g and 9.25 ± 0.3 cm, respectively. Prior to the experiment, the crucian carps were allowed to acclimate to the experimental conditions for 15 days.
The strain of M. aeruginosa was obtained from the Freshwater Algae Culture Collection of the Institute of Hydrobiology (FACHB-905) at the Chinese Academy of Sciences. M. aeruginosa were cultured in M-II culture medium [22] for a period of 15 days prior to the experiment.
The amount of phosphorus and nitrogen in fish feed (manufactured by Huaian Tongwei Company Limited in Huaian, China) was 14.10 g/kg and 47.36 g/kg as determined by analysis [23].
The aquariums utilized in the experiment measured 46.00 cm in length, 38.50 cm in width, and 50.00 cm in height, each containing 50.00 L of tap water with continuous aeration.

2.2. Experimental Methods

As controls, aquariums filled solely with tap water were labeled as CK. Aquariums containing only fish feed were designated as F, while those with both fish feed and crucian carp were labeled as FC, aquariums containing feed and M. aeruginosa were named FM, and aquariums with feed, crucian carp, and M. aeruginosa were named FCM. Each group had three replicates.
The feed was manually added to the aquariums (excluding CK) at 9:00 a.m. every day, with a dosage equivalent to 1.0% of the initial body weight of the crucian carp (0.55 g) [24]. Feed added into aquariums with crucian carp was completely consumed according to our observation. The initial M. aeruginosa density was 1 × 10³ cells mL−1.
A photoperiodic cycle of 12L:12D with lights on at 07:00 and off at 19:00 was maintained. The water volume in the aquaria stayed unchanged during the experiment, water lost as a result of evaporation was restored every two days. The water temperature in the aquariums was left uncontrolled and allowed to fluctuate naturally.

2.3. Measurement of Monitoring Indicators

Samples of water were collected from the midpoint of the aquariums at a depth of 8 cm below the water surface. The concentrations of total nitrogen (TN) and total phosphorus (TP) were measured using unfiltered water samples. To determine the total dissolved phosphorus (TDP), orthophosphate (PO43−-P), total dissolved nitrogen (TDN), and ammonia nitrogen (NH4+-N), water samples were filtered through 0.45 μm membrane filters. Water samples that were digested using an autoclave were utilized for the measurement of TP, TDP, TN, and TDN. The concentrations of TP, TDP, PO43−-P, TN, TDN, and NH4+-N were measured according to the methodology described in Yang et al.’s study [25].
The measurements of fish length and weight were carried out using respective dividing rulers and electronic scales every 10 d. The pH value and water temperature were measured by precision pH test paper and mercurial thermometer, respectively. The density of M. aeruginosa was determined according to the methodology outlined in Wu et al. [23], with each sample being counted five times for accuracy. M. aeruginosa densities, pH, water temperature, and concentrations of nutrients (PO43−-P, TDP, TP, NH4+-N, TDN, and TN) were determined every 4 days.

2.4. Statistical Analysis

When calculating the nutrient concentrations in the experimental treatments, the measured values obtained from the control group (CK) were deducted to account for background variations. The experimental data were analyzed using SPSS 17.0 and Origin 9.0. The significance level was set at 0.05. Statistical analysis was performed using SPSS 17.0, employing a one-way ANOVA followed by a Duncan post hoc test to evaluate the results [26].

2.5. Theoretical Basis

In order to assess the growth performance and feed utilization efficiency of fish, the following parameters were measured: weight gain rate (WGR, %), length gain rate (LGR, %), daily weight gain (DWG, g/day), growth rate (GR, mm/day), feed conversion efficiency (FCE, %), and protein efficiency ratio (PER, %). These parameters have been suggested as pertinent indicators in previously published research [27]. The following equations were used to determine these indicators:
W G R = W T W 0 W 0 × 100 %
L G R = L T L 0 L 0 × 100 %
D W G = W 2 W 1 t 2 t 1
F C E = W T W 0 F × 100 %
P E R = W T W 0 F × C P C × 100 %
G R = L 2 L 1 t 2 t 1
where W0 (g) and L0 (cm) represent the initial body weight and length of fish, respectively; WT (g) and LT (cm) are the body weight and length of the fish at the end time T (d), respectively; Wt1 (g) and Wt2 (g) represent the body weight of fish at time t1 (d) and t2 (d), respectively; F (g) represents the total amount of feed consumed; and CPC (%) denotes the crude protein content, which is calculated as dietary nitrogen multiplied by 6.25 [28].
In this study, the Gompertz equation was employed to describe the changes in body weight (W) and body length (L) of fish over time. The corresponding fitting equations are presented below:
W = W m a x e e a W     r W   t
L = L m a x e e a L     r L   t
where Wmax (g) and Lmax (mm) represent the maximum weight and length of the crucian carp, respectively; rW (d−1) and rL (d−1) denote the variation rate constant of body weight and body length, respectively; while aW (-) and aL (-) are constants and t (d) signifies the time variable.
According to Gompertz equation, the daily weight gain (DWG) and growth rate (GR) of fish can be expressed as follows [29]:
D W G = W m a x   r W   e a W     r W   t     e a W     r W t
G R = L m a x   r L   e a L     r L   t     e a L     r L t
The parameters used in Equations (9) and (10) are identical to those defined in Equations (7) and (8).
Several lines of evidence have indicated that algae growth can be described by the Logistic equation [30], as expressed in Equation (11):
N = N m a x 1 + e a r t
where N (1 × 10³ cells mL−1) represents the algae density at any time; Nmax (1 × 10³ cells mL−1) denotes the maximum algae density; r (d−1) signifies the intrinsic growth rate; t (d) indicates time; a (-) is a constant. The values of Nmax, r and a can be determined by fitting Equation (11) to the experimental data.
The Monod equation is commonly employed to describe the relationship between the specific growth rate of phytoplankton and the concentration of a limiting substrate [31]. The Logistic equation can be combined with the Monod equation as follows [32]:
N = N m a x ( r K c C r C μ m ) r K c C r
where C (mg L−1) represents the concentration of the rate-limiting nutrient; μm (d−1) denotes the maximum specific growth rate and Kc (mg L−1) is the half-saturation coefficient; Nmax and r retain their definitions from Equation (11).
The Logistic equation can be applied to simulate variations of fish WGR (LGR) with time [33]:
W G R = W G R m a x 1 + e a W G R     r W G R   t
L G R = L G R m a x 1 + e a L G R     r L G R   t
where WGRmax and LGRmax (%) are the maximum WGR and LGR of the crucian carp, respectively; rWGR and rLGR (d−1) are the rate constants, respectively; and aWGR and aLGR (-) are constants.
The Logistic equation [33] was employed to simulate the temporal variations in nutrient concentrations, as shown below:
C = C m a x 1 + e a C     r C t
where C (mg L−1) represents the concentration of nutrient at time t (d); Cmax (mg L−1) denotes the maximum concentration of nutrient; rC (d−1) is the rate constant; and aC (-) is a constant parameter.
According to Equations (13)–(15), the equations of WGR and LGR with respect to concentrations of nutrients can be fitted by the following equations:
W G R = W G R m a x 1 + e a W G R     r W G R   ( a c     ln C m a x     C   +   l n ) / r c
L G R = L G R m a x 1 + e a L G R     r L G R   ( a c ln C m a x     C   +   l n ) / r c
The parameters used in Equations (16) and (17) are identical to those defined in Equations (13)–(15).
According to Equations (9)–(11), the equation of fish DWG and GR with respect to algae densities can be formulated as follows:
D W G = W m a x   r W   e a W     r W   ( a     ln N m a x     N + l n N ) / r     e a W     r W   ( a     ln N m a x     N + l n N ) / r
G R = L m a x   r L   e a L     r L   ( a     ln N m a x     N   +   l n N ) / r     e a L     r L   ( a     ln N m a x     N   +   l n N ) / r
The parameters employed in Equations (18) and (19) are consistent with those defined in Equations (9)–(11).

3. Results

3.1. Water Temperature

As shown in Figure 1a, variations in water temperature gradually increased during the experiment and subsequently decreased with slight fluctuations from day 20 onwards. The water temperature during the experiment ranged from 18.70 °C to 28.40 °C.
Water temperature values in different groups kept quite close during the experiment (p > 0.05). For example, average temperatures in F, FC, FM, and FCM were 25.01 °C, 25.01 °C, 25.20 °C, and 25.19 °C, respectively.

3.2. pH

As shown in Figure 1b, the pH of the aquatic system varied between 6.80 and 7.30 during the experimental period. Variations in pH showed a decreasing trend in groups without M. aeruginosa (F, FC). Comparable results were achieved by Hargreaves et al. [34], and the decrease in pH during microalgae growth could be explained by the mineralization of feed and the respiration of fish [35]. In contrast, an increased tendency of pH was found in groups with M. aeruginosa (FM, FCM). This was due to the removal of bicarbonate ions from water by algae [36].
Our data point to differences between the average pH in the presence of M. aeruginosa as compared to the one without M. aeruginosa (p < 0.05). For example, the average pH in FCM (Feed + Crucian carp + M. aeruginosa) and FC (Feed + Crucian carp) was 7.23 and 6.90, respectively.
Average pH values in groups with and without fish were almost the same (p > 0.05).

3.3. Effects of M. aeruginosa on Crucian Carp Growth

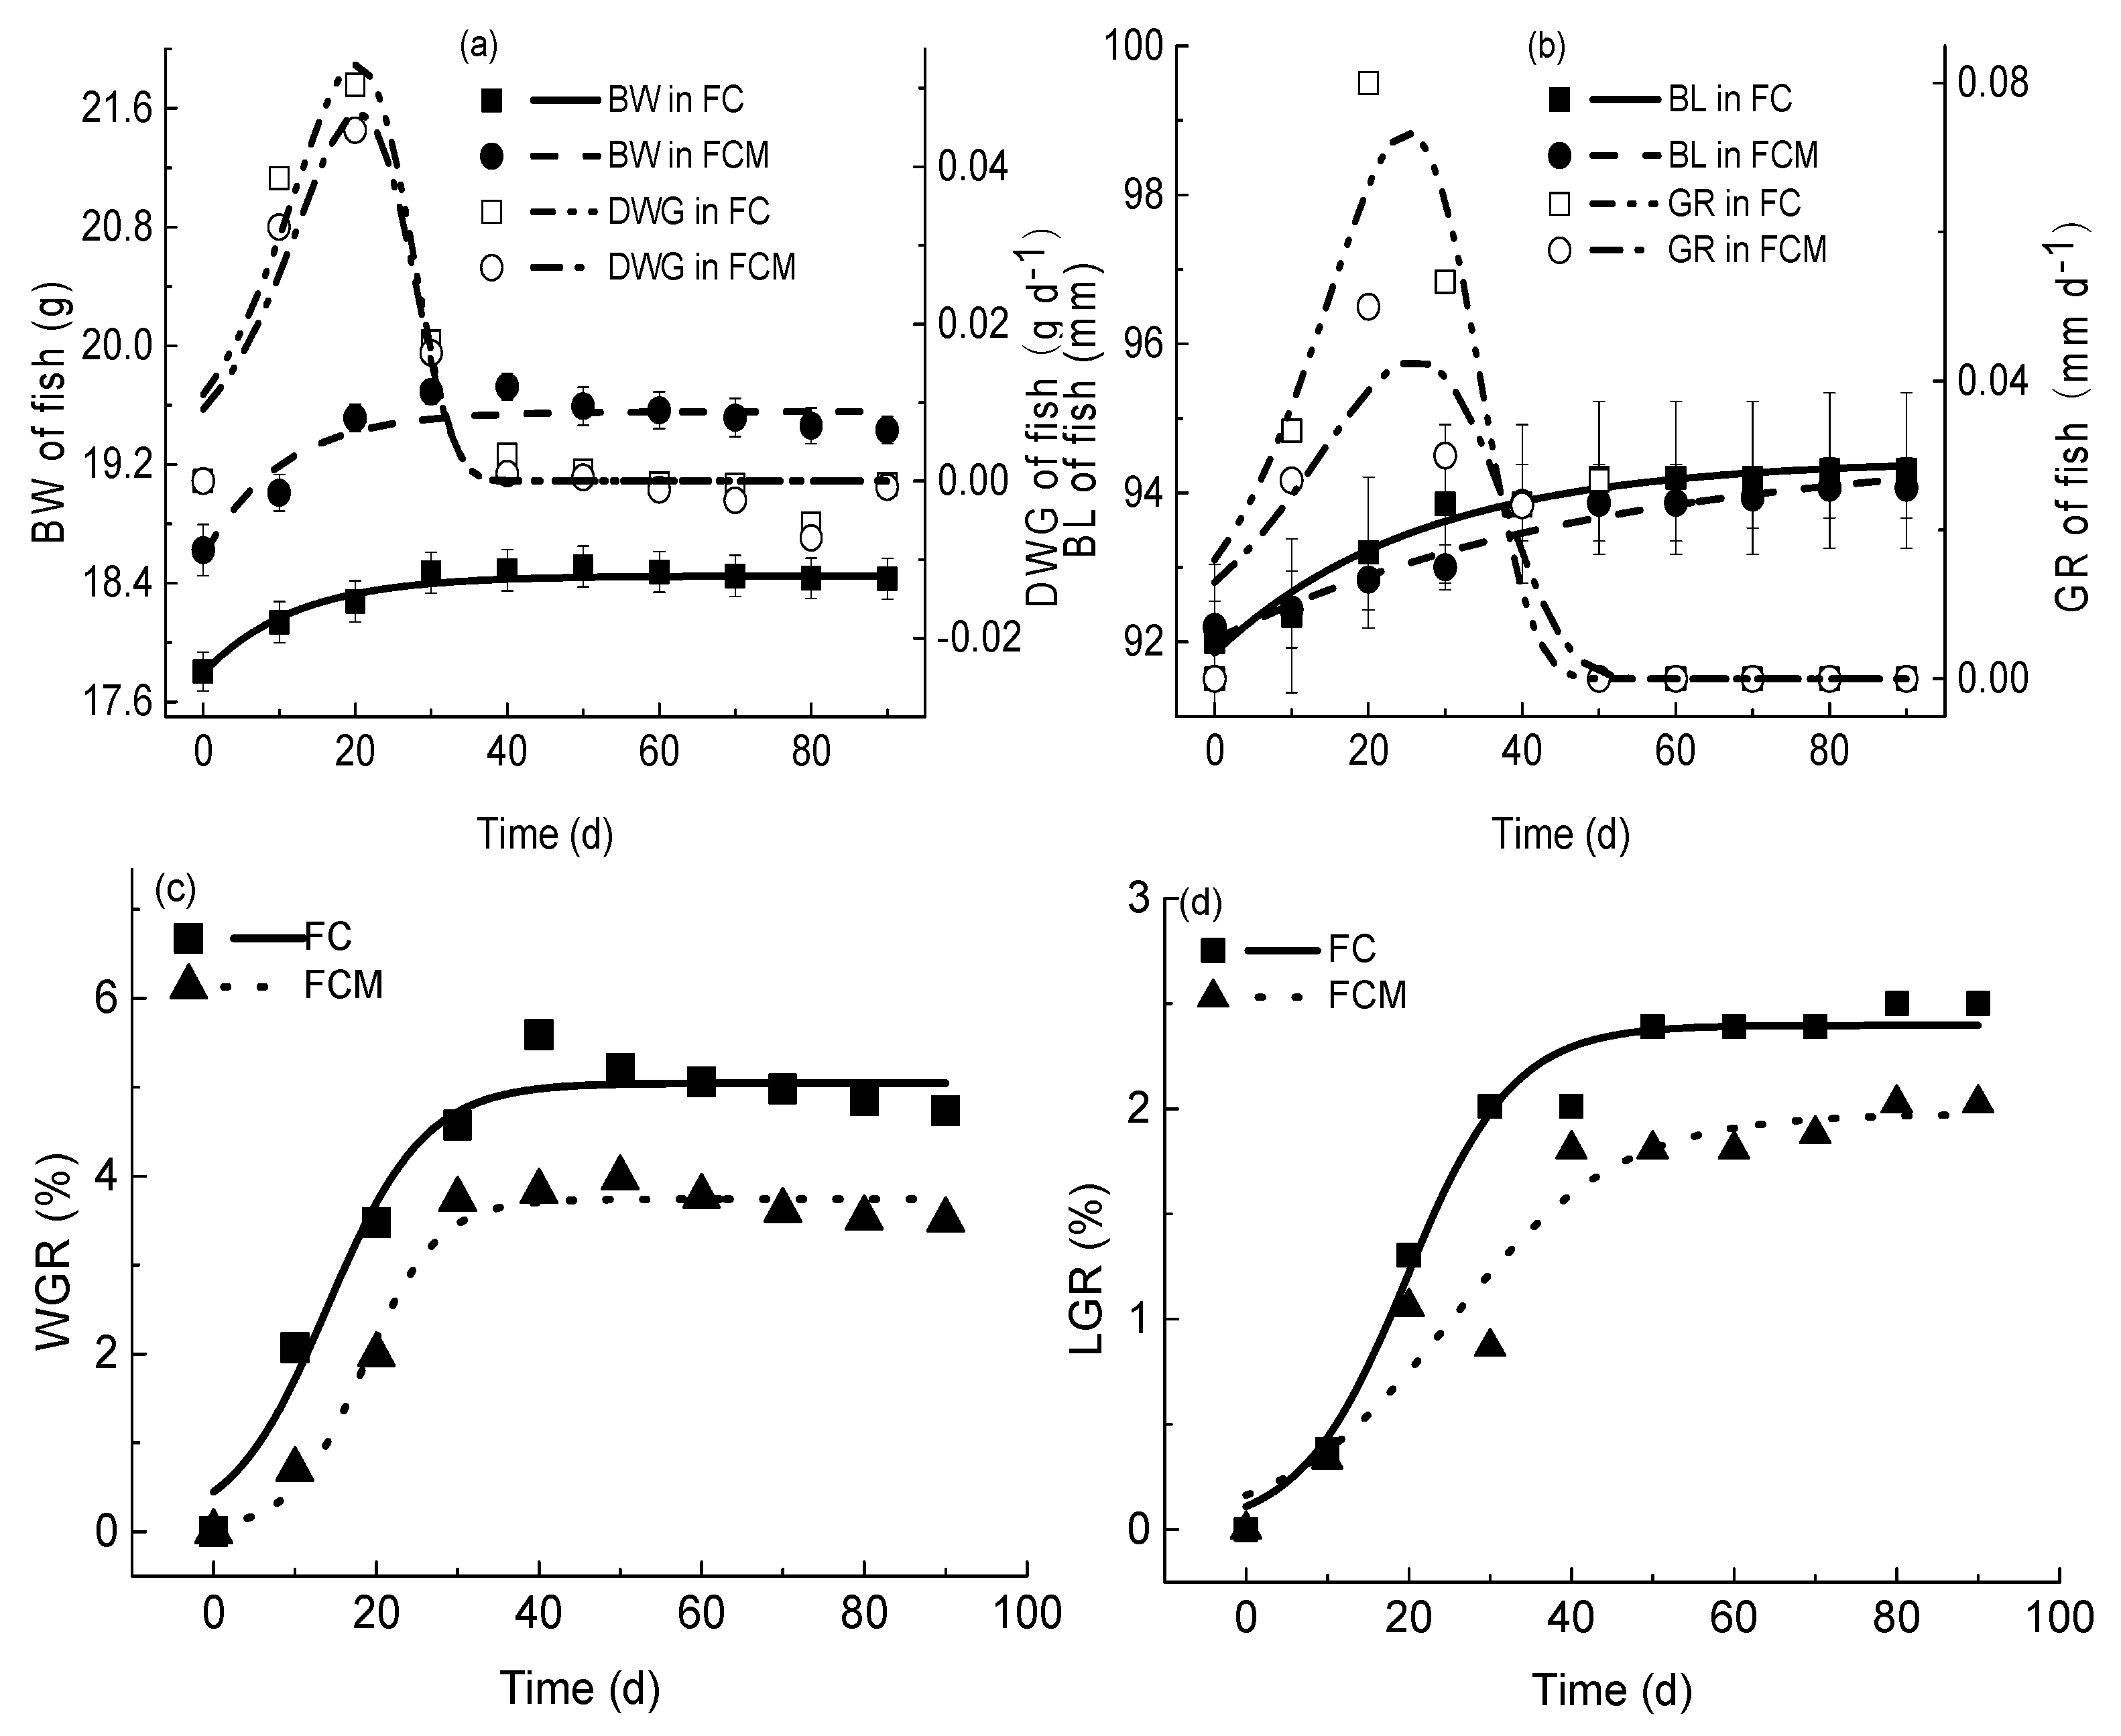
In this study, no fish mortality was observed throughout the entire feeding period. As shown in Figure 2, the body weight and body length of the crucian carp increased with incubation time over the first 20 days, attained their peak values, and subsequently remained constant until the conclusion of the experiment. Figure 2a,b and Table 1 indicate that Equations (7) and (8) successfully captured the changes in body weight (BW) and body length (BL) over time (R2 = 0.580–0.972). Low R2 values were observed in the model fitting; this may be attributed to the small sample size and substantial inter-individual variability, both of which contribute to high data dispersion. These factors indicate that the model’s goodness of fit to the data could be further improved. Daily weight gain (DWG) and growth rate (GR) of fish increased sharply after the experiment began, reaching a peak before declining to zero, Equations (9) and (10) accurately described their variations (R2 = 0.737–0.912). The weight gain rate (WGR) and length gain rate (LGR) of crucian carp increased sharply in the first 30 days. Subsequently, their rates exhibited minor fluctuations and quickly stabilized (Figure 2c,d). Equations (13) and (14) could fit the dataset of WGR and LGR (R2 = 0.933–0.990).
The growth parameters of crucian carp in groups without M. aeruginosa were significantly superior to those in groups with M. aeruginosa. For example, as shown in Table 1, DWGmax, GRmax, FCE, WGRmax, LGRmax, and PER in FC (Feed + Crucian carp) were 7.0%, 98.6%, 14.1%, 34.8%, 21.8%, and 14.1% higher than those in FCM (Feed + Crucian carp + M. aeruginosa) (p < 0.05), respectively.

3.4. Effects of Crucian Carp on M. aeruginosa Growth

The changes in the growth of M. aeruginosa are illustrated in Figure 3. Initially, the cell density of M. aeruginosa gradually increased during the lag phase. During the exponential phase, the density of M. aeruginosa exhibited a rapid increase over time before transitioning to the stationary phase. As indicated in Table 1, Equation (11) is highly effective in predicting variations in M. aeruginosa, with an R2 value ranging from 0.966 to 0.994. According to Huang et al. [32], the growth rate (R2 = 0.505–0.983) and specific growth rate (R2 = 0.556–0.976) of M. aeruginosa can be represented using equations based on a modified Logistic equation.
When fish were present, the density and growth rate of M. aeruginosa were significantly greater compared to the fishless groups. For example, the maximum M. aeruginosa densities (Nmax) and growth rates (μcmax) in FCM (Feed + Crucian carp + M. aeruginosa) were 242.6% and 282.8% higher than those in FM (Feed + M. aeruginosa) (p < 0.05), respectively. The presence of fish did not significantly affect the specific growth rate of M. aeruginosa (p > 0.05), with specific growth rate being calculated as the growth rate divided by algae density.

3.5. Nutrients Kinetics

3.5.1. Temporal Changes in Nutrient Concentrations

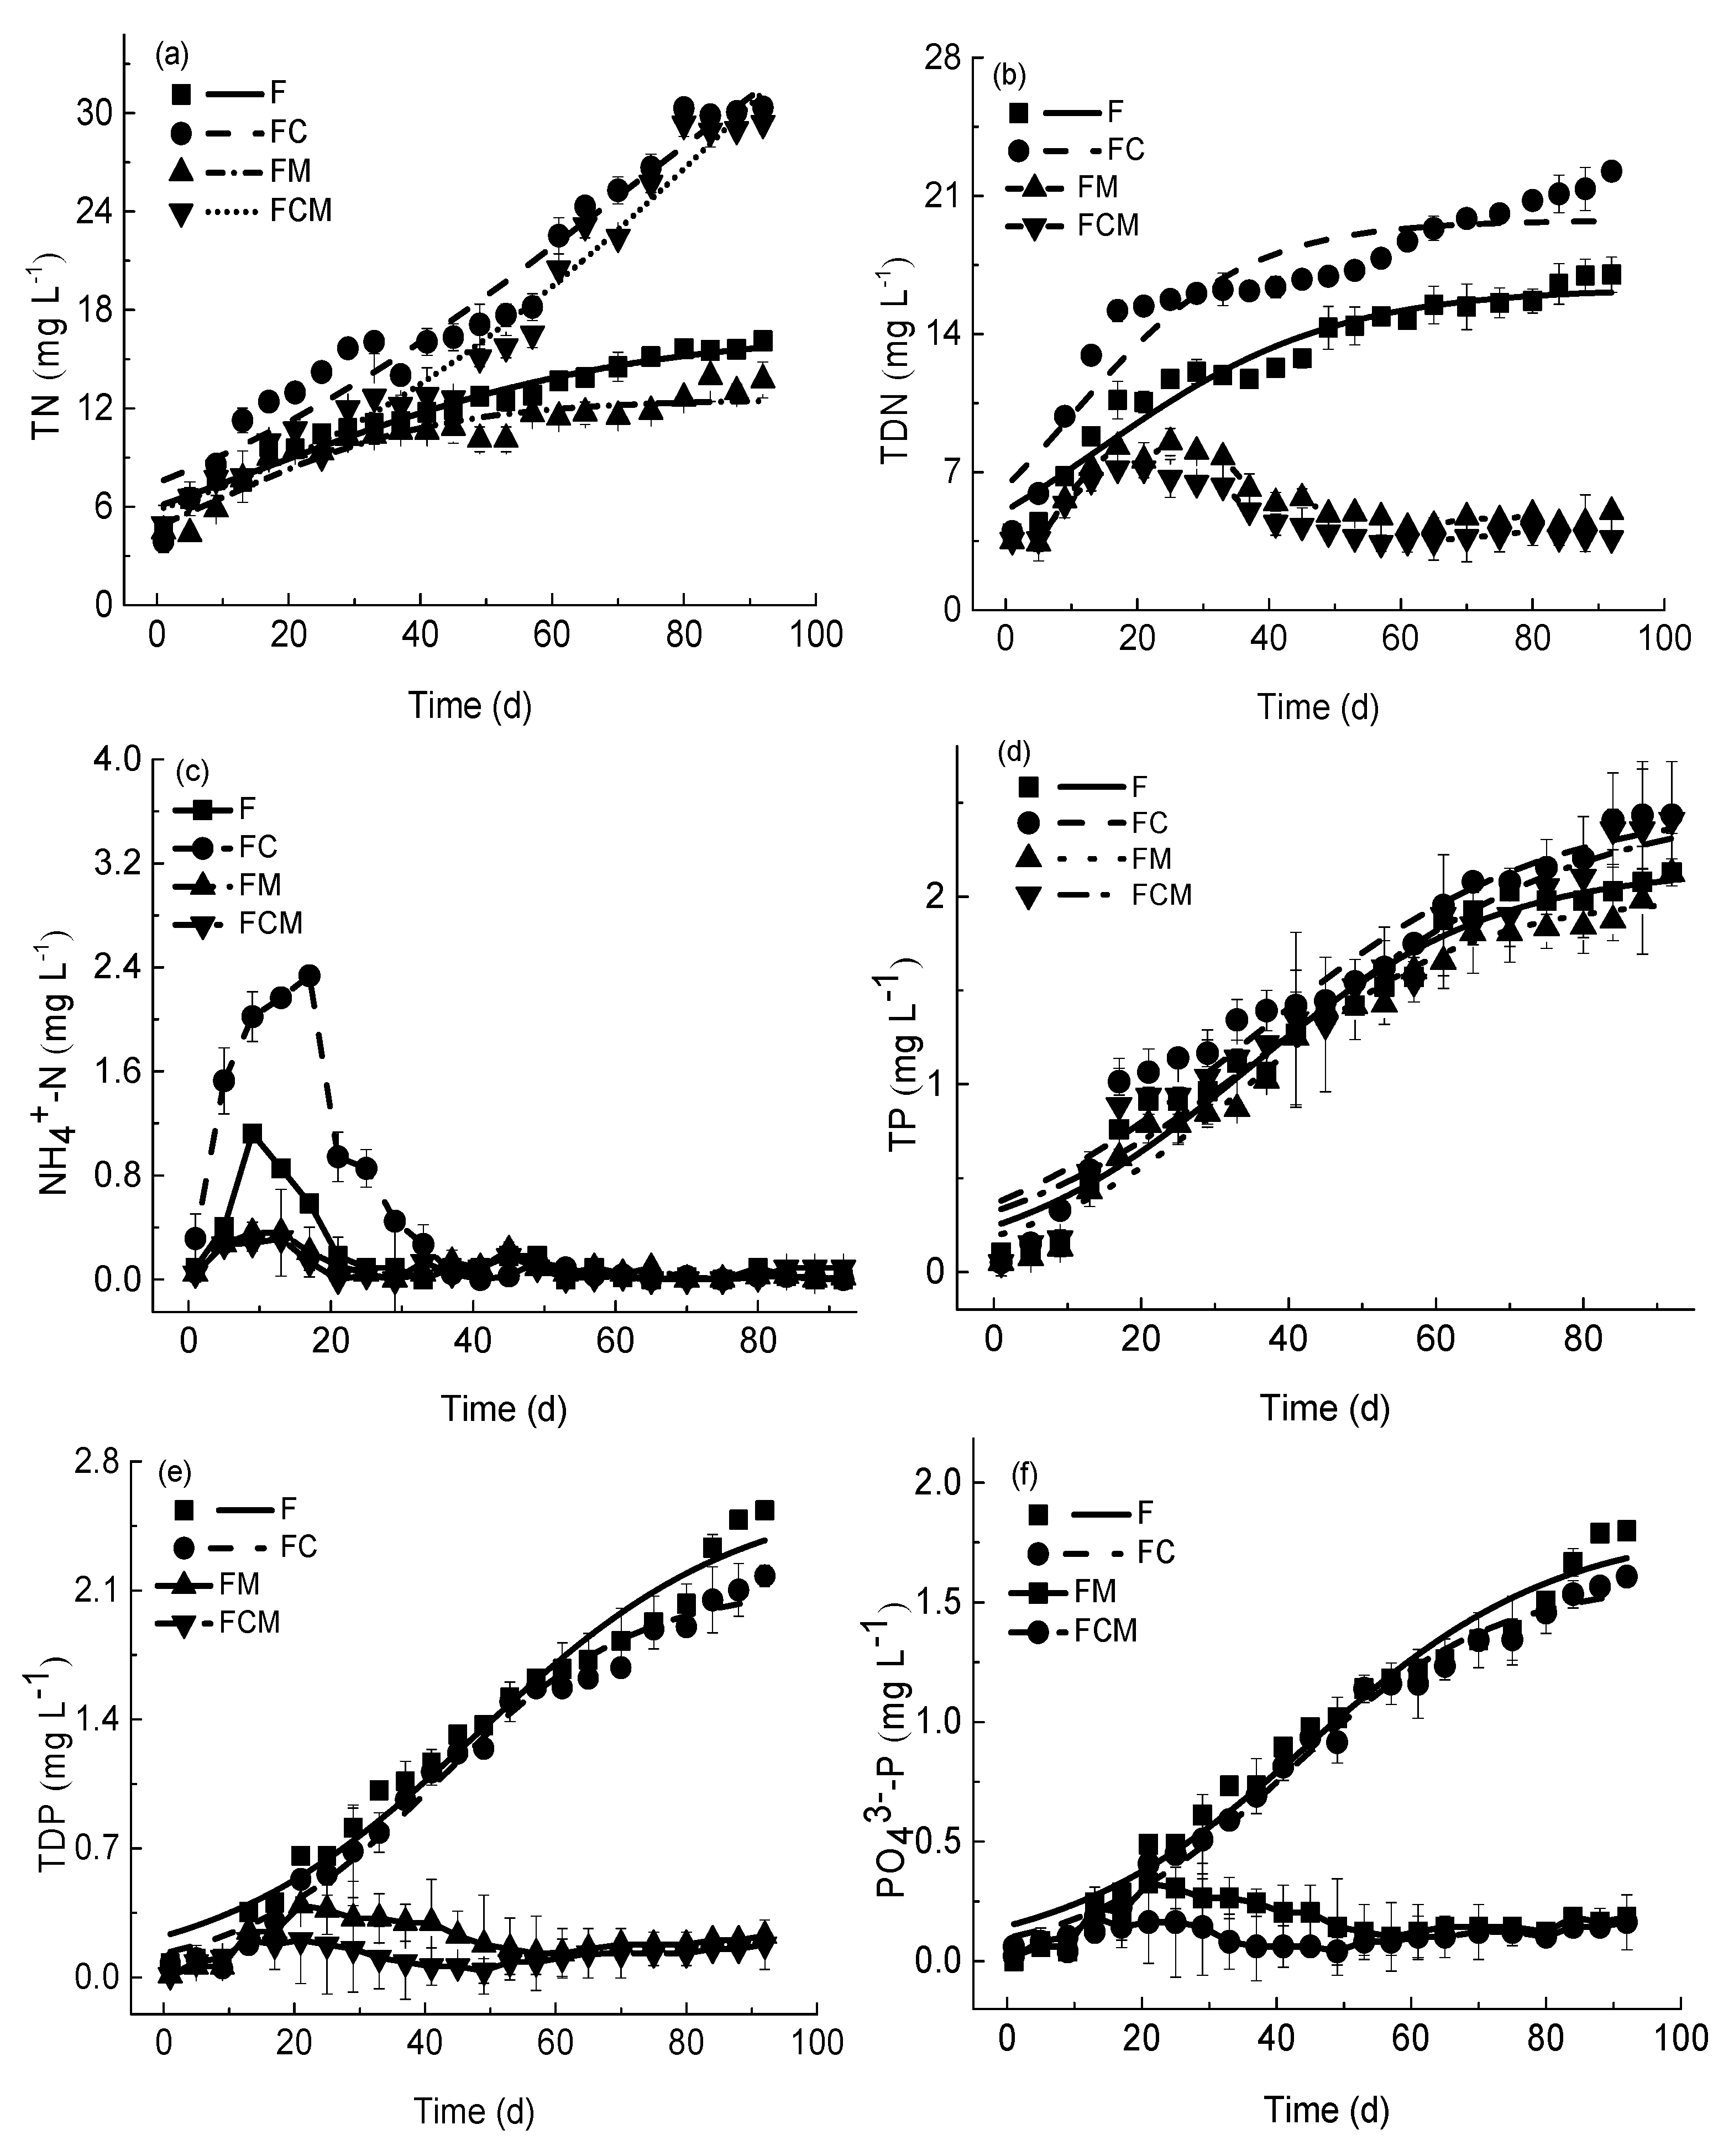
The variations in nutrient concentrations over time are presented in Figure 4. It is obvious that concentrations of TP, TDP, PO43−-P, TN, and TDN increased as the experiment progressed in groups without M. aeruginosa (F, FC). Equation (15) can be utilized to estimate changes in PO43−-P, TDP, TP, TDN, and TN concentrations over time (R2 = 0.869–0.977), as illustrated in Figure 4. Concentrations of NH4+-N increased initially and then declined. The NH4+-N results matched those of Yogev and Gross [37], who provided experimental evidence indicating that NH4+-N was converted into other forms as a result of the nitrification process.
In groups with M. aeruginosa (FM, FCM), the fluctuations in nutrient concentrations over time were primarily influenced by the uptake of nutrients by M. aeruginosa and the release of nutrients from the fish feed [38]. Variations in TN, NH4+-N, and TP were in line with those in groups without M. aeruginosa. TDN, PO43−-P, and TDP concentrations climbed slowly at the start of this study, primarily due to the release of nutrients from the feed during this phase of the experiment. Then concentrations of TDN, PO43−-P, and TDP declined. During this phase, the consumption or uptake of nutrients by M. aeruginosa played a dominant role.
It is worthy to point out that we did not find the fitting equations for NH4+-N concentrations, or for describing changes in the concentrations of TDN, PO43−-P, and TDP over time for cases with algae.

3.5.2. The Impact of M. aeruginosa and Crucian Carp on Nutrient Concentrations

Affected by M. aeruginosa utilization, the average concentrations of TDN, NH4+-N, TDP, and PO43−-P in groups with M. aeruginosa were markedly lower compared to those without M. aeruginosa (p < 0.05). For example, the mean concentrations of TDN, NH4+-N, TDP, and PO43−-P in FM (Feed + M. aeruginosa) were 6.91 mg L−1, 0.06 mg L−1, 1.02 mg L−1, and 0.75 mg L−1 lower than those in F (Feed), respectively. The average concentrations of TP and TN in groups with and without M. aeruginosa were close (p > 0.05). This may be attributed to the fact that TP and TN concentrations included the part in M. aeruginosa.
In the absence of M. aeruginosa, average concentrations of TDN, NH4+-N, TP, and TN in groups with fish (FC) were higher than those in fishless groups (F), with significant differences observed between NH4+-N and TDN (p < 0.05). This can be partially attributed to the digestive activity of fish which promotes nitrogen release [39]. Average concentrations of PO43−-P and TDP in FC were 15.8–18.4% lower than those in F (p < 0.05). This was explained by the fact that fish can hardly use insoluble phosphorus in the feed [40], hence soluble phosphorus was added in feed [41] and was partly assimilated by fish [42].
In the presence of M. aeruginosa, average concentrations of TDN, NH4+-N, TDP, and PO43−-P in groups with fish (FCM) were significantly lower compared to the fishless groups (FM) (p < 0.05). For instance, average concentrations of TDN, NH4+-N, TDP, and PO43−-P in FCM (Feed + Crucian carp + M. aeruginosa) were 23.2–39.1% lower than those in FM (Feed + M. aeruginosa). The reason behind this is that M. aeruginosa densities in groups with fish were greater than those in fishless groups, resulting in more nutrients being absorbed. Crucian carp had no significant influence on TN or TP concentrations.

3.6. Nutrients’ Proportions

As shown in Table 1, the nutrients’ proportions, namely, NH4+-N:TN, TDN:TN, PO43−-P:TP, TDP:TP, and TN:TP, were significantly different between groups with and without crucian carp (p < 0.05). For example, average PO43−-P concentrations were 63.94% and 56.16% of average TP concentrations in F (Feed) and FC (Feed + Crucian carp); average TDN concentrations were 39.95% and 30.35% of average TN concentrations in FM (Feed + M. aeruginosa) and FCM (Feed + Crucian carp + M. aeruginosa) (p < 0.05). This indicated that fish activity has a significant impact on nutrients’ proportions.
The nutrients’ proportions were greatly affected by M. aeruginosa. Proportions of nutrients were significantly different between groups without (F, FC) and with (FM, FCM) M. aeruginosa (p < 0.05), as shown in Table 1. For instance, average PO43−-P concentrations were 56.16% and 14.37% of average concentrations of TP in FC (Feed + Crucian carp) and FCM (Feed + Crucian carp + M. aeruginosa), respectively.

4. Discussion

The difference between the highest and the lowest water temperature was 0.19 °C, which did not affect the growth of algae and fish [43,44]. In addition, the pH values fluctuated within the optimal pH range for the growth of crucian carp [45]. As a result, differences in fish growth between groups without and with M. aeruginosa, as well as differences in M. aeruginosa growth between groups without and with fish, were not attributed to water temperature or pH.
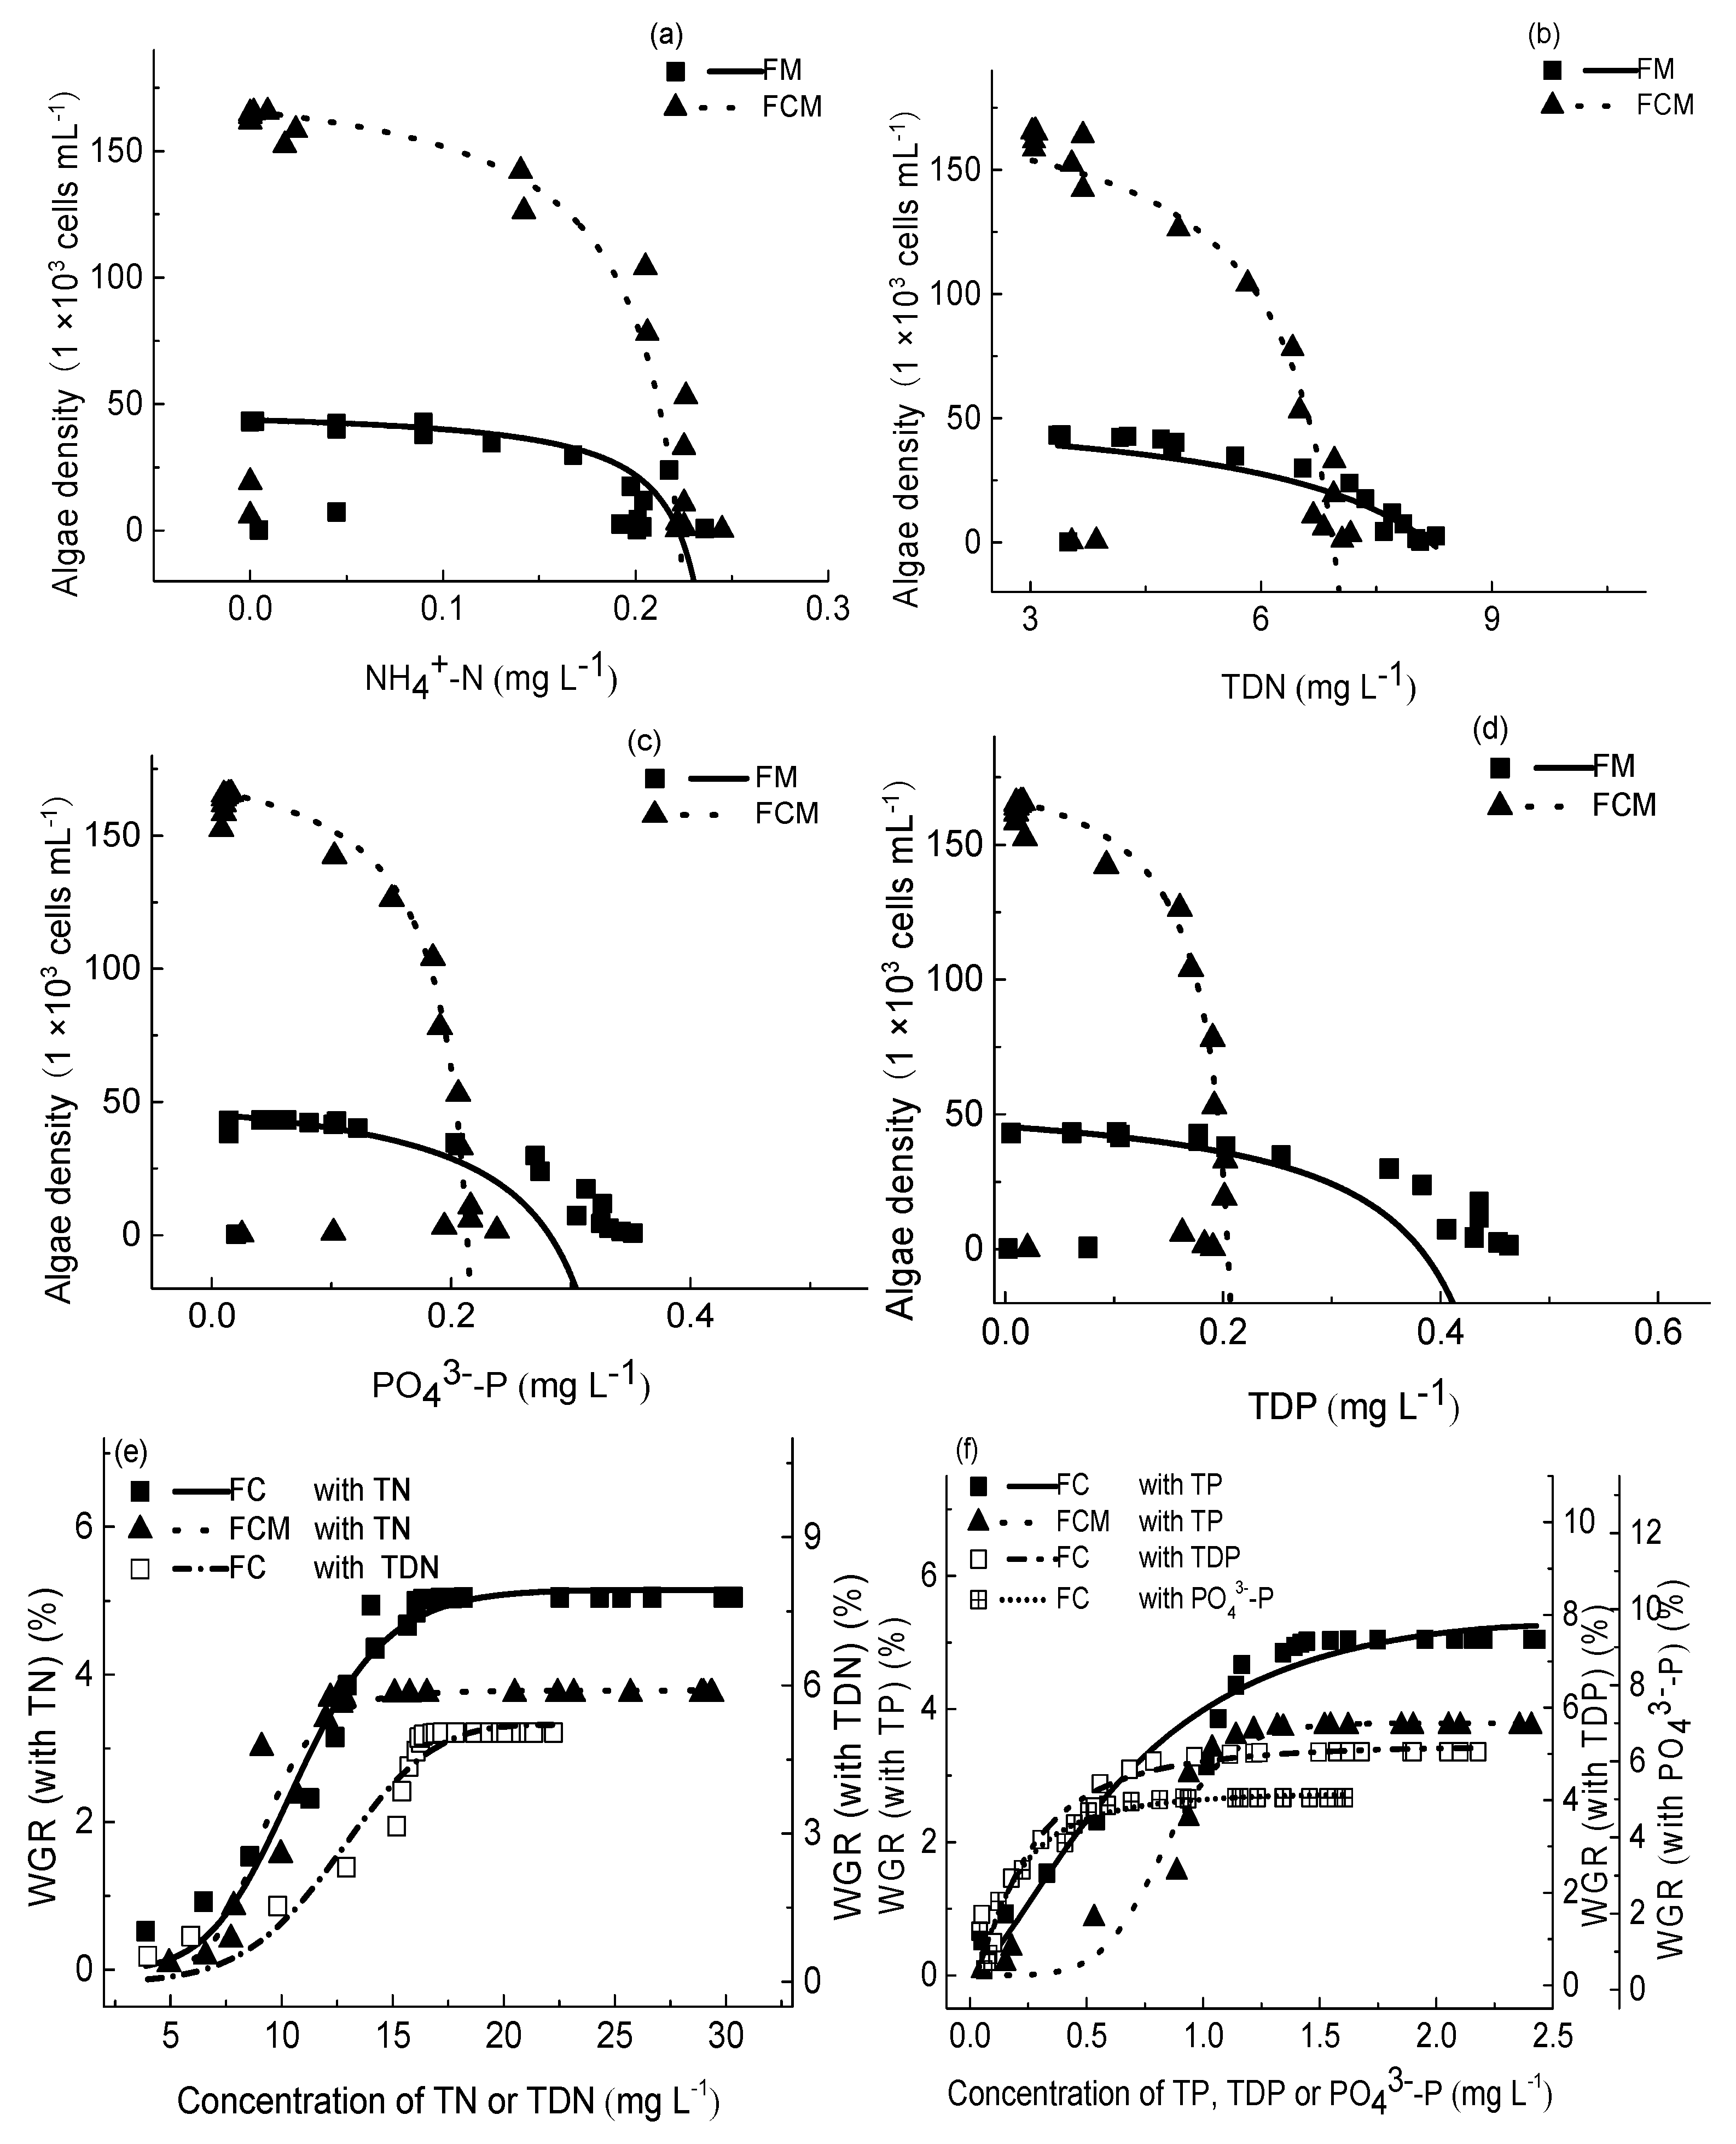
The relationship between algae and nutrients is complex. For decades, the empirical correlation between algae (chlorophyll a) and nutrients has informed eutrophication control strategies [46]. Further studies have found it difficult to predict how algae respond to changes in their water environment [47], which drives researchers to look for more possible approaches and improve the methodology. In this study, concentrations of nutrients generally decreased as M. aeruginosa densities increased (Figure 5a–d). This is because higher algae densities result in more nutrients being absorbed. The combined use of the logistic and Monod equations (Equation (12)) is employed to characterize the relationship between M. aeruginosa densities and nutrient concentrations, and reasonably good results were obtained (R2 = 0.551–0.763). This is consistent with existing research results [12,22], which fully demonstrates that logistic models are highly suitable for application in the field of algal research. We believe that the derived equation has significance for harmful algae control and management of the aquaculture industry. Some relationships between algae growth and nutrient concentrations exhibit saturation or decline at high concentrations. Based on the model developed in this study, future research could explore the application of models with improved fitting performance, such as the Ricker or Holling-type functions, in related fields.
The results indicated that crucian carp significantly influenced nutrient concentrations. As shown in 3.5.2, average concentrations of TDN and NH4+-N in FC (Feed + Crucian carp) were 37.1–183.5% greater than those in F (Feed) (p < 0.05). Simultaneously, M. aeruginosa densities in groups containing fish exhibited significantly higher values compared to fishless groups, given that concentration of nutrients in water is closely related to the growth of algae, crucian carp mainly promoted M. aeruginosa growth by affecting the concentrations of nutrients in water. The TN/TP ratio is a key parameter that reflects the relative availability of nitrogen and phosphorus in aquatic systems. It directly influences algal growth patterns, species composition, and the overall ecological stability of water bodies. The optimal TN:TP mass ratio for most algae is approximately 7.2 [48]. When the TN/TP ratio is excessively high, nitrogen becomes abundant relative to phosphorus, which may promote the proliferation of nitrogen-tolerant algae, such as cyanobacteria. Conversely, when the ratio is too low, phosphorus excess can trigger blooms of other algal groups. Thus, maintaining a balanced TN/TP ratio is crucial for controlling eutrophication and preserving aquatic ecosystem health. In this study, significant differences were observed between TN/TP in groups with and without fish. The TN/TP ratio under coexistence of crucian carp and M. aeruginosa was closer to 7.2. To some extent, this could be used to explain the higher M. aeruginosa density in groups with crucian carp than in fishless groups. Therefore, we believe that finding ways to change the impact of fish on water qualities is one of the potential effective ways to control harmful algae, this holds substantial importance for the high-quality development of the aquaculture industry.
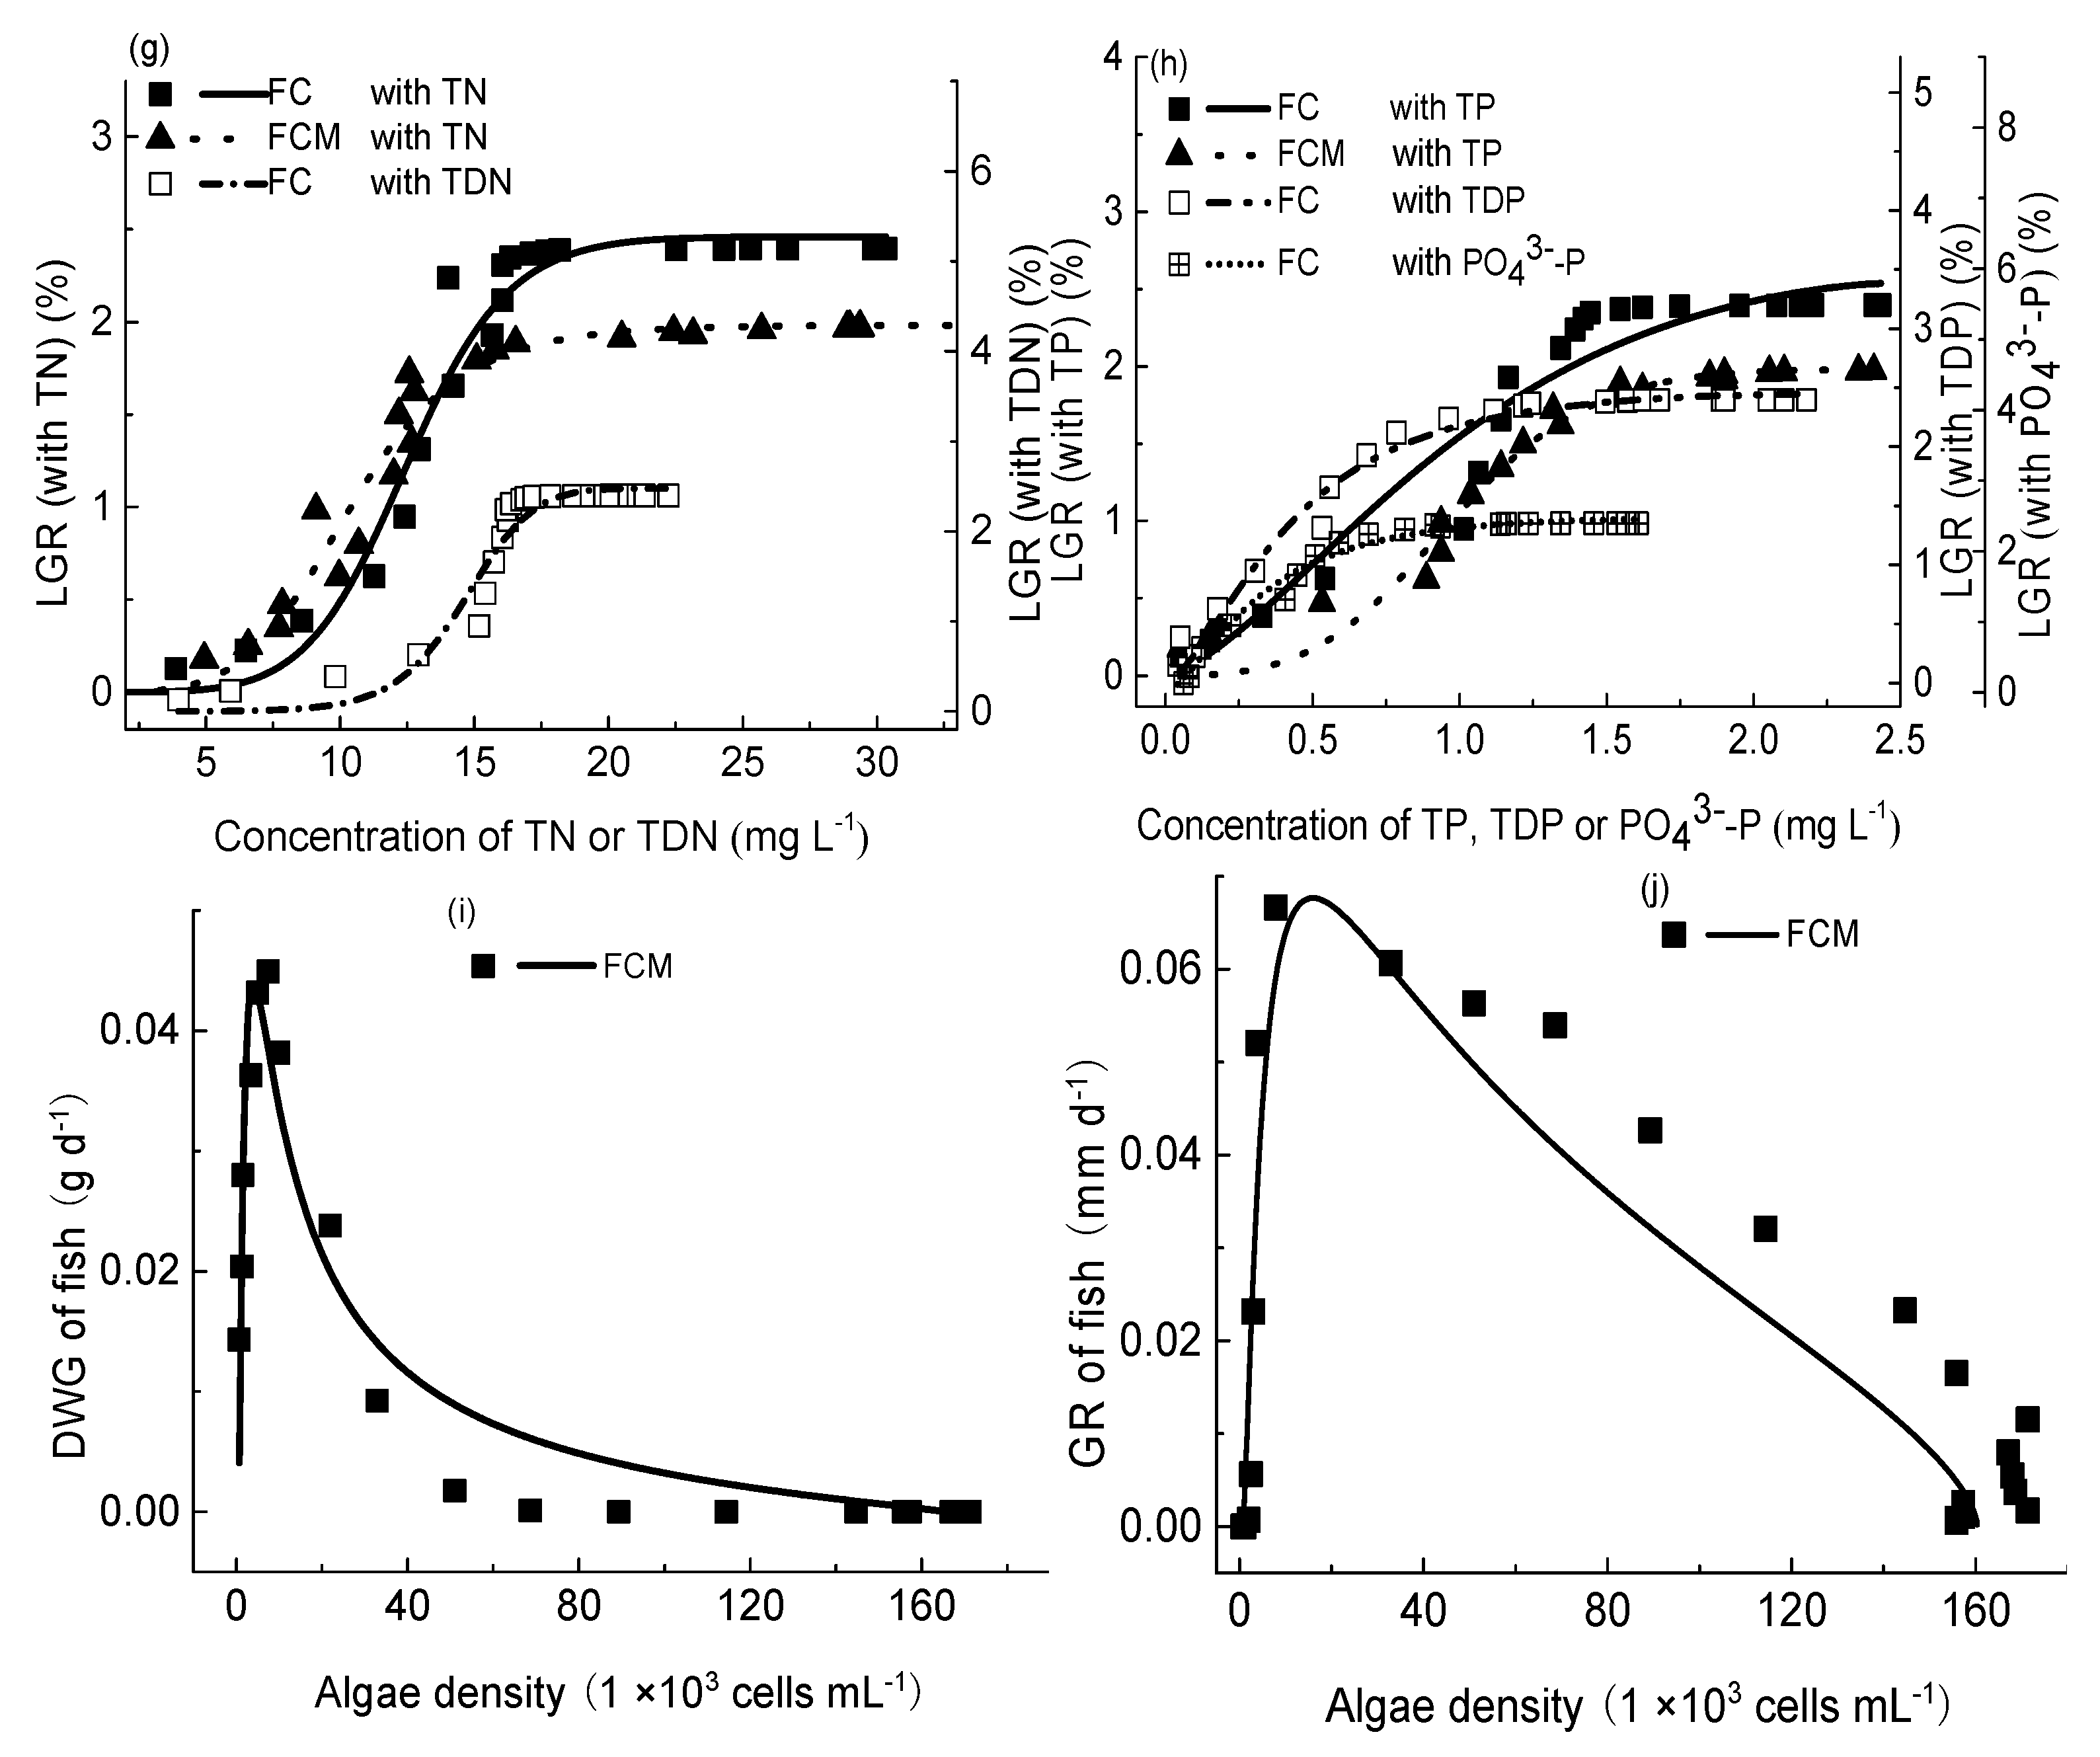
We explored the quantitative relationship between the WGR of crucian carp and the concentrations of TN (R2 = 0.881–0.906), TDN (R2 = 0.941–0.952), TP (R2 = 0.946–0.951), TDP (R2 = 0.943–0.953), and PO43−-P (R2 = 0.948–0.952) using Equation (16). Equation (16) is not suitable for evaluating the relationship between WGR and NH4+-N, as well as the relationship between WGR and nutrients in groups with M. aeruginosa. Figure 5e–h indicated that when concentrations of nutrients were high, the WGR of crucian carp appeared to stagnate. Relationships between LGR of crucian carp and concentrations of nutrients were similar to those of WGR. Islam [49] pointed out that high concentrations of nutrients can be toxic to fish, we tentatively propose that such high concentrations of nutrients may have adverse effects on crucian carp growth. These results serve as a reminder of the importance of monitoring the concentration of various nutrients during aquaculture activities.
This study investigated the relationship between the growth rate of crucian carp and M. aeruginosa densities. As shown in Figure 5i,j, when M. aeruginosa densities were low, the daily weight gain (DWG) and growth rate (GR) of crucian carp increased with the increase in M. aeruginosa densities (first stage). While when M. aeruginosa densities were high, DWG and GR of crucian carp decreased (second stage). The quantitative relationships between the growth rates of crucian carp and M. aeruginosa densities were elucidated using the Gompertz equation and the Logistic equation (Equations (18) and (19)). The fitting results were highly satisfactory (R2 = 0.914–0.955), consistent with findings from previous studies [25], indicating that the Gompertz equation has considerable potential for application in fish growth research. However, literature on the use of the Gompertz equation to model fish growth dynamics remains limited, particularly within fish–algae symbiotic systems—where this study represents the first reported application. Further research is needed to validate and expand its applicability across different contexts. In this regard, application of mathematical models in aquaculture studies will enrich knowledge.
During the first stage, the density of M. aeruginosa was low, and the growth rate of crucian carp was observed to rise as the density of M. aeruginosa increased. This finding was consistent with the research conducted by Thompson et al. [16], in which they suggested that the algae promoted the growth of shrimp, and this was related to the utilization of NH4+-N by algae. In the presence of M. aeruginosa, more than half of the nitrogen nutrients in aquaculture water can be absorbed [50], with NH4+-N being the most bioavailable form of nitrogen [23].
During the second stage, the growth rate of crucian carp decreased as the density of M. aeruginosa increased. The decreased time of the fish growth rate ranged from 20th d to 30th d. The water temperature ranged from 28.4 to 30.0 °C during that period, and the pH values fluctuated between 7.1 and 7.3; both of them were acceptable for the fish [45,51]. Hence the decrease in growth rate was independent of water temperature or pH. Rountos et al.’s results [29] showed that toxic algae may reduce the adaptability and growth performance of fish. Based on the above experimental results, we speculate that the decrease in the growth rate of crucian carp could be attributed to the toxins released by M. aeruginosa, highlighting a promising avenue for future research.
It should be noted that natural ponds and controlled aquaria differ significantly in their environmental conditions, which can have effects on the interactions between fish and algae. For instance, light intensity and spectral composition in natural ponds are subject to variation depending on factors such as season, weather, and water depth, whereas light conditions in aquaria can typically be precisely controlled. Furthermore, natural ponds often exhibit different water flow patterns and microbial communities compared to those in aquaria, which may also influence the dynamics of fish–algae interactions. Therefore, when extrapolating findings from aquaria-based experiments to natural ecosystems, it is crucial to account for the potential impacts of these environmental variables. To improve the ecological relevance of such studies, researchers should strive to incorporate natural conditions into experimental designs wherever possible.

5. Conclusions

This study evaluated the interactions between crucian carp, M. aeruginosa, and water qualities. The main observations are as follows.
In the absence of M. aeruginosa, the average concentrations of TN, TDN, NH4+-N, and TP were higher in groups containing fish compared to fishless groups. This can be attributed to the digestive activity of the fish, which facilitated nitrogen release. The average concentrations of TDP and PO43−-P in groups with crucian carp were lower than those in fishless groups without crucian carp, this may be explained by the soluble phosphorus present in the feed, a portion of which was absorbed by crucian carp. In the presence of M. aeruginosa, average concentrations of NH4+-N, TDN, PO43—P, and TDP in groups with fish were significantly lower than those in fishless groups, attributable to the uptake of nutrients by algae.
It was observed that the proportions of nutrients were greatly affected by M. aeruginosa utilization and digestive activity of fish. Interactions between fish and algae are greatly related to their impacts on water qualities.
The density and growth rate of M. aeruginosa were notably higher in the groups with crucian carp compared to the fishless groups, this was explained by the fact that the presence of fish significantly increased TDN and NH4+-N concentrations, and TN/TP under coexistence of crucian carp, which were more conducive to the growth of M. aeruginosa growth. The growth rate of crucian carp initially increased, then decreased as M. aeruginosa density increased. The growth rates of crucian carp and the corresponding M. aeruginosa densities were found to have quantifiable relationships (Equations (18) and (19)), which were derived using the Gompertz and Logistic equations (R2 = 0.914–0.955).
These findings provide a theoretical basis for the management of aquaculture systems. For instance, this study demonstrates that fish activity significantly influences nutrient concentrations and ratios in the aquatic environment, thereby affecting the dynamics of algal growth. This suggests that continuous monitoring of nutrient parameters is essential during aquaculture practices, and proactive regulation of water quality should be implemented before negative ecological or economic consequences arise. Furthermore, dynamic changes in algal growth can serve as an early indicator of potential impacts on fish populations, enabling timely interventions to mitigate adverse effects, thus improving the efficiency and sustainability of aquaculture operations.
This study was conducted in an aquarium environment. It should be noted that there are inherent differences between the aquarium and natural water bodies, which may limit the generalizability of the findings. Furthermore, due to limitations in experimental conditions, the concentration of algal toxins in the water was not measured. This represents a key area for future research. Despite the limitation, the experiments on interactions between fish, algae and water qualities still hold practical applications. The findings of this investigation provide scientific basis for further research.

Author Contributions

Conceptualization, Z.Y.; methodology, J.Z. and J.W.; software, G.L.; validation, G.L.; formal analysis, G.L.; resources, J.Z. and J.W.; data curation, Z.Y.; writing—original draft preparation, Z.Y.; writing—review and editing, J.G. and W.W.; visualization, J.Z. and J.W.; supervision, J.Z. and J.W.; project administration, J.G. and W.W.; funding acquisition, Z.Y., G.L., J.G. and W.W. All authors have read and agreed to the published version of the manuscript.

Funding

The study was financially supported by the Science and Technology Program for Tackling Key Problems of Henan Province (242102110067, 252102110059); Key Scientific Research Project Plan of Higher Education Institutions in Henan Province (26B240001); Construction of a Demonstration Base for the Grassroots Agricultural Technology Extension System in Tibet Autonomous Region (2025): Fishery Resource Breeding Base on the Yarlung Tsangpo River (XZNYSFJD202504); Agricultural and Animal Husbandry Science and Technology Innovation Project; Henan Agricultural University High-level Talents Special Support Fund (30501451).

Institutional Review Board Statement

Animal experiments were approved by the Animal Experiment Ethics Committee of Henan Agricultural University (approval code: HNND2025031317 and approval date: 13 March 2025).

Data Availability Statement

All data generated or analyzed during this study are included in this published article.

Conflicts of Interest

The authors declare no conflicts of interest.

References

  1. Degefu, F.; Mengistu, S.; Schagerl, M. Influence of fish cage farming on water quality and plankton in fish ponds: A case study in the rift valley and north shoa reservoirs, Ethiopia. Aquaculture 2011, 316, 129–135. [Google Scholar] [CrossRef]
  2. Chen, L.; Yang, X.; Sun, C.; Wang, Y.; Xu, D.; Zhou, C. Feed intake prediction model for group fish using the MEA-BP neural network in intensive aquaculture. Inf. Process. Agric. 2020, 7, 261–271. [Google Scholar] [CrossRef]
  3. Han, Y.; Gu, J.; Li, Q.; Zhang, Y.; He, H.; Shen, R.; Li, K. Effects of juvenile crucian carp (Carassius carassius) removal on submerged macrophyte growth-implications for subtropical shallow lake restoration. Environ. Sci. Pollut. Res. 2019, 27, 42198–42209. [Google Scholar] [CrossRef] [PubMed]
  4. Lopes, I.G.; Lalander, C.H.; Vidotti, R.M.; Vinners, B. Using Hermetia illucens larvae to process biowaste from aquaculture production. J. Clean. Prod. 2020, 251, 119753. [Google Scholar] [CrossRef]
  5. Rahman, M.M.; Verdegem, M.; Nagelkerke, L.; Wahab, M.D.; Milstein, A.; Verreth, J. Effects of common carp Cyprinus carpio (L.) and feed addition in rohu Labeo rohita (Hamilton) ponds on nutrient partitioning among fish, plankton and benthos. Aquac. Res. 2008, 39, 85–95. [Google Scholar] [CrossRef]
  6. Anderson, D.M.; Glibert, P.M.; Burholder, J.M. Harmful algal blooms and eutrophication: Nutrient sources, composition, and consequences. Estuaries 2002, 25, 704–726. [Google Scholar] [CrossRef]
  7. Huang, S.L.; Wu, M.; Zang, C.J.; Du, S.L.; Domagalski, J.; Gajewska, M.; Gao, F.; Lin, C.; Guo, Y.; Liu, B.; et al. Dynamics of algae growth and nutrients in experimental enclosures culturing bighead carp and common carp: Phosphorus dynamics. Int. J. Sediment Res. 2016, 31, 173–180. [Google Scholar] [CrossRef]
  8. Tsai, K.P.; Uzun, H.; Chen, H.; Karanfil, T.; Chow, A.T. Control wildfire-induced Microcystis aeruginosa blooms by copper sulfate: Trade-offs between reducing algal organic matter and promoting disinfection byproduct formation. Water Res. 2019, 158, 227–236. [Google Scholar] [CrossRef]
  9. Xu, Y.; Yang, J.; Ou, M.; Wang, Y.; Jia, J. Study of Microcystis aeruginosa inhibition by electrochemical method. Biochem. Eng. J. 2007, 36, 215–220. [Google Scholar] [CrossRef]
  10. Yang, M.; Wang, X. Interactions between Microcystis aeruginosa and coexisting bisphenol A at different phosphorus levels. Sci. Total Environ. 2019, 658, 439–448. [Google Scholar] [CrossRef]
  11. Miao, Y.; Zheng, S.; Lu, X.; Zhang, K.; Fan, J. Investigation on lanthanum modified kaolinite for control of cyanobacterial growth and microcystin production. Water 2025, 17, 428. [Google Scholar] [CrossRef]
  12. Kong, W.W.; Huang, S.L.; Shi, F.F.; Zhou, J.G.; Feng, Y.B.; Xiao, Y. Study on Microcystis aeruginosa growth in incubator experiments by combination of Logistic and Monod functions. Algal Res. 2018, 35, 602–612. [Google Scholar] [CrossRef]
  13. Aleynik, D.; Dale, A.C.; Porter, M.; Davidson, K. A high resolution hydrodynamic model system suitable for novel harmful algal bloom modelling in areas of complex coastline and topography. Harmful Algae 2016, 53, 102–117. [Google Scholar] [CrossRef] [PubMed]
  14. Lv, Q.; Pitchford, J.W. Stochastic von Bertalanffy models, with applications to fish recruitment. J. Theor. Biol. 2007, 244, 640–655. [Google Scholar] [CrossRef]
  15. Neori, A.; Chopin, T.; Troell, M.; Buschmann, A.H.; Kraemer, G.P.; Halling, C.; Shpigel, M.; Yarish, C. Integrated aquaculture: Rationale, evolution and state of the art emphasizing seaweed biofiltration in modern mariculture. Aquaculture 2004, 231, 361–391. [Google Scholar] [CrossRef]
  16. Thompson, F.L.; Abreu, P.C.; Wasielesky, W. Importance of biofilm for water quality and nourishment in intensive shrimp culture. Aquaculture 2002, 203, 263–278. [Google Scholar] [CrossRef]
  17. Carbis, C.R.; Rawlin, G.T.; Mitchell, G.F.; Anderson, J.W.; McCauley, I. The histopathology of carp, Cyprinus carpio L. exposed to microcystins by gavage, immersion and intraperitoneal administration. J. Fish Dis. 1996, 19, 199–207. [Google Scholar] [CrossRef]
  18. Wu, Q.; Yan, W.; Liu, C.; Li, L.; Yu, L.; Zhao, S.; Li, G. Microcystin-LR exposure induces developmental neurotoxicity in zebrafish embryo. Environ. Pollut. 2016, 213, 793–800. [Google Scholar] [CrossRef]
  19. Liu, J.; Sun, Z.; Lavoie, M.; Fan, X.; Bai, X.; Qian, H. Ammonium reduces chromium toxicity in the freshwater alga Chlorella vulgaris. Appl. Microbiol. Biotechnol. 2016, 99, 3249–3258. [Google Scholar] [CrossRef]
  20. Ramcharan, C.W.; France, R.L.; Mcqueen, D.J. Multiple effects of planktivorous fish on algae through a pelagic trophic cascade. Can. J. Fish. Aqua. Sci. 1996, 53, 2819–2828. [Google Scholar] [CrossRef]
  21. Wang, J.; Wu, R.; Wang, J.; Guo, J.; Zhang, Y.; Shi, N.; Gu, J.; Han, Y.; Guo, X.; Yu, Z.; et al. Investigation of feeding effects and environmental impact of fish-feed quality: Evidence from crucian carp feeding experiments. Fishes 2025, 10, 50. [Google Scholar] [CrossRef]
  22. Yang, Z.J.; Huang, S.L.; Kong, W.W.; Chen, L.; Ekaterina, P.; Khatoon, Z.; Ashraf, M.; Akram, W. Effects of fish feed addition scenarios with prometryn on Microcystis aeruginosa growth and water qualities. Ecotoxicol. Environ. Saf. 2021, 209, 111810. [Google Scholar] [CrossRef] [PubMed]
  23. Wu, M.; Huang, S.L.; Zang, C.J.; Du, S.L. Release of nutrient from fish feed and effects on Microcystis aeruginosa growth. Aquac. Res. 2012, 43, 1460–1470. [Google Scholar] [CrossRef]
  24. Zhou, X.; Li, Y.; Li, H.; Yang, Z.; Zuo, C. Responses in the crucian carp (Carassius auratus) exposed to environmentally relevant concentration of 17α-Ethinylestradiol based on metabolomics. Ecotoxicol. Environ. Saf. 2019, 183, 109501. [Google Scholar] [CrossRef]
  25. Yang, Z.; Zhao, D.; Gu, J.; Wu, R.; Liu, B.; Yu, G.; Dong, P.; H, X.; Li, M.; Li, G. Investigation of biotoxicity and environmental impact of prometryn on fish and algae coexistent system. Water 2024, 16, 2531. [Google Scholar] [CrossRef]
  26. Daendee, S.; Thongsong, B.; Kalandakanond-Thongsong, S. Effects of time of estrogen deprivation on anxiety-like behavior and GABAA receptor plasticity in ovariectomized rats. Behav. Brain Res. 2013, 246, 86–93. [Google Scholar] [CrossRef]
  27. Lim, S.J.; Lee, K.J. Partial replacement of fish meal by cottonseed meal and soybean meal with iron and phytase supplementation for parrot fish Oplegnathus fasciatus. Aquaculture 2009, 290, 283–289. [Google Scholar] [CrossRef]
  28. Hamre, K.; Yúfera, M.; Rønnestad, I.; Boglione, C.; Conceição, L.E.C.; Izquierdo, M. Fish larval nutrition and feed formulation: Knowledge gaps and bottlenecks for advances in larval rearing. Rev. Aquac. 2013, 5, S26–S58. [Google Scholar] [CrossRef]
  29. Rountos, K.J.; Kim, J.J.; Hattenrath-Lehmann, T.K.; Gobler, C.J. Effects of the harmful algae, Alexandrium catenella and Dinophysis acuminata, on the survival, growth, and swimming activity of early life stages of forage fish. Mar. Environ. Res. 2019, 148, 46–56. [Google Scholar] [CrossRef]
  30. Wang, C.Y.; Wang, X.L.; Su, R.G.; Liang, S.K. No detected toxic concentrations in in situ algal growth inhibition tests-A convenient approach to aquatic ecotoxicology. Ecotoxicol. Environ. Saf. 2011, 74, 225–229. [Google Scholar] [CrossRef]
  31. Fussmann, G.F.; Ellner, S.P.; Shertzer, K.W.; Hairston, N.G. Crossing the Hopf bifurcation in a live predator-preysystem. Science 2000, 290, 1358–1360. [Google Scholar] [CrossRef]
  32. Huang, S.L.; Kong, W.W.; Yang, Z.J.; Yu, H.; Li, F.Y. Combination of Logistic and modified Monod functions to study Microcystis aeruginosa growth stimulated by fish feed. Ecotoxicol. Environ. Saf. 2019, 167, 146–160. [Google Scholar] [CrossRef]
  33. Yang, Z.J.; Huang, S.L.; Kong, W.W.; Yu, H.; Li, F.Y.; Khatoon, Z.; Ashraf, M.N.; Akram, W. Effect of different fish feeds on water quality and growth of crucian carp (Carassius carassius) in the presence and absence of prometryn. Ecotoxicol. Environ. Saf. 2021, 227, 112914. [Google Scholar] [CrossRef]
  34. Hargreaves, J.A. Nitrogen biogeochemistry of aquaculture ponds. Aquaculture 1998, 166, 181–212. [Google Scholar] [CrossRef]
  35. Haug, R.T.; McCarty, P.L. Nitrification with the submerged filter. Tech. Rep. Dep. Civ. Eng. 1971, 149, 206. [Google Scholar]
  36. Eze, V.C.; Velasquez-Orta, S.B.; Hernández-García, A.; Monje-Ramírez, I.; Orta-Ledesma, M.T. Kinetic modelling of microalgae cultivation for wastewater group and carbon dioxide sequestration. Algal Res. 2018, 32, 131–141. [Google Scholar] [CrossRef]
  37. Yogev, U.; Gross, A. Reducing environmental impact of recirculating aquaculture systems by introducing a novel microaerophilic assimilation reactor: Modeling and proof of concept. J. Clean. Prod. 2019, 226, 1042–1050. [Google Scholar] [CrossRef]
  38. Cancemi, G.; Falco, G.D.; Pergent, G. Effects of organic matter input from a fish farming facility on a Posidonia oceanica meadow. Estuar. Coast. Shelf Sci. 2003, 56, 961–968. [Google Scholar] [CrossRef]
  39. Burford, M.A.; Williams, K.C. The fate of nitrogenous waste from shrimp feeding. Aquaculture 2001, 198, 79–93. [Google Scholar] [CrossRef]
  40. Yone, Y.; Toshima, N. The utilization of phosphorus in fish meal by carp and black sea bream. Bull. Jap. Soc. Sci. Fish 1979, 45, 753–756. [Google Scholar] [CrossRef]
  41. Yang, S.D.; Lin, T.S.; Liu, F.G.; Liou, C.H. Influence of dietary phosphorus levels on growth, metabolic response and body composition of juvenile silver perch (Bidyanus bidyanus). Aquaculture 2006, 253, 592–601. [Google Scholar] [CrossRef]
  42. Wang, X.; Andresen, K.; Handa, A.; Jensen, B.; Olsen, Y. Chemical composition and release rate of waste discharge from an Atlantic salmon farm with an evaluation of IMTA feasibility. Aquac. Environ. Interact. 2013, 4, 147–162. [Google Scholar] [CrossRef]
  43. Chu-Koo, F.; Stewart, P.M.; Babilonia, J.L.; Garcia-Davilia, C. Water temperature effects on growth, feed utilization and survival of black pacu (Colossoma macropomum) fingerlings. Folia Amaz. 2011, 20, 15–21. [Google Scholar] [CrossRef]
  44. Zucchi, M.R.; Necchi, O. Effects of temperature, irradiance and photoperiod on growth and pigment content in some freshwater red algae in culture. Phycol. Res. 2001, 49, 103–114. [Google Scholar] [CrossRef]
  45. Swingle, H.S. Relationships of pH of pond waters to their suitability for fish culture. Proc. Pac. Sci. Congr. 1961, 10, 72–75. [Google Scholar]
  46. Prairie, Y.T.; Duarte, C.M.; Kalff, J. Unifying nutrient-Chlorophyll Relationship in Lakes. Can. J. Fish. Aquat. Sci. 1989, 46, 1176–1182. [Google Scholar] [CrossRef]
  47. Zhang, X.; Zhao, J.; Ding, L.; Li, Y.; Liu, H.; Zhao, Y.; Fu, G. Eutrophication evolution trajectory influenced by human activities and climate in the shallow Lake Gehu, China. Ecol. Indic. 2022, 138, 108821. [Google Scholar] [CrossRef]
  48. Downing, J.A. The nitrogen: Phosphorus relationship in lakes. Limnol. Oceanogr. 1992, 37, 936–945. [Google Scholar] [CrossRef]
  49. Islam, M.S. Nitrogen and phosphorus budget in coastal and marine cage aquaculture and impacts of effluent loading on ecosystem: Review and analysis towards model development. Mar. Pollut. Bull. 2005, 50, 48–61. [Google Scholar] [CrossRef]
  50. Krom, M.D.; Neori, A. A total nutrient budget for an experimental intensive fishpond with circularly moving seawater. Aquaculture 1989, 88, 345–358. [Google Scholar] [CrossRef]
  51. Sikorska, J.; Kondera, E.; Kaminski, R.; Lugowska, K.; Witeska, M.; Wolnicki, J. Effect of four rearing water temperatures on some performance parameters of larval and juvenile crucian carp, Carassius carassius, under controlled conditions. Aquac. Res. 2018, 49, 3874–3880. [Google Scholar] [CrossRef]
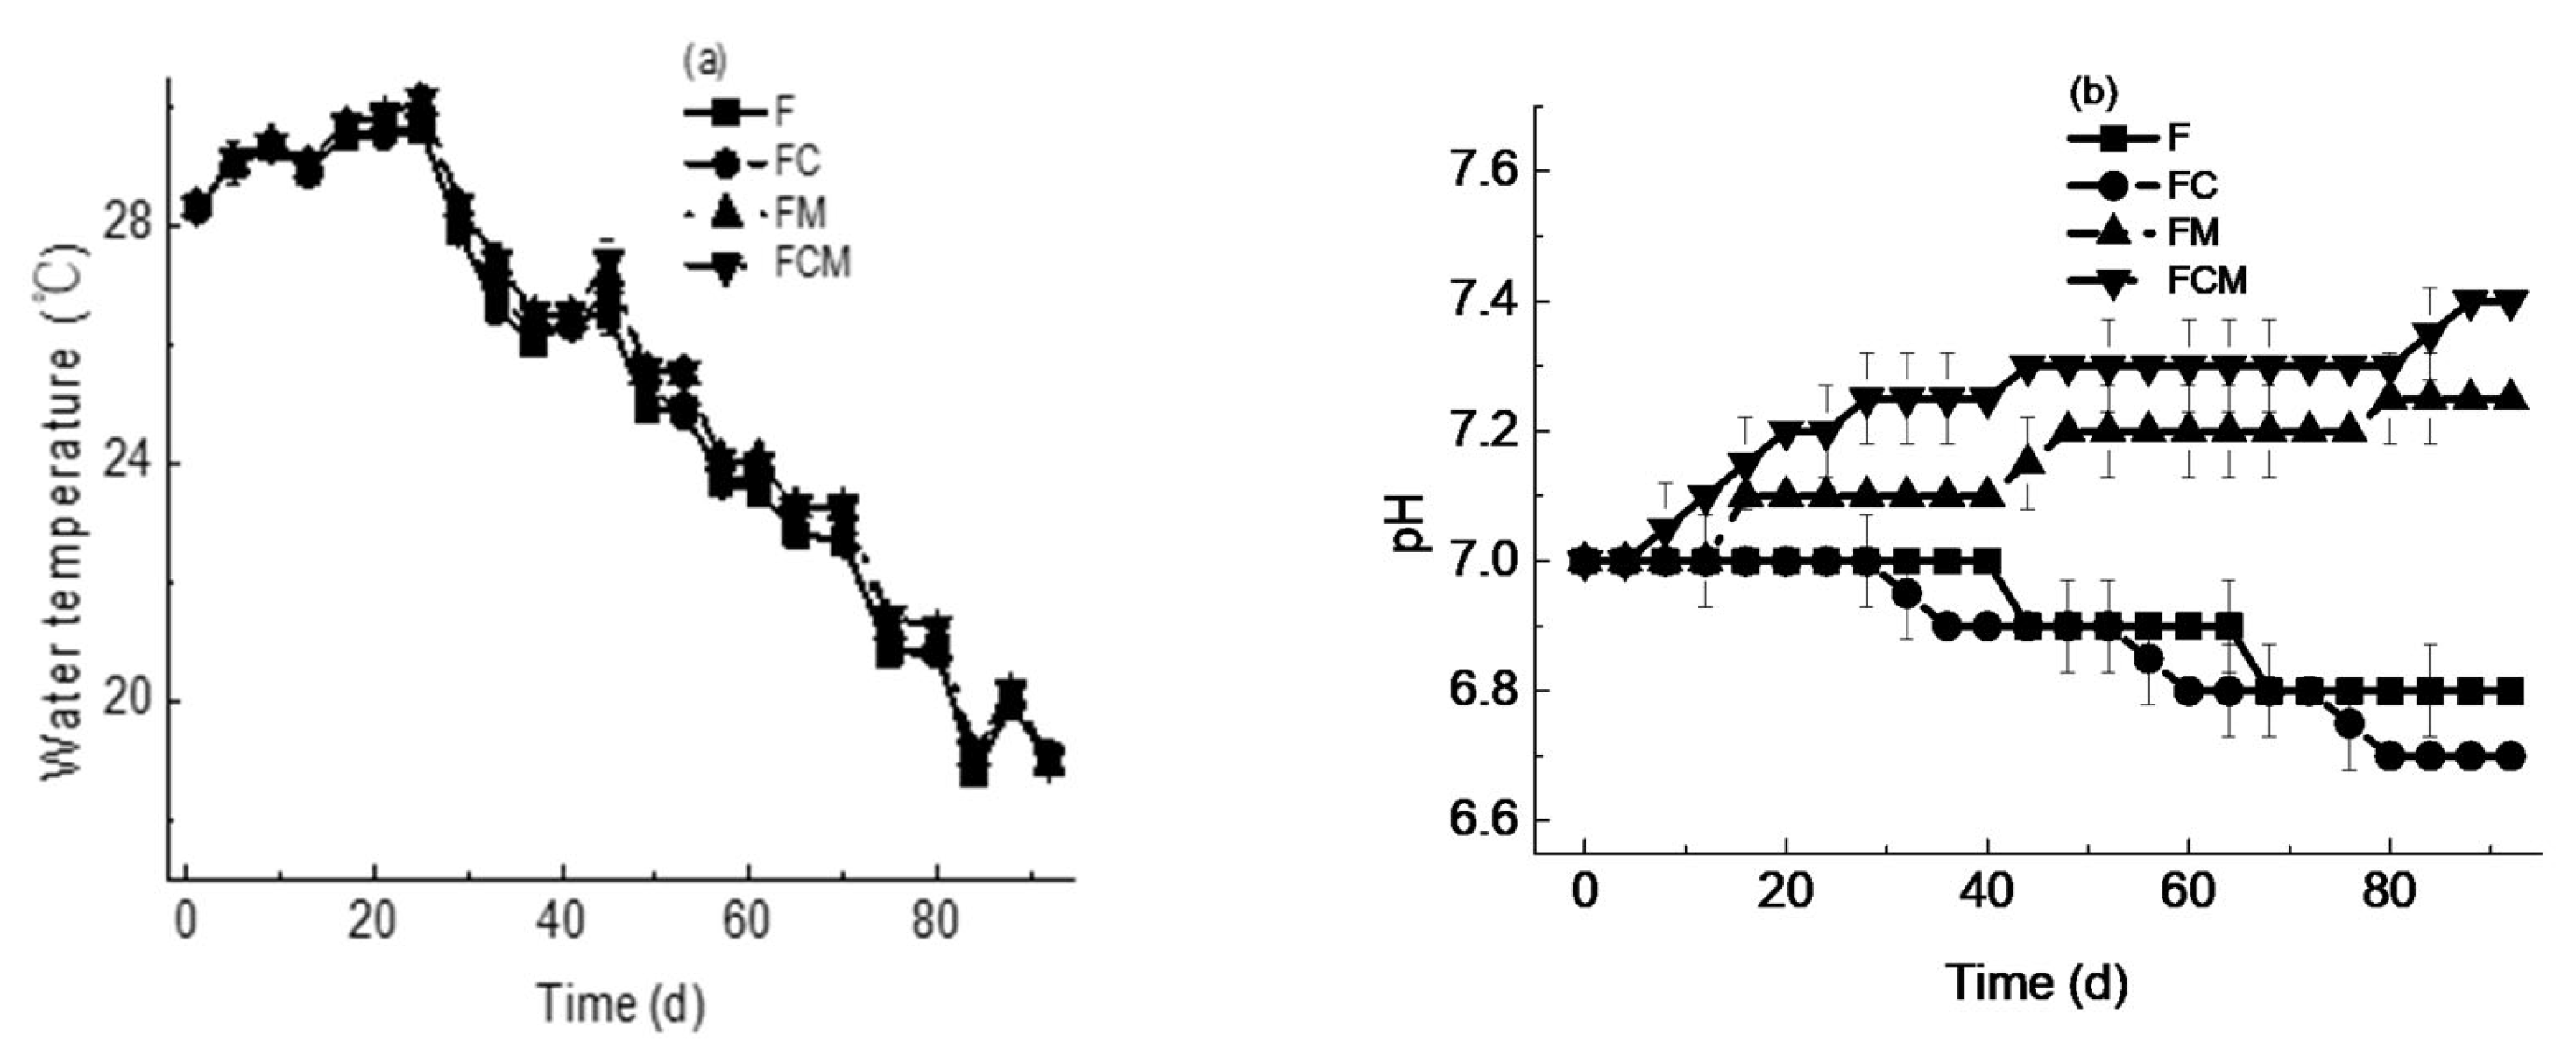
Figure 1. Variations in water temperature (a) and pH (b) with time. F, feed; FC, feed + crucian carp; FM, feed + M. aeruginosa; FCM, feed + crucian carp + M. aeruginosa. In groups with fish (FC and FCM), n = 3.
Fishes 10 00486 g001
Figure 2. Variations in crucian carp growth with time: (a) BW (body weight) and DWG (daily weight gain); (b) BL (body length) and GR (growth rate); (c) WGR (weight gain rate); (d) LGR (length gain rate). FC, feed + crucian carp; FCM, feed + crucian carp + M. aeruginosa. n = 3.
Fishes 10 00486 g002
Figure 3. Variations in (a) M. aeruginosa densities; (b) growth rates; (c) specific growth rates over time. FM, feed + M. aeruginosa; FCM, feed + crucian carp + M. aeruginosa.
Fishes 10 00486 g003
Figure 4. Variations in concentrations of nutrients with time. (a), versions of TN; (b), versions of TDN; (c), versions of NH4+-N; (d) versions of TP; (e) versions of TDP; (f) versions of PO43−-P. F, feed; FC, feed + crucian carp; FM, feed + M. aeruginosa; FCM, feed + crucian carp + M. aeruginosa. In groups with fish (FC and FCM), n = 3.
Fishes 10 00486 g004
Figure 5. Relationship between M. aeruginosa, concentrations of nutrients, and crucian carp: (ad) algae densities and concentrations of nutrients; (eh) WGR (LGR) of fish and concentrations of nutrients; (i,j) DWG (GR) of fish and algae density. F, feed; FC, feed + crucian carp; FM, feed + M. aeruginosa; FCM, feed + crucian carp + M. aeruginosa. In groups with fish (FC and FCM), n = 3.
Fishes 10 00486 g005aFishes 10 00486 g005b
Table 1. Parameters related to fish growth, algae growth and nutrients’ proportions.
ParameterFFCFMFCM
Growth-related parameters of crucian carp
aW-−3.32-−2.97
rW-0.09-0.08
BWmax-18.45-19.56
R2-0.876-0.775
aL-−3.58-−3.60
rL-0.04-0.02
BLmax-94.45-94.59
R2-0.958-0.894
DWGmax-0.61-0.57
GRmax-1.39-0.70
FCE-9.70-8.50
WGRmax-5.04-3.74
LGRmax-2.40-1.97
PER-32.34-28.35
Parameters of equations describing M. aeruginosa growth
a--5.296.66
r/d−1--0.150.16
Nmax--43.28165.68
Nave--26.5290.86
R2--0.9870.992
μcmax--1.626.63
μcave--0.441.81
μcmax--0.150.16
μcave--0.040.05
Nutrients’ proportions in different groups
NH4+-N/TN (%)1.394.461.911.53
TDN/TN (%)72.1390.5439.9530.35
PO43−-P/TP (%)63.9456.1616.6414.37
TDP/TP (%)88.1573.6823.7718.46
TN/TP12.4012.9813.7711.80
Note: F, feed; FC, feed + crucian carp; FM, feed + M. aeruginosa; FCM, feed + crucian carp + M. aeruginosa. aW/aL (-), a constant; rW/rL (d−1), rate constant; BWmax (%), the maximum BW of fish; BLmax (%), the maximum BL of fish; R2, correlation coefficient; DWGmax, the maximum DWG of fish; GRmax, the maximum GR of fish; a (-), a constant; r (d−1), the intrinsic growth rate; Nmax (1 × 10³ cells mL−1), the maximum algae density; Nave (1 × 10³ cells mL−1), the average algae density; μcmax (1 × 10³ cells (mL d)−1), the maximum growth rate; μcave (1 × 10³ cells (mL d)−1), the average growth rate; μcmax (d−1), the maximum specific growth rate; μcave (d−1), the average specific growth rate.
Disclaimer/Publisher’s Note: The statements, opinions and data contained in all publications are solely those of the individual author(s) and contributor(s) and not of MDPI and/or the editor(s). MDPI and/or the editor(s) disclaim responsibility for any injury to people or property resulting from any ideas, methods, instructions or products referred to in the content.