Article

Histopathological and Molecular Insights into Grass Carp Kidney Responses to Co-Infection with Aeromonas hydrophila and Aeromonas veronii

1
Key Laboratory of Freshwater Aquatic Genetic Resources, Ministry of Agriculture and Rural Affairs, Shanghai Ocean University, Shanghai 201306, China
2
National Demonstration Center for Experimental Fisheries Science Education, Shanghai Ocean University, Shanghai 201306, China
3
Shanghai Engineering Research Center of Aquaculture, Shanghai Ocean University, Shanghai 201306, China
4
Nanjing Institute of Environmental Sciences, Ministry of Ecology and Environment (MEE), Nanjing 210042, China
5
Organic Food Development and Certification Center of China, Nanjing 210042, China
6
Jiangsu Agricultural Publicity, Education and Cultural & Sports Center, Zhenjiang 210036, China
*
Author to whom correspondence should be addressed.
These authors contributed equally to this work.
Fishes 2025, 10(10), 484; https://doi.org/10.3390/fishes10100484
Submission received: 29 July 2025 / Revised: 27 August 2025 / Accepted: 28 August 2025 / Published: 29 September 2025
(This article belongs to the Section Welfare, Health and Disease)

Abstract

Grass carp (Ctenopharyngodon idella), a key species in freshwater aquaculture, is particularly vulnerable to opportunistic pathogens, including Aeromonas hydrophila and Aeromonas veronii. While the pathogenic mechanisms of individual infections have been extensively characterized, the host immune responses during co-infection remain poorly understood. This research explored the renal pathological alterations and transcriptomic shifts in grass carp subjected to simultaneous infection by A. hydrophila and A. veronii. Mortality occurred as early as 24 h post-challenge, ultimately reaching a cumulative death rate of 65%. Quantitative analysis of renal bacterial burden revealed a marked increase in colonization at 3 days post-infection (dpi). The histopathological assessment showed progressive kidney damage, including tubular collapse, epithelial necrosis, interstitial edema, and widespread epithelial desquamation, with the most severe lesions observed at 5 dpi and partial signs of recovery by 7 dpi. A total of 1106 and 472 genes were found to be differentially expressed at 1 and 5 dpi, respectively, based on transcriptome profiling. The functional enrichment analysis indicated that the differentially expressed genes (DEGs) were mainly involved in the complement and coagulation cascade pathways. Notably, the immune-related genes exhibited a biphasic trend, with predominant downregulation at 1 dpi followed by marked upregulation by 5 dpi, indicating dynamic changes in immune modulation during co-infection. These results provide new insights into host responses during dual bacterial infections in fish and may inform disease prevention strategies in aquaculture.
Key Contribution: Aeromonas hydrophila and A. veronii are two common opportunistic pathogens that pose serious threats to grass carp aquaculture. In this study, we conducted an integrated histopathological and transcriptomic analysis of kidney tissue—a primary target organ for Aeromonas infections—to elucidate the host responses during co-infection. The histological examinations revealed extensive renal damage, including tubular collapse, epithelial necrosis and shedding, and interstitial edema. The transcriptomic profiling demonstrated a pronounced activation of host immune responses, with differentially expressed genes (DEGs) significantly enriched in the complement and coagulation cascade pathways, which play central roles in innate immunity and inflammation. Notably, several serine protease inhibitors (including SERPINC1, SERPIND1, and SERPINF2) were among the most affected immune-related genes and were associated with the regulation of immune activation and vascular homeostasis. These findings provide new insights into the molecular basis of polymicrobial infections in teleosts and offer potential targets for disease prevention and control in grass carp aquaculture.

1. Introduction

Grass carp (Ctenopharyngodon idella) has become the world’s leading species in freshwater aquaculture production [1]. Owing to its rapid growth rate, high feed conversion efficiency, and strong adaptability to diverse environmental conditions, it holds a dominant position in the freshwater aquaculture industry [2]. Nevertheless, with the intensification of aquaculture operations, there has been a marked rise in both the occurrence and impact of infectious diseases, posing significant challenges to the long-term sustainability of the industry [3]. Among the various infectious agents, bacterial pathogens are particularly problematic, frequently resulting in high morbidity and mortality rates in cultured fish populations [4]. Aeromonas hydrophila and A. veronii are common opportunistic bacteria that are often isolated from diseased fish and their surrounding aquatic environments [5,6,7]. These pathogens are capable of causing severe systemic infections, including septicemia, renal swelling, and hemorrhagic lesions [8,9,10], thereby significantly compromising fish health and aquaculture productivity.
In recent years, the simultaneous infection of aquaculture species by multiple bacterial pathogens, often referred to as co-infection, has been increasingly recognized for its potential to worsen disease severity [11]. Compared to single-pathogen infections, co-infections are more likely to induce complex pathological alterations, impose greater immunological stress, and result in significantly elevated mortality rates. The synergistic interactions between multiple pathogens may intensify tissue damage in the host and accelerate disease progression [12]. Co-infection-induced pathology has been extensively reported in fish models. For example, simultaneous infection by A. hydrophila and A. veronii in zebrafish (Danio rerio) has been reported to induce pronounced kidney and skin damage, along with significantly elevated mortality rates. The overall death rate in co-infected individuals reached 87%, which was notably higher compared to those infected separately with A. hydrophila (72%) or A. veronii (67%) [13]. Comparable interactions enhancing pathogenicity have also been observed in other aquaculture species. In Lates calcarifer (barramundi), for instance, co-infection with Streptococcus iniae and Shewanella algae led to systemic disease manifestations, including widespread skin ulcerations [14]. Co-infection with salmon lice (Lepeophtheirus salmonis) and infectious hematopoietic necrosis virus (IHNV) was shown to markedly elevate mortality in smolt-stage sockeye salmon (Oncorhynchus nerka). The cumulative mortality in the co-infection group reached 60%, which was markedly higher than the mortality caused by infection with salmon lice alone (0%) or IHNV alone (10%) [15]. In Pangasianodon hypophthalmus (Sauvage), concurrent infection with Edwardsiella ictaluri and A. hydrophila led to a cumulative mortality of 95%, which was substantially higher than that caused by E. ictaluri (80%) or A. hydrophila (10%) alone [16]. In Oncorhynchus mykiss, simultaneous infection with Pseudomonas fluorescens and Yersinia ruckeri significantly increased mortality to 80%, exceeding the death rates observed for individual infections with P. fluorescens (40%) and Y. ruckeri (60%) [17]. The significant impact of bacterial co-infections on aquatic animal health underscores the urgency of further studies to clarify their pathogenesis and enhance disease management practices. The evidence indicates that co-infections substantially increase the health risks within aquaculture environments. Achieving a more comprehensive understanding of the immune responses and pathological alterations caused by bacterial co-infections in grass carp is vital for devising effective prevention and control measures.
Although numerous studies have investigated bacterial co-infections across different aquaculture fish species, knowledge of the hosts’ molecular responses to simultaneous bacterial infections remains insufficient—especially in commercially valuable species like grass carp. A. hydrophila and A. veronii are commonly recognized as opportunistic pathogens in grass carp. Although substantial research has focused on their individual pathogenic effects [7,8,18], studies investigating their co-infection dynamics remain scarce. The evidence that emerged from our previous work revealed synergistic effects during Aeromonas co-infection in grass carp, particularly in the liver, where transcriptomic analyses demonstrated pronounced immune and metabolic disruptions [19]. However, whether similar or distinct responses occur in other critical organs remains unclear. In particular, to date, no systematic investigation has addressed the pathological alterations and immune responses in the kidneys—a key immune organ—of grass carp under A. hydrophila and A. veronii co-infection. To better understand these mechanisms, the present work focuses on the pathological alterations and immune activity within the kidney under co-infection conditions. Through a combination of histopathological assessment and molecular profiling, this study seeks to uncover the key immune pathways involved in co-infection, thereby offering essential theoretical insights and practical data to inform effective strategies for the prevention and control of polymicrobial diseases in aquaculture.

2. Materials and Methods

The infection protocol used in this study follows the same challenge procedures previously described by our group [19]. However, the present work differs in its sample collection and downstream processing: kidney tissue (trunk kidney) was collected and processed for simultaneous histopathological examination and RNA-seq, whereas the earlier study analyzed liver tissue. The detailed sample handling and processing steps are described below.

2.1. Experimental Animals and Bacteria

All the animal experiments adhered to the Guidelines for the Care and Use of Laboratory Animals and were authorized by the Institutional Animal Care and Use Committee (IACUC) of Shanghai Ocean University (Shanghai, China). Sixty healthy grass carp (Ctenopharyngodon idella, 70–80 g each) were sourced from Suzhou Shenhang Eco-Technology Development Co., Ltd. (Suzhou China). Before the challenge assays, the fish were acclimatized for seven days under standardized conditions in glass tanks (30 cm × 40 cm × 35 cm) with continuous aeration and a controlled water temperature of 28 ± 2 °C [19]. The A. hydrophila (strain 23091906bs, GenBank accession no. CP011100.1) and A. veronii (strain 23090701bs, GenBank accession no. MW362188.1) strains used in this study were obtained from the Aquatic Animal Pathogen Resource Center at Shanghai Ocean University. Both strains were previously identified at the molecular level and deposited in the GenBank database. The strains were grown in LB broth at 28 °C with continuous shaking for 24 h. Following incubation, the bacterial cells were collected by centrifugation and washed twice using sterile phosphate-buffered saline (PBS). Finally, the bacteria were diluted in LB broth to a concentration of 1 × 10⁷ CFU/mL for use in the infection experiments.

2.2. Co-Infection and Sampling

Sixty healthy grass carp were randomly allocated into two groups—a co-infection group and a control group—with three replicates per group and ten fish per replicate. The fish in the co-infection group received intraperitoneal injections of a 200 μL mixed bacterial suspension, comprising A. hydrophila and A. veronii, each at a final concentration of 1 × 10⁷ CFU/mL. The control group was injected with an equivalent volume of sterile PBS. At 1, 3, 5, and 7 days post-infection, three fish from each group were randomly selected, anesthetized using tricaine methanesulfonate (MS-222) [20], and euthanized. Trunk kidney samples were immediately collected for further analysis. The samples from the co-infection group at 1 and 5 dpi were designated as K1 and K5, respectively, whereas the control group samples were labeled as K0. The collected trunk kidney tissues were divided into two portions: one was fixed in 4% paraformaldehyde for histopathological evaluation, and the other was weighed, snap-frozen in liquid nitrogen, and stored at −80 °C for the subsequent molecular investigations. All dissections were performed using sterile instruments.

2.3. Tissue Bacterial Loading Assay

Bacterial load quantification in trunk kidney tissues was performed under aseptic conditions in biosafety cabinet. For each group, kidney samples from three individual fish were collected, and approximately 100 mg of tissue from same anatomical region of trunk kidney was weighed for analysis. Precisely weighed tissues were homogenized in sterile physiological saline using mechanical disruption. Homogenized tissue samples were subjected to serial dilution, and 50 μL from each dilution was plated onto LB agar containing ampicillin (100 μg/mL). Ampicillin was included to suppress non-target bacterial growth; both A. hydrophila and A. veronii used in this study are resistant to ampicillin [21], ensuring accurate enumeration. Plates were incubated at 28 °C for 24 h, and CFUs were counted. CFU counts were normalized to initial tissue weight and expressed as CFU per gram of kidney tissue.

2.4. Histopathological Analysis

For histological analysis, kidney tissues were initially preserved in 4% paraformaldehyde, followed by ethanol gradient dehydration, paraffin embedding, and microtome sectioning at 5 μm thickness. Sections were stained with hematoxylin and eosin (H&E) [22]. Histopathological alterations were observed under light microscope, and digital images were captured at 400× magnification.
Semi-quantitative scoring was performed by two blinded pathologists using validated 4-tier system (0–3). Scores were 0: no pathology; 1: mild changes (tubular swelling, ≤10% necrosis, <15 inflammatory cells/field); 2: moderate damage (focal necrosis 10–30%, 15–30 inflammatory cells/field); and 3: severe injury (>30% necrosis, >30 inflammatory cells/field). Scoring focused on two key parameters: tubular necrosis and inflammatory infiltration. Inter-observer concordance was confirmed by Cohen’s κ (κ = 0.85).

2.5. Transcriptome Analysis of Kidney Tissues

RNA was extracted from kidney tissues using TRIzol reagent (Invitrogen, Carlsbad, CA, USA). RNA quality control encompassed following steps: purity was assessed by NanoDrop 2000 spectrophotometer (Thermo Scientific, Waltham, MA, USA), concentration was quantified with Qubit fluorometer (Invitrogen, Carlsbad, CA, USA), and integrity was evaluated using Agilent 2100 Bioanalyzer (Agilent Technologies, Santa Clara, CA, USA). Only samples with RNA integrity numbers (RIN) of 8.0 or higher were selected for library preparation using VAHTS Universal V6 RNA-seq Library Prep Kit (Vazyme, Nanjing, China) according to manufacturer’s instructions.
Illumina NovaSeq 6000 platform was utilized to perform sequencing, producing 150 bp paired-end reads. Initial raw reads underwent quality filtering with FastP (v0.23.2) [23] to remove adapter sequences, low-quality bases, and contaminants. Subsequently, cleaned reads were aligned against grass carp reference genome using Hisat2 (v2.2.1) [24]. To identify differentially expressed genes (DEGs), DESeq2 (v1.38.3) [25] was employed with thresholds set at |log2FC| ≥ 1 and adjusted p-value less than 0.05. Functional enrichment analysis of these DEGs focused on Kyoto Encyclopedia of Genes and Genomes (KEGG) pathways and was conducted using ClusterProfiler package [26]. Protein–protein interaction networks were constructed by STRING (v12.0) and further visualized using Cytoscape (v3.10.2) [27].

2.6. Statistical Analysis

All statistical evaluations were performed using GraphPad Prism software, version 9 (GraphPad Software Inc., San Diego, CA, USA) [28]. Mortality data are presented as mean ± standard error (SE), while all other experimental results are expressed as mean value ± standard deviation (SD). Kidney bacterial loads were analyzed using Kruskal–Wallis test, followed by Dunn’s post hoc test for pairwise comparisons across time points. Statistical significance was defined as p < 0.05.

3. Results

3.1. Cumulative Mortality Percent

Upon co-infection with A. hydrophila and A. veronii, the clinical signs were observed starting at 1 dpi, including lethargy, reduced feeding, pale gills, and scattered hemorrhages on the body surface and fins. Mortality first occurred at 1 dpi, increased sharply by 3 dpi, and then rose more gradually until reaching a plateau around 5 dpi. The final survival rate was 33%. The individuals marked with a “+” were censored, indicating their survival through the full 7-day observation period. In the control group, no deaths were recorded during the experiment, and all the fish were censored at 7dpi (Figure 1).

3.2. Bacterial Load

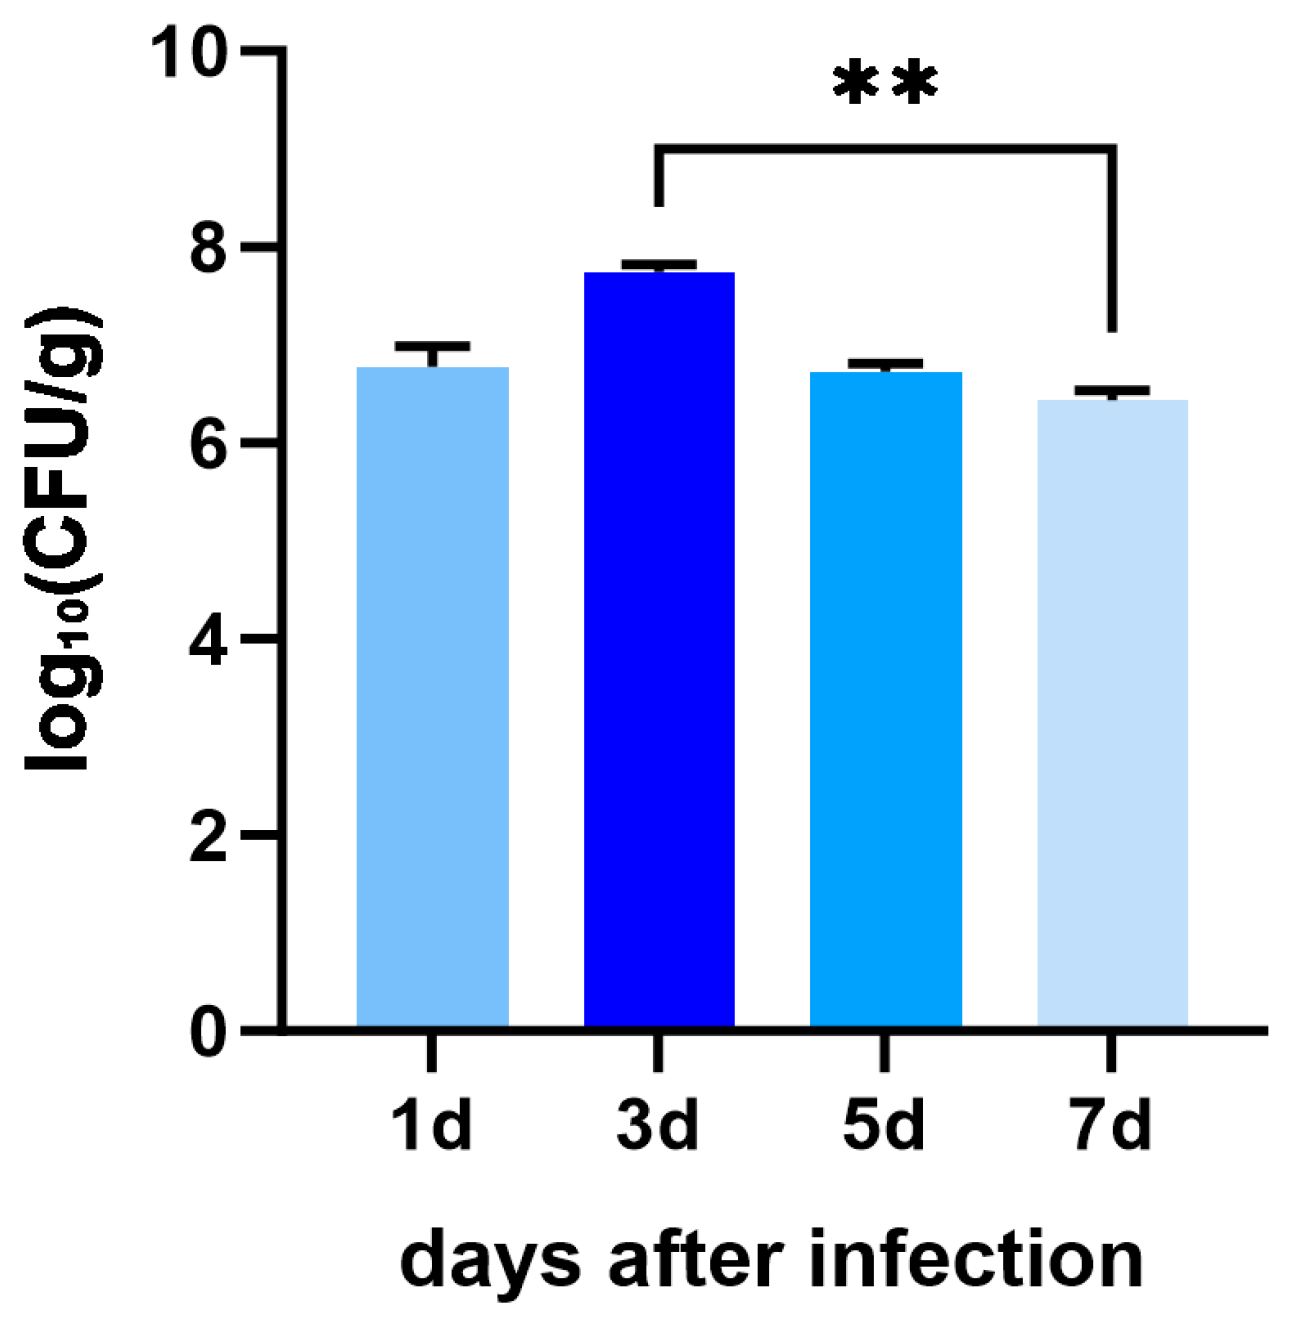
To investigate the progression of co-infection, the bacterial loads in the kidneys were quantified at multiple time points post-infection (n = 3 fish/group). The results revealed a clear time-dependent fluctuation, with the bacterial burden reaching its peak at 3 dpi (5.8 × 10⁷ CFU). Comparatively lower loads were observed at 1, 5, and 7 dpi, measured at 8.6 × 10⁶, 6.5 × 10⁶, and 3.4 × 10⁶ CFU, respectively (Figure 2). The statistical analysis using the Kruskal–Wallis test indicated significant differences among the time points (H = 9.462; df = 3; p = 0.0014). Dunn’s post hoc test further confirmed that the bacterial burden at 3 dpi was significantly higher than that at 7 dpi (p = 0.0067), whereas no significant differences were detected between 3 dpi and either 1 dpi or 5 dpi (p > 0.05).

3.3. Kidney Histopathology

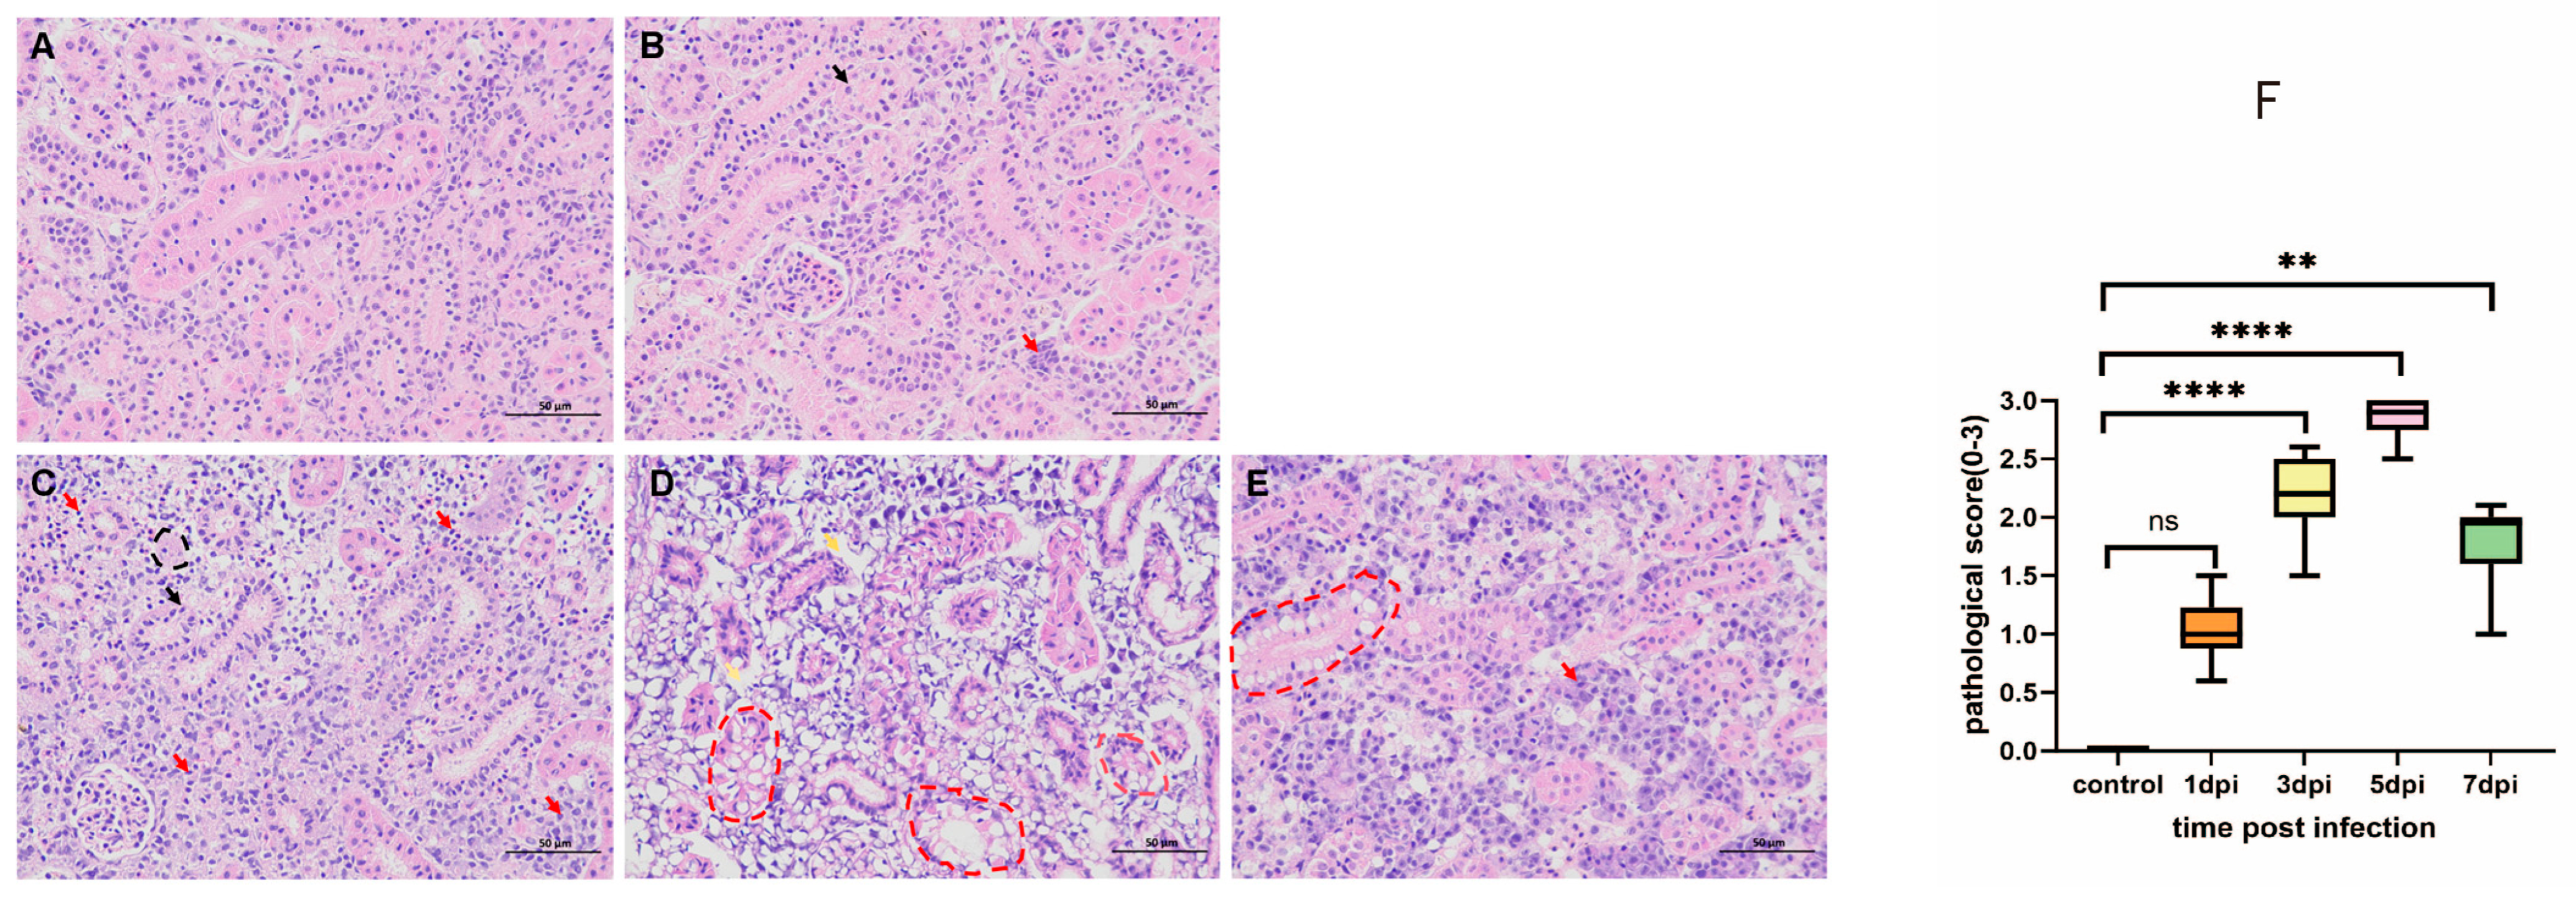
In the control group, the renal tissues exhibited a well-organized architecture, with clearly defined renal tubules and glomeruli arranged in an orderly manner (Figure 3A). At 1 dpi, mild histological alterations were observed, including slight swelling of tubular epithelial cells and limited infiltration of inflammatory cells, corresponding to low semi-quantitative scores (median = 1.0) (Figure 3B,F). By 3 dpi, renal injury had progressed, characterized by epithelial cell degeneration, focal necrosis, and more pronounced inflammatory cell infiltration with significantly elevated pathology scores (Figure 3C,F). The most severe pathological changes occurred at 5 dpi, including substantial collapse of renal tubular structures, marked interstitial edema, and extensive epithelial cell desquamation, corresponding to the highest semi-quantitative score (median = 3.0) (Figure 3D,F). At 7 dpi, signs of tissue repair were evident: inflammatory infiltration was reduced, and partial restoration of tubular architecture was observed, consistent with the significantly reduced injury scores (median = 1.5) (Figure 3E,F).

3.4. Transcriptome

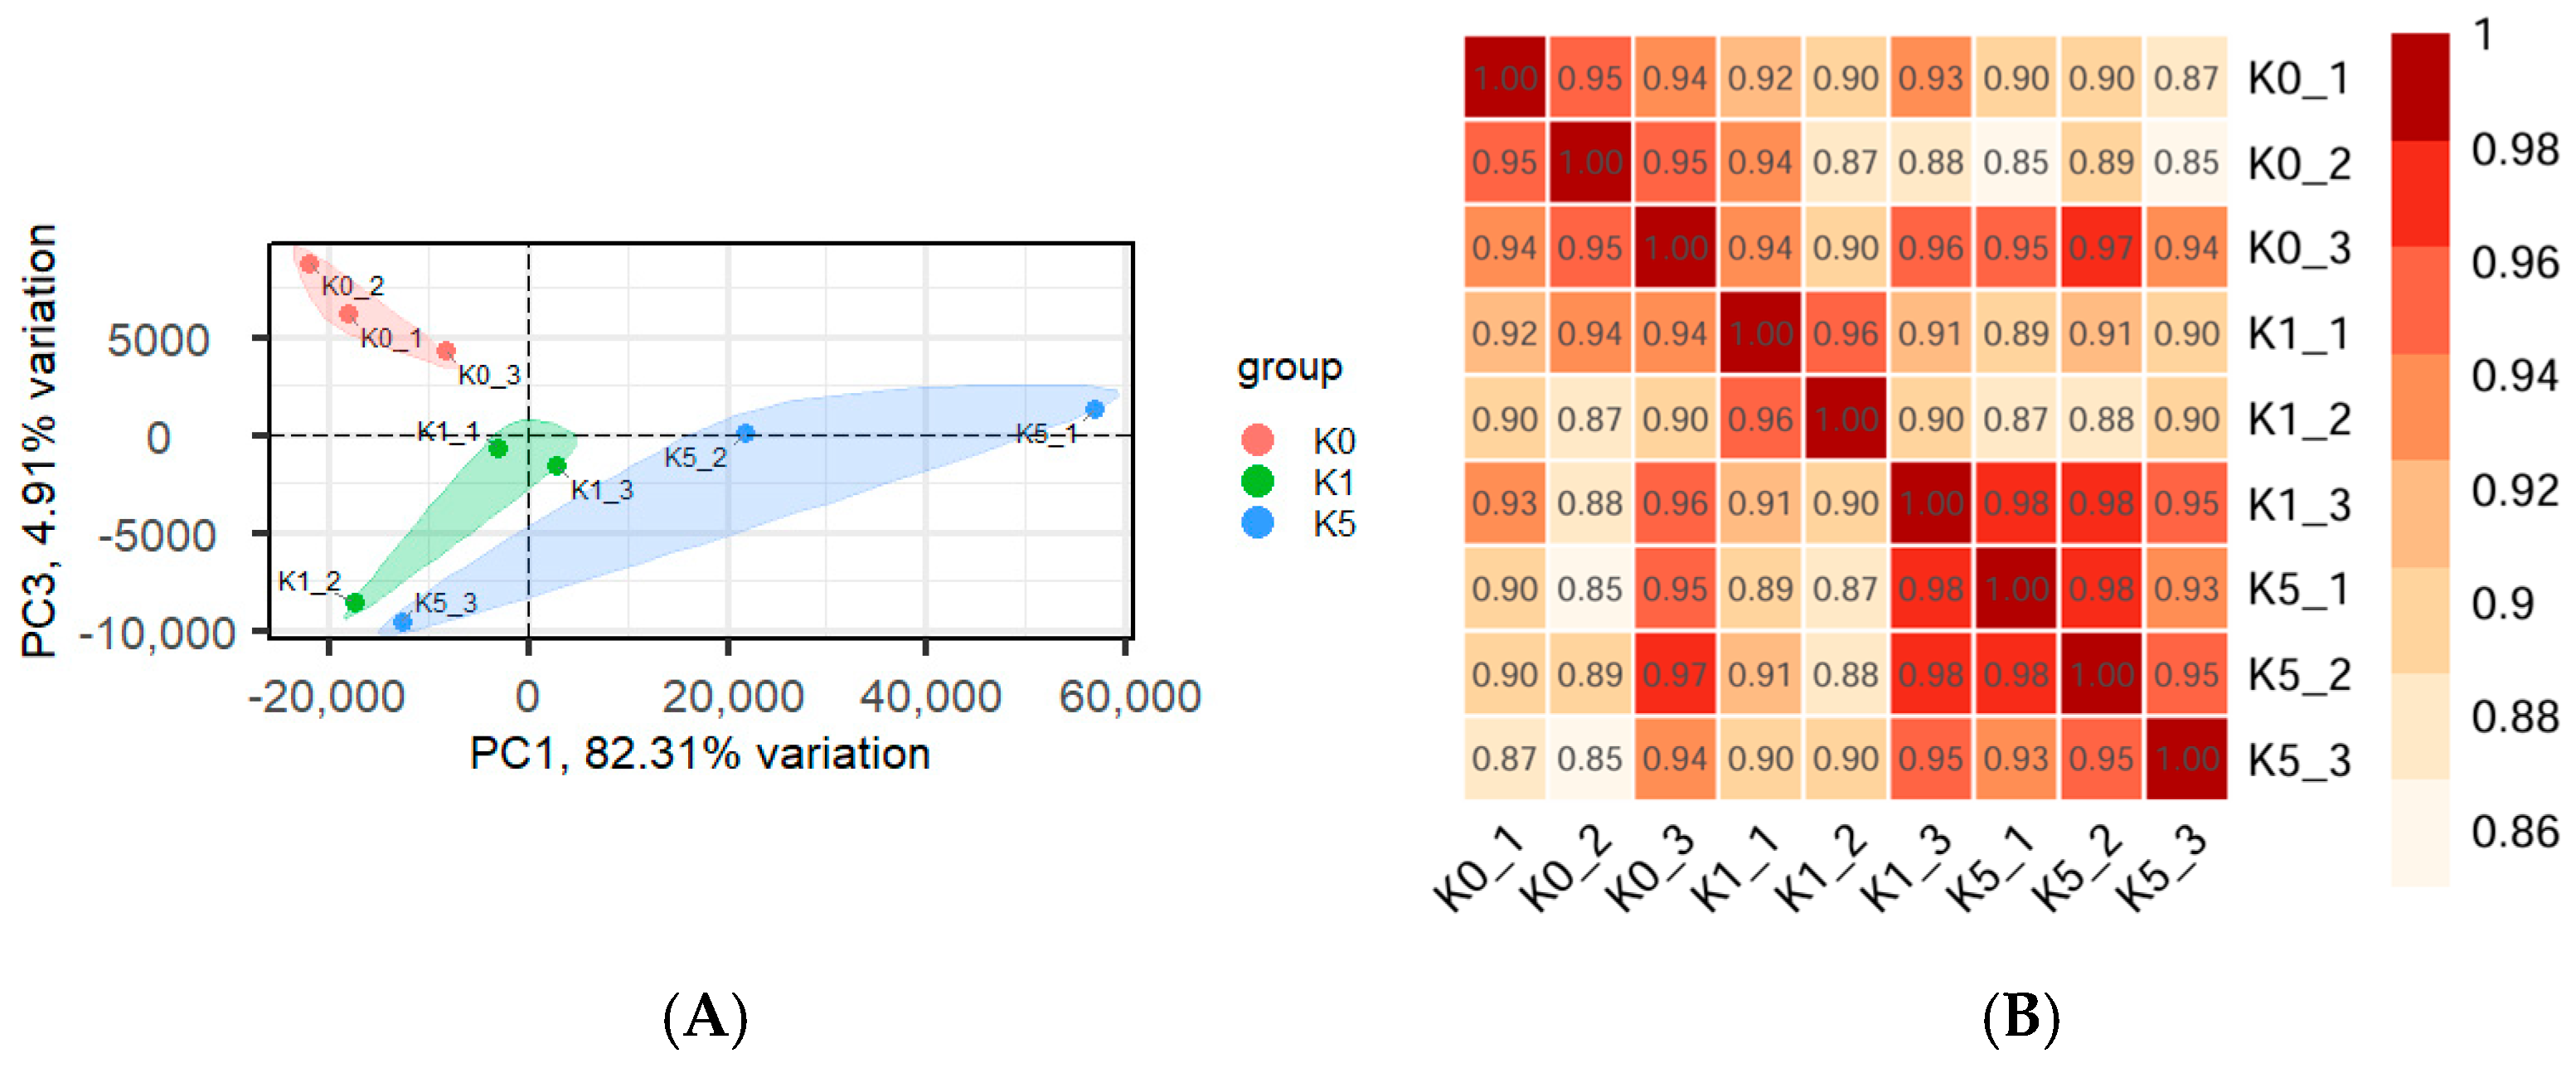
High-throughput sequencing of kidney tissues produced approximately 407 million clean reads. The mapping rates for all the kidney samples exceeded 86.20%, with the Q30 values ranging from 93.40% to 95.55%, and the GC content ranging from 42.98% to 45.26% (Table 1). The principal component analysis (PCA) (Figure 4A) alongside Pearson’s correlation analysis (Figure 4B) demonstrated distinct clustering of control and infected samples, reflecting substantial transcriptomic alterations following co-infection with A. hydrophila and A. veronii. In addition, the high correlation coefficients among the biological replicates reflected good experimental reproducibility and sample consistency.

3.5. DEGs and Enrichment Analysis

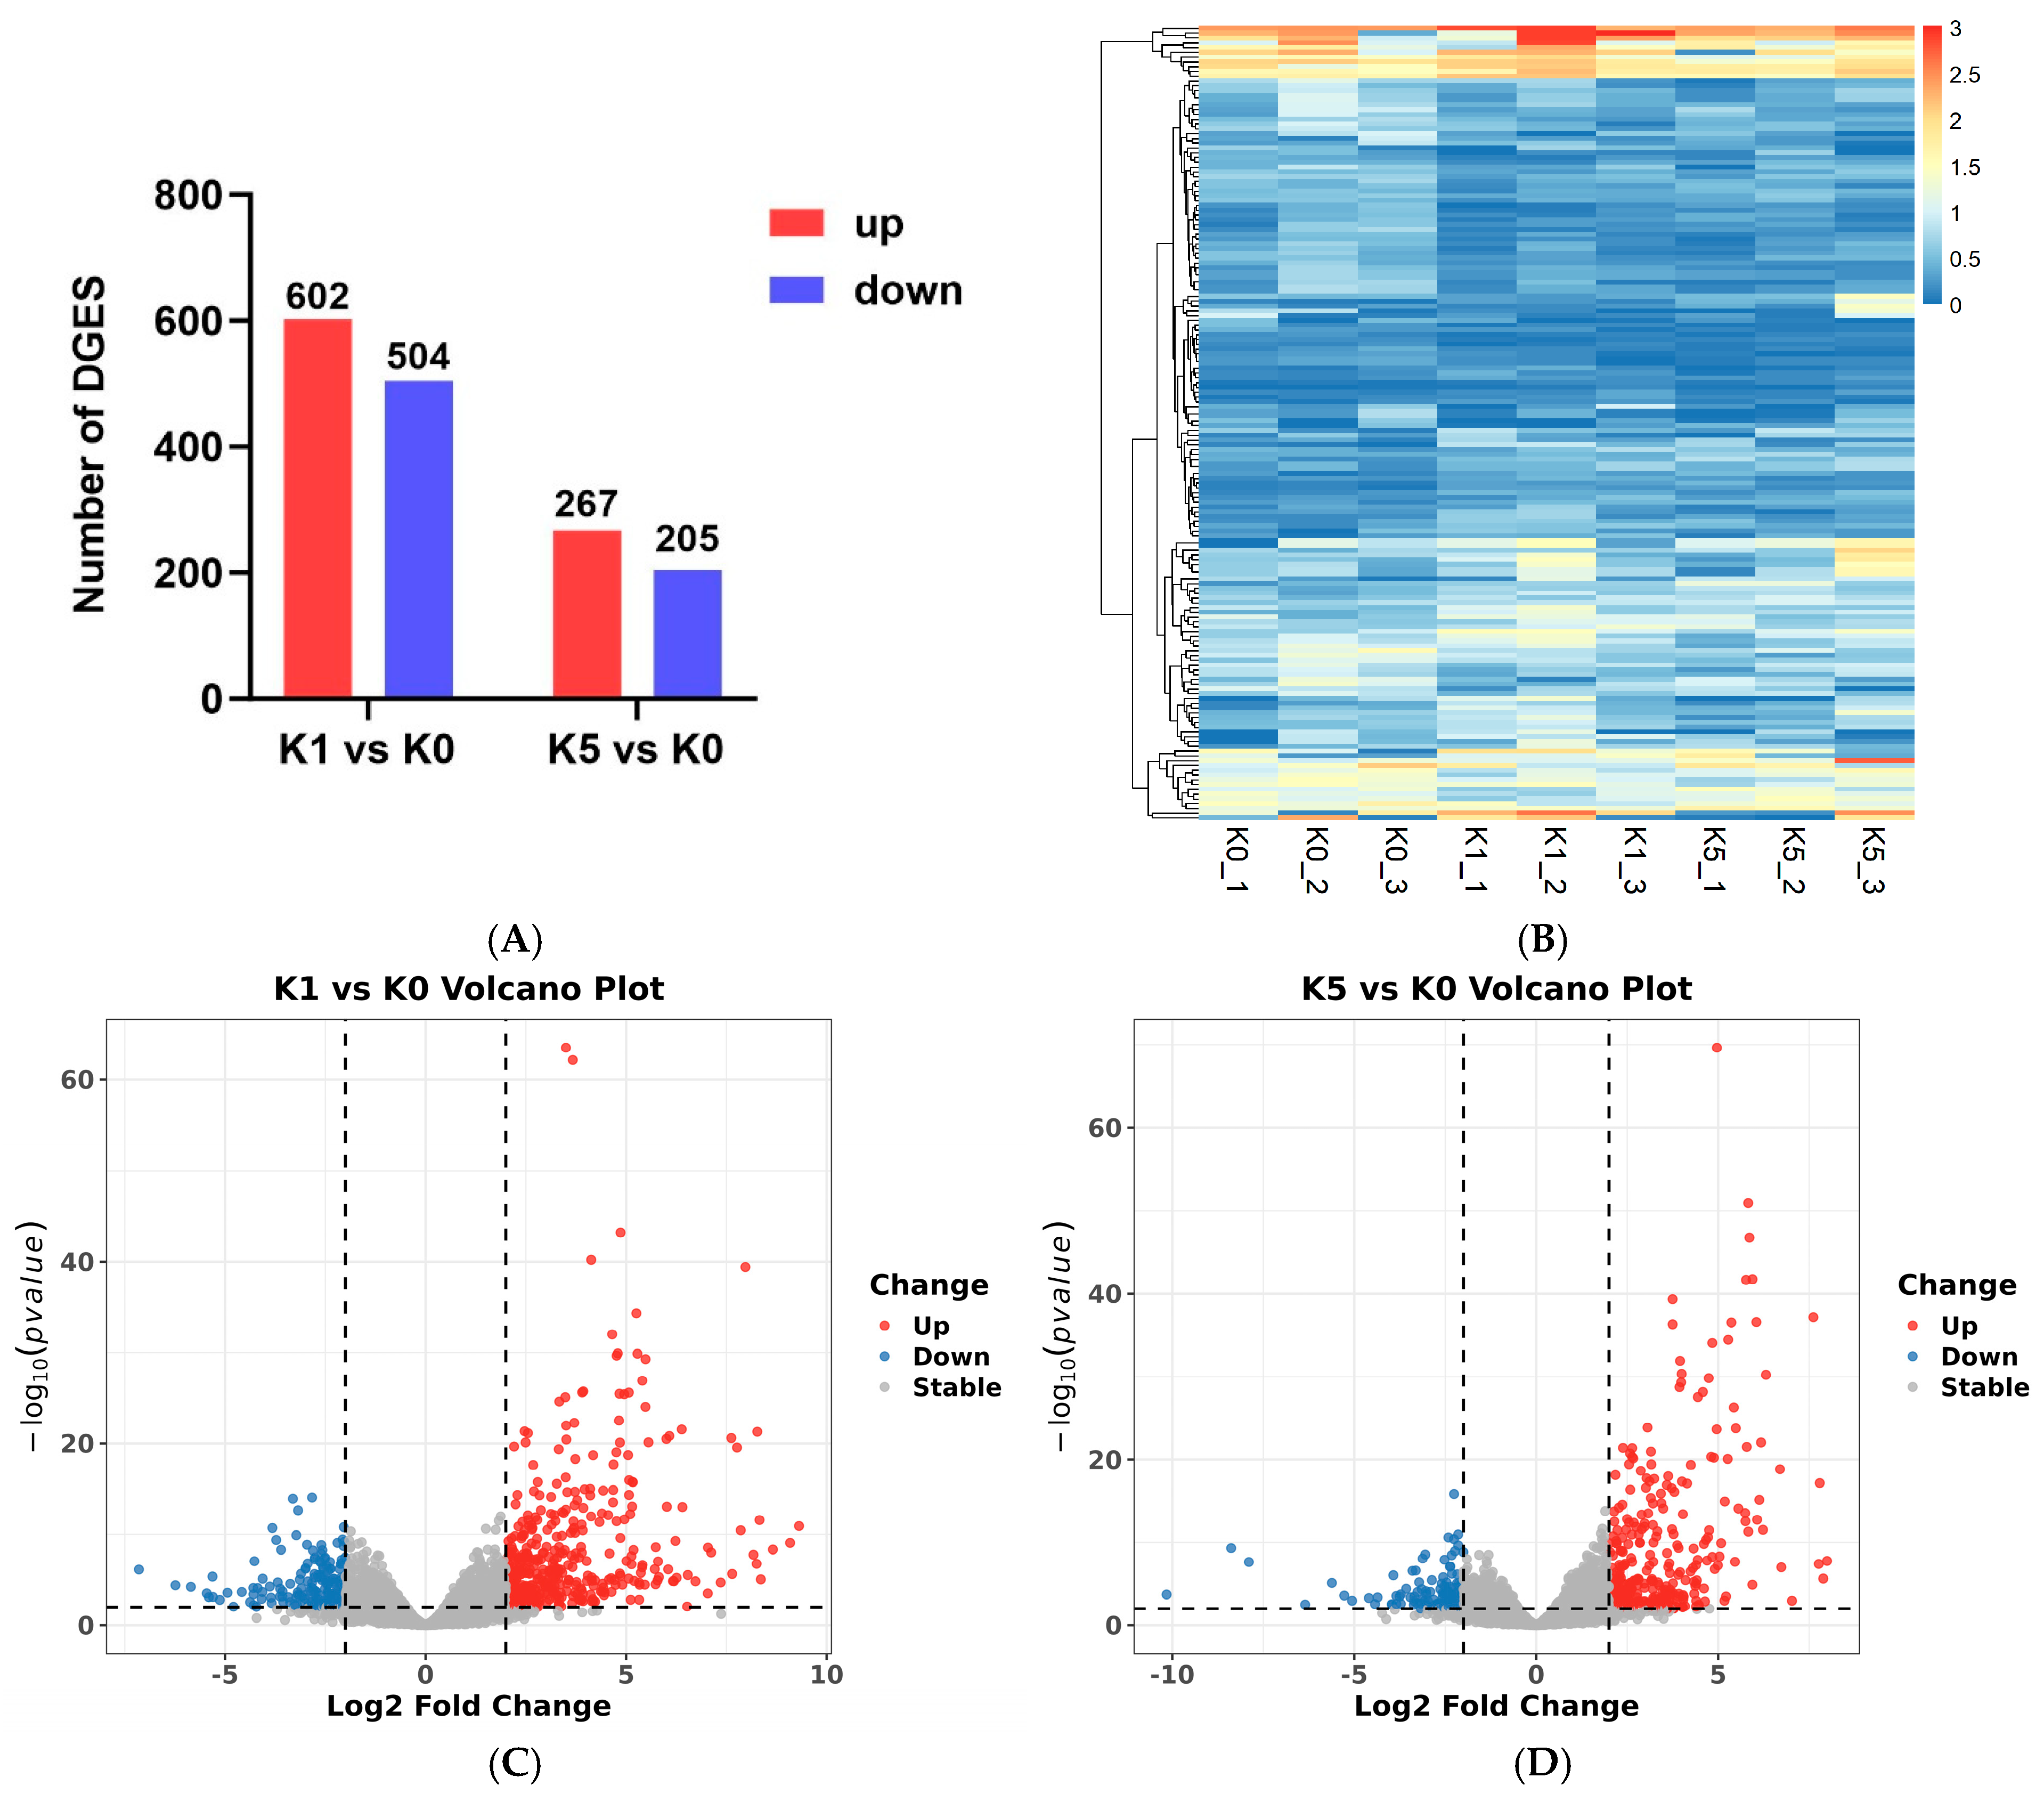
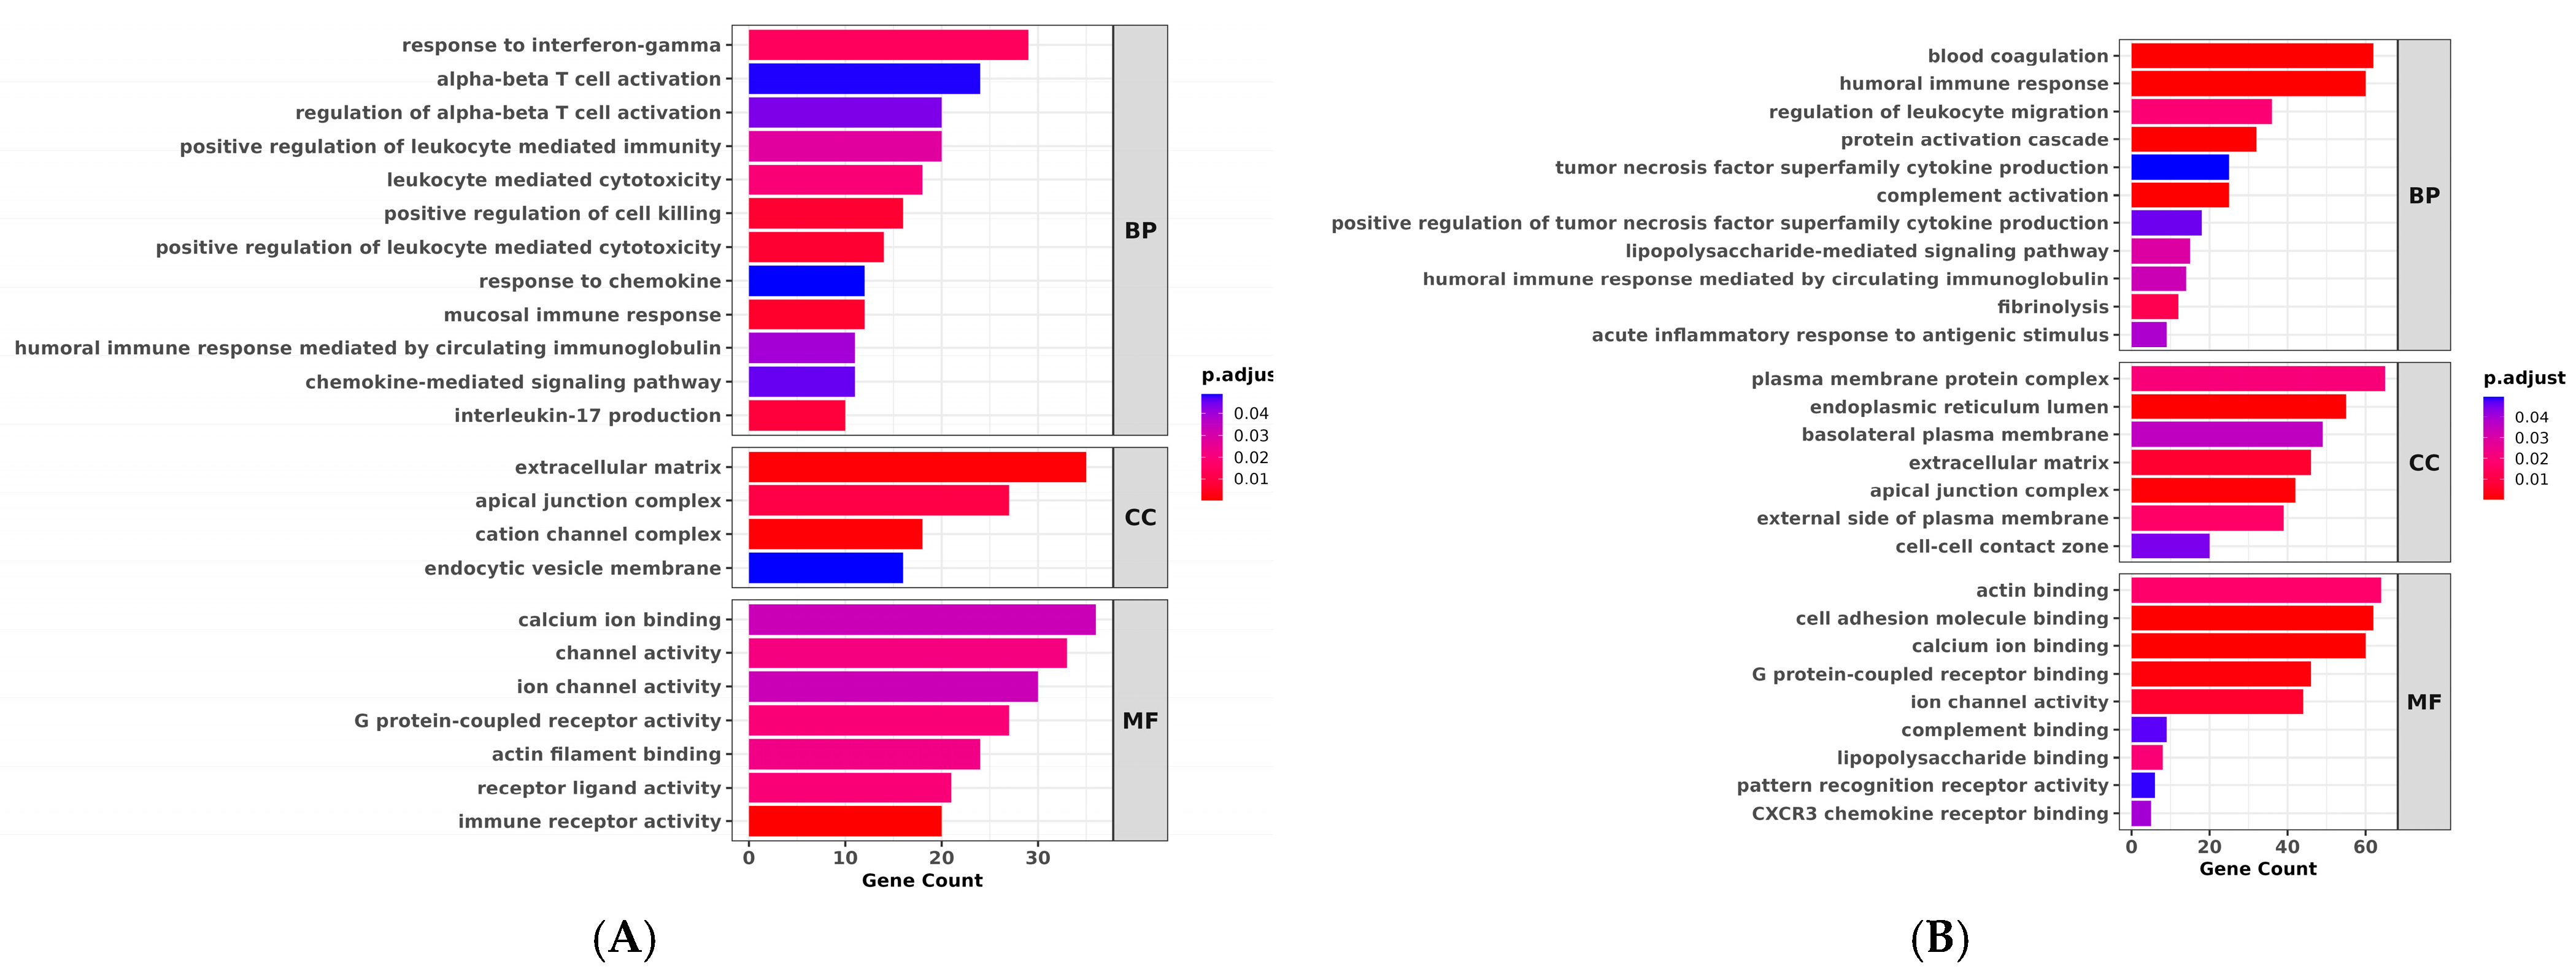
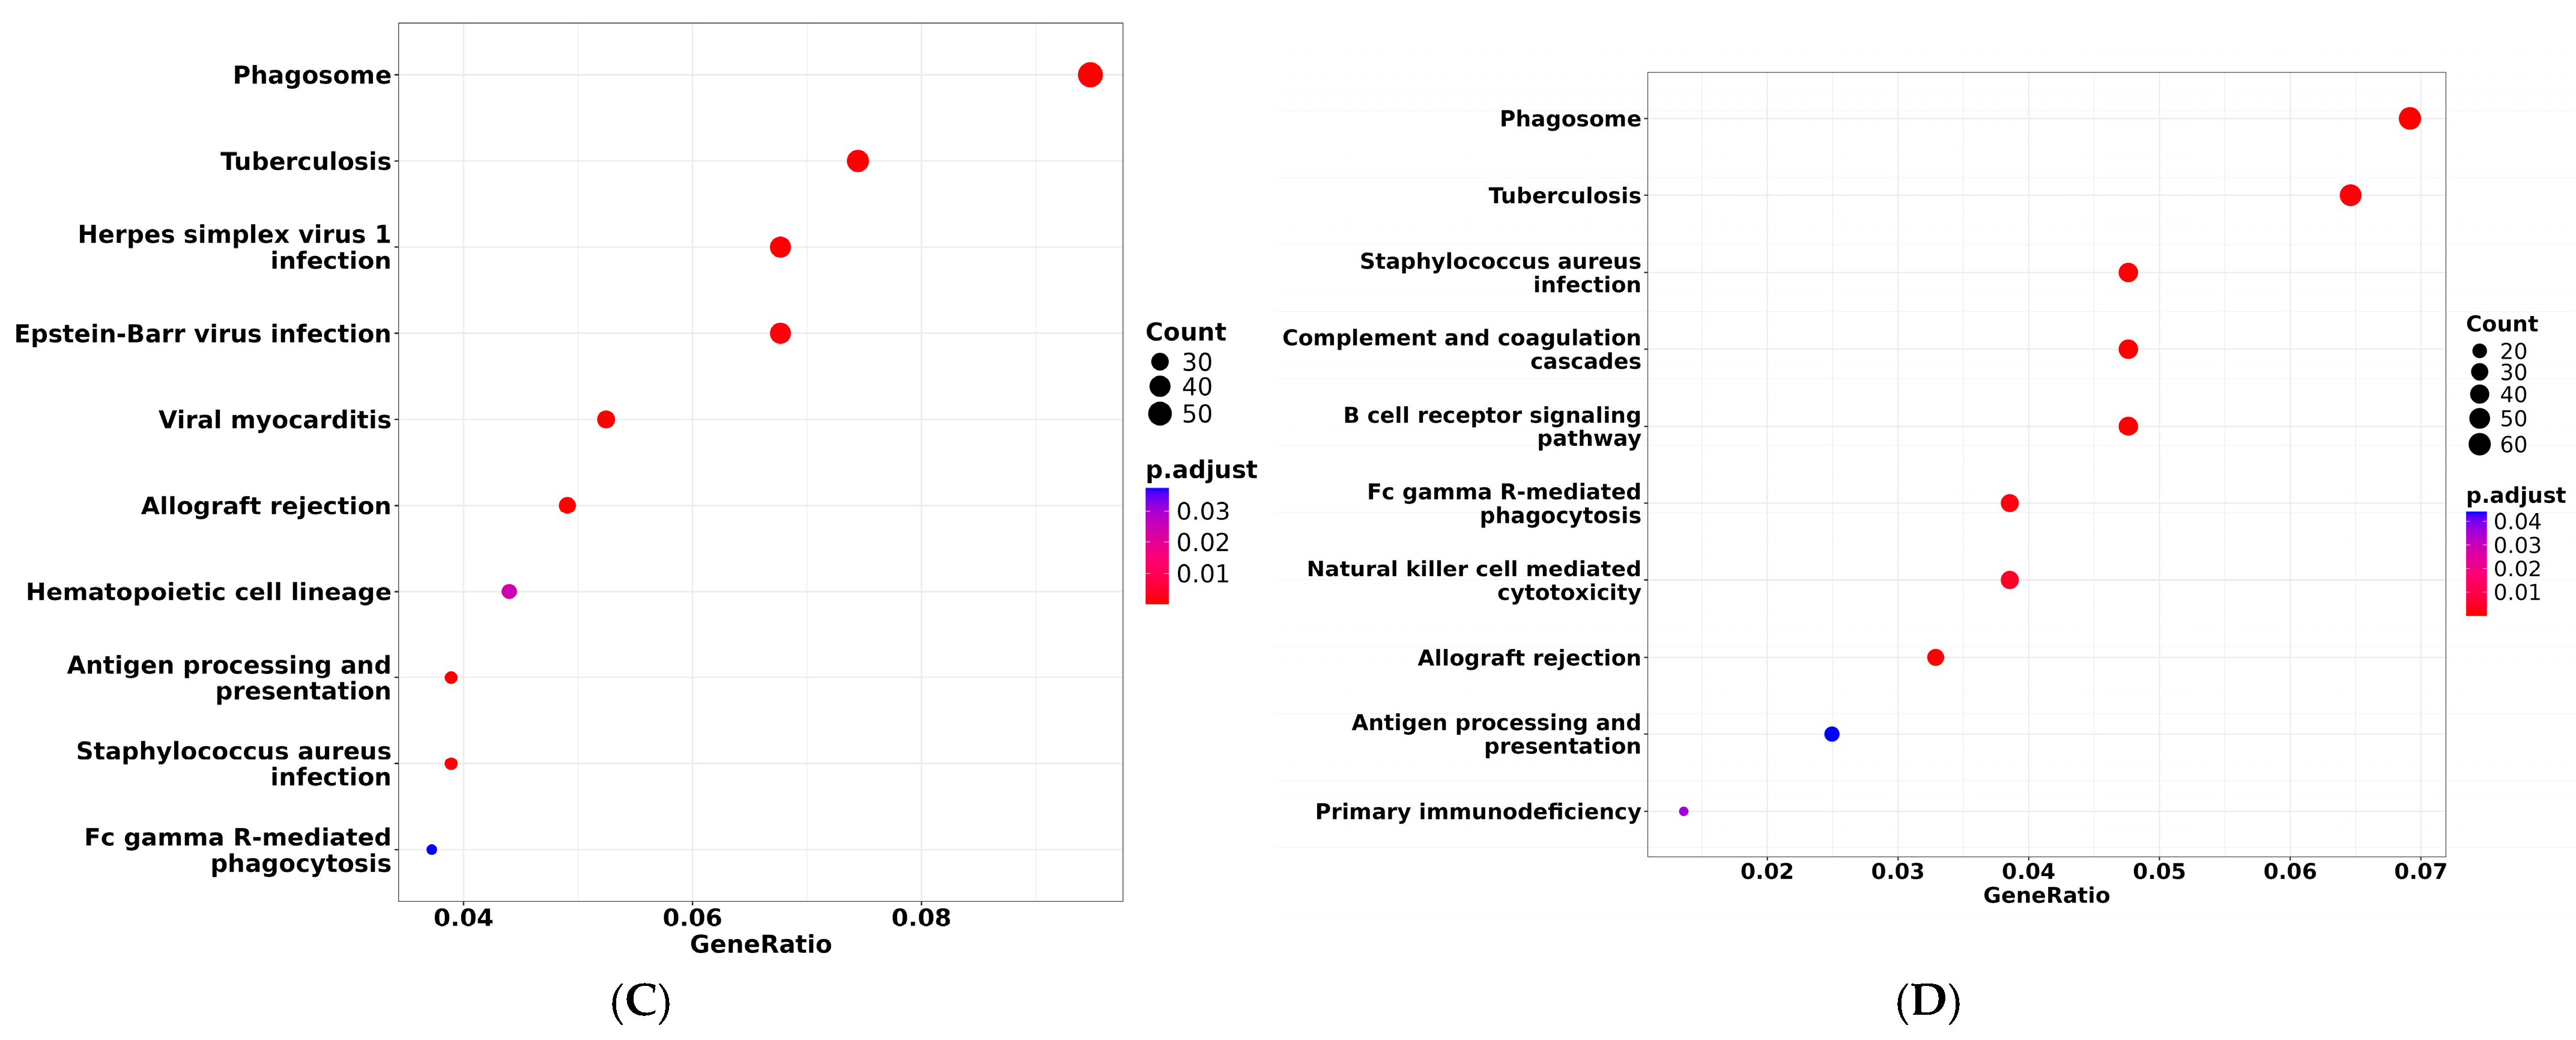
Transcriptomic analysis of kidney tissues from the grass carp revealed significant, time-dependent dynamic changes in gene expression following bacterial co-infection. A total of 1106 genes showed differential expression at 1 dpi, with 602 upregulated and 504 downregulated. By 5 dpi, the number of DEGs decreased to 472, comprising 267 upregulated and 205 downregulated genes (Figure 5A), as illustrated by the volcano plots (Figure 5C,D). The hierarchical clustering analysis demonstrated a clear distinction between the infected and control samples (Figure 5B). At 1 dpi, the Gene Ontology (GO) enrichment analysis identified significant terms associated with mucosal immunity; leukocyte-mediated cytotoxicity; chemokine signaling; and epithelial barrier components, including cation channel and apical junction complexes (Figure 6A). The Kyoto Encyclopedia of Genes and Genomes (KEGG) pathway analysis showed enrichment in phagosome; Fc gamma receptor-mediated phagocytosis; antigen processing and presentation; and infection-related pathways, such as Staphylococcus aureus infection and tuberculosis (Figure 6C). By 5 dpi, the enriched GO terms had shifted towards complement activation, humoral immune response, cytokine production, and cell adhesion (Figure 6B). The KEGG pathways predominantly involved complement and coagulation cascades, natural killer cell-mediated cytotoxicity, B cell receptor signaling, and tumor necrosis factor (TNF) signaling pathways (Figure 6D). These findings indicate that the kidneys mounted an early innate immune and epithelial barrier response at 1 dpi, which subsequently transitioned to complement activation and adaptive immunity by 5 dpi following bacterial co-infection.

3.6. Protein–Protein Interaction Networks

The differentially expressed genes enriched in coagulation and complement cascade pathways were identified in the kidneys by a KEGG analysis following bacterial co-infection (Table 2). A protein–protein interaction (PPI) analysis of these pathway-associated genes revealed extensive interconnections between the coagulation-related proteins (F2, F10, F7, F9a, PLG, FGA, FGB, and FGG) and the complement components (C5, C8A, C8B, C8G, C9, CFI, and SERPINC1). Regulatory serpins (SERPIND1, SERPINF2A, and SERPINC1) were located at critical nodes linking both systems. Extensive crosstalk between the coagulation and complement pathways was revealed through a protein–protein interaction analysis during bacterial co-infection, suggesting that the renal tissue mounts a coordinated immune and vascular response under infectious stress (Figure 7).

4. Discussion

Bacterial co-infections complicate host–pathogen interactions in aquaculture, with the outcomes ranging from antagonistic to cooperative effects [29,30]; the latter often exacerbates disease severity. These consequences encompass exacerbated clinical manifestations, a rise in mortality, shifts in the host’s susceptibility profile, and sustained infection durations [29]. However, the molecular and immunological bases of these interactions remain insufficiently understood. This study examined the dual infection of grass carp by A. hydrophila and A. veronii, with particular emphasis on the kidneys, a key organ for both pathogen accumulation and immune responses [31,32]. The peak bacterial burden was observed at 3 dpi, aligning with a cumulative mortality of 55%, in agreement with the patterns previously described by Sarkar et al. [33]. The enhanced virulence of bacterial co-infection is well-documented across diverse fish species [11]. For example, significantly increased mortality was reported in zebrafish co-infected with multidrug-resistant A. hydrophila and A. veronii, in comparison to those infected with a single pathogen, as noted by Chandrarathna et al. [13]. Similarly, in Oncorhynchus mykiss, co-infection with P. fluorescens and Y. ruckeri resulted in a cumulative mortality of 80%, markedly exceeding that observed in mono-infections (40% for P. fluorescens and 60% for Y. ruckeri) [17]. These comparative analyses substantiate the synergistic pathogenesis in bacterial co-infection scenarios, necessitating a mechanistic interrogation of both the host’s immune modulation and the inter-pathogen crosstalk within aquaculture systems.
This study emphasizes the crucial role of the adaptive immune response in grass carp during co-infection with A. hydrophila and A. veronii, by uncovering the molecular mechanisms that contribute to the host’s defense against invading pathogens. The interactions between pathogens have the potential to modify the bacterial load dynamics and exacerbate tissue damage in the host. To gain deeper insight into the pathological effects of bacterial co-infection, infected kidney tissues were subjected to a detailed histopathological analysis. A. hydrophila mono-infection induces a spectrum of renal pathologies in grass carp, including necrosis, cloudy swelling, cellular hypertrophy, and granular cytoplasmic accumulation [34]. In Nile tilapia, this pathogen has also been associated with tubular damage, mononuclear cell infiltration in the interstitium, and hemosiderin accumulation [35]. In the present study, simultaneous infection with A. hydrophila and A. veronii led to gradually worsening kidney injury, characterized by disruption of tubular architecture, interstitial swelling, widespread tissue necrosis, and detachment of epithelial cells. These histopathological alterations were primarily driven by a strong renal inflammatory response, during which the infiltrating immune cells released a spectrum of cytokines and cytotoxic mediators, ultimately promoting epithelial cell degeneration and death. As the disease progressed, structural disruption of renal tubules and worsening edema culminated in functional impairment. While signs of tissue repair were observed in some areas during the later stages of infection, residual lesions remained, suggesting an ongoing balance between inflammation and repair. It is worth noting that, despite sharing histopathological features, like tubular collapse, edema, and epithelial necrosis, with A. hydrophila mono-infections [34], the co-infected fish suffered from a notably heightened severity and accelerated progression of kidney injury.
In order to uncover the molecular mechanisms driving host immune responses under bacterial co-infection, we conducted transcriptomic analysis of grass carp kidney samples. Enrichment analysis of DEGs revealed a predominant association with the complement and coagulation cascade pathways, suggesting a concerted activation of innate immunity [36] alongside vascular defense responses [37]. Key components of the classical complement pathway [38], including C5, C8A, C8B, C8G, and C9 [38,39,40,41,42,43,44,45], were significantly upregulated, highlighting their central role in membrane attack complex (MAC) [46] assembly and subsequent pathogen lysis and inflammation activation. Concurrently, several coagulation-related genes, such as F2 (thrombin), F10, F7, and F9 [47], also exhibited increased expression, reflecting the active involvement of coagulation processes in response to infection. The upregulation of the three fibrinogen subunits—FGA, FGB, and FGG—may have facilitated fibrin deposition and contributed to the stabilization of the inflammatory microenvironment [48]. Elevated expression of PLG (plasminogen) suggests its dual role in fibrinolysis and tissue repair processes [49]. Notably, at the intersection of the complement and coagulation systems, KNG1 (kininogen 1) and serine protease inhibitors SERPINC1, SERPIND1, and SERPINF2 emerged as potential regulators, modulating protease cascades to maintain a balance between pro-inflammatory and anti-inflammatory responses, thereby preventing excessive inflammation and tissue damage [50,51]. Additionally, the increased expression of CFI (complement factor I), a negative regulator of complement activation, likely functioned to inhibit the activities of C3b and C4b, thus restraining overactivation of the complement system [52]. These findings suggest a complex interplay between the complement and coagulation cascades, reflecting a finely tuned vascular–immune defense mechanism in the kidneys during bacterial co-infection that not only enhances pathogen clearance but also maintains tissue homeostasis.
Although the bacterial loads were quantified on LB agar supplemented with ampicillin, differentiation between A. hydrophila and A. veronii at the species level was not performed, nor was histological evidence of bacterial colonization using specific staining provided. A limitation of the present study is that species-level quantification of A. hydrophila versus A. veronii was not performed. Such data would further clarify the relative contribution of each bacterium to the observed host responses and will be considered in future investigations. These limitations may restrict the precise attribution of pathological changes to each bacterium. Nonetheless, the total bacterial burden and associated histopathological alterations still offer valuable insights into the effects of co-infection on kidney pathology and host immune responses. Future studies will apply selective media, molecular assays (e.g., qPCR targeting species-specific genes), or specialized staining techniques (e.g., Gram staining, FISH) to distinguish and visualize each pathogen, thereby enabling a more accurate delineation of their respective contributions during co-infection.

5. Conclusions

This study demonstrated that co-infection with A. hydrophila and A. veronii induces significant renal tissue damage in grass carp, characterized by tubular collapse, edema, extensive epithelial cell necrosis, and exfoliation. Analyses of Gene Ontology and KEGG pathways revealed that bacterial co-infection elicits robust immune responses and activates the pathways linked to vascular function, with particular emphasis on the complement cascade and coagulation signaling. These findings suggest that a host may rely on rapidly amplifying innate immune mechanisms to defend against dual bacterial infections. Overall, the results clarify the renal immune regulatory mechanisms of grass carp under bacterial co-infection and provide potential molecular targets and valuable references for the prevention and control of bacterial diseases in aquaculture.

Author Contributions

Y.Z.: Conceptualization, Formal analysis, Writing—original draft, Writing—review and editing, and Investigation. R.Z.: Data curation, Resources, and Investigation. L.X.: Data curation, Resources, and Investigation. W.L.: Data curation and Investigation. X.W.: Data curation and Methodology. M.W.: Data curation, Resources, and Investigation. X.X.: Data curation, Resources, and Investigation. J.Q.: Conceptualization, Funding acquisition, Writing—review and editing, Methodology, and Supervision. All authors have read and agreed to the published version of the manuscript.

Funding

This work was funded by the National Key R&D Program of China under the “Agricultural Biological Breeding-2030” Major Project (Grant No. 2023ZD04065). The authors confirm that all funding information is accurate.

Institutional Review Board Statement

All the procedures involving animals were reviewed and approved by the Animal Ethics Committee of Shanghai Ocean University (Approval No. SIOU-DW-2024-071; Date of Approval: 1 March 2024).

Informed Consent Statement

Not applicable.

Data Availability Statement

The raw data supporting the conclusions of this paper will be provided by the corresponding author upon reasonable request.

Conflicts of Interest

The authors declare that they have no known competing financial interests or personal relationships that could have appeared to influence the work reported in this paper.

References

  1. Liu, X.-G.; Shen, H.-Y.; Gu, Z.-j.; Cheng, G.; Wang, J.; Zhu, H. The Environmental Impact and Development Direction of Grass Carp, Ctenopharyngodon Idella, Aquaculture. J. World Aquac. Soc. 2023, 54, 1354–1366. [Google Scholar] [CrossRef]
  2. Xie, C.; Li, J.; Li, D.; Shen, Y.; Gao, Y.; Zhang, Z. Grass Carp: The Fish That Feeds Half of China. In Aquaculture in China; John Wiley & Sons, Ltd.: Hoboken, NJ, USA, 2018; pp. 93–115. ISBN 978-1-119-12075-9. [Google Scholar]
  3. Siamudaala, V.; Basiita, R.K.; Hang’ombe, B.M.; Delamare-Deboutteville, J.; Kakwasha, K.; Chimatiro, S.K.; Yabe, J.; Ndashe, K.; Chadag, M.V.; Siamudaala, V. Emerging and Re-Emerging Fish Diseases and Pathogens in an Environment of the Expanding Aquaculture in Zambia. Preprints 2025, 2025040354. [Google Scholar] [CrossRef]
  4. Dayana Senthamarai, M.; Rajan, M.R.; Bharathi, P.V. Current Risks of Microbial Infections in Fish and Their Prevention Methods: A Review. Microb. Pathog. 2023, 185, 106400. [Google Scholar] [CrossRef] [PubMed]
  5. Xu, T.; Rasmussen-Ivey, C.R.; Moen, F.S.; Fernández-Bravo, A.; Lamy, B.; Beaz-Hidalgo, R.; Khan, C.D.; Castro Escarpulli, G.; Yasin, I.S.M.; Figueras, M.J.; et al. A Global Survey of Hypervirulent Aeromonas Hydrophila (vAh) Identified vAh Strains in the Lower Mekong River Basin and Diverse Opportunistic Pathogens from Farmed Fish and Other Environmental Sources. Microbiol. Spectr. 2023, 11, e03705–e03722. [Google Scholar] [CrossRef]
  6. Behera, B.K.; Parida, S.N.; Kumar, V.; Swain, H.S.; Parida, P.K.; Bisai, K.; Dhar, S.; Das, B.K. Aeromonas Veronii Is a Lethal Pathogen Isolated from Gut of Infected Labeo Rohita: Molecular Insight to Understand the Bacterial Virulence and Its Induced Host Immunity. Pathogens 2023, 12, 598. [Google Scholar] [CrossRef]
  7. Tyagi, A.; Sharma, C.; Srivastava, A.; Naveen Kumar, B.T.; Pathak, D.; Rai, S. Isolation, Characterization and Complete Genome Sequencing of Fish Pathogenic Aeromonas veronii from Diseased Labeo rohita. Aquaculture 2022, 553, 738085. [Google Scholar] [CrossRef]
  8. Nhinh, D.T.; Le, D.V.; Van, K.V.; Huong Giang, N.T.; Dang, L.T.; Hoai, T.D. Prevalence, Virulence Gene Distribution and Alarming the Multidrug Resistance of Aeromonas Hydrophila Associated with Disease Outbreaks in Freshwater Aquaculture. Antibiotics 2021, 10, 532. [Google Scholar] [CrossRef]
  9. Liu, W.; Li, M.; Xue, M.; Zhou, Y.; Jiang, N.; Meng, Y.; Liu, Y.; Jiang, J.; Liao, X.; Fan, Y. Identification of Aeromonas Veronii as the Pathogen Associated with Massive Mortality in Bronze Gudgeon (Coreius heterodon). Animals 2024, 14, 2440. [Google Scholar] [CrossRef]
  10. Abdella, B.; Shokrak, N.M.; Abozahra, N.A.; Elshamy, Y.M.; Kadira, H.I.; Mohamed, R.A. Aquaculture and Aeromonas Hydrophila: A Complex Interplay of Environmental Factors and Virulence. Aquacult Int. 2024, 32, 7671–7681. [Google Scholar] [CrossRef]
  11. Okon, E.M.; Okocha, R.C.; Taiwo, A.B.; Michael, F.B.; Bolanle, A.M. Dynamics of Co-Infection in Fish: A Review of Pathogen-Host Interaction and Clinical Outcome. Fish Shellfish Immunol. Rep. 2023, 4, 100096. [Google Scholar] [CrossRef] [PubMed]
  12. Kotob, M.H.; Gorgoglione, B.; Kumar, G.; Abdelzaher, M.; Saleh, M.; El-Matbouli, M. The impact of Tetracapsuloides bryosalmonae and Myxobolus cerebralis co-infections on pathology in rainbow trout. Parasites Vectors 2017, 10, 442. [Google Scholar] [CrossRef]
  13. Chandrarathna, H.P.S.U.; Nikapitiya, C.; Dananjaya, S.H.S.; Wijerathne, C.U.B.; Wimalasena, S.H.M.P.; Kwun, H.J.; Heo, G.-J.; Lee, J.; De Zoysa, M. Outcome of Co-Infection with Opportunistic and Multidrug Resistant Aeromonas hydrophila and A. Veronii in Zebrafish: Identification, Characterization, Pathogenicity and Immune Responses. Fish Shellfish Immunol. 2018, 80, 573–581. [Google Scholar] [CrossRef]
  14. Erfanmanesh, A.; Beikzadeh, B.; Mohseni, F.A.; Nikaein, D.; Mohajerfar, T. Ulcerative Dermatitis in Barramundi Due to Coinfection with Streptococcus Iniae and Shewanella Algae. Dis. Aquat. Org. 2019, 134, 89–97. [Google Scholar] [CrossRef]
  15. Long, A.; Garver, K.A.; Jones, S.R.M. Synergistic Osmoregulatory Dysfunction during Salmon Lice (Lepeophtheirus salmonis) and Infectious Hematopoietic Necrosis Virus Co-Infection in Sockeye Salmon (Oncorhynchus nerka) Smolts. J. Fish Dis. 2019, 42, 869–882. [Google Scholar] [CrossRef] [PubMed]
  16. Crumlish, M.; Thanh, P.C.; Koesling, J.; Tung, V.T.; Gravningen, K. Experimental Challenge Studies in Vietnamese Catfish, Pangasianodon hypophthalmus (Sauvage), Exposed to Edwardsiella ictaluri and Aeromonas hydrophila. J. Fish Dis. 2010, 33, 717–722. [Google Scholar] [CrossRef] [PubMed]
  17. Dinçtürk, E.; Tanrıkul, T.T. Yersinia Ruckeri and Pseudomonas Fluorescens Co-Infection in Rainbow Trout (Oncorhynchus Mykiss Walbaum, 1792). Aquac. Res. 2021, 52, 4858–4866. [Google Scholar] [CrossRef]
  18. Liu, Y.; Xu, X.; Li, J. Microbial Load, Serum Enzyme Activity and Histopathological Alterations Induced by Aeromonas Hydrophilain in Experimentally Challenged Grass Carp. 2022. Available online: https://papers.ssrn.com/sol3/papers.cfm?abstract_id=4187626 (accessed on 25 August 2025).
  19. Lv, W.; Zhou, Z.; Xie, L.; Wang, X.; Zhou, Y.; Gui, L.; Xu, X.; Shen, Y.; Li, J.; Qiu, J. Pathological and Molecular Characterization of Grass Carp Co-Infected with Two Aeromonas Species. Animals 2025, 15, 263. [Google Scholar] [CrossRef]
  20. Ayala-Soldado, N.; Mora-Medina, R.; Molina-López, A.M.; Lora-Benítez, A.J.; Moyano-Salvago, R. Evaluation of the Effectiveness of Eugenol and MS-222 as Anesthetics in Zebrafish in Repeated Exposures and Post-Anesthesia Behaviour. Animals 2024, 14, 2418. [Google Scholar] [CrossRef]
  21. Vila, J.; Ruiz, J.; Gallardo, F.; Vargas, M.; Soler, L.; Figueras, M.J.; Gascon, J. Aeromonas Spp. and Traveler’s Diarrhea: Clinical Features and Antimicrobial Resistance. Emerg. Infect. Dis. 2003, 9, 552–555. [Google Scholar] [CrossRef]
  22. Slaoui, M.; Bauchet, A.-L.; Fiette, L. Tissue Sampling and Processing for Histopathology Evaluation. In Drug Safety Evaluation: Methods and Protocols; Gautier, J.-C., Ed.; Springer: New York, NY, 2017; pp. 101–114. ISBN 978-1-4939-7172-5. [Google Scholar]
  23. Chen, S.; Zhou, Y.; Chen, Y.; Gu, J. Fastp: An Ultra-Fast All-in-One FASTQ Preprocessor. Bioinformatics 2018, 34, i884–i890. [Google Scholar] [CrossRef]
  24. Kim, D.; Langmead, B.; Salzberg, S.L. HISAT: A Fast Spliced Aligner with Low Memory Requirements. Nat. Methods 2015, 12, 357–360. [Google Scholar] [CrossRef]
  25. Love, M.I.; Huber, W.; Anders, S. Moderated Estimation of Fold Change and Dispersion for RNA-Seq Data with DESeq2. Genome Biol. 2014, 15, 550. [Google Scholar] [CrossRef] [PubMed]
  26. Wu, T.; Hu, E.; Xu, S.; Chen, M.; Guo, P.; Dai, Z.; Feng, T.; Zhou, L.; Tang, W.; Zhan, L.; et al. clusterProfiler 4.0: A Universal Enrichment Tool for Interpreting Omics Data. Innovation 2021, 2, 100141. [Google Scholar] [CrossRef]
  27. Otasek, D.; Morris, J.H.; Bouças, J.; Pico, A.R.; Demchak, B. Cytoscape Automation: Empowering Workflow-Based Network Analysis. Genome Biol. 2019, 20, 185. [Google Scholar] [CrossRef]
  28. Li, R.; Hao, Y.; Shen, Y.; Gui, L.; Lv, W.; Yuan, L.; Du, B.; Xie, L.; Li, J.; Xu, X. Impact of Cadmium and Diclofenac Exposure on Biochemical Responses, Transcriptome, Gut Microflora, and Growth Performance in Grass Carp (Ctenopharyngodon Idella). Chemosphere 2024, 360, 142428. [Google Scholar] [CrossRef]
  29. Kotob, M.H.; Menanteau-Ledouble, S.; Kumar, G.; Abdelzaher, M.; El-Matbouli, M. The Impact of Co-Infections on Fish: A Review. Vet. Res. 2016, 47, 98. [Google Scholar] [CrossRef] [PubMed]
  30. Gorgoglione, B.; Bailey, C.; Fast, M.D.; Bass, D.; Saraiva, M.; Adamek, M.; Noguera, P.; Ciulli, S.; Palikova, M.; Aguirre-Gil, I.; et al. Co-Infections and Multiple Stressors in Fish. Bull. Eur. Assoc. Fish. Pathol. 2020, 40, 4–19. [Google Scholar]
  31. Banu, A.N.H.; Islam, M.A.; Chowdhury, M.B.R. Bacterial Load in Pond Water and Different Organs of a Indian Major Carp Cirrhinus Mrigala Ham. Bangladesh J. Fish. Res. 2001, 5, 53–58. Available online: http://hdl.handle.net/1834/33169 (accessed on 22 June 2025).
  32. Thornton, L.M.; LeSueur, M.C.; Yost, A.T.; Stephens, D.A.; Oris, J.T.; Sellin Jeffries, M.K. Characterization of Basic Immune Function Parameters in the Fathead Minnow (Pimephales promelas), a Common Model in Environmental Toxicity Testing. Fish Shellfish Immunol. 2017, 61, 163–172. [Google Scholar] [CrossRef]
  33. Sarkar, M.J.A.; Rashid, M.M. Pathogenicity of the Bacterial Isolate Aeromonas Hydrophila to Catfishes, Carps and Perch. J. Bangladesh Agric. Univ. 2012, 10, 157–161. [Google Scholar] [CrossRef]
  34. Shi, F.; Lu, Z.; Yang, M.; Li, F.; Zhan, F.; Zhao, L.; Li, Y.; Li, Q.; Li, J.; Li, J.; et al. Astragalus Polysaccharides Mediate the Immune Response and Intestinal Microbiota in Grass Carp (Ctenopharyngodon idellus). Aquaculture 2021, 534, 736205. [Google Scholar] [CrossRef]
  35. Hal, A.M.; El-Barbary, M.I. Gene Expression and Histopathological Changes of Nile Tilapia (Oreochromis niloticus) Infected with Aeromonas hydrophila and Pseudomonas fluorescens. Aquaculture 2020, 526, 735392. [Google Scholar] [CrossRef]
  36. Perico, L.; Benigni, A.; Casiraghi, F.; Ng, L.F.P.; Renia, L.; Remuzzi, G. Immunity, Endothelial Injury and Complement-Induced Coagulopathy in COVID-19. Nat. Rev. Nephrol. 2021, 17, 46–64. [Google Scholar] [CrossRef]
  37. Satyam, A.; Graef, E.R.; Lapchak, P.H.; Tsokos, M.G.; Dalle Lucca, J.J.; Tsokos, G.C. Complement and Coagulation Cascades in Trauma. Acute Med. Surg. 2019, 6, 329–335. [Google Scholar] [CrossRef]
  38. Morgan, B.P. The Complement System:An Overview. In Complement Methods and Protocols; Morgan, B.P., Ed.; Humana Press: Totowa, NJ, USA, 2000; pp. 1–13. ISBN 978-1-59259-056-8. [Google Scholar]
  39. Manthey, H.D.; Woodruff, T.M.; Taylor, S.M.; Monk, P.N. Complement Component 5a (C5a). Int. J. Biochem. Cell Biol. 2009, 41, 2114–2117. [Google Scholar] [CrossRef] [PubMed]
  40. West, E.E.; Kemper, C. Complosome—The Intracellular Complement System. Nat. Rev. Nephrol. 2023, 19, 426–439. [Google Scholar] [CrossRef]
  41. Lasorsa, F.; Rutigliano, M.; Milella, M.; Ferro, M.; Pandolfo, S.D.; Crocetto, F.; Simone, S.; Gesualdo, L.; Battaglia, M.; Ditonno, P.; et al. Complement System and the Kidney: Its Role in Renal Diseases, Kidney Transplantation and Renal Cell Carcinoma. Int. J. Mol. Sci. 2023, 24, 16515. [Google Scholar] [CrossRef]
  42. Nandi, G. The Complement System. In An Interplay of Cellular and Molecular Components of Immunology; CRC Press: Boca Raton, Fl, USA, 2022; ISBN 978-1-003-28642-4. [Google Scholar]
  43. Hoppe, C.; Gregory-Ksander, M. The Role of Complement Dysregulation in Glaucoma. Int. J. Mol. Sci. 2024, 25, 2307. [Google Scholar] [CrossRef] [PubMed]
  44. Mastellos, D.C.; Hajishengallis, G.; Lambris, J.D. A Guide to Complement Biology, Pathology and Therapeutic Opportunity. Nat. Rev. Immunol. 2024, 24, 118–141. [Google Scholar] [CrossRef]
  45. Noris, M.; Galbusera, M. The Complement Alternative Pathway and Hemostasis. Immunol. Rev. 2023, 313, 139–161. [Google Scholar] [CrossRef] [PubMed]
  46. Bayly-Jones, C.; Bubeck, D.; Dunstone, M.A. The Mystery behind Membrane Insertion: A Review of the Complement Membrane Attack Complex. Philos. Trans. R. Soc. B Biol. Sci. 2017, 372, 20160221. [Google Scholar] [CrossRef]
  47. Mackman, N. Role of Tissue Factor in Hemostasis, Thrombosis, and Vascular Development. Arterioscler. Thromb. Vasc. Biol. 2004, 24, 1015–1022. [Google Scholar] [CrossRef] [PubMed]
  48. Wolberg, A.S. Fibrinogen and Fibrin: Synthesis, Structure, and Function in Health and Disease. J. Thromb. Haemost. 2023, 21, 3005–3015. [Google Scholar] [CrossRef] [PubMed]
  49. Keragala, C.B.; Medcalf, R.L. Plasminogen: An Enigmatic Zymogen. Blood 2021, 137, 2881–2889. [Google Scholar] [CrossRef] [PubMed]
  50. Rau, J.C.; Beaulieu, L.M.; Huntington, J.A.; Church, F.C. Serpins in Thrombosis, Hemostasis and Fibrinolysis. J. Thromb. Haemost. 2007, 5, 102–115. [Google Scholar] [CrossRef]
  51. Xu, J.; Fang, J.; Cheng, Z.; Fan, L.; Hu, W.; Zhou, F.; Shen, H. Overexpression of the Kininogen-1 Inhibits Proliferation and Induces Apoptosis of Glioma Cells. J. Exp. Clin. Cancer Res. 2018, 37, 180. [Google Scholar] [CrossRef]
  52. Hallam, T.M.; Sharp, S.J.; Andreadi, A.; Kavanagh, D. Complement Factor I: Regulatory Nexus, Driver of Immunopathology, and Therapeutic. Immunobiology 2023, 228, 152410. [Google Scholar] [CrossRef]
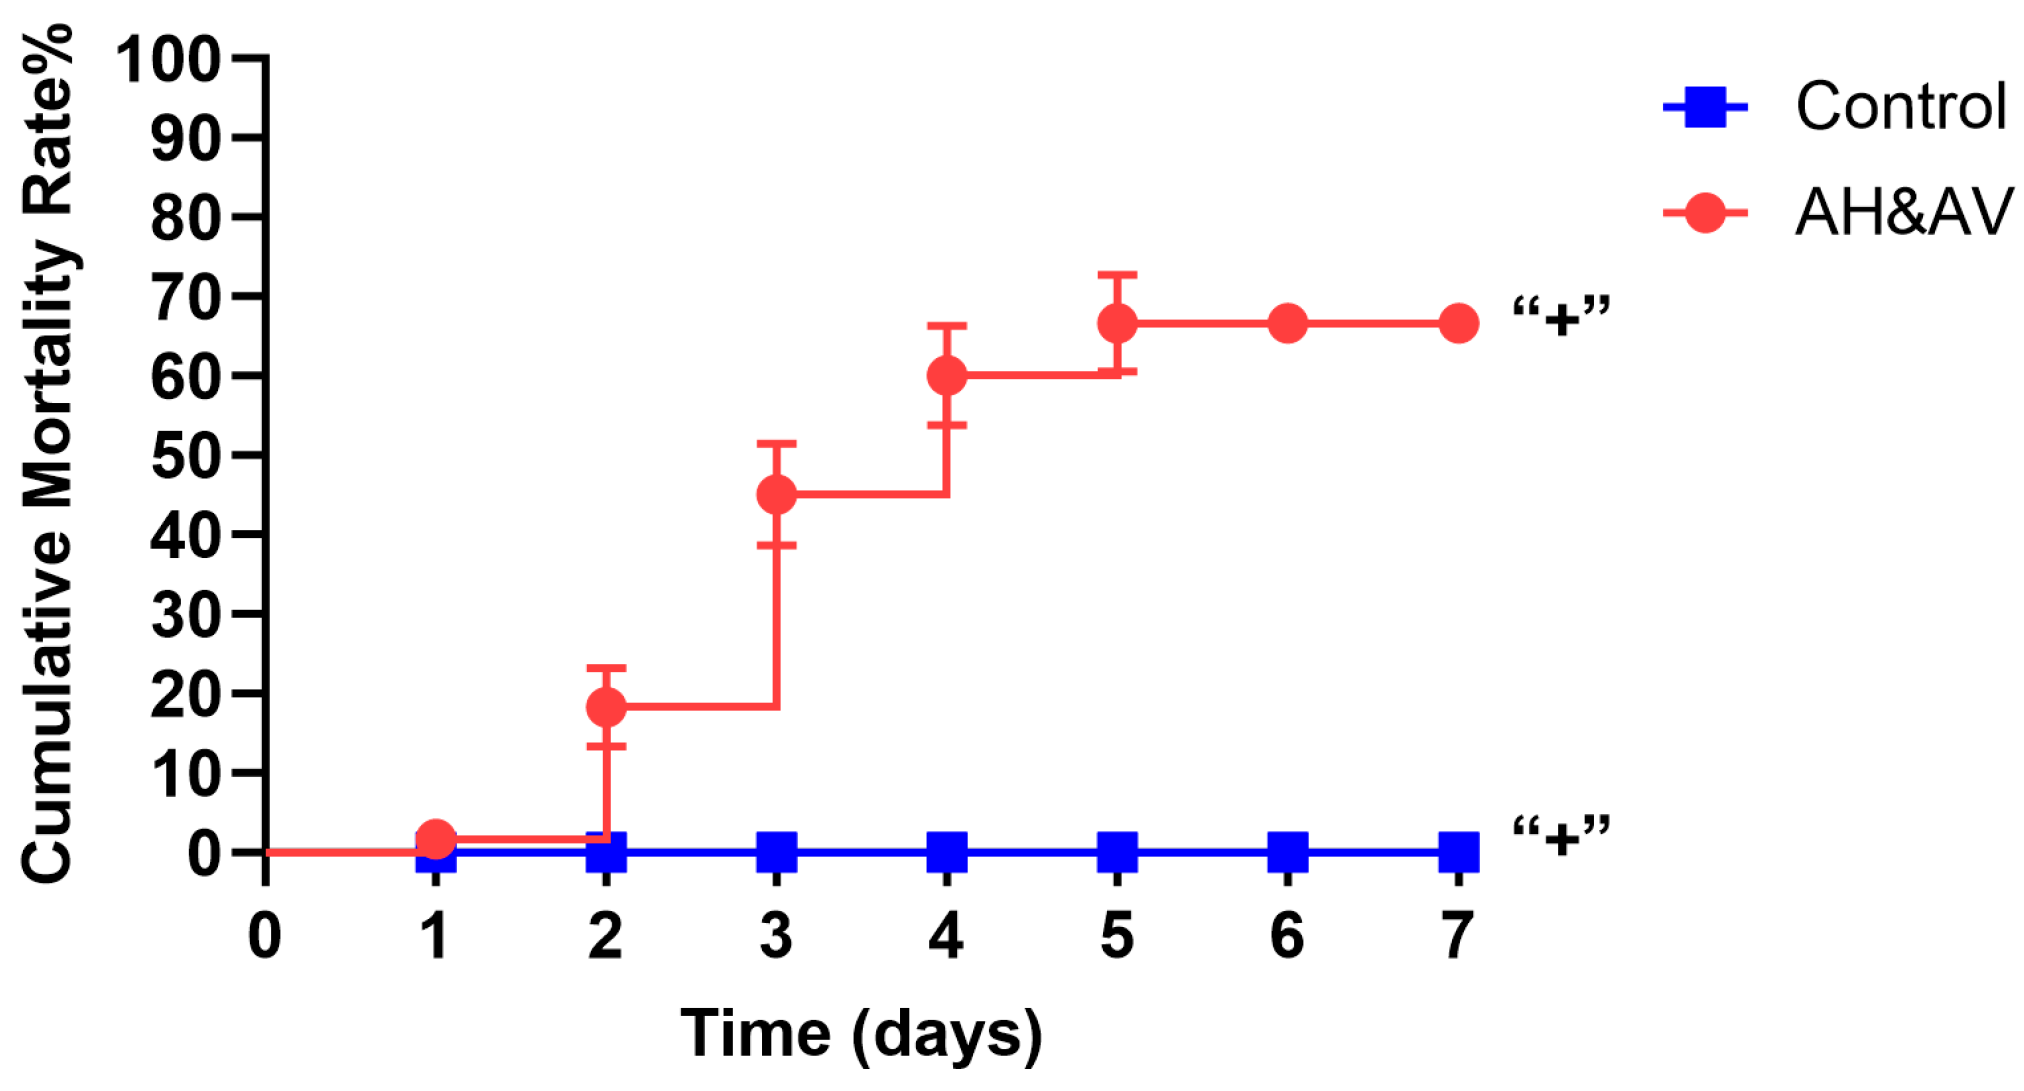
Figure 1. Grass carp mortality post co-infection, presented as mean ± SE (n = 30 fish/group).
Fishes 10 00484 g001
Figure 2. Renal bacterial load in co-infected grass carp. “**” indicates p < 0.01.
Fishes 10 00484 g002
Figure 3. Renal histopathology and semi-quantitative scoring of grass carp during A. hydrophila–A. veronii co-infection. (AE) Representative H&E-stained trunk kidney sections at 0 (control), 1, 3, 5, and 7 dpi, respectively. Annotations: black arrows, tubular epithelial cell swelling; red arrows, inflammatory cell infiltration; yellow arrows, interstitial edema; black circles, focal necrosis; red circles, epithelial cell desquamation. Scale bar = 50 μm (applies to (AE)). (F) Semi-quantitative histopathological scores (0–3 scale) of renal injury at 0 (control), 1, 3, 5, and 7 dpi (n = 3 per time point). Boxes represent interquartile range (IQR) with median lines; whiskers indicate 1.5 × IQR. Statistical significance was assessed by Kruskal–Wallis test with Dunn’s post hoc correction: ns (p ≥ 0.05), ** p < 0.01, **** p < 0.0001.
Fishes 10 00484 g003
Figure 4. Analysis of sample relationships. (A) Principal component analysis (PCA) showing gene expression variance among samples. (B) Heatmap of sample-to-sample correlations.
Fishes 10 00484 g004
Figure 5. (A) Gene expression overview of groups. (B) DEG expression pattern clustering. (C) K1 vs. K0 DEG volcano plot. (D) K5 vs. K0 DEG volcano plot.
Fishes 10 00484 g005
Figure 6. (A) GO enrichment analysis (K1 vs. K0). (B) GO enrichment analysis (K5 vs. K0). (C) KEGG pathway analysis (K1 vs. K0). (D) KEGG pathway analysis (K5 vs. K0).
Fishes 10 00484 g006aFishes 10 00484 g006b
Figure 7. PPI networks of selected key DEGs.
Fishes 10 00484 g007
Table 1. Quality assessment and statistical analysis of transcriptome sequencing data.
SampleClean Reads (M)Mapped Reads (M)Mapped
(%)
GC Content (%)Q30 (%)
K0_147.4542.7089.9843.0495.55
K0_246.2241.5489.8643.6393.99
K0_344.5939.3188.1643.6094.66
K1_145.2040.8090.2644.3194.78
K1_248.0043.4390.4844.6894.66
K1_341.0737.0590.2242.9894.15
K5_147.7943.1390.2543.2794.20
K5_243.8437.7986.2043.3094.48
K5_343.5338.5688.5944.2594.54
Table 2. Key candidate DEGs common to both groups.
IDDescriptionAbbreviationLog2FoldChange
K1 vs. K0K5 vs. K0
Cide__007094-RAComplement component 5c5−0.853.27
Cide__012914-RAComplement component 8 alpha polypeptidec8a0.753.80
Cide__012915-RAComplement component 8 beta polypeptidec8b−0.613.23
Cide__034928-RAComplement component 8 gamma polypeptidec8g−0.361.93
Cide__007983-RAComplement component 9c9−0.593.28
Cide__032115-RAComplement factor Icfi−0.452.58
Cide__010271-RACoagulation factor Xf10−0.011.30
Cide__003445-RACoagulation factor IIf2−0.373.00
Cide__010273-RACoagulation factor VIIf7−0.602.08
Cide__005925-RACoagulation factor IXf9−0.353.43
Cide__010004-RAFibrinogen alphafga−0.213.48
Cide__010005-RAFibrinogen B beta polypeptidefgb−0.333.74
Cide__009699-RAFibrinogen gammafgg−0.423.66
Cide__005301-RAKininogen 1kng1−0.533.43
Cide__026768-RAPlasminogenplg−0.523.11
Cide__005080-RASerpin family C member 1serpinc1−0.383.68
Cide__019063-RASerpin family D member 1serpind1−0.033.82
Cide__029826-RASerpin family F member 2serpinf2−0.252.86
Disclaimer/Publisher’s Note: The statements, opinions and data contained in all publications are solely those of the individual author(s) and contributor(s) and not of MDPI and/or the editor(s). MDPI and/or the editor(s) disclaim responsibility for any injury to people or property resulting from any ideas, methods, instructions or products referred to in the content.