Abstract
Digital currencies, led by Bitcoin and USDT, are characterized by decentralization and anonymity, which obscure the identities of traders and create a conducive environment for illicit activities such as drug trafficking, money laundering, cyber fraud, and terrorism financing. Focusing on the USDT-TRC20 token on the Tron blockchain, we propose a two-layer transaction network-based approach for virtual currency address identity recognition for digging out hidden relationships and encrypted assets. Specifically, a two-layer transaction network is constructed: Layer A describes the flow of USDT-TRC20 between on-chain addresses over time, while Layer B represents the flow of TRX between on-chain addresses over time. Subsequently, an identity metric is proposed to determine whether a pair of addresses belongs to the same user or group. Furthermore, transaction records are systematically acquired through blockchain explorers, and the efficacy of the proposed recognition method is empirically validated using dataset from the Key Laboratory of Digital Forensics. Finally, the transaction topology is visualized using Neo4j, providing a comprehensive and intuitive representation of the traced transaction pathways.
1. Introduction
With the rapid development of blockchain [1] and technology, the scale of cryptocurrency transactions has experienced exponential growth. While cryptocurrencies are also utilized in certain illegal activities, it is important to note that their primary value lies in providing decentralized and efficient digital transaction mechanisms. Cryptocurrencies, exemplified by Bitcoin [2], are characterized by decentralization and anonymity. Although users can transact without revealing real-world identities, most blockchain transactions are publicly recorded and traceable, making them fundamentally different from cash in terms of privacy. These properties, including global accessibility and transaction efficiency, have also led to their misuse in various illegal activities [3], including but not limited to (1) crimes utilizing cryptocurrency as a payment tool, (2) money laundering and terrorist financing facilitated by cryptocurrency, (3) crimes directly targeting cryptocurrency assets, and (4) fraudulent schemes and pyramid selling disguised as cryptocurrency investment opportunities. According to their underlying concept, cryptocurrencies can also be referred to as decentralized digital currencies. While the degree of anonymity remains a topic of academic debate [4,5,6,7,8,9], it is widely acknowledged that most cryptocurrencies offer a level of traceability not present in cash transactions, due to their public and immutable ledger systems. The transfer of cryptocurrency occurs between addresses. A cryptocurrency address is analogous to a bank card number without real-life identity information and is represented by a string of characters and numbers. Up until now, a large number of public chains have been issued, among which Bitcoin (BTC) and Ethereum (ETH) are dominant in terms of market capitalization, while Tron has emerged as a major platform in terms of transaction volume, particularly for USDT transfers. The market price of cryptocurrencies fluctuates wildly, especially for Bitcoin. Since its creation, Bitcoin has achieved a million-fold increase in price. Violent price fluctuations bring many risks, which are not conducive to the development of the digital currency market. USDT has been issued by Tether to minimize the volatility of the digital currencies and provide a relatively stable medium for digital asset trading. It is a digital token pegged to the US dollar (USD), that is, one USD is equal to one USDT. Nowadays, USDT is one of the most widely used stablecoins [10] in the digital currency market. As a stablecoin, USDT was originally issued on Bitcoin’s Omni protocol and was later issued on the Ethereum network using the ERC20 token standard. With the development of different blockchain networks, USDT has successively existed in different token standards on other public chains, such as in the form of TRC20 token standard on the Tron blockchain. Tron has become particularly significant in the USDT ecosystem due to its high transaction throughput and low fees, making it an important blockchain despite a relatively lower market capitalization ranking. Users can choose which blockchain network to transact on using USDT based on their needs and preferences. In digital currency trading, stablecoins are often used as a low-cost exit from the digital currency market. Currently, the global landscape of virtual currency-related crimes has become increasingly severe. Virtual currencies have become a primary channel for illicit funds in emerging cybercrimes, such as telecommunications network fraud and online gambling. In 2024, the global virtual currency market exhibited heightened activity compared to 2023, with the price of Bitcoin surpassing USD 100,000 and the total market capitalization of cryptocurrencies having doubled. Notably, USDT remains the most commonly involved currency in digital currency-related illegal activities.
With the increasing prevalence of criminal activities involving digital currency transactions, it is imperative to enhance the regulatory oversight of digital currencies, investigate the correlations between virtual currency addresses, and identify clusters of addresses associated with the same user or group. Existing studies on USDT tracing mainly focus on single-network analysis (e.g., only analyzing USDT transaction records) and lack consideration of the correlation between USDT-TRC20 and its underlying TRX transaction network. Thus, the objective of this paper is to enhance regulatory oversight of digital currencies by investigating correlations between virtual currency addresses and identifying clusters associated with the same user or group.
As an increasing number of cybercrimes involve virtual currency transactions, and one of the most commonly used digital currencies by suspects is USDT. The market capitalization of USDT has surged to a record high, from about USD 94.9 billion at the beginning of 2024 to USD 160 billion in July 2025. Nowdays, most of the newly issued USDT is on the Tron blockchain. Indeed, the majority of USDT transactions occur through centralized exchanges (CEX), where user-level addresses are generally not publicly accessible on-chain, and effective tracing often requires judicial cooperation with the exchange or the use of integrated cross-chain analysis tools. In this paper, we focus on USDT and propose a two-layer transaction network-based approach for identifying hidden relationships and encrypted assets in on-chain transaction scenarios. This method is particularly suited for analyzing direct on-chain interactions between publicly accessible addresses, rather than off-chain or CEX-internal transfers. Specifically, Layer A describes the flow of USDT-TRC20 between on-chain addresses over time, while Layer B represents the flow of TRX between on-chain addresses over time. TRX is a digital currency based on Tron, and its full name is Tronix, the basic unit of Tron. TRX is the native digital currency of Tron, which can be used to pay for various costs in the network, such as transaction fees, bandwidth points, energy, and so on. It can be seen from the existing practical cases that the flow of TRX is crucial for identifying suspects’ hidden on-chain address, while existing transaction data analysis methods primarily concentrate on the flow of USDT-TRC20 and often overlook TRX.
The remainder of this paper is organized as follows. In Section 2, we review and synthesize the related work on blockchain transaction analysis and address tracing. In Section 3, we elaborate on the characteristics of USDT-TRC20 transactions and the construction of a two-layer network (i.e., the USDT-TRC20 transaction network and the TRX transaction network), using publicly available transaction records queried from OKlink, a blockchain explorer. In Section 4, an identity metric is introduced to identify hidden on-chain relationships and distinguish addresses belonging to the same user or group. Furthermore, a methodology for calculating the effective transfer amount between any two addresses is presented for tracing encrypted assets in this section. In Section 5, the validity of the proposed tracing method is verified. The conclusions are given in Section 6.
2. Related Work
Currently, research on the traceability of digital currency transactions remains relatively limited both domestically and internationally. Existing studies can be broadly categorized into two primary areas: network-layer traceability technologies [11,12,13] and transaction data analysis methodologies [6,14,15,16,17,18,19,20,21,22,23]. Using Bitcoin as an example, network-layer traceability technology entails the collection of information transmitted over the Bitcoin network layer, the analysis of propagation paths of Bitcoin transactions within the network, and the tracking of IP information associated with servers that generate these transactions. This approach directly associates anonymous transactions with the IP addresses of the originating nodes or the nodes initiating the transactions, thereby achieving traceability [12]. In 2014, Koshy et al. [13] examined the propagation characteristics of broadcast messages observed over a specific timeframe and put forward four models describing how messages propagate within blockchain networks. This tracing approach monitors the patterns of message dissemination, analyzes the actual initiating nodes, and establishes correlations between IP addresses and on-chain addresses embedded in the messages, posing significant risks to communication privacy and user anonymity. To avoid such tracking, many users now employ proxy servers or virtual private networks (VPNs) to obscure their real IP addresses. Consequently, existing network-layer traceability technologies suffer from limited accuracy, high computational and storage resource demands, and poor practical applicability. To address these limitations, Gao et al. [12] proposed an innovative Bitcoin transaction traceability mechanism using neighbor node identification through the deployment of probe nodes. The probe nodes collect the transaction information with different timestamps from the neighbor nodes and predict the propagation path of the transaction information according to the time order in the network. Then, this traceability mechanism is used to find the IP address of the first server node of the Bitcoin network where the transaction information enters, and the inbound traffic of the server node is analyzed to find the IP address of the client node. In fact, the network delay between different nodes and probe nodes is different. This may cause the order in which the transaction information reaches the probe node to be different from the time order of the node forwarding the transaction information, thus affecting the accuracy of traceability. Bitcoin transactions are not considered truly anonymous because private user information (e.g., IP addresses) can be uncovered through transaction tracking, combined with the ongoing development of cryptanalysis techniques [24]. Xiao et al. [25] proposed a mixing mechanism integrated with a decentralized signature protocol to safeguard privacy within the Bitcoin blockchain, in which the direct associations between original input addresses and output addresses are disconnected.
Transaction data analysis technology, grounded in the examination of transaction records, aims to infer the relationships and transfer pathways between distinct transaction addresses by analyzing trading patterns and fund flows. According to Bitcoin’s public transaction records, Reid and Harrigan [6] established topological structures corresponding to transaction and user networks, respectively, and combined these structures with external identifying information and techniques such as context discovery and flow analysis to investigate Bitcoin transaction traceability. Meiklejohn et al. [7] developed a new clustering heuristic based on change addresses, which can be used to cluster Bitcoin addresses belonging to the same user. By conducting a comprehensive analysis of ransom payment timestamps, both longitudinally across CryptoLocker’s operating period and transversely across times of day, Liao et al. [14] systematically investigated the ransom process of CryptoLocker. Their study identified 795 ransom payments totalling 1128.40 BTC, based on a cluster of 968 Bitcoin addresses associated with CryptoLocker. In 2017, Chen et al. [15] proposed a new method for de-anonymizing transaction systems by using information including the number of transactions and timestamps of sending and receiving. Yousaf et al. [16] explored the tracing of transactions across cryptocurrency ledgers, differentiating between diverse patterns of cross-currency transactions and the general utilization of these platforms to determine whether such activities serve criminal groups or other profit-oriented entities. Chen et al. (2020) [17] pioneered a graph-based approach to model token creator-holder-transfer relationships, constructing multi-layered graphs to uncover ecosystem dynamics. Their algorithm identified “whale” accounts and token manipulation strategies, such as wash trading, by analyzing subgraph motifs. This work laid the groundwork for detecting collusive behaviors in decentralized finance (DeFi).
Li et al. [18] introduced a traceable Monero system and elaborated on the detailed construction of such a traceable version by superimposing Monero with two categories of tracing mechanisms. To characterize key participants in the cryptocurrency economy, Liu et al. conducted an analysis of Ethereum token transactions and assessed their identifiability through the application of interpretable machine learning models [19]. Song et al. [20] summarized and analyzed the literature on cryptocurrency transaction data from the perspective of complex networks, establishing a systematic framework for blockchain data analysis. They emphasized the role of complex network metrics (e.g., average path length, clustering coefficient) in identifying transaction patterns and detecting anomalies. Their work highlights how network modeling can reveal hidden relationships between addresses, such as money laundering circuits and pseudonymous account clusters. Faced with the computational complexity and excessive memory consumption of traditional graph traversal methods when applied to massive blockchain datasets, Wu et al. (2022) [21] proposed TRacer, a subgraph search framework optimized for account-based blockchains like Ethereum. TRacer integrates temporal and token-flow attributes into a weighted multigraph, enabling efficient tracing of fund flows through ranking-guided expansion. By prioritizing nodes with high pollution scores (e.g., addresses linked to known illicit activities), the system achieves sublinear time complexity, making it feasible for real-time analysis of terabyte-scale datasets. In 2023, Dearden et al. [22] developed a structured approach for quantitatively examining the Bitcoin blockchain ledger. Their findings indicate that cryptocurrency transactions, including both legal and illegal activities as well as attempts to obfuscate transactions, are generally identifiable with 90%. These studies have demonstrated that the analysis and mining of transaction-related information from transaction records can facilitate the tracking of cryptocurrency transactions and the detection of illegal activities.
While the aforementioned studies can assist in tracing virtual currency, tracking virtual currency transactions from the perspectives of network-layer traceability or blockchain supervision is not feasible in the practical cases examined by public security agencies. Once a criminal incident occurs, collecting information transmitted through the cryptocurrency network layer by deploying probe nodes, or tracking operations and users by designing new blockchain-based proof methods, becomes too late. Consequently, transaction data analysis technology based on transaction records has emerged as a crucial approach for tracing transaction paths, uncovering hidden encrypted assets and suspects, and preventing digital currency-related crimes.
3. Two-Layer Transaction Network
In actual transfer processes, users transferring USDT via virtual currency wallet software are required to consume a certain amount of TRX, rendering the source of TRX (i.e., TRX transfers between users) significant. However, not every USDT transfer necessitates TRX, as this specifically depends on the blockchain network where the USDT resides. In Table 1, there is an USDT-TRC20 transaction at 13:32:48 on 22 September 2023 showing a transfer of 5 USDT from the output address (TDhXA…) to the input address (TGgzC…). The transaction fee of 27.2559 TRX simultaneously deducted from the output address (TDhXA…). In fact, the transaction fee for this output address comes from a transfer of 100 TRX at 16:25:39 on 21 September 2023, which can also be seen in Table 1. Therefore, the transaction data analysis method proposed in this paper not only focuses on the flow of USDT-TRC20 but also examines the transfer of TRX.

Table 1.
Records of USDT-TRC20 and TRX Transfers.
The digital token transaction data encompass records of both USDT-TRC20 and TRX transfers. The transaction network formed by USDT-TRC20 and TRX transactions can be abstracted into a complex two-layer network [23], where virtual currency addresses act as nodes, and TRC20 or TRX transactions between addresses serve as edges. This two-layer network is illustrated in Figure 1, which depicts an example with 11 nodes numbered 1 through 11, where each node in Layer A has a one-to-one correspondence with a node in Layer B.
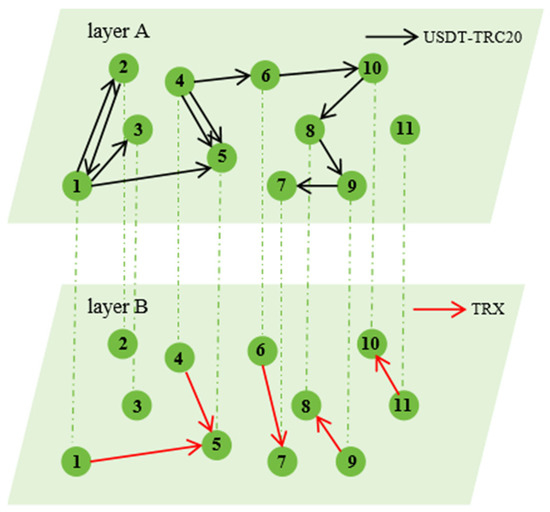
Figure 1.
The two-layer transaction network composed of USDT-TRC20 and TRX transactions.
Layer A represents the USDT-TRC20 transaction network, while Layer B represents the TRX transaction network. Within Layer A, there are nodes and directed edges, corresponding to on-chain addresses and USDT-TRC20 transactions between these addresses. In lower Layer B, there are nodes and directed edges, corresponding to addresses and TRX transfers between these addresses, respectively. In each layer, every directed edge between a source and a target node represents a single transaction, containing the transaction amount and timestamp from the output address to the input address. Given that the number of USDT-TRC20 transactions typically exceeds that of TRX transactions, Figure 1 shows that the number of inter-node links in Layer A is greater than that in Layer B. Within this two-layer network, nodes representing virtual currency addresses are shared consistently across both Layer A and Layer B, with each node in one layer having a strict one-to-one correspondence in the other. These addresses correspond to those used in the Tron blockchain, where TRX addresses are typically 34-character alphanumeric strings starting with the letter “T”.
Next, we abstract the two-layer network into a directed graph to characterize the coupled relationship between the USDT-TRC20 and TRX transaction networks, where represents the set of nodes denoting virtual currency addresses started with capital “T”, and denotes the set of edges in layer . For example, denotes the set of edges corresponding to USDT-TRC20 transactions in Layer A, and denotes the set of edges corresponding to TRX transactions in Layer B. Consider two nodes, and , in the transaction graph of Layer A, where represents a source (output) address and represents a destination (input) address (i.e., ). If there are transactions from node to node in Layer A, , otherwise . Similarly, if there is one or more transaction from the source node (output address, ) to the destination node (input address, ) in Layer B, , otherwise , where denotes the number of transactions from node to node in Layer B. If , no USDT-TRC20 or TRX transaction exists from node to node in layer . If , no transaction exists from node to node neither USDT-TRC20 nor TRX in layer . It can be observed that the coupled relationship between the USDT-TRC20 and TRX transaction networks is characterized by a pair of values consisting of and . For the connected node pair , there are four possible value pairs of , which are listed below,
where and represent the number of transactions from node to node in layers A and B, respectively. Figure 2a–d illustrate that these four groups of values correspond to four distinct node connection patterns in the two-layer network.
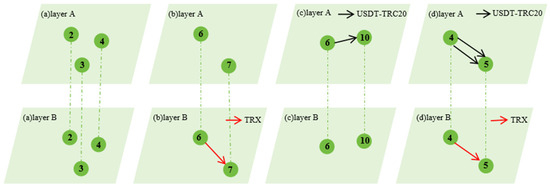
Figure 2.
The four different node connections in A and B layers. (a) ; (b) ; (c) ; (d) .
Because the transactions between two nodes may occur in opposite directions, differs fundamentally from , meaning that the connected node pairs and represent opposite directions. Similarly, the connected node pair corresponds to four different kinds of node connections within the two-layer network, where the only difference from Figure 2a–d lies in the opposite direction of node connections.
Since there may be multiple transactions in any pair of addresses, there are multiple one-way or bidirectional edges between the same two nodes, which can be characterized by labeled property graph. This graph has the following characteristics: (1) The labeled property graph consists of nodes and connections, where nodes correspond to on-chain addresses, and connections correspond to transaction relationship between addresses. (2) The node has properties described by key-value pairs. For example, create (n1:address {addr:‘TDhXAE4’}) represents the creation of a node with a label “address” and an attribute “addr”. In this attribute, the key-value pair is “addr: TDhXAE4”, where “TDhXAE4” is the actual on-chain address. (3) The connection can have one or more attributes, and always has a start node and an end node. For example, create (n1:address {addr:‘TDhXAE4’})-[r:usdt_trans_to{time:[‘2023-09-22 13:32:48’],amount:[‘5 USDT’]}]->(n2: address {addr:‘TGgzCJL’}) represents the creation of a relationship between two nodes with a label “usdt_trans_to” and two attributes “time” and “amounttrx_”, resulting in the graph as shown in Figure 3. Because different transaction types can exist between two addresses, such as USDT and TRX, two different labeled relationships exist between two nodes, such as “usdt_trans_to” and “trx_trans_to”, in the graph as shown in Figure 4. Similarly, multiple transaction relationships recorded in the transaction records between addresses can be inserted between nodes to form a labeled property graph characterizing digital currency transaction relationships.
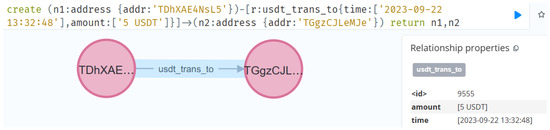
Figure 3.
The creation of two nodes and a relationship between them.
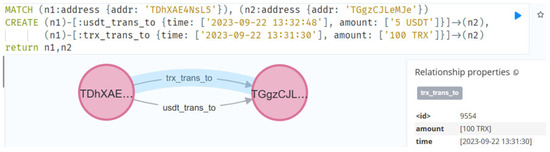
Figure 4.
Two different relationships created between the two addresses.
At this stage, the multi-relationship network graph has been constructed. To facilitate subsequent topological structure analysis, the graph will be abstracted into a two-layer network: Layer A characterizes USDT transaction relationships between addresses, while Layer B characterizes TRX transaction relationships between addresses.
4. Method for Determining Address Identity
Traditional methods for cryptocurrency tracing based on transaction data analysis primarily rely on tracking the upstream and downstream addresses according to the transaction data recorded in the blockchain ledger. The analysis of transaction data includes summarizing the incoming and outgoing amounts and number of transactions for specific addresses, as well as summarizing the amounts and number of transactions between address pairs. Currently, the complexity of crimes and the efficacy of evidence pose significant challenges in combating crimes involving virtual currencies. Therefore, tracing the origins and destinations of virtual currency transactions, and digging out hidden encrypted assets and suspects, have become a crucial measure in investigating cases related to virtual currencies, such as money laundering, cyber fraud, terrorism financing, etc.
Next, focusing on the USDT-TRC20 token on the Tron blockchain, we propose an identity consistency determination method. This method aims to uncover underlying relationships between addresses and compute effective transaction pathways of encrypted assets among them. Specifically, the proposed method accomplishes two main tasks. First, starting from a given address, it identifies other addresses controlled by the same entity or affiliated with the same controlling party. Then, it computes both the effective transaction paths and the corresponding amounts between those addresses. Since transaction paths may involve multiple intermediate addresses, the method draws on the max-flow problem from network flow theory to identify all valid paths and compute the maximum transferable amount between the source and target addresses.
The detail steps of the proposed method are summarized as follows:
Step 1: Transaction data acquisition. Transaction data, including both USDT-TRC20 and TRX records, were collected through the following procedure. Starting from a suspect’s USDT-TRC20 address involved in a virtual currency money laundering case, we recursively retrieved all transaction records using OKLink, a blockchain explorer. For each transaction, counterparty addresses were extracted, and their transaction histories were further downloaded iteratively. The retrieval process terminated when a counterparty address was identified as belonging to a known exchange or platform. This procedure was repeated for all USDT-TRC20 addresses associated with the suspects. After acquisition, all non-filtered records were cleaned and summarized by removing invalid records, such as non-USDT or non-TRX transactions and those with amounts less than 0.01. The final output is a structured table containing the transaction hash, block height, timestamp, output address (from), input address (to), token type, and transaction amount.
Step 2: Two-layer network construction. Based on the summarized transaction table obtained in the first step and the two-layer network construction method outlined in Section 3, the two-layer direction graph can be represented using USDT-TRC20 and TRX transaction data. We denote the set of nodes in Layer A as , where is the number of on-chain addresses involved in USDT-TRC20 transactions within Layer A. The set of nodes in Layer B is denoted as , where represents the number of on-chain addresses involved in TRX transactions within Layer B. The graph can also be denoted as , where is the union of the node sets from layers A and B, and is the number of nodes in this union. Similarly, and denote the set of USDT-TRC20 transactions (edges) in Layer A and the set of TRX transactions (edges) in Layer B, respectively. When there are one or more transactions from the source node (output address) to the destination node (input address) in layer (i.e., ), we set and otherwise, where denotes the number of transactions from node to node in layer . Among these transactions, each transaction amount is represented by with the transaction timestamp . If no transaction exists from node to node , we set and corresponds to no transaction from node to node .
Step 3: uncovering relationships between addresses. We introduce a new metric for evaluating strong relationships between addresses, in addition to traditional statistical metrics of transaction amounts and counts. The traditional statistical metrics comprise the total amount and number of both outgoing and incoming transactions for a given address, as detailed below.
By summing the elements in the rows and columns of the matrix, the total amount and number of outgoing and incoming transactions for a given address can be calculated. The total amount of outgoing and incoming transactions for node in layer can be denoted as
where denotes the number of transactions from node to node in or from node to node in , is the total number of unique nodes after aggregation from nodes in layers A and B.
The number of outgoing and incoming transactions for node in layer can be denoted as and , where and denote the number of transactions from node to node and from node to node in layer respectively, and is as defined above.
Given that transactions between addresses primarily involve USDT-TRC20, we introduce a metric based on the revised harmonic mean to quantify the number of round-trip transactions between on-chain addresses in Layer A. is denoted as
where and are as defined above. It should be noted here why the harmonic mean was selected for parameter design. This choice is based on the characteristic that the harmonic mean is sensitive to extreme values, with a greater susceptibility to extremely small values than to extremely large ones. For instance, consider two node pairs, one with and , and the other with and . The corresponding values of are 46.15 and 5.22, respectively. In cases where no round-trip transfers occur between node and node (i.e., or ), the condition is not satisfied, and thus there is no need to calculate the value of . As evident from Equation (4), the larger the value of , the greater the probability of mutual transfer of USDT-TRC20 between node and node .
Metric. Based on the inter-transfer parameter and incorporating both USDT-TRC20 and TRX transactions, a metric noted as the identity metric is proposed to quantify the shared ownership relationships between addresses. The identity metric is denoted as
where denotes the round-trip transfer indicator for USDT-TRC20 transactions between addresses in Layer A. From Equation (5), it can be observed that when both and take zero simultaneously, The identity metric degenerates into (i.e., ). In such cases where both and are zero, it indicates there is no TRX transfer between nodes and , and the strength of their common social relationship is still measured by . In contrast to , not only considers the mutual transfer of USDT-TRC20 but also incorporates TRX transfers, allowing for more effective quantification of the shared ownership relationship between two addresses. Specifically, a relatively large value of may imply a strong correlation between the pair of addresses in Layer A, while a higher value of may suggest an increased likelihood that the pair of addresses is associated with the same user or accomplices.
In this step, we calculate the values of using Equation (5), sort them in descending order based on these values, and output the corresponding addresses and , along with the values of and . Notably, if round-trip USDT-TRC20 transfers and TRX transfers coexist in the two-layer transaction network, a larger value of indicates a closer relationship between addresses and .
Step 4: Calculation of effective transfer amount. To identify suspicious addresses and trace the primary transaction flow paths between them, we analyze USDT-TRC20 transaction flows to detect concealed fund movements. For example, Address C → (transfer 200 USDT) → Address D → (transfer 50 USDT) → Address E → (transfer 150 USDT) → Address F. After filtering valid transaction paths under temporal constraints, the actual transfer amount from C to F corresponds to the minimum value along the path, which is 50 USDT in this example.
By enforcing temporal order constraints on the transaction sequence, we screen for valid transaction paths. Since each transaction in the flow has a specific timestamp, we first examine each path from the source node to the sink node , as illustrated in Equation (6), to verify whether the timestamps satisfy the monotonic increase condition along the path. A path is considered valid if
where denotes the timestamp of the direct transaction from node to node , forms a path from source node to sink node , with being the number of intermediate nodes. If a path satisfies the temporal order constraint, it is retained as a valid transaction path for further analysis.
Then compute the maximum feasible flow for each valid transaction path. For each valid path , the effective transaction amount is defined as the minimum transaction amount along the path:
where denotes the amount of the direct transaction from node to node , and is the number of intermediate nodes.
Finally, calculate the effective transfer amount from source to sink. The total effective transfer amount from source node to sink node is the sum of the effective amounts over all valid paths:
where is the set of all valid transaction paths from to , and is the effective amount for path .
Through the above steps, the effective transfer amount between any two addresses can be calculated.
Step 5: Visualization of transaction data. To depict the transaction relationships between addresses using a labeled property graph, we utilize the py2neo package in Python to bulk import virtual currency transaction data into the Neo4j database, which stores the complex transaction network topology between addresses. Transaction paths between addresses and basic statistical analyses can be generated using Cypher, a declarative graph query language.
Following the aforementioned steps, we can identify address pairs with common social relationships in transaction records and visualize the transaction topology between addresses using Neo4j.
5. Experiments and Discussion
The transaction data, comprising USDT-TRC20 and TRX records, were acquired as described in Step 1 of Section 4. The resulting dataset consists 769 addresses and 4862 transactions: 747 addresses participated in 4670 USDT-TRC20 transactions, and 93 addresses were involved in 192 TRX transactions. The corresponding two-layer transaction network (USDT-TRC20 and TRX) is visualized in Figure 5a,b, with Figure 5b showing an enlarged subset of nodes and links from Figure 5a. In Layer A, there are 747 nodes and 4670 directed edges marked with black line, which represent 747 on-chain addresses and 4670 USDT-TRC20 transactions between these addresses. In Layer B, there are 93 nodes and 192 directed edges marked with red line, which represent 93 addresses and 192 TRX transactions between these addresses. Each directed link between a source and a target in each layer represents a single transaction including trading amount and timestamp from output address to input address.
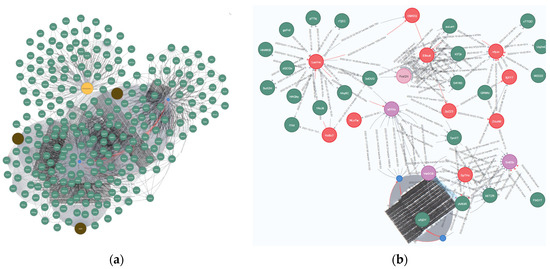
Figure 5.
The visualized transaction network topology: (a) The overall network structure; (b) The enlarged view of a portion of nodes and links.
5.1. Experimental Validation of Evaluating Strong Relationships Between Addresses
Following the transaction tracing method in Section 4, the set of digital token addresses is , containing 769 addresses (i.e., ). The matrix is constructed using output addresses, input addresses, and USDT-TRC20 transfer counts, where addresses correspond to nodes and and transaction counts serve as matrix elements or . Similarly, the matrix is populated using TRX transaction data, with the same node and element definitions. Then, we calculate , and list the address pairs with the calculated value greater than 2. The address pairs along with their corresponding USDT-TRC20 and TRX transfer counts, and calculated values of are shown in Table 2, where the addresses in the table are partially redacted (e.g., ***QfoH, ***oLYW) with asterisks replacing specific segments to ensure privacy protection.
Table 2.
The value of identity metric with consideration of both USDT-TRC20 and TRX transfers.
From Table 2, it can be observed that the highest value of correspond to the node pairs (denoted as addresses ***oLYW and ***QfoH). For addresses ***oLYW and ***QfoH, is 74, and is 215, both of which are quite high. This suggests a big number of round-trip USDT-TRC20 transactions between the addresses, indicating a high likelihood that they are affiliated with the same group. Furthermore, the observed transaction patterns between ***QfoH and ***oLYW include not only reciprocal USDT-TRC20 transfers but also TRX exchanges, significantly strengthening the probability of their common ownership. Forensic data obtained through legal processes confirms that address pairs such as ***oLYW and ***QfoH (presented in Table 2) share identical login IP addresses and IMEI numbers, which provides direct evidence of common ownership. In such cases, one address is often dedicated to receiving exchange withdrawals and transferring funds to a secondary address, which subsequently facilitates outward transfers in criminal activities such as money laundering. Alternatively, addresses ***QfoH and ***oLYW could engage in mutual transfers resulting from round-trip borrowing. Even if borrowing is confirmed, the big number of such round-trip transactions suggests a strong trust-based relationship, potentially indicating close cooperation or personal ties. Critically, within the context of money laundering, interpreting these recurring round-trip transfers merely as repayments or refunds is not empirically supported and fails to align with typical money laundering behavior.
Meanwhile, Figure 6a,b further validate the effectiveness of the method for determining address identity. It should be noted that the mosaic applied in the figures is intended to protect transactional privacy, including addresses, timestamps, transaction hash, and block heights. The counts of USDT and TRX transactions (, , , ) between addresses ***di28 and ***Pj9V are consistent with the results highlighted by the red boxes in Figure 6a,b, which were retrieved from the explorer. Furthermore, the identity metric indicates a high probability that these two addresses belong to the same group or entity, as they engage in not only USDT-TRC20 transactions but also mutual TRX transfers.
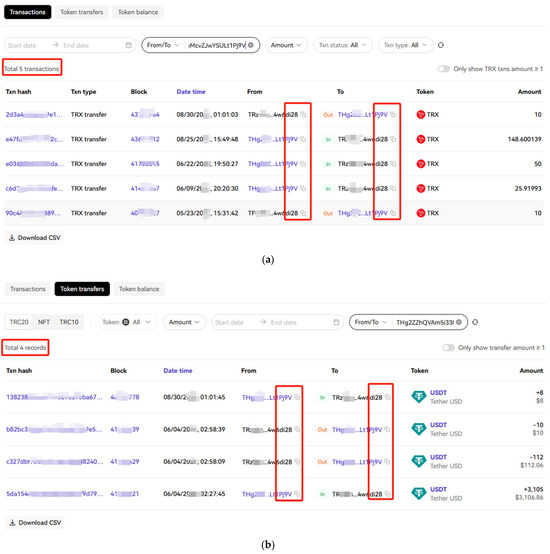
Figure 6.
Transaction records between addresses ***di28 and ***Pj9V obtained from blockchain explorer: (a) TRX transactions; (b) Token (USDT-TRC20) transfers.
As shown by the data in Table 2, when there are no TRX transactions between two addresses, the value of equals that of , which is consistent with the analytical result of Equation (5) above. Meanwhile, the practical significance of selecting the logarithmic function is reflected in the calculated values of and for the address pair ***QfoH and ***wVW3 (, , , ). Despite the relatively high number of mutual TRX transfers (, ) between the address pair, a linear function was not employed to inflate the value of the identity metric. Empirical cases suggest that the characterization of address correlation through TRX transaction behavior exhibits the law of diminishing marginal utility. As the first TRX transaction between two addresses contributes the maximum weight to proving their correlation, a logarithmic function can depict this decreasing pattern, and its mathematical properties align with the nonlinear relationship between the number of transactions and correlation strength in practical business scenarios. Additionally, the choice of a logarithm with base 2 is intended to be selected to enhance feature discrimination in scenarios involving a small number of transactions, such as 1, 2, 3, or 4 occurrences. When the TRX transaction count falls within a low range (e.g., between 1 and 5 transactions), the base-2 logarithm exhibits a steeper initial growth slope compared to the natural logarithm or logarithmic functions with larger bases. This property significantly amplifies the discriminative weight of initial transactions, thereby improving detection sensitivity for sporadically correlated behaviors.
In summary, the is used to measure the likelihood of an association between two suspicious addresses, while the identity metric quantifies the probability that two addresses belong to the same user or group. Based on the given addresses, the proposed method can identify address pairs with relatively large values, thereby detecting previously unidentified addresses controlled by the same user or group. This method aims to provide investigators with a mathematically grounded approach to identify addresses with high probability of belonging to the same entity or criminal group, based solely on analyzing public transaction records. It enables follow-up investigative actions such as legal requests for identity information.
5.2. Experimental Validation of Effective Transfer Amount Calculation
To empirically validate the proposed method for calculating effective transfer amounts, we conducted experiments on the acquired dataset comprising 4862 USDT-TRC20 and TRX transactions across 769 addresses. The validation aims to demonstrate the algorithm’s capability to compute the effective transfer amount from a given source node to a designated sink node by identifying temporally valid transaction paths and aggregating path-specific effective values.
We implemented the temporal constraint verification (Equation (6)) and effective amount calculation (Equations (7) and (8)) algorithms in Python 3.9. We selected three representative source-sink address pairs from the dataset that exhibit different transaction patterns and path complexities. The effective transfer amount between arbitrary source-sink address pairs computed by the algorithm was further visualized using Neo4j to verify its correctness, as illustrated in Figure 7 and Figure 8.
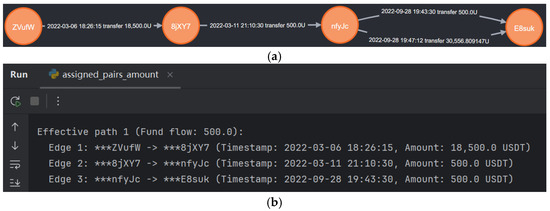
Figure 7.
Experimental results (from ***ZVufW to ***E8suk): (a) Network path visualized in Neo4j; (b) Effective transfer amount computed in Python.
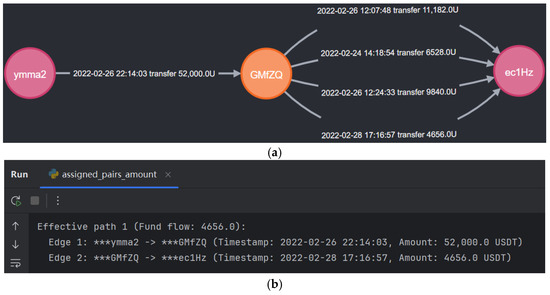
Figure 8.
Experimental Results (from ***ymma2 to ***ec1Hz): (a) Network path visualized in Neo4j; (b) Effective transfer amount computed in Python.
As shown in the Neo4j visualization of Figure 7a, the path from the source address ***ZVufW to the sink address ***E8suk passes through two intermediate addresses ***8jXY7 and ***nfyJc. Based on the temporal constraints (Equation (6)) and the effective transfer amount formulas (Equations (7) and (8)), the effective transfer amount is calculated as 500 USDT, which is consistent with the result obtained from the Python implementation, as shown in Figure 7b.
Similarly, Figure 8a, also visualized using Neo4j, shows the path from source address ***ymma2 to sink address ***ec1Hz with one intermediate address ***GMfZQ. Note that there are three edges from node ***GMfZQ to ***ec1Hz that do not satisfy the temporal constraints. According to Equations (7) and (8), the effective transfer amount is computed as 4656 USDT, which matches the Python output presented in Figure 8b.
The experimental results demonstrate that the proposed method effectively filters out temporally inconsistent paths that could lead to inaccurate fund flow estimation, identifies the constraining (minimum) amount in each valid transaction path, and computes the comprehensive effective transfer amount by aggregating across all valid paths. This study not only investigates relationships between addresses but also provides a mathematically grounded approach to measure the actual effective transfer of funds between them, thereby supplying law enforcement agencies with a reliable tool for tracing money laundering activities.
6. Conclusions
The application of new technologies such as blockchain in various aspects of cybercrime is accelerating the migration of traditional crimes towards virtual currency crimes. Suspects often convert their criminal proceeds into virtual currencies before cashing out into fiat currencies to launder money, making it difficult to trace them and uncover hidden addresses and encrypted assets. In this work, we present a method for determining address identity based on a two-layer transaction network constructed by USDT-TRC20 and TRX transactions, which aims to uncover hidden relationships and encrypted assets between addresses. An identity metric is proposed to quantify shared ownership strength between two addresses via the two-layer transaction network. A larger metric value indicates a higher probability of co-ownership (same user or group), as it incorporates both USDT-TRC20 and TRX round-trip transfers. Experiments validate the effectiveness of this address identity determination method, showing that the proposed metric can reliably identify address pairs with a high probability of belonging to the same user or group. This method addresses the existing challenge of difficulty in identifying the ownership identity and relatedness behind different addresses. It is worth noting that the proposed method can serve as an on-chain analysis tool that may complement existing anti-money laundering (AML) frameworks. While it enhances the ability to detect transactional linkages and cluster suspicious addresses during the pre-exchange phase, the ultimate attribution of real-world identity and the interception of illicit funds typically occur when virtual assets are converted into fiat currencies—a process that relies on the cooperation of regulated centralized exchanges (CEXs) where AML and know-your-customer (KYC) procedures are enforced.
Despite advances in blockchain technology, multi-layer transaction tracing remains challenging in practical forensic investigations. Suspects often transfer illicit funds through multiple addresses before converting them into fiat currencies, obscuring both the total amount of case-involved capital and the final disposition of criminal proceeds. While the present study has established a method for identifying hidden relationships and calculating effective transfer amounts between addresses reveals several promising directions for future work. First, the current framework could be extended to incorporate temporal dynamics and amount-based behavioral modeling, which would improve the quantification of relationships between addresses. Second, integrating multi-currency and cross-chain transaction analysis would enable more comprehensive tracking of asset movements across diverse blockchain networks. Finally, the development of graph machine learning (GML) could facilitate the automated detection of sophisticated money laundering patterns, thereby enhancing the scalability and accuracy of blockchain forensic tools.
Author Contributions
Conceptualization, L.X. and T.Z.; methodology, L.X. and Q.W.; software, Z.H. and Z.Y.; validation, Z.M., L.X. and T.Z.; formal analysis, L.X.; investigation, Z.J., T.Z. and Z.M.; resources, Q.W.; data curation, Z.H. and Z.Y.; writing—original draft preparation, L.X. and T.Z.; writing—review and editing, L.X. and T.Z.; visualization, Z.J., L.X. and Z.H.; supervision, Q.W. and Z.J.; project administration, Z.J.; funding acquisition, L.X. and Z.M. All authors have read and agreed to the published version of the manuscript.
Funding
This research was funded by National Natural Science Foundation of China under grant numbers 62202209 and 61802155.
Data Availability Statement
The transaction data, including USDT-TRC20 and TRX records, can be obtained from the OKLink blockchain explorer at https://www.oklink.com/zh-hans (accessed on 12 April 2024).
Acknowledgments
This research has been supported by the Key Disciplines in Jiangsu Province during the 14th Five Year Plan period (Public Security Technology, Cyberspace Security), the “Qinglan Project” of Jiangsu Universities, the Research Project of Humanities and Social Sciences of the Ministry of Education in 2024 (Grant No. 24YJAZH158), the General Project for Philosophy and Social Science Research in Jiangsu Province’s Universities in 2023 (Grant No. 2023SJYB0472), and the Excellent Science and Technology Innovation Team in Jiangsu Province (Forensic Analysis of Electronic Data, Excellent Technological Innovation Team in Forensic Toxicology under the Framework of Artificial Intelligence). The authors would like to acknowledge OKLink (https://www.oklink.com accessed on 12 April 2024) for providing its robust blockchain exploration services, which were instrumental in querying and downloading the transaction records essential for this research.
Conflicts of Interest
The authors declare no conflicts of interest.
References
- Zheng, Z.; Xie, S.; Dai, H.N.; Chen, X.; Wang, H. Blockchain challenges and opportunities: A survey. Int. J. Web Grid Serv. 2018, 14, 352–375. [Google Scholar] [CrossRef]
- Nakamoto, S. Bitcoin: A Peer-to-Peer Electronic Cash System. Available online: https://bitcoin.org/bitcoin.pdf (accessed on 6 August 2025).
- Watters, C. When criminals abuse the blockchain: Establishing personal jurisdiction in a decentralised environment. Laws 2023, 12, 33. [Google Scholar] [CrossRef]
- Li, Y.; Susilo, W.; Yang, G.; Yu, Y.; Du, X.; Liu, D.; Guizani, N. Toward privacy and regulation in blockchain-based cryptocurrencies. IEEE Netw. 2019, 33, 111–117. [Google Scholar] [CrossRef]
- Androulaki, E.; Karame, G.O.; Roeschlin, M.; Scherer, T.; Capkun, S. Evaluating user privacy in Bitcoin. In Proceedings of the 2013 International Conference on Financial Cryptography and Data Security (FC), Okinawa, Japan, 1–5 April 2013; Springer: Berlin/Heidelberg, Germany, 2013; pp. 34–51. [Google Scholar] [CrossRef]
- Reid, F.; Harrigan, M. An analysis of anonymity in the bitcoin system. In Proceedings of the 2011 IEEE Third International Conference on Privacy, Security, Risk and Trust and 2011 IEEE Third International Conference on Social Computing, Boston, MA, USA, 9–11 October 2011; IEEE: Boston, MA, USA, 2012; pp. 1318–1326. [Google Scholar] [CrossRef]
- Meiklejohn, S.; Pomarole, M.; Jordan, G.; Levchenko, K.; McCoy, D.; Voelker, G.M.; Savage, S. A fistful of bitcoins: Characterizing payments among men with no names. Commun. ACM 2016, 59, 86–93. [Google Scholar] [CrossRef]
- Ron, D.; Shamir, A. Quantitative analysis of the full bitcoin transaction graph. In Proceedings of the 2013 International Conference on Financial Cryptography and Data Security (FC), Okinawa, Japan, 1–5 April 2013; Springer: Berlin/Heidelberg, Germany, 2013; pp. 6–24. [Google Scholar] [CrossRef]
- Spagnuolo, M.; Maggi, F.; Zanero, S. BitIodine: Extracting intelligence from the bitcoin network. In Proceedings of the 2014 International Conference on Financial Cryptography and Data Security (FC), Christ Church, Barbados, 3–7 March 2014; Springer: Berlin/Heidelberg, Germany, 2014; pp. 457–468. [Google Scholar] [CrossRef]
- Thanh, B.N.; Hong, T.N.V.; Pham, H.; Cong, T.N.; Anh, T.P.T. Are the stabilities of stablecoins connected? J. Ind. Bus. Econ. 2022, 50, 515–525. [Google Scholar] [CrossRef]
- Wu, J.; Liu, J.; Zhao, Y.; Zheng, Z. Analysis of cryptocurrency transactions from a network perspective: An overview. J. Netw. Comput. Appl. 2021, 190, 103139. [Google Scholar] [CrossRef]
- Gao, F.; Mao, H.; Wu, Z.; Shen, M.; Zhu, L.; Li, Y. Lightweight transaction tracing technology for bitcoin. Chin. J. Comput. 2018, 41, 989–1004. [Google Scholar]
- Koshy, P.; Koshy, D.; McDaniel, P. An analysis of anonymity in bitcoin using P2P network traffic. In Proceedings of the 2014 International Conference on Financial Cryptography and Data Security (FC), Christ Church, Barbados, 3–7 March 2014; Springer: Berlin/Heidelberg, Germany, 2014; pp. 469–485. [Google Scholar] [CrossRef]
- Liao, K.; Zhao, Z.; Doupé, A.; Ahn, G.-J. Behind closed doors: Measurement and analysis of cryptolocker ransoms in bitcoin. In Proceedings of the 2016 Proceedings of the APWG Symposium on Electronic Crime Research (eCrime), Toronto, ON, Canada, 1–3 June 2016; IEEE: Boston, MA, USA, 2016; pp. 1–13. [Google Scholar] [CrossRef]
- Chen, L.; Xu, L.; Shah, N.; Diallo, N.; Gao, Z.; Lu, Y.; Shi, W. Unraveling blockchain based crypto-currency system supporting oblivious transactions: A formalized approach. In Proceedings of the ACM Workshop on Blockchain, Cryptocurrencies and Contracts, Abu Dhabi, UAE, 2–6 April 2017; Association for Computing Machinery: New York, NY, USA, 2017; pp. 23–28. [Google Scholar] [CrossRef]
- Yousaf, H.; Kappos, G.; Meiklejohn, S. Tracing transactions across cryptocurrency ledgers. In Proceedings of the 28th USENIX Conference on Security Symposium, Santa Clara, CA, USA, 14–16 August 2019; pp. 837–850. [Google Scholar]
- Chen, W.L.; Zhang, T.; Chen, Z.G.; Zheng, Z.B.; Lu, Y.T. Traveling the token world: A graph analysis of Ethereum ERC20 token ecosystem. In Proceedings of the Web Conference 2020 (WWW’20), Taipei, Taiwan, 20–24 April 2020; Association for Computing Machinery: New York, NY, USA, 2020; pp. 1411–1421. [Google Scholar] [CrossRef]
- Li, Y.; Yang, G.; Susilo, W.; Yu, Y.; Au, M.H.; Liu, D. Traceable Monero: Anonymous cryptocurrency with enhanced accountability. IEEE Trans. Dependable Secure Comput. 2021, 18, 679–691. [Google Scholar] [CrossRef]
- Liu, X.F.; Ren, H.-H.; Liu, S.-H.; Jiang, X.-J. Characterizing key agents in the cryptocurrency economy through blockchain transaction analysis. EPJ Data Sci. 2021, 10, 21. [Google Scholar] [CrossRef]
- Song, W.S.; Zhang, W.Y.; Wang, J.R.; Zhai, L.B.; Jiang, P.K.; Huang, S.Y. Blockchain Data Analysis from the Perspective of Complex Networks: Overview. Tsinghua Sci. Technol. 2023, 28, 176–206. [Google Scholar] [CrossRef]
- Wu, Z.; Liu, J.; Wu, J.; Zheng, Z.; Chen, T. TRacer: Scalable Graph-Based Transaction Tracing for Account-Based Blockchain Trading Systems. IEEE Trans. Inf. Forensics Secur. 2023, 18, 2609–2621. [Google Scholar] [CrossRef]
- Dearden, T.E.; Tucker, S.E. Follow the money: Analyzing darknet activity using cryptocurrency and the bitcoin blockchain. J. Contemp. Crim. Justice 2023, 39, 257–275. [Google Scholar] [CrossRef]
- Xia, L.L.; Wang, Q.; Ma, Z.; Song, B. Digital token transaction tracing method. In Proceedings of the Emerging Information Security and Applications, EISA, Changzhou, China, 18–19 October 2024; pp. 107–117. [Google Scholar] [CrossRef]
- Jing, Z.; Gu, C.; Ge, C.; Shi, P. Cryptanalysis of a Public Key Cryptosystem Based on Data Complexity under Quantum Environment. Mobbile Netw. Appl. 2021, 26, 1609–1615. [Google Scholar] [CrossRef]
- Xiao, R.; Ren, W.; Zhu, T.; Choo, K.-K.R. A mixing scheme using a decentralized signature protocol for privacy protection in bitcoin blockchain. IEEE Trans. Dependable Sec. Comput. 2021, 18, 1793–1803. [Google Scholar] [CrossRef]


Disclaimer/Publisher’s Note: The statements, opinions and data contained in all publications are solely those of the individual author(s) and contributor(s) and not of MDPI and/or the editor(s). MDPI and/or the editor(s) disclaim responsibility for any injury to people or property resulting from any ideas, methods, instructions or products referred to in the content. |
© 2025 by the authors. Licensee MDPI, Basel, Switzerland. This article is an open access article distributed under the terms and conditions of the Creative Commons Attribution (CC BY) license (https://creativecommons.org/licenses/by/4.0/).