Article

Intrusion Detection System for IoT Using Logical Analysis of Data and Information Gain Ratio

by
Sneha Chauhan
1,2,*,
Sugata Gangopadhyay
1 and
Aditi Kar Gangopadhyay
3
1
Department of Computer Science and Engineering, Indian Institute of Technology-Roorkee, Roorkee 247667, India
2
Department of Computer Science and Engineering, National Institute of Technology Uttarakhand, Srinagar 246174, India
3
Department of Mathematics, Indian Institute of Technology-Roorkee, Roorkee 247667, India
*
Author to whom correspondence should be addressed.
Cryptography 2022, 6(4), 62; https://doi.org/10.3390/cryptography6040062
Submission received: 15 October 2022 / Revised: 17 November 2022 / Accepted: 1 December 2022 / Published: 5 December 2022
(This article belongs to the Special Issue Cyber Security, Cryptology and Machine Learning)

Abstract

:
The rapidly increasing use of the internet has led to an increase in new devices and technologies; however, attack and security violations have grown exponentially as well. In order to detect and prevent attacks, an Intrusion Detection System (IDS) is proposed using Logical Analysis of Data (LAD). Logical Analysis of Data is a data analysis technique that classifies data as either normal or an attack based on patterns. A pattern generation approach is discussed using the concept of Boolean functions. The IDS model is trained and tested using the Bot-IoT dataset. The model achieves an accuracy of 99.98%, and is able to detect new attacks with good precision and recall.

1. Introduction

With the internet now playing a significant role in every field of life, whether education, military, finance, medicine, industry, or otherwise, the risk of security violations is increasing daily. Cyberattacks are becoming a challenging issue nowadays, with attackers developing new ways of attacking devices using new technologies. Thus, a better system is required to detect and prevent such attacks in real time.
The use of the internet has led to the deployment of Internet of Things (IoT) devices in smart homes, smart grids, cyber–physical systems, and healthcare systems [1]. The IoT is a group of interconnected physical devices that are equipped with processor, memory, and network cards and managed by web services or other interfaces [2]. Such devices are rapidly becoming used in business processes. An increase in the use of IoT devices attracts cyberattackers to exploit the weaknesses of these devices. The standardization of the security of IoT devices is yet to be defined, which adds to their security weaknesses. As new IoT technologies are emerging daily, the number of such devices is increasing as well, leading to security vulnerabilities.
An Intrusion Detection System (IDS) is used to detect attacks in a network by monitoring patterns in order to detect attacks. These patterns can be of normal traffic or abnormal traffic. An IDS deployed in an IoT environment has to monitor the traffic and alert the system administrator when abnormal traffic is observed. Because IoT devices are small, with low memory and processing power, the main aim is to keep the processing load to a minimum. Hence, host-based intrusion detection systems should be avoided in the IoT environment. Network-based intrusion detection systems can be used at the network boundary to monitor the traffic entering IoT devices. Such an intrusion detection system works based on two mechanisms, namely, anomaly detection and misuse detection. Misuse detection systems use predefined attack patterns to detect new attacks. In this case, zero day attacks cannot be detected. Anomaly detection system are based on the patterns of normal observations, making them more effective in detecting zero day attacks; however, they have high false positive rates [3].
Many IDS variants have been developed using machine learning-based approaches. These models are trained on large datasets in order to identify the patterns that can be used to classify unknown traffic data as either abnormal and normal. In the case of IoT devices, there is a need for an IDS that can run on low-power systems. Logical Analysis of Data (LAD) is a classification technique that uses the concept of partially defined Boolean functions. It is a binary classification process in which patterns are generated that can classify an observation as normal or an attack. The patterns are a simple combination of the features that influence the classification the most. The main advantage of Logical Analysis of Data is that it provides an explanation of how a certain phenomenon works and what features are involved in the attack. Thus, knowledge of system vulnerabilities can be obtained using LAD.
In this paper, we develop an IDS model to detect malicious traffic in a network using the Bot-IoT dataset. Logical Analysis of Data is used along with the Information Gain ratio technique to select important features and generate patterns to classify the unknown observations. The IDS model is used as a binary classifier. A LAD-based IDS model is designed and tested for different types of attacks. The main contributions of this paper are as follows:
  • A LAD-based IDS model designed using the information gain ratio method for feature selection. The IDS model is used to classify data as normal or attack.
  • An improvised pattern generation technique is described based on different binary combinations.
  • Further, different LAD classifiers are developed to detect different types of attacks in the Bot-IoT dataset. The performance of the LAD-based IDS model is compared with existing machine learning techniques on the Bot-IoT dataset.
The rest of this paper is divided into five sections. Section 2 provides a brief overview of the work carried out on IDS models and Bot-IoT dataset. Section 3 describes the Logical Analysis of Data technique and the use of the gain ratio method to generate the supporting set of features, then defines the pattern generation algorithm. The experimental results are stated in Section 4. Finally, the paper is concluded in the Section 5.

2. Related Work

This section provides an overview of related studies on the Bot-IoT dataset, focusing on machine learning-based approaches. Ferrag et al. [4] have presented a comprehensive survey of deep learning approaches implemented for cybersecurity intrusion detection with a focus on two new datasets, including the Bot-IoT dataset.
Shafiq et al. [5] proposed a new framework model, CorrAUC, based on a combination of the correlation attribute evaluation (CAE) metric and the area under the curve (AUC) to filter the features accurately. On this basis, the authors developed a new feature selection algorithm based on the wrapper technique for selecting effective features for malicious Bot-IoT traffic identification. They were able to find five optimum feature sets with discriminative power for detection of malicious attacks.
Another study by Shafiq et al. [6] used the Bot-IoT dataset to identify cyberattacks in IoT networks. The authors extracted a set of 44 effective features and utilized five different ML algorithms, namely, naive Bayes, BayesNet, C4.5 decision tree, random tree, and random forest for analysis. Lastly, the authors used a bijective soft set for selection and decision making from the implemented machine learning algorithms.
Leevy et al. [7] developed an easy-to-learn approach for the Bot-IoT dataset, using only three features out of 29, and implemented a decision tree classifier. Another study presented by Satish Pokhrel et al. [8] used different machine learning algorithms, such as a Multilayer Perceptron Artificial Neural Network (MLP-ANN), naive Bayes model, and K-Nearest Neighbor (KNN) to develop a model. The authors implemented a combination of feature engineering and SMOTE with the machine learning algorithms, and selected the best algorithm using a reference point based on accuracy and the ROC-AUC performance metric. The authors further applied this model on real-time balanced and imbalanced datasets for performance comparison to demonstrate the impact of data imbalance and how it affects different metrics such as f1-score, accuracy, precision, and recall.
Another research study [3] proposed a feature selection algorithm to select important features, called correlated-set thresholding gain ratio (CST-GR), which the authors implemented on a Raspberry Pi. This algorithm enables detection systems to work with very few features, making them lightweight and fast. The authors observed that the proposed CST-GR algorithm achieved good accuracy and significantly reduced processing time.
In [9], the authors developed a multivariate Intrusion Detection System (IDS) capable of providing access control and outlier detection methods to detect anomalous behaviour in IEC-104. The IEC protocol is used in SCADA systems where there are no sufficient authorization mechanisms. This weakness can be exploited by attackers to control field devices. Three outlier detection algorithms, One Class-Support Vector Machine (OC-SVM), LOF, and Isolation Forest, were evaluated. The IDS achieved an accuracy and F1 score of 98% and 87%, respectively.
In [10], the authors described a learning recurrent Random Neural Network (RNN) for building a lightweight detector that can detect attacks on IoT systems. Their experiment was performed using the 5% version of the Bot-IoT dataset, and a 96% detection rate was achieved using this method.
In [11], the authors proposed a hybrid anomaly mitigation framework using fog computing to detect anomalies. The framework used both signature based and anomaly based method. The signature-based method used a database of blacklisted IP addresses to detect attacks faster, whereas the anomaly-based method used a gradient boosting algorithm to classify the network traffic into attack and normal. The XGBoost classifier achieved an accuracy of 99%.
In [12], the authors provided a comparison of the performances of the two deep learning models, namely, a Self-normalizing Neural Network (SNN) and a Feed-forward Neural Network (FNN), using the Bot-IoT dataset. The FNN performed better than the SNN, as shown by various performance metrics and the Cohen Cappas score. The authors studied the performance of these models against the adversarial samples from the Bot-IoT dataset. The results showed that SNN performed better than FNN against adversarial attacks.

3. Logical Analysis of Data

Logical analysis of data is a technique for data analysis that analyses the subset of the combination of an observation’s feature variables (binary variables) in order to identify unique patterns that can be used to detect the positive or negative nature of an unknown observation. Earlier, this approach was applied only to binary data. More recently, however, it has been extended to incorporate non-binary data. A description of the LAD technique is provided below.
Consider a dataset of binary values having a set of true observations Ω + and a set of false observations Ω ( Ω + Ω 0 , 1 n ). Each observation has n + 1 binary attributes, in which the last bit represents the label. Thus, a collection of binary observations can be illustrated by a partially defined Boolean function (pdBf) ϕ . As such, finding an extension f of the pdBf is the main aim of LAD; this helps in the classification of unknown observations in the sample space. However, this is not achievable, and thus we have tried to find an extension f′ that closely approximates extension f on the basis of optimality criteria. Extension of pdBf is expressed in a disjunctive normal form (DNF), for example, b 1 b 2 - . LAD requires the following steps to build a classifier [13]:
  • Binarization of observations.
  • Support set generation.
  • Pattern generation.
  • Classifier design.
In the real world, data are not always in binary form. Thus, in order to make LAD applicable to non-binary data, an approach is proposed to convert non-binary data to binary data in Section 3.1. In Section 3.2, an approach to generate a support set is proposed. Finally, in Section 3.3 an improvised pattern generation approach is proposed that covers almost every observation that leads to the formation of a smaller number of patterns. Thus, the theory formation step is not required.

3.1. Binarization of Observations

To transform the numerical attributes to binary attributes, a cut-point or threshold-based approach is proposed in [14]. The level variable and interval variable are the two types of Boolean variables correlated to every numerical attribute x. The level variables are directly related to the cut-points which show that the initial value of the attribute is greater or smaller than the given cut-point β . A Boolean variable b ( x , β ) is a level variable associated with an attribute x using a cut-point β , such that
b ( x , β ) = 1 , if x β 0 , otherwise
The level variable takes a value of either 0 or 1 depending on whether the attribute value is larger or smaller than the cut-point. In the same way, for a pair of cut-points β 1 and β 2 , an interval variable b ( x , β 1 , β 2 ) is associated with the corresponding attribute x such that
b ( x , β 1 , β 2 ) = 1 , if β 1 x < β 2 0 , otherwise
For the generation of cut-points, consider a numerical attribute x having k + 1 unique values which are arranged in descending order such that
x 0 > x 1 > . . . > x k
A cut-point is introduced between every two consecutive values x i and x i + 1 if they have different labels using the following equation:
β j x = 1 2 ( x i + x i + 1 )
An example is shown below to demonstrate the cut-point generation process. Table 1 shows a sample dataset with six features and one label column. It has two classes, 0 and 1. In order to perform binarization, each attribute is considered separately. Here, we use a feature F to describe how cut-points for this feature are calculated. First, the values of feature F are arranged in descending order. It is shown in the second sub-table of Table 2. It can be seen that same two values, i.e., 0, of feature F have different class labels. Thus, we combine these two rows and provide this 0 value with a new label, 2, as we already have two labels, 0 and 1. Now, the cut-points are calculated between those feature values which have different class labels.
The cut-points obtained for feature F using the process explained above are β 1 F = 0.6, β 2 F = 0.1. Similarly, the rest of the numerical attributes provided in the Table 1 must be binarized. The level variables and interval variables generated are shown in Table 3 and Table 4, respectively.
To transform a nominal attribute x, a binary variable b ( x , u i ) is associated with each distinct value u i of nominal attribute such that
b ( x , u i ) = 1 , if x = u i 0 , otherwise
An example of nominal attributes is shown in Table 5.

3.2. Support Set Generation

After binarization of the non-binary attributes, the retrieved binary dataset is very likely to have irrelevant attributes, that is, absence of such attributes does not affect the final result. Thus, the objective of this section is the removal of the irrelevant attributes from the set of binary attributes to obtain a set of redundant free attributes, which is called a minimal support set. The general characteristic of the observation is maintained, i.e., an observation does not have a negative and positive nature at the same time. The support set problem can be considered similar to solving the set cover problem.
A number of algorithms that aim to solve the set cover problem are discussed in [15,16]. In order to find a minimal support set for our binary dataset, we propose the use of the Information Gain ratio to select the best attribute in our dataset. The gain ratio is used by the C4.5 algorithm to select the best feature for building the decision tree [17]. The information gain ratio of each attribute is calculated based on its entropy. The attribute having the highest information gain ratio is added to the support set. The entropy for binary classification is calculated using Equation (6), where D represents the dataset. Assuming that a feature X has n distinct values, the dataset can be partitioned into n disjoint subsets. The information gain of a feature X in dataset D is calculated by Equation (7) using the entropy given in Equation (6). In order to find the gain ratio, we use the split information in Equation (8) to normalize the information gain [17,18]:
E ( D ) = ( P ( 0 ) l o g 2 ( P ( 0 ) ) + P ( 1 ) l o g 2 ( P ( 1 ) ) )
Info-Gain   ( D , X ) = E ( D ) i = 0 n | D i | | D | E ( x )
SplitInfo ( A ) = j = 1 n | D j | | D | l o g 2 | D j | | D | Gain Ratio = Info-Gain   ( D , X ) / SplitInfo ( A )

3.3. Improvised Pattern Generation

Before entering into the depths of pattern generation, there is particular terminology that must be understood. A Boolean variable or its negation is called a literal, and a combination of such literals is called a term. The number of literals in a term is called the degree of a term. A unique term of degree n is called a characteristic term. A term is considered to be a positive pattern if it covers at least one true observation and zero false observation. A negative pattern can be defined in a similar way. In [18], the authors explain the pattern generation process. Two approaches are used for pattern generation. The bottom-up approach starts with a single literal. If this literal covers only positive (negative) observations, then it is termed a positive (negative) pattern. Otherwise, another literal is added to it until a pattern is obtained, and this process is repeated until most of the observations have been covered. The top-down approach begins with a characteristic term. This term is already a pattern, as it covers either positive or negative observation. The literals are removed from this term one by one until a pattern is obtained covering only positive (negative) observations. Both approaches can be used to cover maximum observations.
Here, we have tried to follow a different procedure to generate patterns. In the proposed pattern generation process, an improvised bottom-up approach is followed. The algorithm is described in Algorithm 1. This algorithm tries to find various combinations of 0 and 1. Each combination is supposed to cover few observations; obs_positive and obs_negative denotes the minimum number of positive and negative observations which must be covered by a term in order to consider it as a positive or negative pattern. All the observations that correspond to a combination are stored, then the unique values covered by this combination are counted. If the label of all these covered observations is 1 and number of observations is greater than obs_positive, then it is a positive pattern. Otherwise, if the label is 0 and number of observations are greater than obs_negative, it is added to the list of negative patterns. These covered observations are then deleted from the dataset and the process is repeated for a new combination.
Here, we generate patterns with a maximum degree of 3. The minimum coverage of true and false observations are 10 and 1 for the generation of positive and negative patterns, respectively. This threshold is obtained by empirical analysis, and changes depending on the dataset. In our algorithm, we expect that maximum number of observations is covered by a unique pattern. The values have been fixed after performing the experiment number of times with different values. Considering the example above, using the support set b 1 , the positive pattern generated is b 1 - .
Algorithm 1 Pattern Generation Algorithm.
Cryptography 06 00062 i001

3.4. Classifier Design

The patterns generated in the pattern generation step are transformed into rules that form the classifier. A rule formed using the pattern obtained by b 1 - is ( A < 99.5 ) ⇒ label = 1. Thus, the corresponding pseudo-code is
  • if  A < 99.5 then
  •     Label = 1
  • end if
Nested if–else can be used to design a classifier using more than one positive rule. In a similar way, a classifier can be designed using negative rules, or a hybrid classifier can be designed using both positive and negative rules.

4. Results and Discussion

4.1. Dataset

Several datasets have been introduced in the intrusion detection literature, among which are KDD-CUP99, NSL-KDD, UNSW-NB15, CIC-DoS-2017, and CSE-CIC-IDS. There is a lack of availability of realistic datasets, which is a major challenge when working on IDS models. Organizations hesitate to disclose their network traffic data due to privacy concerns, as it can reveal sensitive configuration information. The KDD-CUP99 dataset is the most widely used dataset for evaluating intrusion detection models. However, KDD-CUP99 suffers from several weaknesses, including redundant rows, irrelevant features, and the non-stationary nature of the dataset [19]. NSL-KDD is a refined version of the KDD-CUP99 dataset which has only selected records, and overcomes the drawbacks of KDD-CUP99 dataset. However, NSL-KDD dataset lacks observations related to low-footprint attacks and modern cyberattacks. The UNSW-NB15 dataset has modern cyberattacks included in it. The CIC-DoS-2017 has records of DoS attacks, as there has been an increase in such attacks. The CSE-CIC-IDS consists of seven different types of attacks. However, there are no datasets specific to IoT used for IDS evaluation. The Bot-IoT dataset focuses on IoT network architecture. It has five types of classes: DDoS, DoS, Reconnaissance, Theft, and Normal [2]. The dataset has 72 million rows and 46 features, including three class categories. Because large dataset size can hinder computation, a 5% version of the original dataset has been released. In this study we use the smaller dataset, which has only the ten best features, meaning that a few irrelevant features have been discarded. The feature selection process is described in Appendix A. As LAD is a binary classification technique, in our experiments all attacks are denoted by 1 and normal observations are denoted by 0.

4.2. Experimental Setup

All experiments were performed on a laptop computer with 24 GB RAM and an Intel i5 processor. The training dataset contained 1,048,576 observations, ten features, and a class label. The testing dataset contained 733,706 rows with ten features. The dataset was preprocessed by removing duplicate rows. In the binarization process, only level variables were generated. This was done in order to reduce the number of binary variables and keep the size of the dataset small. In order to cover the maximum number of observations for a pattern, we considered a support set of ten positive (attack) observations, meaning each pattern must cover at least ten positive observations in order to become a prime pattern. The parameters used to evaluate the performance of our intrusion detection model are accuracy, recall, precision, and F1-score. The confusion matrix considered for our experiment is shown in Table 6.

4.3. Performance Evaluation Metrics

Many experiments were conducted to evaluate the performance and efficiency of the LAD-based IDS, for which we used the metrics defined below:
Accuracy = T N + T P F P + F N + T P + T N
Precision = T P T P + F P
Recall = T P F P + F N
F 1 -score = 2 × precision × recall precision + recall
Here, TP stands for True Positive, which means that samples are correctly classified as an attack, TN stands for True Negative, meaning that the samples are classified as normal data, FP denotes False Positive, which indicates that normal samples are incorrectly identified as an attack, and FN refers to False Negative, which indicates that attack samples were wrongly identified as normal data [20].

4.4. Experimental Results

During the binarization step of LAD, 751 binary variables were generated. Only those features with cutpoints less than 175 were considered. This was done to limit the number of level variables in order to avoid long computation. A large number of cutpoints for a feature indicate that there is more randomness in the feature, which means that it does not influence the classification process. Such features were eliminated during the binarization phase.
The next step is support set generation, in which redundant variables are removed. The information gain ratio method was used to obtain the support set of features, with a total of 23 features selected.
In the pattern generation step, positive and negative patterns were generated. Algorithm 1 was used to generate the patterns. Eight positive patterns and six negative patterns of degrees 2 and 3 were generated. Here, each positive pattern covers at least ten positive observations and no negative observation. Similarly, negative observations cover at most one negative observation. A hybrid classifier was built using both positive and negative patterns together and tested on the Bot-IoT test dataset.
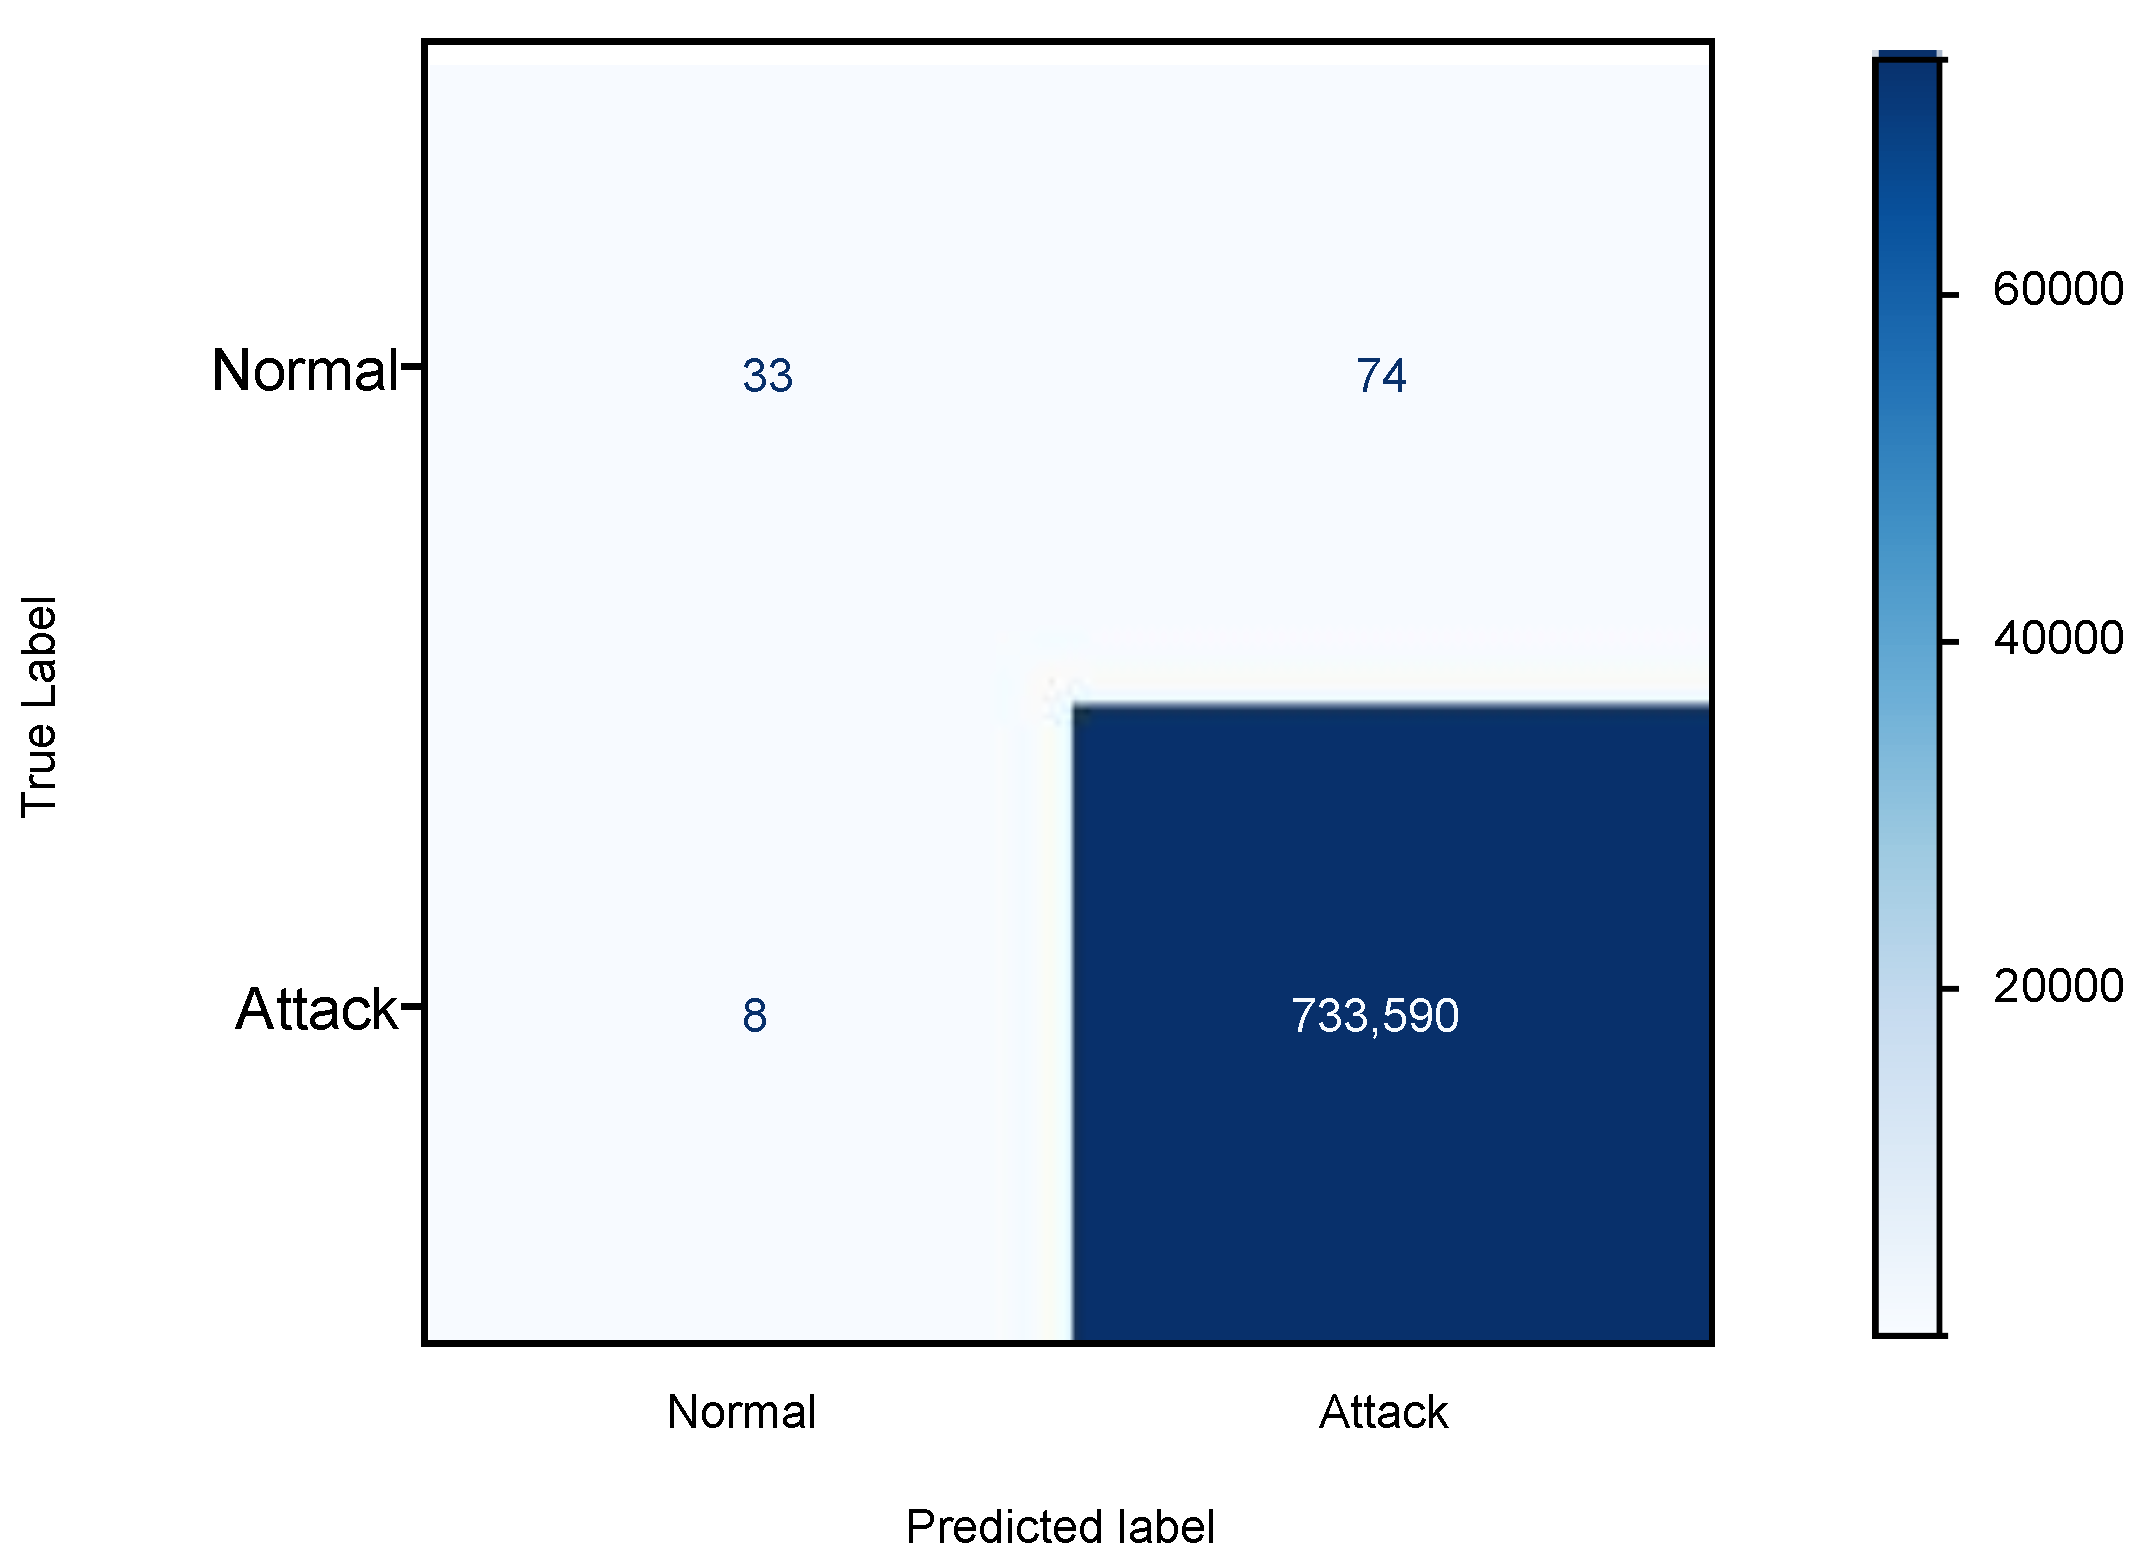
The classifier has fourteen rules, which were validated using the test dataset. The confusion matrix for the Bot-IoT test dataset is shown in Figure 1. It can be concluded from Figure 1 that the normal observations are far fewer compared to the attack observations in the test dataset. While most of the attack observations are classified correctly, 74 normal observations are misclassified as attacks. The LAD-based IDS has an accuracy of 99.98% and recall of 99.99%. As the training dataset has a higher number of attack observations compared to normal observations, our IDS model is able to detect attacks 99% correctly. Normal observations have been misclassified due to a lower number of normal records in the training dataset, and thus the false positive rate is high. The precision and F1 score values in Table 7 are 99.98% and 99.99%, respectively. The False Positive Rate (FPR) is 69.15%, which is very high, and is due to misclassification of normal (negative) instances. This could be reduced if a greater number of normal observations were present in the training dataset. The False Negative Rate (FNR) is 0.001%, which shows that very few attack (positive) instances were misclassified as normal (negative).
The performance of our LAD-based IDS model was compared with various machine learning and deep learning techniques, as shown in Table 8. In [4], the authors used a Convolutional Neural Network (CNN), Recurrent Neural Network (RNN), and Deep Neural Network (DNN) on the 5% Bot-IoT dataset, achieving an accuracy of 98.37%, 98.31%, and 98.22%, respectively. In [2], Support Vector Machine (SVM), Recurring neural network (RNN), and Long Short-Term Memory RNN (LSTM) were used, obtaining an accuracy of 88.37%, 99.74%, and 99.74%, respectively. The precision of RNN (99.99%) and LSTM (99.99%) were higher than our LAD-based IDS (99.89%). The accuracies of Gaussian Naive Bayes, K-Nearest Neighbour (KNN), and Multi-layer Perception–Artificial Neural Network (MLP-ANN) were 99.4%, 99.6%, and 87.4%, respectively. Thus, it can be concluded that the LAD-based IDS model performed well on the Bot-IoT dataset with an accuracy of 99.98%. The recall of 99.99% shows that the attacks were correctly classified by our IDS model.
We developed a LAD classifier for each category of attack in the Bot-IoT dataset. The dataset consists of four types of attack: DDoS, DoS, Reconnaissance, and Theft. Four different datasets were created by separating all the attack types along with normal observations. These datasets were used to train four LAD classifiers. Each LAD classifier was tested against its attack type and again using the entire test dataset. Table 9 shows the results of all the LAD classifiers for specific attacks and the whole test dataset. The LAD classifiers developed for DDoS, DoS, and Reconnaissance attacks perform well on the entire dataset, which means that the LAD classifier is able to classify unknown attacks even when these attacks are not present in the training set. The classifier for Theft attacks performs well when detecting theft attacks on the test dataset, although it is not able to classify other attacks; however, its precision is 100%, which shows that all the normal instances are correctly classified. The performance of this classifier is low on the entire dataset, because its training set did not contain other types of attacks and because the size of the dataset is very small. This performance can be improved by using a larger number of theft instances. The False Positive rate for the DoS and Reconnaissance LAD classifiers is high due to misclassification of normal observations. These four classifiers were built using different datasets of specific attack types. Hence, the features involved in the detection of these attacks are quite different. Appendix B discusses the features used to detect specific types of attacks. The Bot-IoT dataset has a higher number of attack observations compared to normal instances. Classifiers built on this dataset have low false negative rates, as they are able to classify all the attacks correctly.

5. Conclusions

Our paper focuses on developing an Intrusion Detection System for IoT environments. The Bot-IoT dataset is used to train and test an IDS model. The IDS model is built using the Logical Analysis of Data technique. LAD uses binary data to produce patterns for classification of new data into normal and abnormal traffic. The binarization process is used to convert numerical data into binary. The information gain ratio criteria is used to select features that have high discriminating power. In addition, a new way of generating patterns is discussed in this paper. This algorithm describes the process of pattern generation using different combinations of binary variables. The classifier is built using the positive and negative patterns. This LAD classifier performs significantly well in comparison to other state-of-the-art techniques, with an accuracy of 99.98% and an F1 score of 99.99%. We can conclude that our LAD-based IDS model can detect attacks in near-real time and provide insight about vulnerabilities in the system through its patterns. The results of the classifiers trained for each type of attack show that our LAD-based IDS model is able to detect new attacks. The LAD method uses a lower amount of data to train and develop the classifier. This is an advantage, as large amounts of data are difficult to manage and are often not easily available. In future research, the LAD technique used here could be further enhanced by using different techniques to obtain the support set, while the performance metrics could be improved by using a more balanced dataset.

Author Contributions

Conceptualization, visualization, supervision, S.G. and A.K.G.; methodology, software, validation, writing—original draft preparation, S.C. All authors have read and agreed to the published version of the manuscript.

Funding

This research received no external funding.

Institutional Review Board Statement

Not applicable.

Informed Consent Statement

Not applicable.

Data Availability Statement

The Bot-IoT dataset that supports the findings of this study is available at https://research.unsw.edu.au/projects/bot-iot-dataset (accessed on 27 August 2022).

Conflicts of Interest

The authors declare no conflict of interest.

Appendix A

The Bot-IoT dataset consists of 72 million rows and 46 features, including three label features. This dataset size is too large and difficult to handle. Thus, the authors of [2] extracted 5% of the original dataset. This 5% dataset, which is the training and testing set, has three million rows. In order to reduce the dimensionality of the dataset, feature selection was carried out by calculating the Correlation Coefficient and Joint Entropy between the features. A feature was selected if its entropy score was high and its correlation coefficient score was low. The ten best features which had the highest combined average correlation coefficient and joint entropy were extracted; REF. [2] describes all the features and feature selection techniques. Table A1 provides the details of all the features. Out of these 43 features, the best features that were selected are: seq, stddev, N_IN_Conn_P_SrcIP, N_IN_Conn_P_DstIP min, state_number, mean, srate, drate, and max. As LAD is a binary classification technique, we removed category and subcategory features.
Table A1. Selected features of the dataset.
FeaturesDescription
pkSeqIDRow Identifier
StimeRecord start time
flgsFlow state flags seen in transactions
flgs_numberNumerical representation of feature flags
ProtoTextual representation of transaction protocols present in network flow
proto_numberNumerical representation of feature proto
saddrSource IP address
sportSource port number
daddrDestination IP address
dportDestination port number
pktsTotal count of packets in transaction
bytesTotal number of bytes in transaction
stateTransaction state
state_numberNumerical representation of feature state
ltimeRecord last time
seqArgus sequence number
durRecord total duration
meanAverage duration of aggregated records
stddevStandard deviation of aggregated records
sumTotal duration of aggregated records
minMinimum duration of aggregated records
maxMaximum duration of aggregated records
spktsSource-to-destination packet count
dpktsDestination-to-source packet count
sbytesSource-to-destination byte count
dbytesDestination-to-source byte count
rateTotal packets per second in transaction
srateSource-to-destination packets per second
drateDestination-to-source packets per second
TnBPSrcIPTotal Number of bytes per source IP
TnBPDstIPTotal Number of bytes per Destination IP
TnP_PSrcIPTotal Number of packets per source IP
TnP_PDstIPTotal Number of packets per Destination IP
TnP_PerProtoTotal Number of packets per protocol
TnP_Per_DportTotal Number of packets per dport
AR_P_Proto_P_SrcIPAverage rate per protocol per Source IP (calculated by pkts/dur)
AR_P_Proto_P_DstIPAverage rate per protocol per Destination IP
N_IN_Conn_P_SrcIPNumber of inbound connections per source IP
N_IN_Conn_P_DstIPNumber of inbound connections per destination IP
AR_P_Proto_P_SportAverage rate per protocol per sport
AR_P_Proto_P_DportAverage rate per protocol per dport
Pkts_P_State_P_Protocol_P_DestIPNumber of packets grouped by state of flows and protocols per destination IP
Pkts_P_State_P_Protocol_P_SrcIPNumber of packets grouped by state of flows and protocols per source IP
attackClass label: 0 for Normal traffic, 1 for Attack Traffic
categoryTraffic category
subcategoryTraffic subcategory
The Logical Analysis of Data technique uses this dataset to develop the classifier. The support set of features consists of the binary variables that correspond to these ten features of the original dataset. The pattern generation process produces patterns that are combinations of these features. The features used in the patterns to build the LAD classifier are: state_number, min, seq, N_IN_Conn_P_DstIP, mean, srate and N_IN_Conn_P_SrcIP.

Appendix B

The Bot-IoT dataset consists of four types of attack observations. DDoS, DoS, Reconnaissance, and Theft are the categories of attacks in the dataset. To develop an LAD-based IDS, these attack categories were combined into one and labelled as 1, whereas normal observations were labelled as 0. Further, for each type of attack a different LAD classifier was developed by training on that specific type of attack. Four different LAD classifiers were built for detecting different type of attacks. To develop these LAD classifiers, different sets of patterns were generated involving different features. Table A2 shows the different sets of features used by the different LAD classifiers corresponding to the different types of attacks.
Table A2. Features involved in various attacks.
AttackFeatures Involved in the Attack
DDoSstddev, seq, N_IN_Conn_P_DstIP
DoSseq, mean, state_number, drate, srate
Reconnaissanceseq, N_IN_Conn_P_SrcIP, state_number, mean, N_IN_Conn_P_DstIP, drate, srate
Theftseq, min, state_number

References

  1. Moustafa, N.; Turnbull, B.; Choo, K.K.R. Towards Automation of Vulnerability and Exploitation Identification in IIoT Networks. In Proceedings of the 2018 IEEE International Conference on Industrial Internet (ICII), Seattle, WA, USA, 21–23 October 2018; pp. 139–145. [Google Scholar] [CrossRef]
  2. Towards the development of realistic botnet dataset in the Internet of Things for network forensic analytics: Bot-IoT dataset. Future Gener. Comput. Syst. 2019, 100, 779–796. [CrossRef] [Green Version]
  3. Soe, Y.N.; Feng, Y.; Santosa, P.I.; Hartanto, R.; Sakurai, K. Towards a Lightweight Detection System for Cyber Attacks in the IoT Environment Using Corresponding Features. Electronics 2020, 9, 144. [Google Scholar] [CrossRef] [Green Version]
  4. Deep learning for cyber security intrusion detection: Approaches, datasets, and comparative study. J. Inf. Secur. Appl. 2020, 50, 102419. [CrossRef]
  5. Shafiq, M.; Tian, Z.; Bashir, A.K.; Du, X.; Guizani, M. CorrAUC: A Malicious Bot-IoT Traffic Detection Method in IoT Network Using Machine-Learning Techniques. IEEE Internet Things J. 2021, 8, 3242–3254. [Google Scholar] [CrossRef]
  6. Selection of effective machine learning algorithm and Bot-IoT attacks traffic identification for internet of things in smart city. Future Gener. Comput. Syst. 2020, 107, 433–442. [CrossRef]
  7. Leevy, J.L.; Hancock, J.; Khoshgoftaar, T.M.; Peterson, J.M. An Easy-to-Classify Approach for the Bot-IoT Dataset. In Proceedings of the 2021 IEEE Third International Conference on Cognitive Machine Intelligence (CogMI), Atlanta, GA, USA, 13–15 December 2021; pp. 172–179. [Google Scholar] [CrossRef]
  8. Pokhrel, S.; Abbas, R.; Aryal, B. IoT Security: Botnet detection in IoT using Machine learning. arXiv 2021, arXiv:2104.02231. [Google Scholar]
  9. Grammatikis, P.R.; Sarigiannidis, P.; Sarigiannidis, A.; Margounakis, D.; Tsiakalos, A.; Efstathopoulos, G. An anomaly detection mechanism for IEC 60870-5-104. In Proceedings of the 2020 9th International Conference on Modern Circuits and Systems Technologies (MOCAST), Bremen, Germany, 7–9 September 2020; pp. 1–4. [Google Scholar]
  10. Filus, K.; Domańska, J.; Gelenbe, E. Random neural network for lightweight attack detection in the iot. In Proceedings of the Symposium on Modelling, Analysis, and Simulation of Computer and Telecommunication Systems, Nice, France, 17–19 November 2020; pp. 79–91. [Google Scholar]
  11. Lawal, M.A.; Shaikh, R.A.; Hassan, S.R. An anomaly mitigation framework for iot using fog computing. Electronics 2020, 9, 1565. [Google Scholar] [CrossRef]
  12. Ibitoye, O.; Shafiq, O.; Matrawy, A. Analyzing adversarial attacks against deep learning for intrusion detection in IoT networks. In Proceedings of the 2019 IEEE Global Communications Conference (GLOBECOM), Waikoloa, HI, USA, 9–13 December 2019; pp. 1–6. [Google Scholar]
  13. Lejeune, M.; Lozin, V.; Lozina, I.; Ragab, A.; Yacout, S. Recent advances in the theory and practice of Logical Analysis of Data. Eur. J. Oper. Res. 2019, 275, 1–15. [Google Scholar] [CrossRef]
  14. Boros, E.; Hammer, P.L.; Ibaraki, T.; Kogan, A. Logical analysis of numerical data. Math. Program. 1997, 79, 163–190. [Google Scholar] [CrossRef]
  15. Crama, Y.; Hammer, P.L.; Ibaraki, T. Cause-effect relationships and partially defined Boolean functions. Ann. Oper. Res. 1988, 16, 299–325. [Google Scholar] [CrossRef] [Green Version]
  16. Almuallim, H.; Dietterich, T.G. Learning Boolean concepts in the presence of many irrelevant features. Artif. Intell. 1994, 69, 279–305. [Google Scholar] [CrossRef]
  17. Li, L.; Yu, Y.; Bai, S.; Hou, Y.; Chen, X. An Effective Two-Step Intrusion Detection Approach Based on Binary Classification and k -NN. IEEE Access 2018, 6, 12060–12073. [Google Scholar] [CrossRef]
  18. Chauhan, S.; Gangopadhyay, S. Design of Intrusion Detection System Based on Logical Analysis of Data (LAD) Using Information Gain Ratio. In Proceedings of the Cyber Security, Cryptology, and Machine Learning, Be’er Sheva, Israel, 30 June–1 July 2022; Dolev, S., Katz, J., Meisels, A., Eds.; Springer International Publishing: Cham, Switzerland, 2022; pp. 47–65. [Google Scholar] [CrossRef]
  19. Divekar, A.; Parekh, M.; Savla, V.; Mishra, R.; Shirole, M. Benchmarking datasets for Anomaly-based Network Intrusion Detection: KDD CUP 99 alternatives. In Proceedings of the 2018 IEEE 3rd International Conference on Computing, Communication and Security (ICCCS), Kathmandu, Nepal, 25–27 October 2018; pp. 1–8. [Google Scholar] [CrossRef] [Green Version]
  20. Moustafa, N.; Slay, J. The evaluation of Network Anomaly Detection Systems: Statistical analysis of the UNSW-NB15 data set and the comparison with the KDD99 data set. Inf. Secur. J. Glob. Perspect. 2016, 25, 18–31. [Google Scholar] [CrossRef]
Figure 1. Confusion matrix for IDS using LAD.
Cryptography 06 00062 g001
Table 1. Numerical attributes.
S. No.ABCDEFLabel
1001236111
22328153550.20.20
31994203032000
40012119001
5001669111
Table 2. Binarization: numerical data.
FLabel FLabel FLabel
11 11 11
0.20 11 11
000.200.20
01 00 02
11 01
Table 3. Binary attributes: level variable.
(A ≥ 99.5)(B ≥ 210)(C ≥ 75.5))(D ≥ 25.5)(D ≥ 5.5)(E ≥ 0.6)(E ≥ 0.1)(F ≥ 0.6)(F ≥ 0.1)Label
b1b2b3b4b5b6b7b8b9
a0010111111
b1100001010
c1101100000
d0010100001
e0010111111
Table 4. Binary attributes: interval variable.
(25.5 ≥ D ≥ 5.5)(0.6 ≥ E ≥ 0.1)(0.6 ≥ F ≥ 0.1)Label
b10b11b12
a1001
b0110
c0000
d1001
e1001
Table 5. Binarization: nominal data.
xb13 (x_A)b14 (x_B)b15 (x_C)Label
aA1001
bB0100
cB0100
dC0011
eA1001
Table 6. Confusion matrix.
Predicted Label
AttackNormal
True LabelAttackTrue PositiveFalse Negative
NormalFalse PositiveTrue Negative
Table 7. Performance of LAD-based IDS on Bot-IoT dataset.
Performance MetricPercentage (%)
Accuracy99.98
Recall99.99
Precision99.98
F1 Score99.99
FPR69.15
FNR0.001
Table 8. Performance comparison of LAD-based IDS with other machine learning and deep learning classifiers.
ClassifierAccuracy (%)Precision (%)Recall (%)
CNN [4]98.371
RNN98.311
DNN98.221
SVM [2]88.37210088.371
RNN99.74099.99099.749
LSTM99.74199.99199.750
Gaussian Naive Bayes [8]99.4
KNN99.6
MLP ANN87.4
LAD99.98899.98999.998
Table 9. Performance metrics of LAD Classifiers developed for each category of attack.
Type of ClassifierTest DatasetAccuracy (%)Precision (%)Recall (%)F1 Score (%)FPRFNR
Normal-DDoSDDoS99.9799.9999.9799.980.0090.0002
Full Test Dataset98.8799.9998.8799.430.0090.01
Normal-DoSDoS99.9799.9710099.980.900.0
Full Test Dataset99.9799.9899.9899.980.900.0001
Normal-ReconnaissanceReconnaissance99.5399.5499.9899.760.770.0001
Full Test Dataset99.9799.9899.9999.980.770.0009
Normal-TheftTheft99.1710092.8596.290.00.07
Full Test Dataset43.7110043.7160.830.00.56
Publisher’s Note: MDPI stays neutral with regard to jurisdictional claims in published maps and institutional affiliations.

