1. Introduction
A Physical Unclonable Function (PUF) is a next-generation hardware security primitive. Security protocols such as authentication and encryption can leverage the random bit string and key generation capabilities of PUFs as a means of hardening vulnerable mobile and embedded devices against adversarial attacks. Authentication is a process that is carried out between a hardware token (smart card) and a verifier (a secure server at a bank) that is designed to confirm the identities of one or both parties [
1]. With Internet of Things (IoT), there are a growing number of authentication applications in which the hardware token is resource constrained. Conventional methods of authentication that use area-heavy cryptographic primitives and non-volatile memory (NVM) are less attractive for these types of evolving embedded applications [
2]. PUFs, on the other hand, can address issues related to low cost because they can potentially eliminate the need for NVM. Moreover, the special class of
strong PUFs can further reduce area and energy overheads by eliminating cryptographic primitives that would otherwise be required.
A PUF measures parameters that are random and unique on each integrated circuit (IC), as a means of generating digital secrets (bit strings). The bit strings are generated in real time, and are reproducible under a range of environmental variations. The elimination of NVM for key storage and the tamper-evident property of PUFs to invasive probing attacks represent significant benefits for authentication applications in resource-constrained environments.
Many existing PUF architectures utilize a dedicated on-chip array of identically-designed elements. The parameters measured from the individual elements of the array are compared to produce a finite number of challenge–response pairs (CRPs). When the number of challenges is polynomial in size, the PUF is classified as weak. Weak PUFs require secure hash and/or other types of cryptographic functions to obfuscate the challenges, the responses, or both, when used in authentication applications. In contrast, the number of challenges is exponential for strong PUFs, making an exhaustive readout of the CRP space impractical. However, in order to be secure, a truly strong PUF must also be resilient to machine-learning algorithms, which attempt to use a subset of the CRP space to build a predictive model.
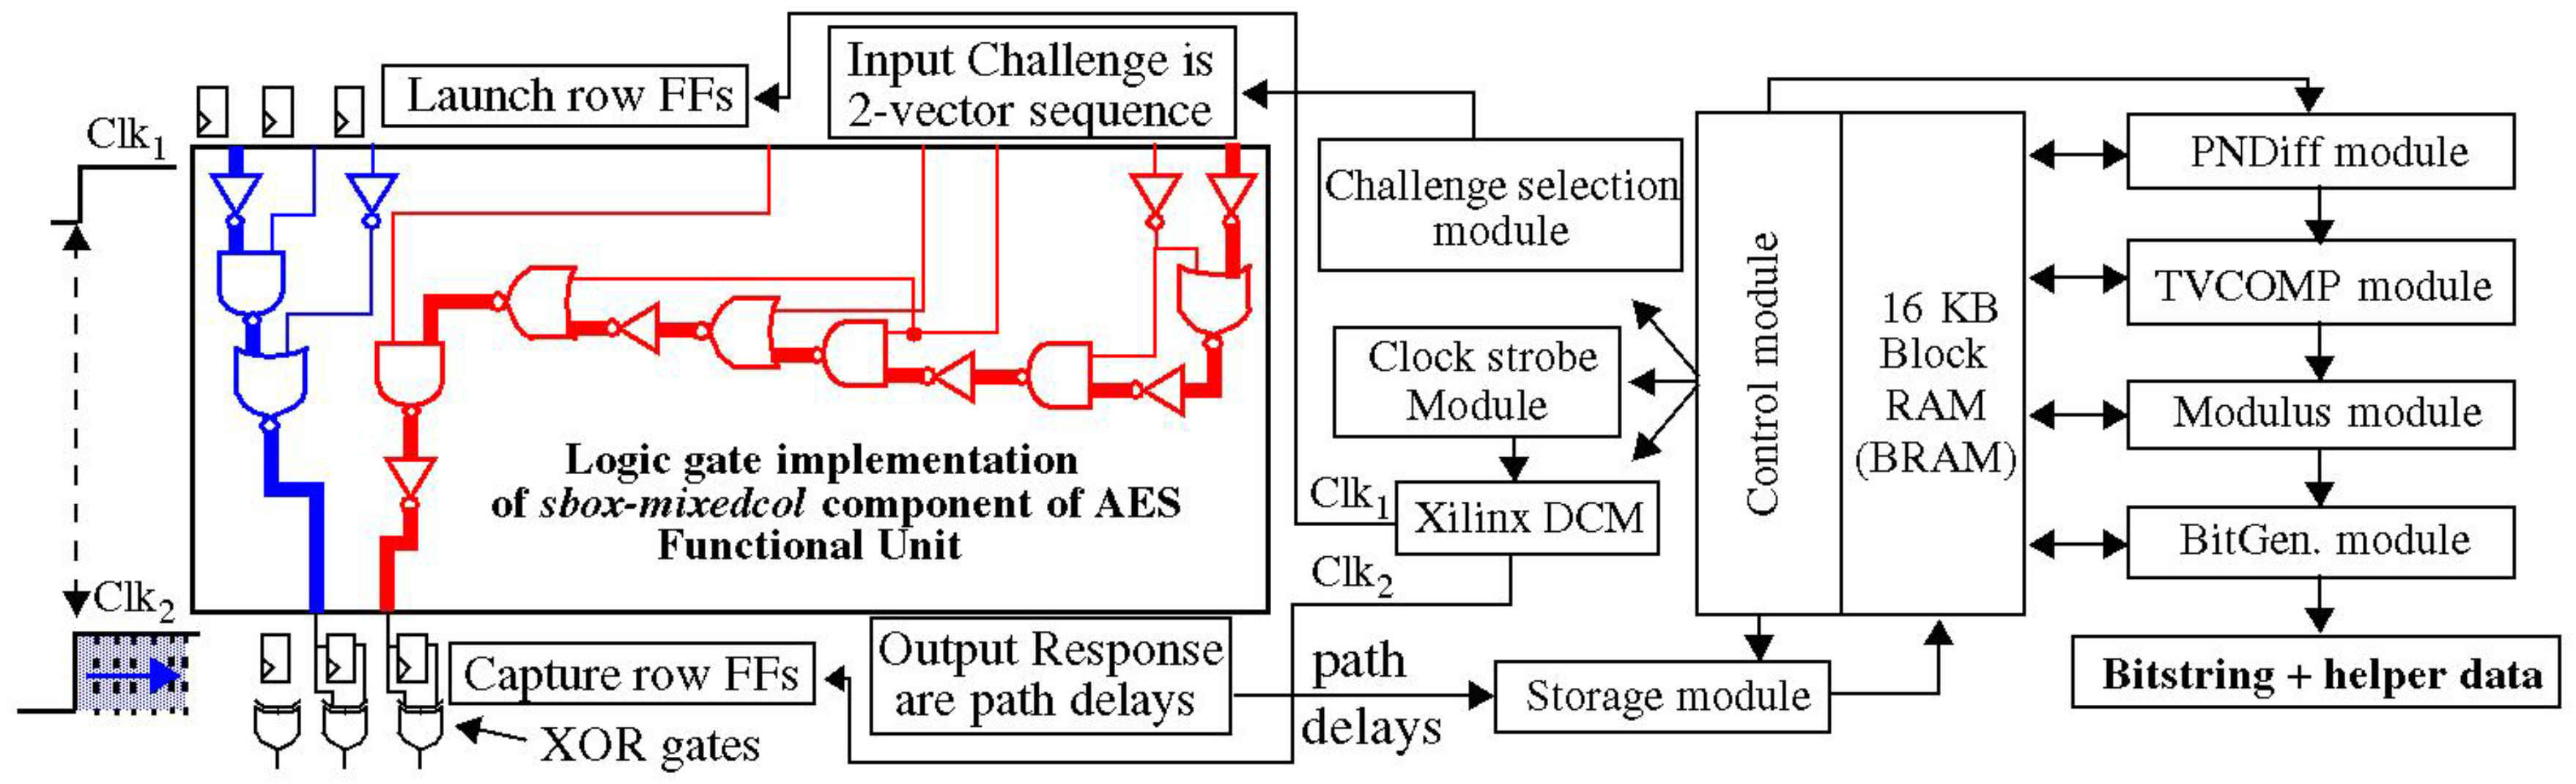
The Hardware-Embedded Delay PUF (HELP) analyzed in this paper generates bit strings from delay variations that occur along paths in an on-chip macro, such as the datapath component of the Advanced Encryption Standard (AES) algorithm. The HELP processing engine defines a set of configuration parameters that are used to transform the measured path delays into bit string responses. One of these parameters, called the Path-Select-Mask, provides a mechanism to choose k paths from n that are produced, which enables an exponential number of possibilities. However, resource-constrained versions of HELP typically restrict the number of paths to the range of 220. Therefore, the CRP space of HELP is not large enough to satisfy the conditions of a truly strong PUF, unless the HELP algorithm provides mechanisms to securely and significantly expand the number of path delays that can be compared to produce bit strings.
A key contribution of this work is an experimentally derived proof of a claim that a component of the HELP algorithm, called temperature–voltage compensation (TVCOMP), is capable of providing this expansion. TVCOMP is an operation carried out within the HELP bit string generation process that is designed to calibrate for variations in path delays introduced by changes in environmental conditions. Therefore, the primary purpose of TVCOMP is unrelated to entropy, but rather is a method designed to improve reliability.
The HELP bit string generation process begins by selecting a set of k paths, typically 4096, from a larger set of n paths that exist within the on-chip macro. A series of simple mathematical operations are then performed on the path delays. The TVCOMP operation is applied to the entire distribution of k path delays. It first computes the mean and range of the distribution, and then applies a linear transformation that standardizes the path delays, i.e., subtracts the mean and divides each by the range, as a mechanism to eliminate any changes that occur in the delays because of adverse environmental conditions.
The standardized values therefore depend on the mean and range of the original k-path distribution. For example, a fixed path delay that is a member of two different distributions, with different mean and range values, will have different standardized values. This difference is preserved in the remaining steps of the bit string generation process. Therefore, the bit generated for a fixed path delay can change from 0 to 1 or 1 to 0 depending on the mean and range of the distribution. We refer to this dependency between the bit value and the parameters of the distribution as the distribution effect. The distribution effect adds uncertainty for algorithms attempting to learn and predict unseen CRPs.
It is important to note that this type of diversity-enhancing CRP method is not applicable to PUFs built from identically-designed test structures, e.g., Ring Oscillator (RO) and arbiter PUFs [
3], because it is not possible to construct distributions with widely varying means and ranges. In other words, the distributions defined by sets of
k RO frequencies measured from a larger set of
n RO frequencies are nearly indistinguishable. The HELP PUF, on the other hand, measures paths that have significant differences in path delays, and therefore, crafting a set of CRPs that generate distributions with distinct parameters is trivial to accomplish, as we demonstrate in this paper.
Although there are n-choose-k ways of creating a set of k-path distributions (an exponential), there are only a polynomial number of different integer-based means and ranges that characterize these distributions, and of these, an even smaller portion actually introduce changes in the bit value derived from a fixed path delay. Unfortunately, deriving a closed form expression for the level of CRP expansion is difficult at best, and in fact, may not be possible. Instead, an alternative empirical-based approach is taken in this paper to derive an estimate. We first demonstrate the existence of the distribution effect, and then evaluate the bit string diversity introduced by the distribution effect through calculating the interchip Hamming distance.
Note that even though the increase in the CRP space is polynomial (we estimate conservatively that each path delay can produce approximately 100 different bit values), the real strength of the distribution effect is related to the real-time processing requirements of attacks carried out using machine-learning algorithms. With the distribution effect, the machine-learning algorithm needs to be able to construct an estimate of the actual k-path distribution. This in turn requires detailed information about the layout of the on-chip macro, and an algorithm that quickly decides which paths are being tested for the specific set of server-selected challenges used during an authentication operation. Moreover, the machine learning algorithm must produce a prediction in real time, and only after the server transmits the entire set of challenges to the authenticating token. We believe that these additional tasks will add significant difficulty to a successful impersonation attack.
The implications of the distribution effect are two-fold. First, HELP can leverage smaller functional units and still achieve an exponential number of challenge–response pairs (CRPs), as required of a strong PUF. Second, the difficulty of model-building HELP using machine-learning algorithms will be more difficult, because the path delays from the physical model are no longer constant.
4. Distribution Effect
As indicated above, the
Path-Select-Masks are configured by the server to select different sets of
k PN among the larger set
n generated by the applied challenges (two-vector sequences). In other words, the 4096 PN are not fixed, but vary from one authentication to the next. For example, assume that a sequence of challenges produces a set of 5000 rising PN, and a set of 5000 falling PN, from which the server selects a subset of 2048 from each set. The number of ways of choosing 2048 from 5000 is given by Equation (3).
From this equation, it is clear that the Path-Select-Masks enable the PN to be selected by the server in an exponential n-choose-k fashion. However, there are only 50002 possible PND that can be created from these rising and falling PN. Therefore, the exponential n-select-k ways of selecting the PN would be limited to choosing among the n2 number of bits (one bit for each PND), unless it is possible to vary the bit value associated with each PND. This is precisely what the distribution effect is able to accomplish.
Previous work has shown that an exponential number of response bits is a necessary condition for a truly strong PUF, but not a sufficient condition. The responses must also be largely uncorrelated as a means of making it difficult or impossible to apply machine-learning algorithms to model build the PUF. The analysis provided in this section shows that the Path-Select-Masks, in combination with the TVCOMP process, add significant complexity to the machine-learning model.
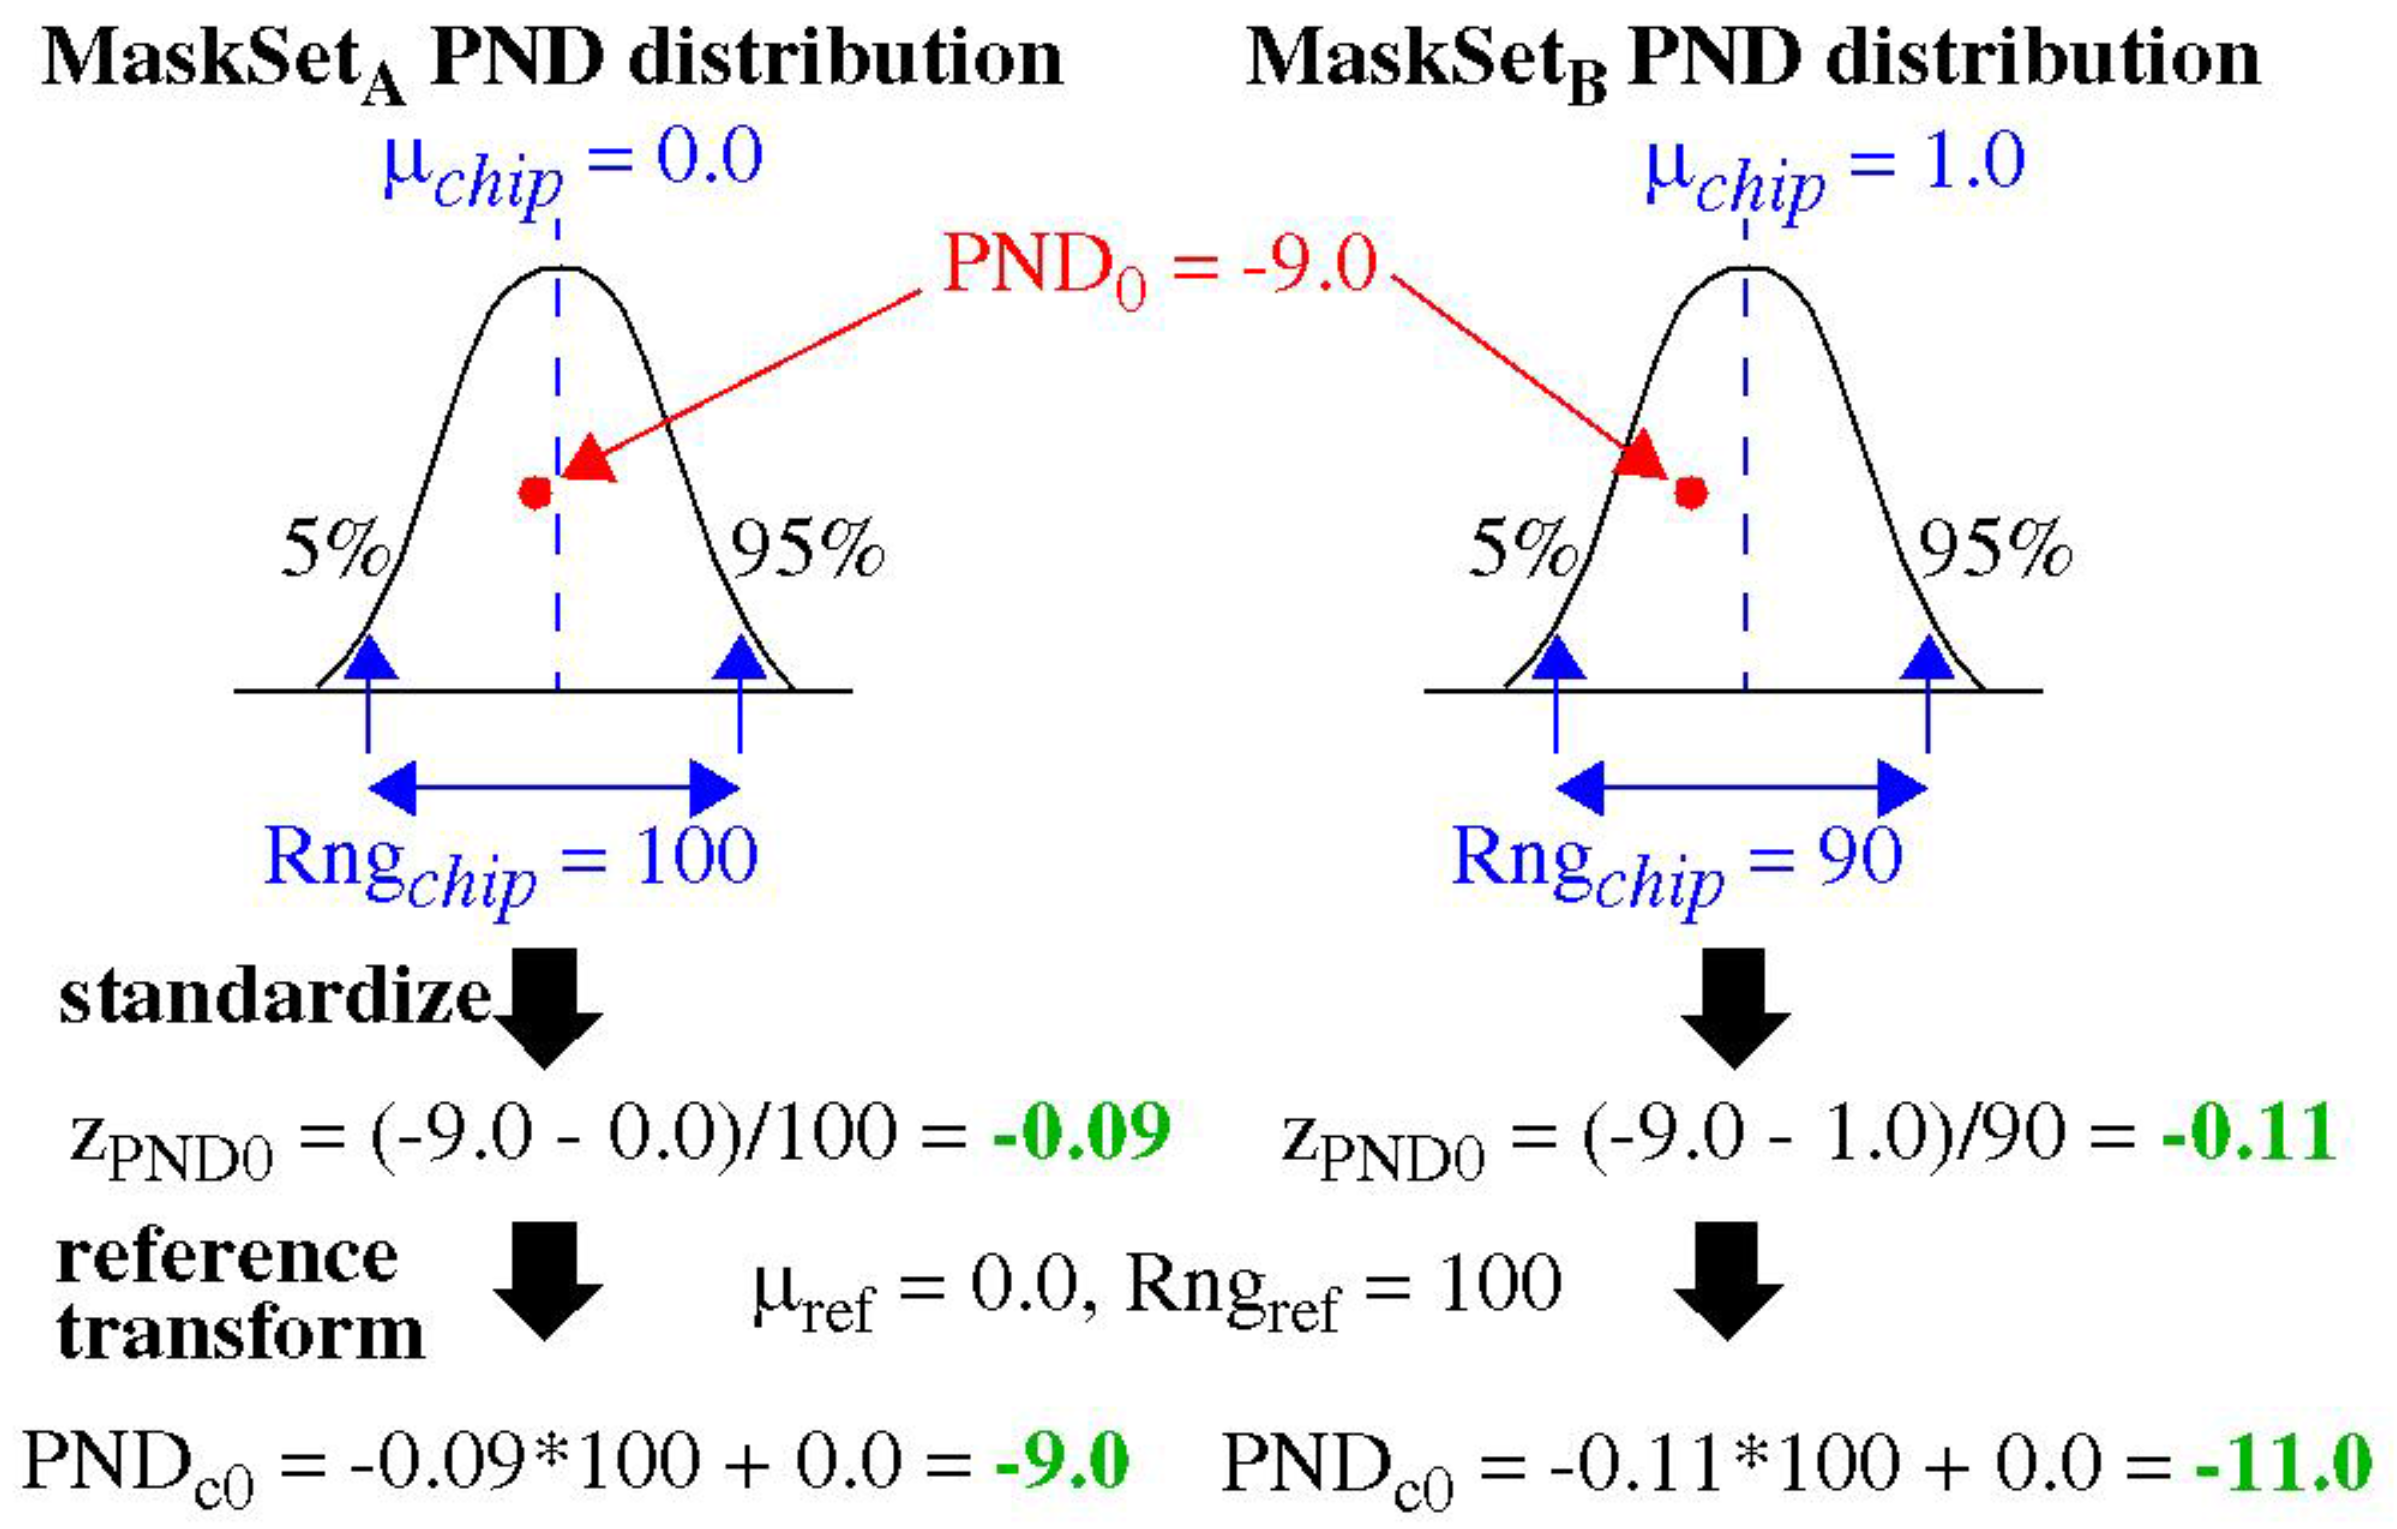
The set of PN selected by the Path-Select-Masks changes the characteristics of the PND distribution, which in turn impacts how each PND is transformed through the TVCOMP process. The TVCOMP process was described earlier in reference to Equations (1) and (2). In particular, Equation (1) uses the μchip and Rngchip of the measured PND distribution to standardize the set of PND before applying the second transformation given by Equation (2).
Figure 5 provides an illustration of the TVCOMP process. The two distributions are constructed using data from the same chip, but selected using two different sets of
Path-Select-Masks, MaskSet
A and MaskSet
B. The point labeled PND
0 is present in both distributions, with the value −9.0 as labeled, but the remaining components are purposely chosen to be different. Given that the two distributions are defined using distinct PND (except for one member), it is possible that the μ
chip and
Rngchip parameters for the two distributions will also be different (a simple algorithm is described below that ensures this). The example shows that the μ
chip and
Rngchip measured for the MaskSet
A distribution are 0.0 and 100, respectively, while the values measured for the MaskSet
B distribution are 1.0 and 90.
The TVCOMP process builds these distributions, measures their μchip and Rngchip parameters, and then applies Equation (1) to standardize the PND of both distributions. The standardized values for PND0 in each distribution are shown as −0.09 and −0.11, respectively. This first transformation is at the heart of the distribution effect, which shows that the original value of −9.0 is translated to two different standardized values. TVCOMP then applies Equation (2) to translate the standardized values back into an integer range using μref and Rngref, given as 0.0 and 100, respectively, for both distributions. The final PNDc0 from the two distributions are −9.0 and −11.0, respectively. This shows that the TVCOMP process creates a dependency between the PND and corresponding PNDc that is based on the parameters of the entire distribution.
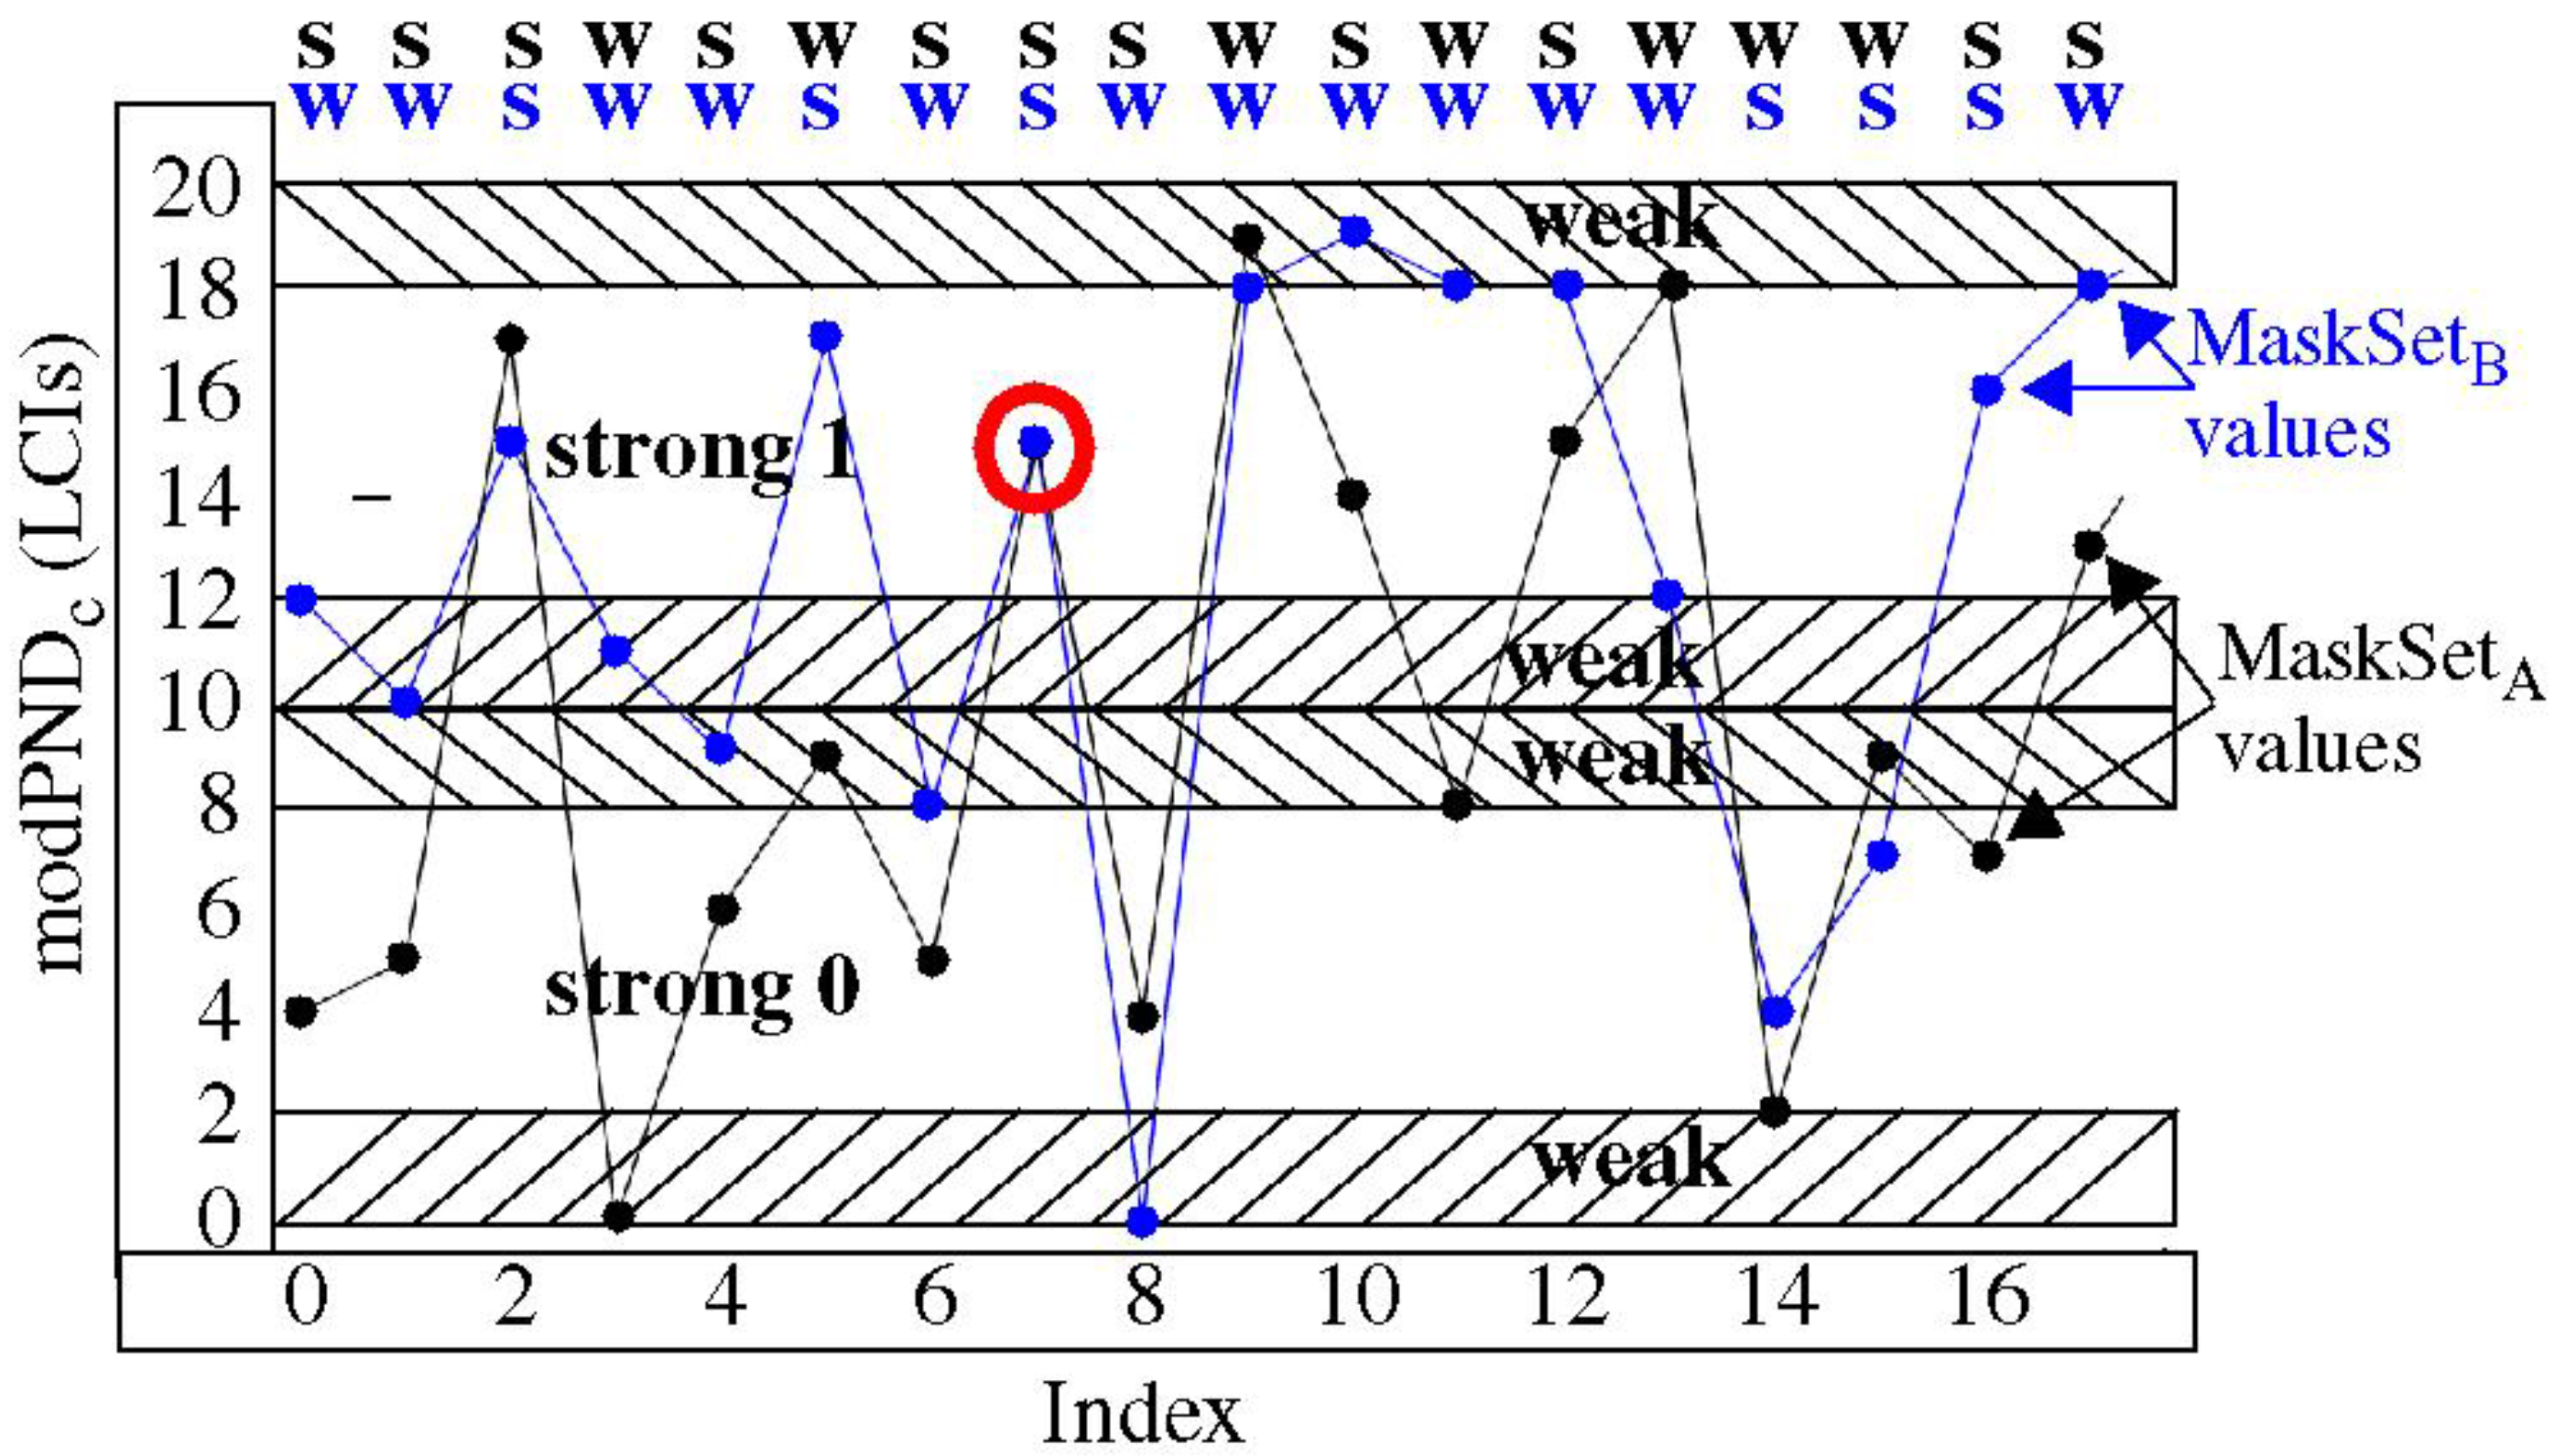
The
Modulus-Margin graph of
Figure 4 described earlier illustrates this concept using data from chip-instance C
1. The 18 vertically-positioned pairs of modPND
c values included in the curves labeled MaskSet
A and MaskSet
B are derived from the same PND. However, the remaining PND, i.e., (2048 − 18) = 2030 PND, (not shown) in the two distributions are different. These differences change the distribution parameters, μ
chip and
Rngchip, of the two distributions, which in turn, introduces vertical shifts in the PND
c and wraps in the modPND
c. The distribution effect affects all of the 18 pairings of modPND
c in the two curves, except for the point circled in red.
The distribution effect can be leveraged by the verifier as a means of increasing the unpredictability in the generated response bit strings. One possible strategy is to intentionally introduce skew into the μchip and Rngchip parameters when configuring the Path-Select-Masks as a mechanism to force diversity in bit values derived from the same PN, i.e., those PN that have been used in previous authentications. The sorting-based technique described in the next section represents one such technique that can be used by the server for this purpose.
5. Experimental Results
In this section, we construct a set of PN distributions using a specialized process that enables a systematic evaluation of the distribution effect. As indicated earlier, the number of possible PN distributions is exponential (n-choose-k), which makes it impossible to enumerate and analyze all of the possibilities. The fixed number of data sets constructed by our process therefore represents only a small sample from this exponential space. However, the specialized construction process described below illustrates two important concepts, namely, the ease in which bit string diversity can be introduced through the distribution effect, and the near ideal results that can be achieved, i.e., the ability to create bit strings using the same PN that possess a 50% interchip Hamming distance. Our evaluation methodology ensures that the only parameters that can change are those related to the distribution, namely, μchip and Rngchip, so the differences in the bit strings reported are due entirely to the distribution effect.
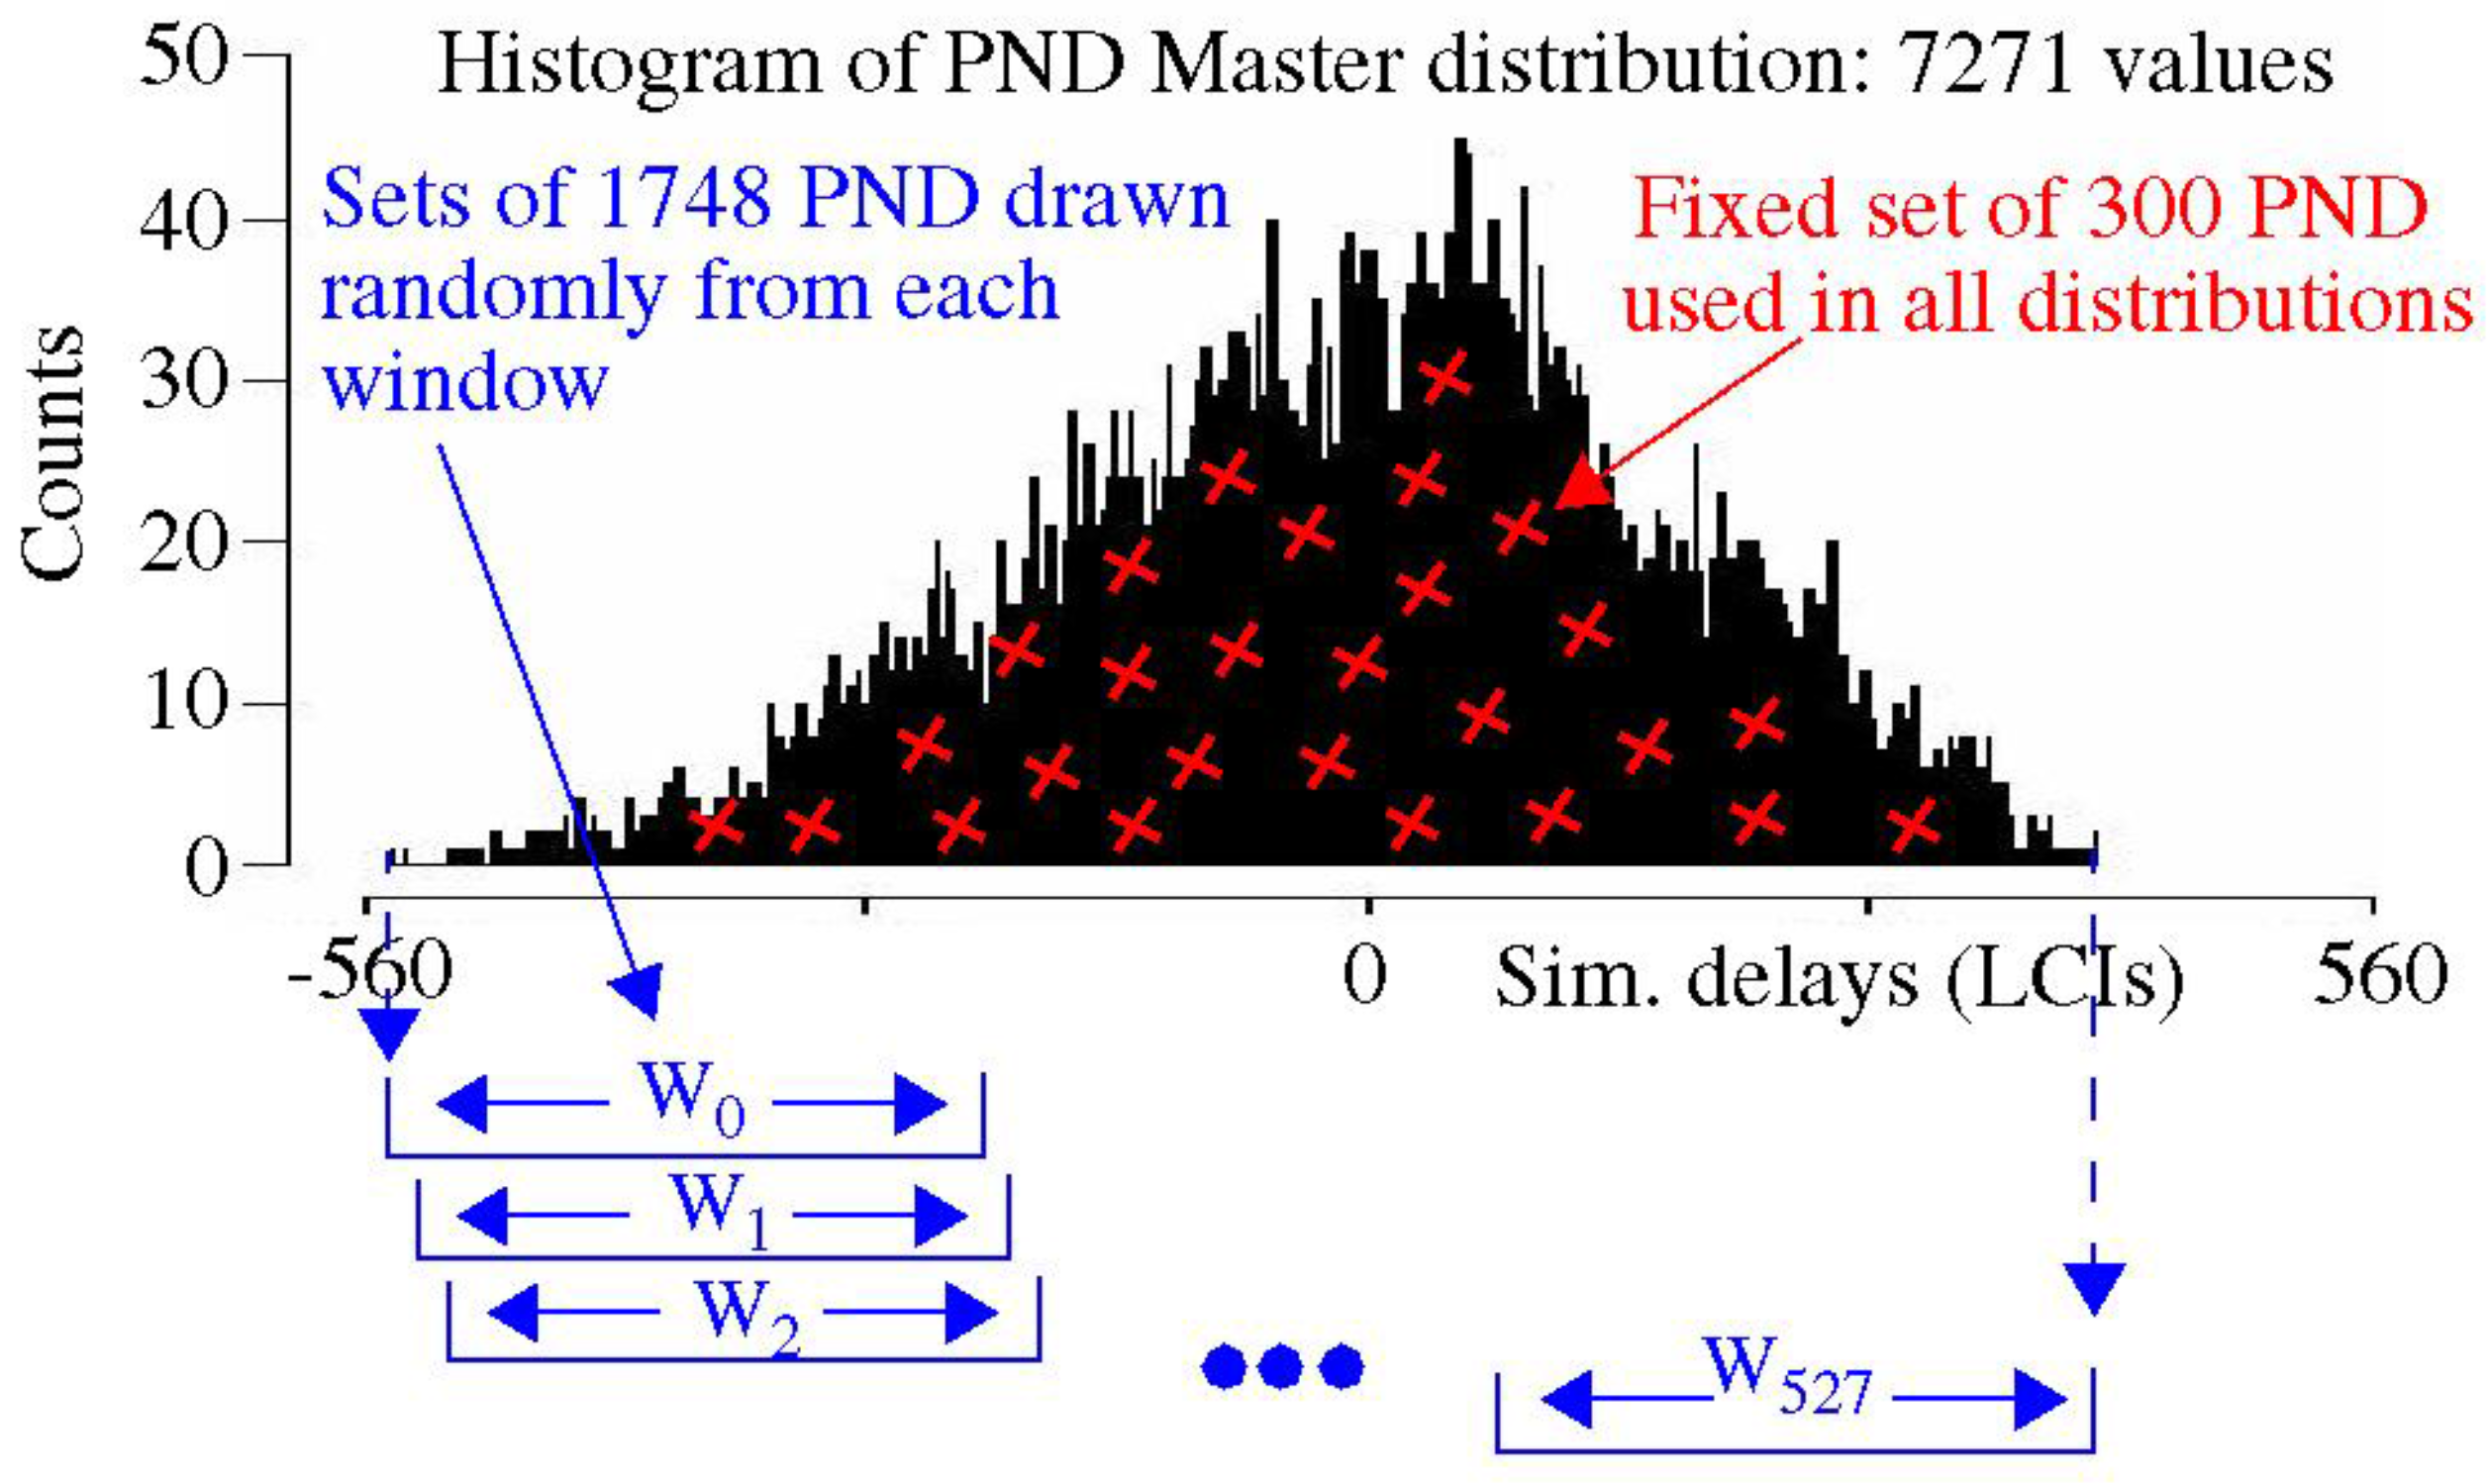
The distributions that we construct in this analysis include a fixed set of 300 rising and 300 falling PN drawn randomly from ‘Master’ rise and fall PN data sets of size 7271. The bit strings subjected to evaluation use only these PN, which are subsequently processed into PND, PNDc, and modPNDc in exactly the same way, except for the μchip and Rngchip used within the TVCOMP process. The μchip and Rngchip of each distribution are determined using a larger set of 2048 rise and fall PN, which includes the fixed sets of size 300, plus two sets of size 1748 (2048 − 300), which are drawn randomly each time from the Master rise and fall PN data sets. Therefore, the μchip and Rngchip parameters of these constructed distributions are largely determined by the 1748 randomly selected rise and fall PN.
A windowing technique is used to constrain the randomly selected 1748 rise and fall PN as a means of carrying out a systematic evaluation that ensures that the μchip and Rngchip parameters increase (or decrease) by small deltas. Since TVCOMP derives the μchip and Rngchip parameters from the PND distribution, our random selection process is applied to a Master PND distribution as a means of enabling better control over the μchip and Rngchip parameters.
The Master PND distribution is constructed from the Master PNR and PNF distributions in the following fashion. The 7271 elements from the PNR and PNF Master distributions are first sorted according to their worst-case simulation delays. The rising PN distribution is sorted from largest to smallest, while the falling PN distribution is sorted from smallest to largest. The Master PND distribution is then created by subtracting consecutive pairings of PNR and PNF from these sorted lists, i.e., PNDi = PNRi − PNFi for i = 0 to 7271. This construction process creates a Master PND distribution that possesses the largest possible range among all of the possible PNR/PNF pairing strategies.
A histogram portraying the PND Master distribution is shown in
Figure 6. The PNR and PNF Master distributions (not shown) from which this distribution is created were themselves created from simulations of the
sbox-mixedcol functional unit described in
Section 3 using approx. 1000 challenges (two-vector sequences). The range of the PND is given by the width of the histogram as approx. 1000 LCIs (~18 ns).
The 2048 rise and fall PN used in the set of distributions evaluated below are selected from this Master PND distribution. The PND Master distribution (unlike the PNR and PNF Master distributions) permits distributions to be created such that the change in the μ
chip and
Rngchip parameters from one distribution to the next is controlled to a small delta. The red ‘x’s in
Figure 6 illustratively portray that the set of 300 fixed PND (and corresponding PNR and PNF) are randomly selected across the entire distribution. These 300 PND are then removed from Master PND distribution. The remaining 1748 PND for each distribution are selected from specific regions of the Master PND distribution as a means of constraining the μ
chip and
Rngchip parameters. The regions are called
windows in the Master PND distribution, and are labeled
Wx along the bottom of
Figure 6.
The windows Wx are sized to contain 2000 PND, and therefore, the width of each Wx varies according to the density of the distribution. Each consecutive window is skewed to the right by 10 elements in the Master PND distribution. Given the Master contains 7271 total elements, this allows 528 windows (and distributions) to be created. The 2048 PND for each of these 528 distributions, which are referred to as Wx distributions, are then used as the input to the TVCOMP process. The 300 fixed PND are present in all of the distributions, and therefore, they are identical in value prior to TVCOMP.
The objective of this analysis is to determine how much the bit strings change as the μchip and Rngchip parameters of the Wx distributions vary. As noted earlier, the bit strings are constructed using only the 300 fixed PND, and are therefore of size 300 bits. We measure changes to the bit strings using a reference bit string, i.e., the bit string generated using the W0 distribution. Interchip Hamming distance (InterchipHD) counts the number of bits that are different between the W0 bit string and each of the bit strings generated by the Wx distributions, for x = 1 to 527. The expression used for computing InterchipHD is discussed further below.
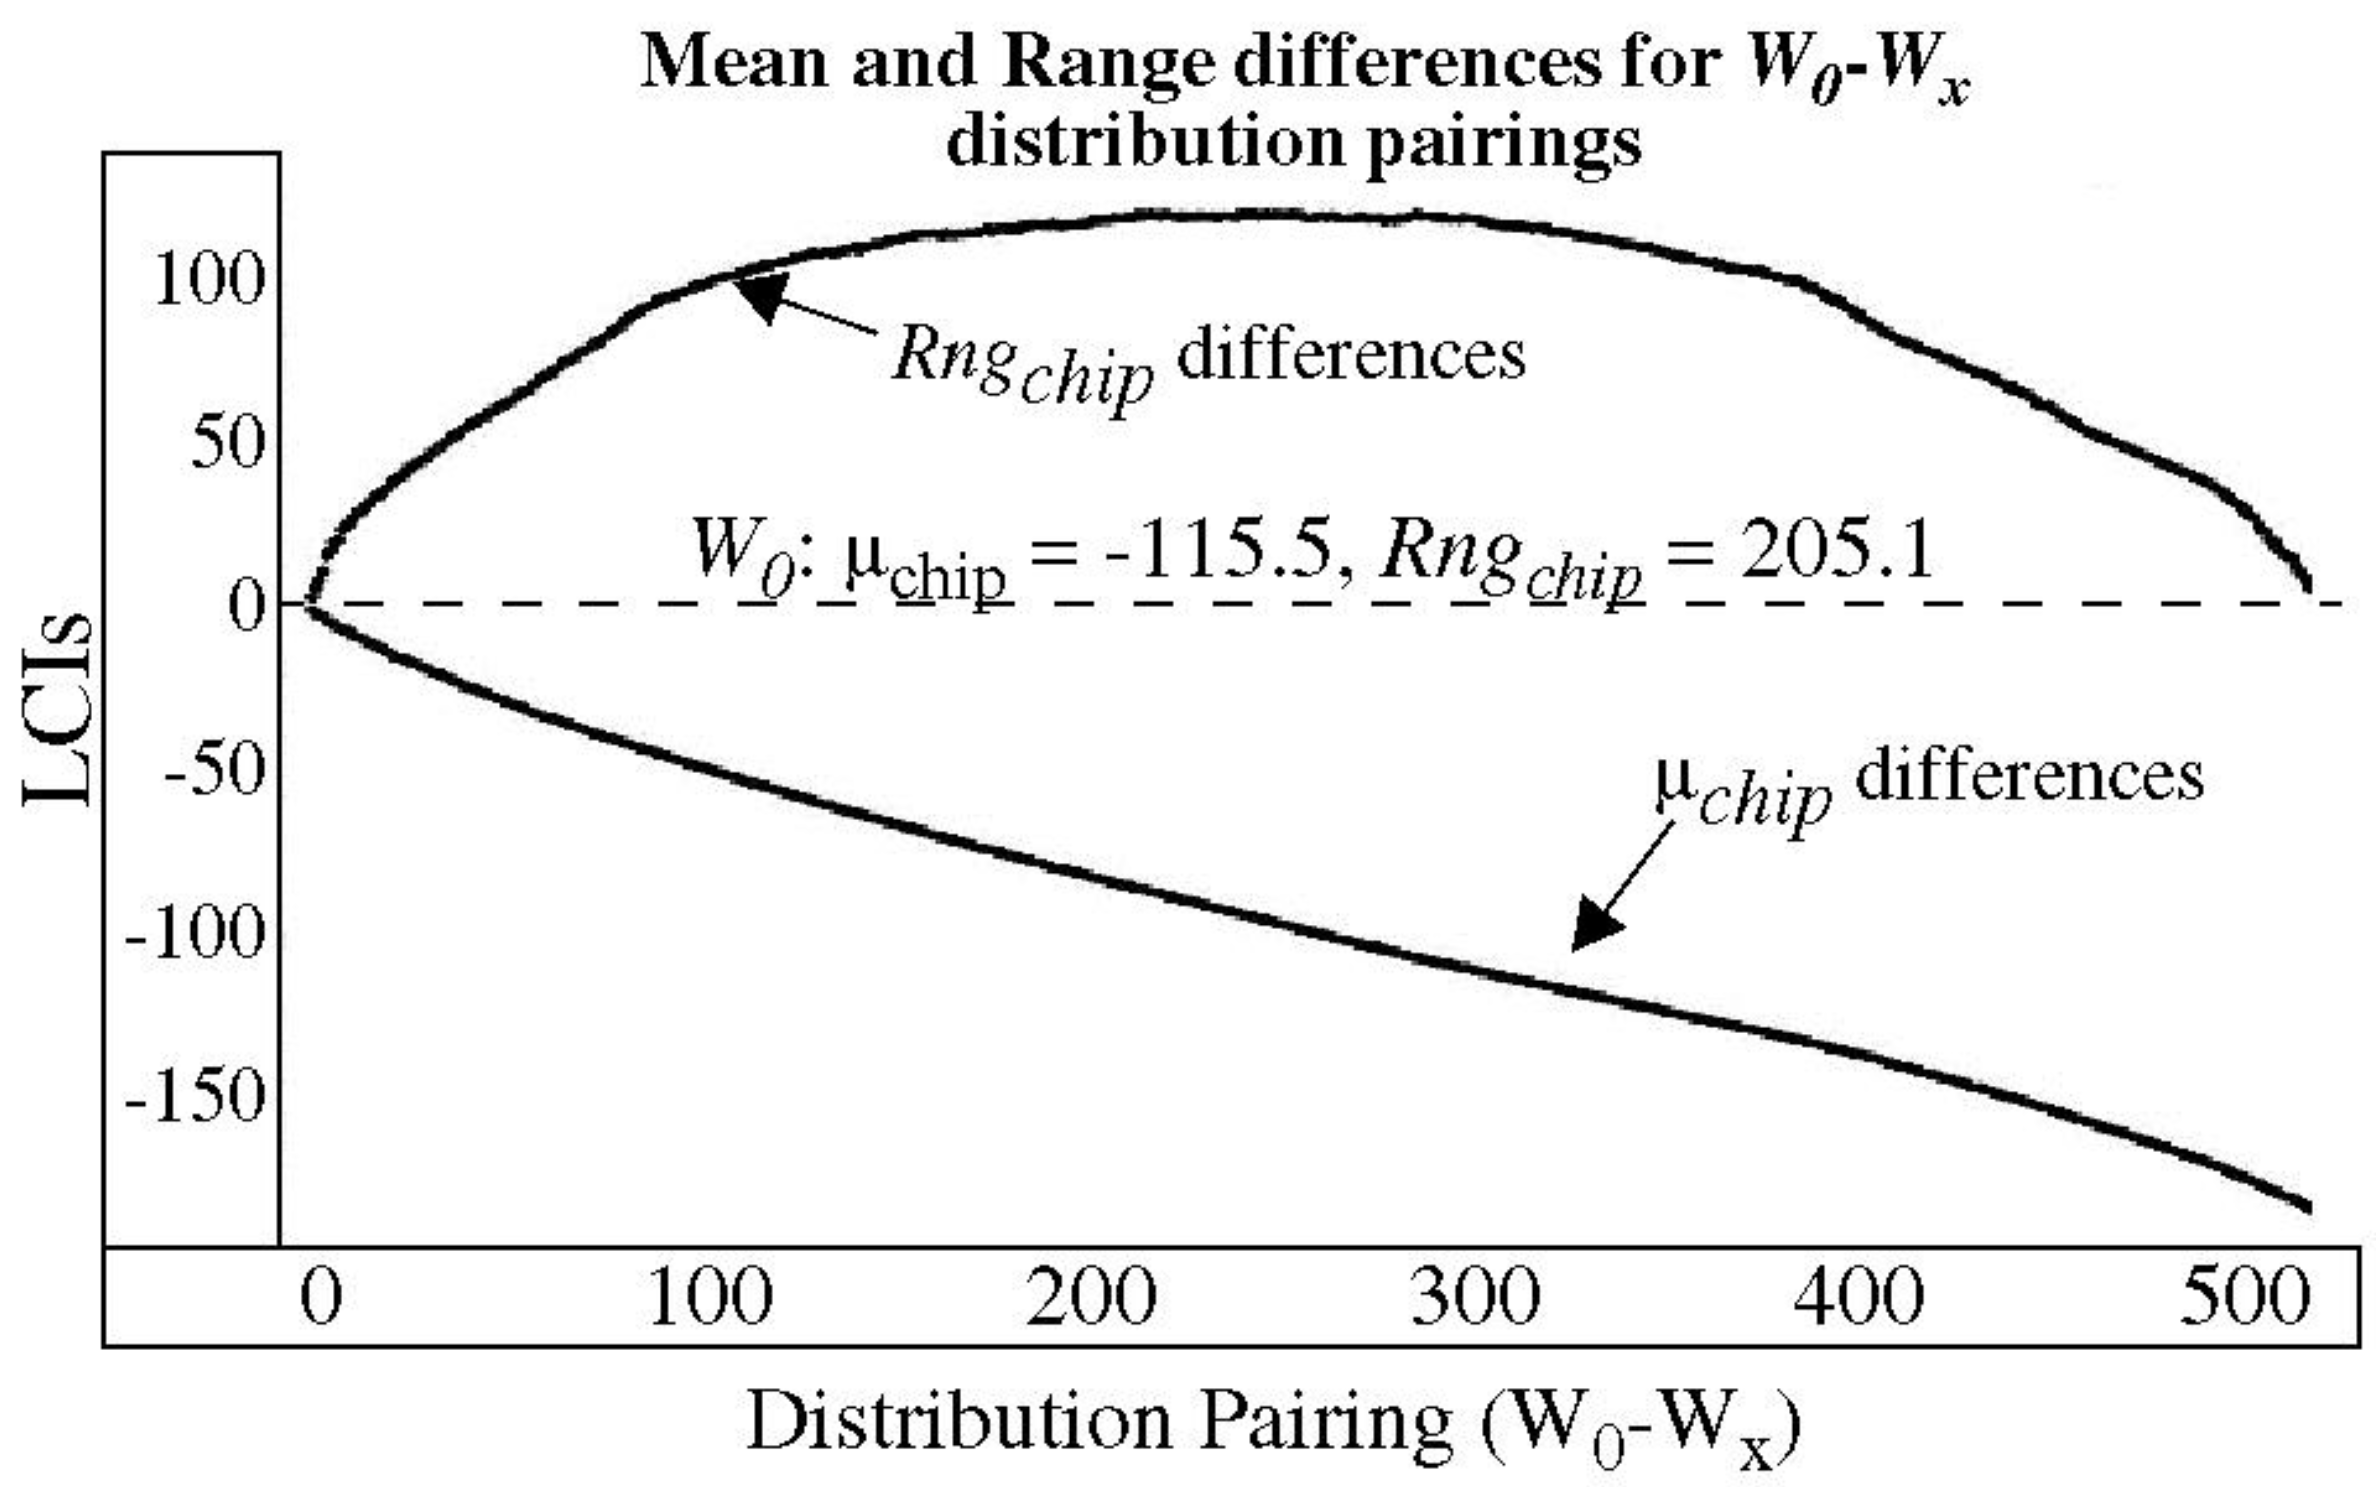
The construction process used to create the
W0-
Wx distribution pairings ensures that a difference exists in the μ
chip and
Rngchip parameters.
Figure 7 plots the average difference in the μ
chip and
Rngchip of each
W0-
Wx pairing, using FPGA data measured from the 500 chip-instances. The differences are created by subtracting the
Wx parameter values, e.g., μ
chipWx and
RngchipWx, from the reference
W0 parameter values, e.g., μ
chipW0 and
RngchipW0. The
W0 distribution parameters are given as μ
chip = −115.5 and
Rngchip = 205.1 in the figure. As the window is shifted to the right, the mean increases towards 0, and the corresponding (
W0-
Wx) difference becomes more negative in nearly a linear fashion, as shown by the curve labeled ‘μ
chip differences’. Using the
W0 values, μ
chip varies over the range from −115 to approx. +55.
The range, on the other hand, decreases as the window shifts to the right, because the width of the window contracts (due to the increased density in the histogram), until the midpoint of the distribution is reached. Once the midpoint is reached, the range begins to increase again. Using the W0 values, Rngchip varies from 205 down to approximately 105 at the midpoint. Note that the window construction method creates nearly all possible μchip values, but only a portion of the possible Rngchip values, e.g., distributions with ranges up to nearly 1000 can be constructed from this Master PND distribution. Therefore, the results reported below represent a conservative subset of all possible distributions.
Also, note that
Rngchip continues to change throughout the set of
Wx distributions. This occurs because the range is measured between the 6.25% and 93.75% points in the histogram representation of the 2048 element PND distributions. If the extreme points were used instead, the
Rngchip values from
Figure 7 would become constant once the window moved inside the points defined by the fixed set of 300 PND.
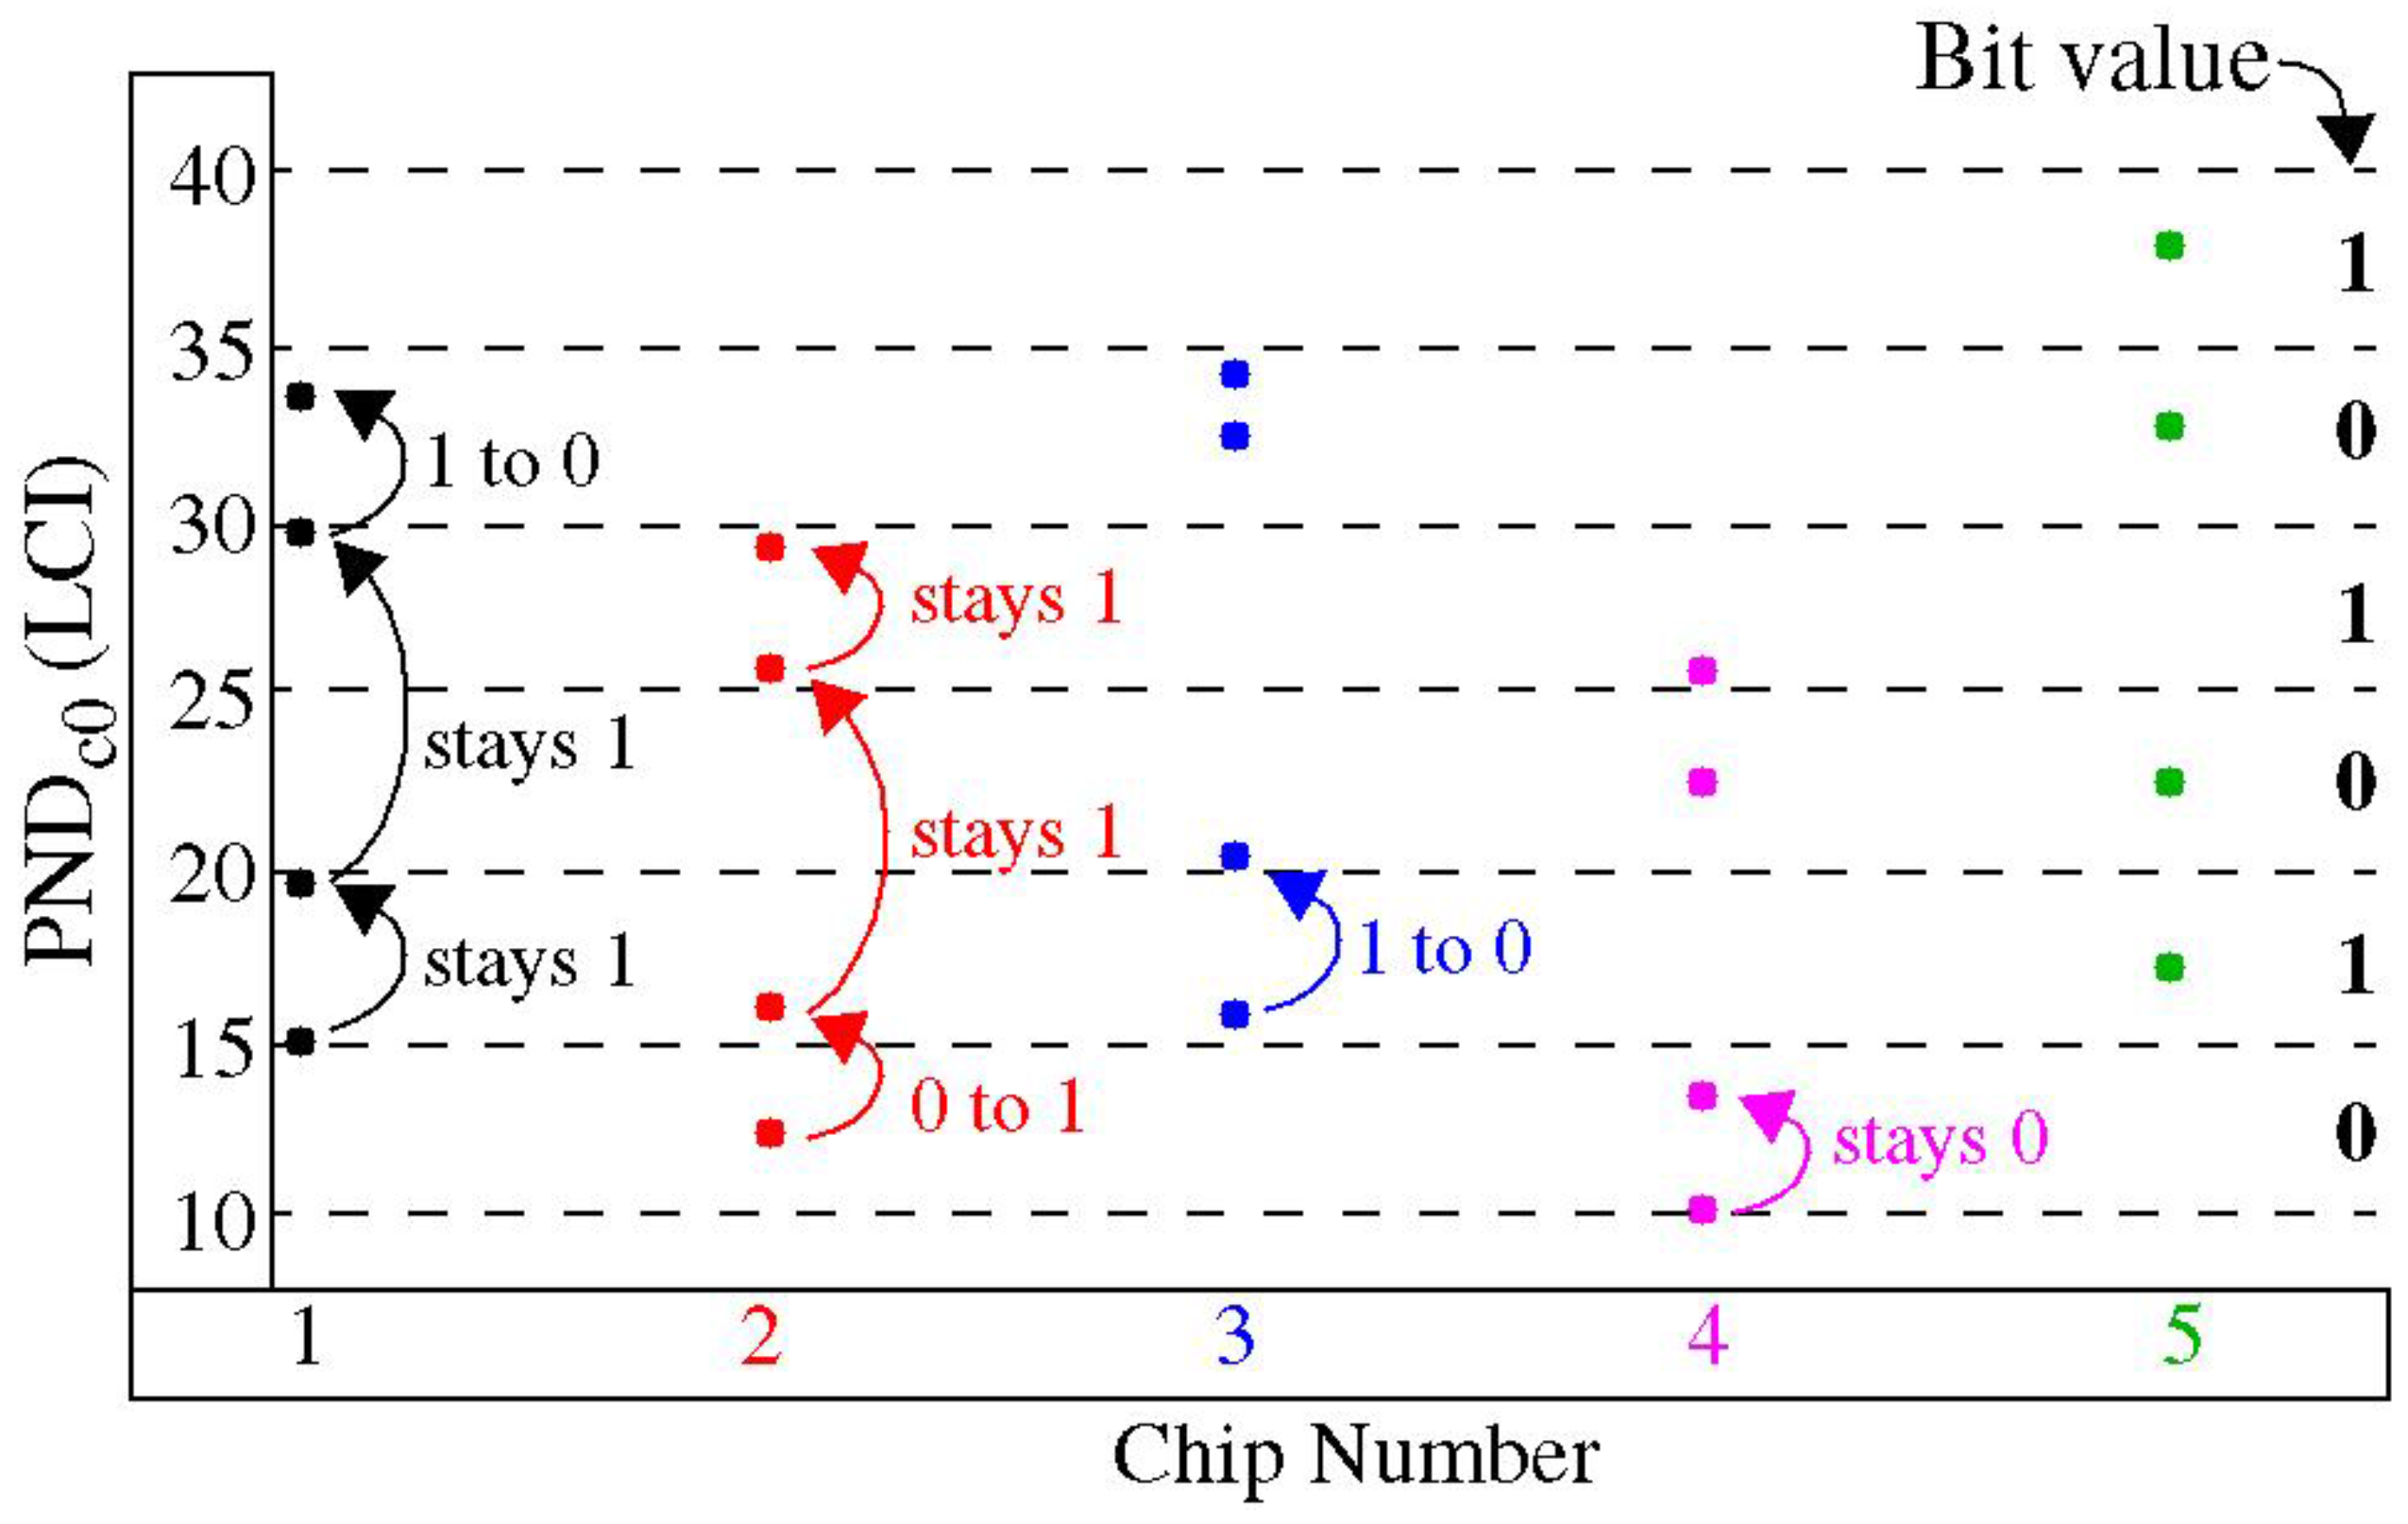
Figure 8 provides an illustration of the distribution effect using data from several chip-instances. The effect on PND
c0 is shown for five chips given along the
x-axis for four windows given as
W0,
W25,
W50, and
W75. The bottom-most points are the PND
c0 for the distribution associated with
W0. As the index of the window increases, the PND
c0 from those distributions is skewed upwards. A modulus grid of 20 is shown superimposed to illustrate how the corresponding bit values change as the parameters of the distributions change.
We use InterchipHD to measure the number of bits that change value across the 527
W0-
Wx distributions. It is important to note that
we apply InterchipHD to only those portions of the bit string that correspond to the fixed set of 300 PN. InterchipHD counts the number of bits that differ between pairs of bit strings. Unfortunately, InterchipHD cannot be applied directly to the HELP algorithm-generated bit strings because of the margining technique described in
Section 3.3. Margining eliminates weak bits to create the strong bit string (SBS), but the bits that are eliminated are different from one chip-instance to another. In order to provide a fair evaluation, i.e., one that does not artificially enhance the InterchipHD towards its ideal value of 50%, the bits compared in the InterchipHD calculation must be generated from the same modPND
c.
Figure 9 provides an illustration of the process used for ensuring a fair evaluation of two HELP-generated bit strings. The helper data bit strings
HelpD and raw bit strings
BitStr for two chips
Cx and
Cy are shown along the top and bottom of the figure, respectively. The
HelpD bit strings classify the corresponding raw bit as weak using a ‘0’ and as strong using a ‘1’. The InterchipHD is computed by XOR’ing only those
BitStr bits from the
Cx and
Cy that have both
HelpD bits set to ‘1’, i.e., both raw bits are classified as strong. This process maintains alignment in the two bit strings, and ensures the same modPND
c from
Cx and
Cy are being used in the InterchipHD calculation. Note that the number of bits considered in each InterchipHD is less than 300 using this method, and in fact will be different for each pairing.
Equation (4) provides the expression for InterChipHD,
HDInter, which takes into consideration the varying lengths of the individual InterchipHDs. The symbols
NC,
NBx, and
NCC represent ‘number of chips’, ‘number of bits’, and ‘number of chip combinations’, respectively. We used 500 chip-instances for the ‘number of chips’, which yields 500 × 499/2 = 124,750 for
NCC. This equation simply sums all of the bitwise differences between each of the possible pairing of chip-instance bit strings (
BS), as described above, and then converts the sum into a percentage by dividing by the total number of bits that were examined. The final value of
Bit cnter from the center of
Figure 9 counts the number of bits that are used for
NBx in Equation (4), which varies for each pairing, as indicated above.
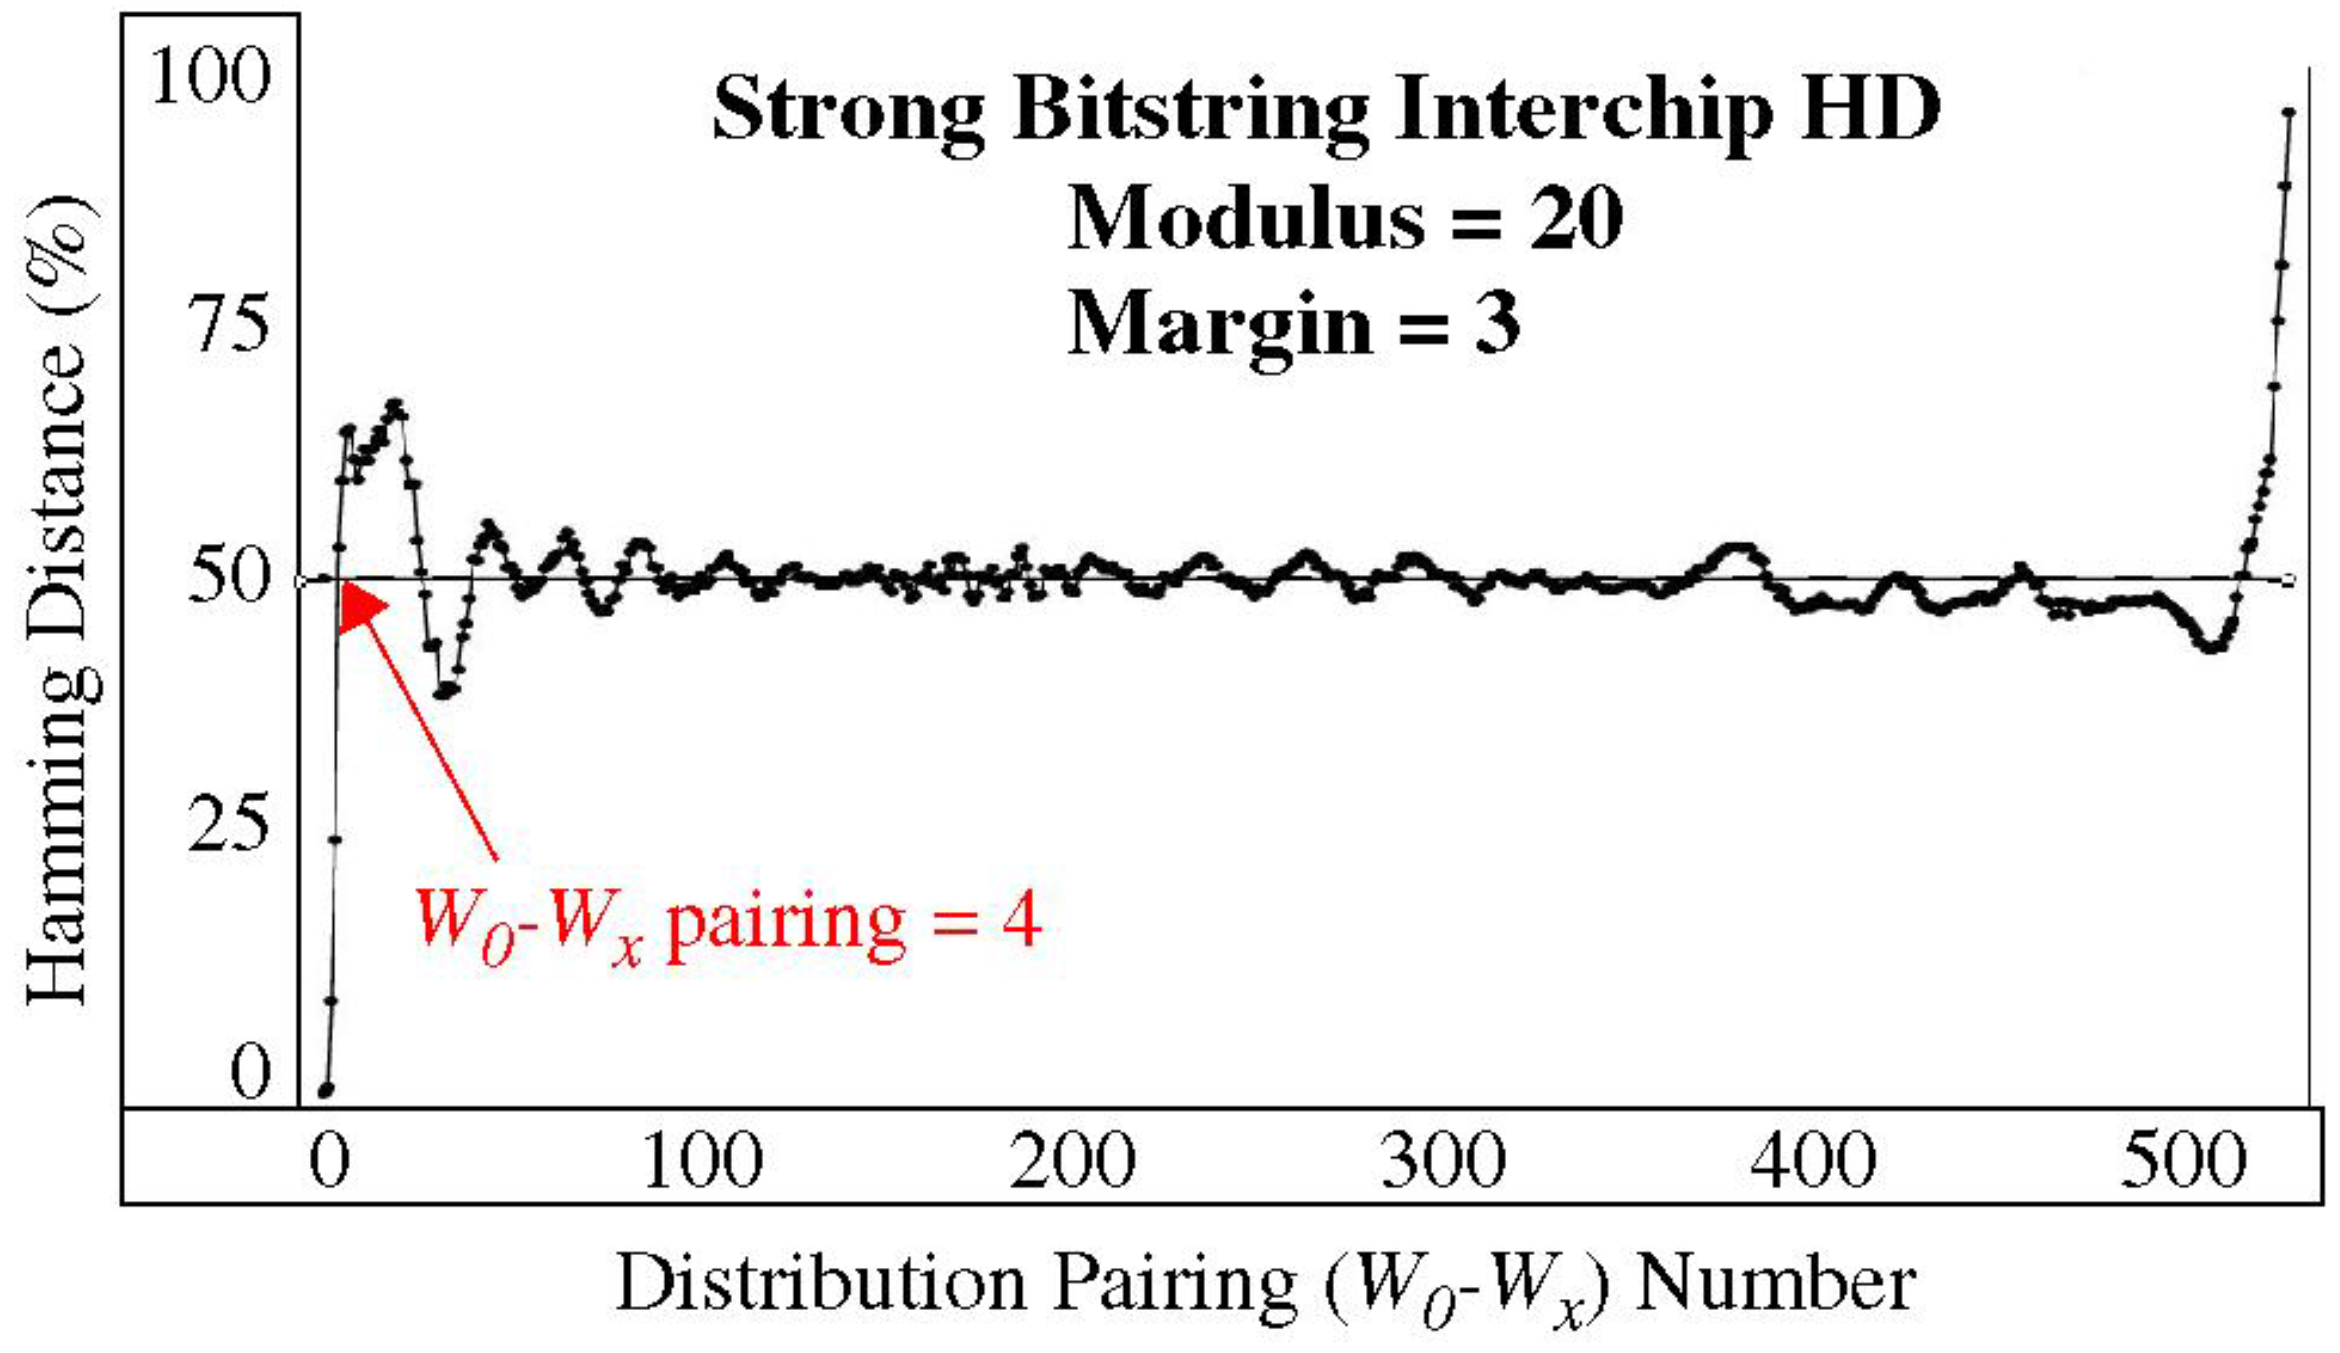
The InterchipHD results shown in
Figure 10 are computed using enrollment data collected from 500 chip-instances of a Xilinx Zynq 7020 chip, as described earlier. The
x-axis plots the
W0-
Wx pairing, which corresponds one-to-one with the graph shown in
Figure 7. The HELP algorithm is configured with a Modulus of 20 and a Margin of 3 in this analysis (the results for other combinations of these parameters are similar). The HDs are nearly zero for cases in which windows
W0 and
Wx have significant overlap (at the left-most points), as expected, because the μ
chip and
Rngchip of the two distributions are nearly identical under these conditions (see the left side of
Figure 7). As the windows separate, the InterchipHDs rise quickly to the ideal value of 50% (annotated at
W0-
Wx pairing = 4), which demonstrates that the distribution effect provides significant benefit for relatively small shifts in the distribution parameters.
The overshoot and undershoot on the left and right sides of the graph in
Figure 10 reflect correlations that occur in the movement of the modPND
c for special case pairs of the μ
chip and
Rngchip parameters. For example, for pairings in which the
Rngchip of the two distributions are identical, shifting μ
chip causes all of the modPND
c to rotate through the range of the Modulus (with wrap). For μ
chip shifts equal to the Modulus, the exact same bit string is generated by both distributions. This case does not occur in our analysis; otherwise, the curve would show instances where the InterchipHD is 0 at places other than when
x = 0. For μ
chip shifts equal to 1/2 Modulus (and with equal
Rngchip), the InterchipHD becomes 100%. The upward excursion of the right-most portion of the curve in
Figure 10 shows results where this boundary case is approached, i.e., for
x > 517. Here, the
Rngchip of both distributions (from
Figure 7) are nearly the same, and only the μ
chip are different.
A key takeaway here is that the InterchipHDs remain near the ideal value of 50%, even when simple distribution construction techniques are used. As we noted earlier, these types of construction techniques can be easily implemented by the server during authentication.
Security Implications
The results of this analysis provide strong evidence that the distribution effect increases bit string diversity. As indicated earlier, the number of PND that can be created using 7271 rising and falling PN is limited to (7271)2 before considering the distribution effect. Based on the analysis presented, the number of times a particular bit can change from 0 to 1 and vise versa is proportional to the number of μchip and Rngchip values that yield different bit values. In general, this is a small fixed value on order of 100, so the distribution effect provides only a polynomial increase in the number of PND over the n2 provided in the original set.
However, determining which bit value is generated from a set of 100 possibilities for each modPNDc independently requires an analysis of the distribution, and there are an exponential n-choose-k ways of building the distribution using the Path-Select-Masks. Therefore, model-building needs to incorporate inputs that track the form of the distribution, which is likely to increase the amount of effort and the number of training CRPs significantly. Furthermore, for authentication applications, the adversary may need to compute the predicted response in real-time after the verifier has sent the challenges and Path-Select-Masks. This adds considerable time and complexity to an impersonation attack, which is beyond that required to build an accurate model. Unfortunately, a closed-form quantitative analysis of the benefit provided by the distribution effect is non-trivial to construct. Our ongoing work is focused on determining the difficulty of model-building the HELP PUF as an alternative.


