
Stereological Assessment of Locus Coeruleus in the Mouse: A Methodological Study in Pups and Adult Animals

 , , , and
Abstract
1. Introduction
2. Experimental Design
2.1. Materials
- Paraformaldehyde 95% (Sigma-Aldrich, Darmstadt, Germany; Cat. no.: 158127)
- Alcoolpath 100 (Bio-Optica Milano S.p.A, Milan, Italy; Cat. no.: 06-10030F)
- Xylene (Bio-Optica Milano S.p.A, Milan, Italy; Cat. no.: 06-1304F)
- Biowax (Bio-Optica Milano S.p.A, Milan, Italy; Cat. no.: 08-7960)
- Feather Blades A22 (Bio-Optica Milano S.p.A, Milan, Italy; Cat. no.: 01-A22)
- Adhesive Plus slides (Bio-Optica Milano S.p.A, Milan, Italy; Cat. no.: 09-3000)
- A-PapPen (Bio-Optica Milano S.p.A, Milan, Italy; Cat. no.: 11-100)
- Triton X-100 (Sigma-Aldrich, Darmstadt, Germany; Cat. no.: X-100)
- Trizma (Sigma-Aldrich, Darmstadt, Germany; Cat. no.: T1503)
- Normal Goat Serum (Vector Laboratories, Inc., Newark, CA, USA; Cat. no.: S-1000)
- Primary antibody, anti-tyrosine hydroxylase (Sigma-Aldrich, Darmstadt, Germany; Cat. no.: Ab152)
- Goat anti-Rabbit biotinylated secondary antibody (Vector Laboratories, Inc., Newark, CA, USA; Cat. no.: BA-1000)
- Vectastain® Elite® ABC Universal PLUS Kit Peroxidase (Vector Laboratories, Inc., Newark, CA, USA; Cat. no.: PK-8200)
- DAB Substrate Kit Peroxidase (HRP) (Vector Laboratories, Inc., Newark, CA, USA; Cat. no.: SK-4100)
- DPX Histology Mounting Medium (Sigma-Aldrich, Darmstadt, Germany; Cat. no.: 06522)
2.2. Equipment
- Thermal Unit UT200 (Bio-Optica Milano S.p.A, Milan, Italy)
- Paraffin Dispenser DP500 (Bio-Optica Milano S.p.A, Milan, Italy)
- Rotary microtome (HistoCore BIOCUT, Leica Biosystems, Deer Park, IL, USA)
- Forced-air oven (Falc Instruments s.r.l., Treviglio (BG), Italy)
- Nikon Eclipse Ni microscope (Nikon, Japan)
- Motorized stage (Prior Scientific, UK)
- Stereo Investigator® software (MBF Bioscience, The Netherlands)
3. Procedure
3.1. Embedding and Cutting Procedure
- After sacrifice, fix brains in 4% Paraformaldehyde in phosphate buffer (pH 7.0) overnight at 4 °C.
- Wash samples in phosphate buffer two times (pH 7.0).
- Dehydrate samples through a graded ethanol series (30% and 50%, 1.5 h for each step), followed by 80% ethanol step overnight at 4 °C.
- Complete dehydration with a 2 h step in 90% ethanol, followed by a 3 h step in absolute ethanol.
- After dehydration procedure, immerse brains in xylene (two changes, 2.5 h each) to allow paraffin infiltration.
- Once clearing in xylene is complete, transfer the samples to melted paraffin (58–60°) overnight in Thermal Unit UT200 (Bio-Optica Milano S.p.A, Milan, Italy).
- Embed the brains in paraffin using metal molds, profiting from Paraffin Dispenser DP500 (Bio-Optica Milano S.p.A, Milan, Italy).
- Section each paraffin-embedded brain along the rostro-caudal axis at the level of the brainstem to obtain 40 µm thick coronal sections using a rotary microtome (HistoCore BIOCUT, Leica Biosystems, USA).
- Collect sections onto adhesive plus slides and dry them overnight in an oven at 37 °C.
3.2. Immunoperoxidase for TH+
- Identify coronal sections containing LC from Bregma −5.80 mm, Interaural −2.00 mm to Bregma −5.34 mm, Interaural −1.54 mm, according to the Paxinos & Franklin mouse brain atlas [34].
- Deparaffinize the selected slides in xylene and subsequently rehydrate through a graded series of ethanol to distilled water.
- Permeabilize coronal sections using 0.1% Triton X-100 in Tris Buffer Saline (pH 7.0) for 15 min.
- Following permeabilization, quench endogenous peroxidase activity by incubating sections in a 3% aqueous solution of hydrogen peroxide for 10 min.
- Block non-specific binding sites using 10% Normal Goat Serum (NGS) in TBS 1X for 1 h at Room Temperature.
- Incubate sections with a rabbit anti-tyrosine hydroxylase primary antibody (1:1000, Sigma-Aldrich, Darmstadt, Germany; Cat. no.: Ab152) in TBS 1X containing 2% NGS at 4 °C.
- Following overnight incubation, rinse sections in TBS three times and then incubate with a biotinylated goat anti-Rabbit IgG (H + L) secondary antibody (1:400, Vector Laboratories, Inc., Newark, CA, USA; Cat. no.: BA-1000) for 1.30 h at room temperature.
- Rinse sections in TBS 1X three times. Incubate samples with avidin–biotin complex solution using Vectastain® Elite® ABC Universal PLUS Kit Peroxidase (Vector Laboratories, Inc., Newark, CA, USA; Cat. no.: PK-8200) according to the manufacturer’s instructions for 1 h at room temperature.
- Rinse sections in TBS 1X three times. Incubate with DAB Substrate Kit Peroxidase (HRP) (Vector Laboratories, Inc., Newark, CA, USA; Cat. no.: SK-4100). The enzymatic reaction is catalyzed by horseradish peroxidase (HRP) using 3,3′-Diaminobenzidine as the chromogenic substrate.
3.3. Stereological Assessment
- Contour delineation: At low magnification, the region of interest (ROI) is outlined to define the anatomical boundaries of the target structure (here, the LC). Accurate contour delineation is essential, as the ROI defines the reference space for all subsequent sampling steps. Ambiguous or inconsistently defined borders may introduce systematic bias and adversely affect the validity of the stereological estimates.
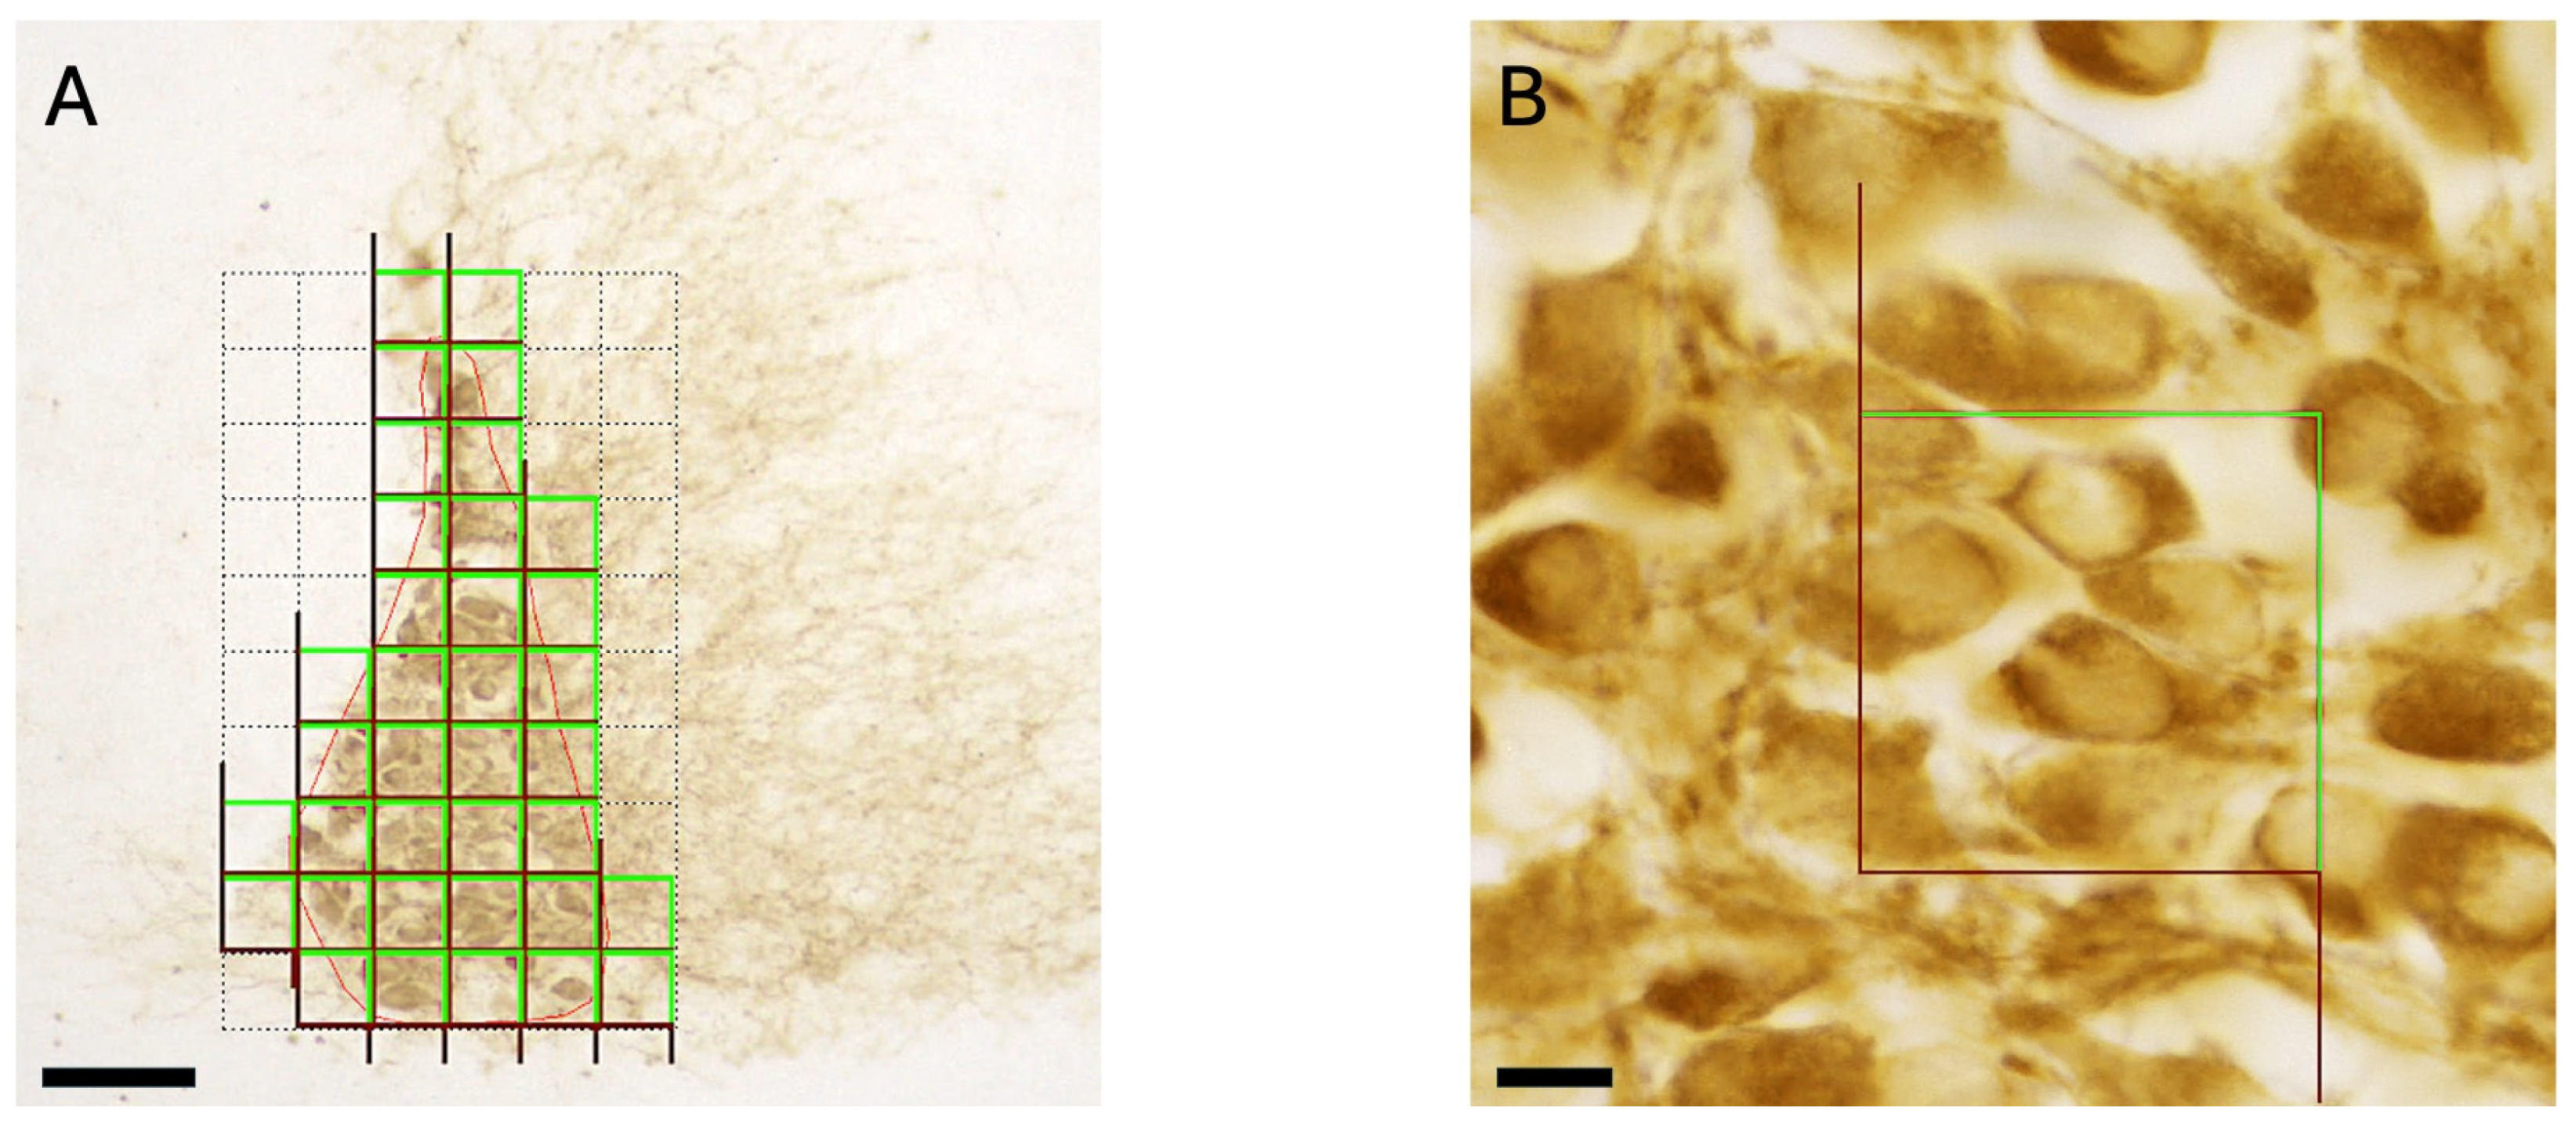
- Counting frame (CF): The CF represents the two-dimensional sampling probe used for cell counting within the ROI. It is defined in the x–y plane and applied following unbiased counting rules. In particular, the CF is defined by two green borders and two red borders (Figure 1A,B). Only objects (here, TH+ neurons) located within the CF that do not touch any border or cross the green lines are counted, whereas those touching the red lines are excluded. This approach is mandatory to avoid counting bias, especially double counting. CF dimensions are adjusted so that, on average, each frame contains approximately 3–6 countable neurons, ensuring efficient sampling while maintaining acceptable variance (Figure 1B).
- Area sampling fraction (ASF): The ASF defines the proportion of the ROI area that is sampled and is determined by the ratio between the counting frame area and the x–y step length. ASF is selected based on the spatial distribution of neurons within the ROI. Relatively homogeneous distributions allow for lower ASF values, whereas heterogeneous or clustered distributions require higher ASF to compensate for increased variance. Counting frames are positioned in a systematic-random manner across the ROI by the software (Figure 1A).
- Optical dissector height and guard zones: three-dimensional sampling is achieved using the optical dissector probe along the z-axis. The dissector height is defined within the measured section thickness and is chosen based on both tissue integrity and the axial distribution of neurons. Guard zones are applied at the upper and lower surfaces of the section to avoid counting artifacts caused by sectioning-induced cell loss or compression. The guard zone width should be determined based on a number of parameters, including section thickness, the consistency of thickness across slides, and the size of the counting unit.
- Section sampling fraction (SSF): the section sampling fraction determines the proportion of serial sections analyzed throughout the rostro-caudal extent of the ROI. Based on the size and anatomical continuity of the target structure (here, the LC), a systematic-random series of sections is selected for analysis. The SSF is expressed as an interval (e.g., 1:3), indicating that one section is analyzed every three serial sections, with the starting section randomly selected. Cell numbers in non-sampled sections are estimated from sampled sections. As with ASF, SSF is adjusted according to the degree of regularity or heterogeneity in neuronal distribution along the anatomical axis.
Stereology Protocol Implementation and Reliability Assessment
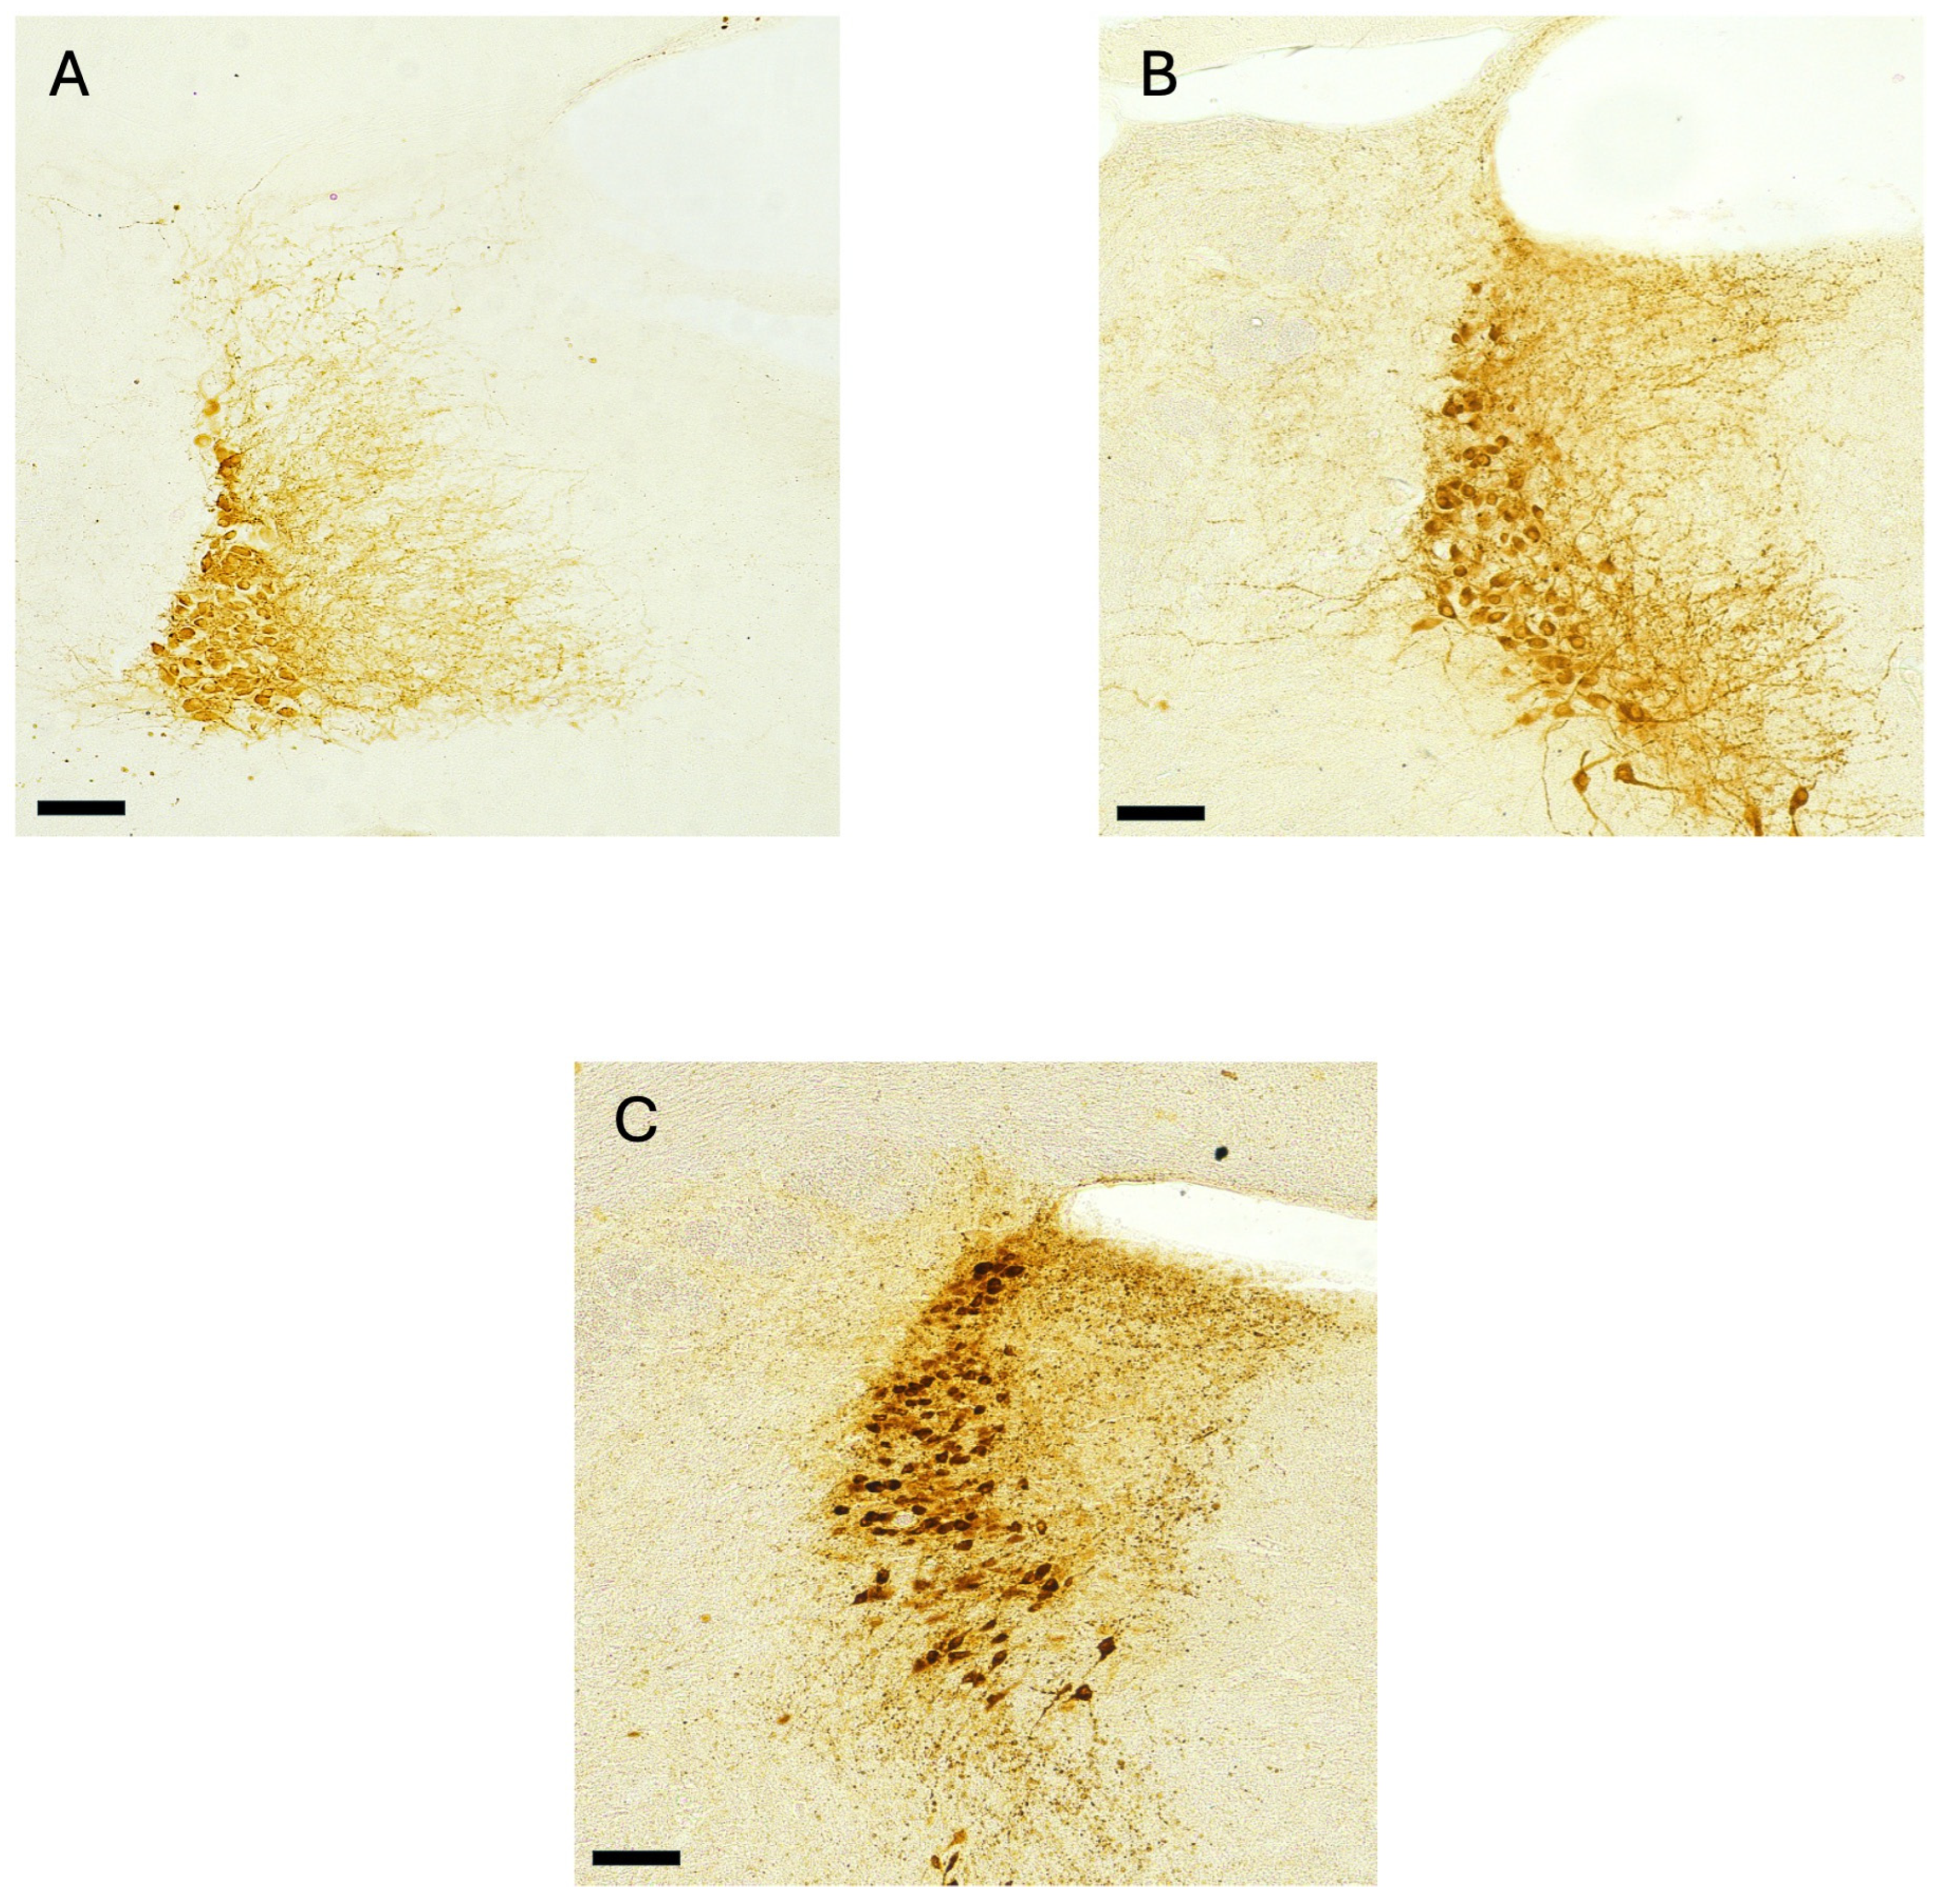
- SSF: 1:3
- SAF: 90% of sampling area
- CF: 60 μm × 60 μm
- Dissector height and top guard zone: 12 μm + 3μm.
- SSF: 1:2
- SAF: 90% of sampling area
- CF: 40 μm × 40 μm
- Dissector height and top guard zone: 15 μm + 3μm.
4. Discussion
Author Contributions
Funding
Institutional Review Board Statement
Informed Consent Statement
Data Availability Statement
Acknowledgments
Conflicts of Interest
Abbreviations
| ASF | Area Sampling Fraction |
| CE | Coefficient of Error |
| CF | Counting Frame |
| CNS | Central Nervous System |
| DAB | 3,3′-Diaminobenzidine |
| HRP | Horseradish Peroxidase |
| LC | Locus Coeruleus |
| NA | Noradrenaline |
| NGS | Normal Goat Serum |
| OF | Optical Fractionator |
| PN12 | Postnatal Day 12 |
| ROI | Region of Interest |
| SSF | Section Sampling Fraction |
| TBS | Tris Buffer Saline |
| TH | Tyrosine Hydroxylase |
References
- Poe, G.R.; Foote, S.; Eschenko, O.; Johansen, J.P.; Bouret, S.; Aston-Jones, G.; Harley, C.W.; Manahan-Vaughan, D.; Weinshenker, D.; Valentino, R.; et al. Locus Coeruleus: A New Look at the Blue Spot. Nat. Rev. Neurosci. 2020, 21, 644–659. [Google Scholar] [CrossRef] [PubMed]
- Giorgi, F.S.; Galgani, A.; Puglisi-Allegra, S.; Busceti, C.L.; Fornai, F. The Connections of Locus Coeruleus with Hypothalamus: Potential Involvement in Alzheimer’s Disease. J. Neural Transm. 2021, 128, 589–613. [Google Scholar] [CrossRef] [PubMed]
- Aston-Jones, G.; Waterhouse, B. Locus Coeruleus: From Global Projection System to Adaptive Regulation of Behavior. Brain Res. 2016, 1645, 75–78. [Google Scholar] [CrossRef] [PubMed]
- González, M.M.C.; Aston-Jones, G. Circadian Regulation of Arousal: Role of the Noradrenergic Locus Coeruleus System and Light Exposure. Sleep 2006, 29, 1327–1336. [Google Scholar] [CrossRef]
- Giorgi, F.S.; Galgani, A.; Puglisi-Allegra, S.; Limanaqi, F.; Busceti, C.L.; Fornai, F. Locus Coeruleus and Neurovascular Unit: From Its Role in Physiology to Its Potential Role in Alzheimer’s Disease Pathogenesis. J. Neurosci. Res. 2020, 98, 2406–2434. [Google Scholar] [CrossRef]
- Giorgi, F.S.; Saccaro, L.F.; Galgani, A.; Busceti, C.L.; Biagioni, F.; Frati, A.; Fornai, F. The Role of Locus Coeruleus in Neuroinflammation Occurring in Alzheimer’s Disease. Brain Res. Bull. 2019, 153, 47–58. [Google Scholar] [CrossRef]
- Feinstein, D.L.; Kalinin, S.; Braun, D. Causes, Consequences, and Cures for Neuroinflammation Mediated via the Locus Coeruleus: Noradrenergic Signaling System. J. Neurochem. 2016, 139, 154–178. [Google Scholar] [CrossRef]
- Schwarz, L.A.; Luo, L. Organization of the Locus Coeruleus-Norepinephrine System. Curr. Biol. 2015, 25, R1051–R1056. [Google Scholar] [CrossRef]
- Galgani, A.; Bartolini, E.; D’Amora, M.; Faraguna, U.; Giorgi, F.S. The Central Noradrenergic System in Neurodevelopmental Disorders: Merging Experimental and Clinical Evidence. Int. J. Mol. Sci. 2023, 24, 5805. [Google Scholar] [CrossRef]
- Galgani, A.; Giorgi, F.S. Exploring the Role of Locus Coeruleus in Alzheimer’s Disease: A Comprehensive Update on MRI Studies and Implications. Curr. Neurol. Neurosci. Rep. 2023, 23, 925–936. [Google Scholar] [CrossRef]
- Bast, N.; Poustka, L.; Freitag, C.M. The Locus Coeruleus–Norepinephrine System as Pacemaker of Attention–a Developmental Mechanism of Derailed Attentional Function in Autism Spectrum Disorder. Eur. J. Neurosci. 2018, 47, 115–125. [Google Scholar] [CrossRef] [PubMed]
- Beardmore, R.; Hou, R.; Darekar, A.; Holmes, C.; Boche, D. The Locus Coeruleus in Aging and Alzheimer’s Disease: A Postmortem and Brain Imaging Review. J. Alzheimer’s Dis. 2021, 83, 5–22. [Google Scholar] [CrossRef]
- Lavezzi, A.M.; Alfonsi, G.; Matturri, L. Pathophysiology of the Human Locus Coeruleus Complex in Fetal/Neonatal Sudden Unexplained Death. Neurol. Res. 2013, 35, 44–53. [Google Scholar] [CrossRef] [PubMed]
- Pagida, M.A.; Konstantinidou, A.E.; Korelidou, A.; Katsika, D.; Tsekoura, E.; Patsouris, E.; Panayotacopoulou, M.T. The Effect of Perinatal Hypoxic/Ischemic Injury on Tyrosine Hydroxylase Expression in the Locus Coeruleus of the Human Neonate. Dev. Neurosci. 2016, 38, 41–53. [Google Scholar] [CrossRef]
- Oertel, W.H.; Henrich, M.T.; Janzen, A.; Geibl, F.F. The Locus Coeruleus: Another Vulnerability Target in Parkinson’s Disease. Mov. Disord. 2019, 34, 1423–1429. [Google Scholar] [CrossRef]
- Jacobs, H.I.L.; Becker, J.A.; Kwong, K.; Engels-Domínguez, N.; Prokopiou, P.C.; Papp, K.V.; Properzi, M.; Hampton, O.L.; d’Oleire Uquillas, F.; Sanchez, J.S.; et al. In Vivo and Neuropathology Data Support Locus Coeruleus Integrity as Indicator of Alzheimer’s Disease Pathology and Cognitive Decline. Sci. Transl. Med. 2021, 13, eabj2511. [Google Scholar] [CrossRef]
- Galgani, A.; Lombardo, F.; Martini, N.; Vergallo, A.; Bastiani, L.; Hampel, H.; Hlavata, H.; Baldacci, F.; Tognoni, G.; De Marchi, D.; et al. Magnetic Resonance Imaging Locus Coeruleus Abnormality in Amnestic Mild Cognitive Impairment Is Associated with Future Progression to Dementia. Eur. J. Neurol. 2023, 30, 32–46. [Google Scholar] [CrossRef]
- Aghakhanyan, G.; Galgani, A.; Vergallo, A.; Lombardo, F.; Martini, N.; Baldacci, F.; Tognoni, G.; Leo, A.; Guidoccio, F.; Siciliano, G.; et al. Brain Metabolic Correlates of Locus Coeruleus Degeneration in Alzheimer’s Disease: A Multimodal Neuroimaging Study. Neurobiol. Aging 2023, 122, 12–21. [Google Scholar] [CrossRef]
- Heneka, M.T.; Ramanathan, M.; Jacobs, A.H.; Dumitrescu-Ozimek, L.; Bilkei-Gorzo, A.; Debeir, T.; Sastre, M.; Galldiks, N.; Zimmer, A.; Hoehn, M.; et al. Locus Ceruleus Degeneration Promotes Alzheimer Pathogenesis in Amyloid Precursor Protein 23 Transgenic Mice. J. Neurosci. 2006, 26, 1343–1354. [Google Scholar] [CrossRef]
- Jardanhazi-Kurutz, D.; Kummer, M.P.; Terwel, D.; Vogel, K.; Dyrks, T.; Thiele, A.; Heneka, M.T. Induced LC Degeneration in APP/PS1 Transgenic Mice Accelerates Early Cerebral Amyloidosis and Cognitive Deficits. Neurochem. Int. 2010, 57, 375–382. [Google Scholar] [CrossRef]
- Heneka, M.T.; Nadrigny, F.; Regen, T.; Martinez-Hernandez, A.; Dumitrescu-Ozimek, L.; Terwel, D.; Jardanhazi-Kurutz, D.; Walter, J.; Kirchhoff, F.; Hanisch, U.K.; et al. Locus Ceruleus Controls Alzheimer’s Disease Pathology by Modulating Microglial Functions through Norepinephrine. Proc. Natl. Acad. Sci. USA 2010, 107, 6058–6063. [Google Scholar] [CrossRef]
- Trujillo, P.; Petersen, K.J.; Cronin, M.J.; Lin, Y.C.; Kang, H.; Donahue, M.J.; Smith, S.A.; Claassen, D.O. Quantitative Magnetization Transfer Imaging of the Human Locus Coeruleus. Neuroimage 2019, 200, 191–198. [Google Scholar] [CrossRef] [PubMed]
- Trujillo, P.; Aumann, M.A.; Claassen, D.O. Neuromelanin-Sensitive MRI as a Promising Biomarker of Catecholamine Function. Brain 2024, 147, 337–351. [Google Scholar] [CrossRef] [PubMed]
- Zhu, Y.; Fenik, P.; Zhan, G.; Somach, R.; Xin, R.; Veasey, S. Intermittent Short Sleep Results in Lasting Sleep Wake Disturbances and Degeneration of Locus Coeruleus and Orexinergic Neurons. Sleep 2016, 39, 1601–1611. [Google Scholar] [CrossRef] [PubMed]
- West, M.J.; Gundersen, H.J.G. Unbiased Stereological Estimation of the Number of Neurons in the Human Hippocampus. J. Comp. Neurol. 1990, 296, 1–22. [Google Scholar] [CrossRef]
- Abusaad, I.; Mackay, D.; Zhao, J.; Stanford, P.; Collier, D.A.; Everall, I.P. Stereological Estimation of the Total Number of Neurons in the Murine Hippocampus Using the Optical Disector. J. Comp. Neurol. 1999, 408, 560–566. [Google Scholar] [CrossRef]
- West, M.J. Introduction to Stereology. Cold Spring Harb. Protoc. 2012, 2012, pdb.top070623. [Google Scholar] [CrossRef]
- West, M.J.; Slomianka, L.; Gundersen, H.J.G. Unbiased Stereological Estimation of the Total Number of Neurons in the Subdivisions of the Rat Hippocampus Using the Optical Fractionator. Anat. Rec. 1991, 231, 482–497. [Google Scholar] [CrossRef]
- Counts, S.E.; Mufson, E.J. Locus Coeruleus. In The Human Nervous System; Mai, J.K., Paxinos, G., Eds.; Academic Press: Cambridge, MA, USA, 2012; pp. 427–440. [Google Scholar]
- Galgani, A.; Scotto, M.; Faraguna, U.; Giorgi, F.S. Fading Blue: Exploring the Causes of Locus Coeruleus Damage Across the Lifespan. Antioxidants 2025, 14, 255. [Google Scholar] [CrossRef]
- Zhong, M.Z.; Peng, T.; Duarte, M.L.; Wang, M.; Cai, D. Updates on Mouse Models of Alzheimer’s Disease. Mol. Neurodegener. 2024, 19, 23. [Google Scholar] [CrossRef]
- Kaufman, S. Tyrosine Hydroxylase. Adv. Enzymol. Relat. Areas Mol. Biol. 2006, 70, 103–220. [Google Scholar] [CrossRef]
- Bezin, L.; Marcel, D.; Debure, L.I.; Ginovart, N.; Rousset, C.; Pujol, J.F.; Weissmann, D. Postnatal Development of the Tyrosine Hydroxylase-Containing Cell Population within the Rat Locus Coeruleus: Topological Organization Andphenotypic Plasticity. J. Neurosci. 1994, 14, 7486–7501. [Google Scholar] [CrossRef] [PubMed]
- Paxinos, G.; Franklin, K.B.J. Paxinos and Franklin’s The Mouse Brain in Stereotaxic Coordinates, 5th ed.; Elsevier Science: Amsterdam, The Netherlands, 2019. [Google Scholar]
- Gundersen, H.J.G.; Jensen, E.B.V.; Kiêu, K.; Nielsen, J. The Efficiency of Systematic Sampling in Stereology-Reconsidered. J. Microsc. 1999, 193, 199–211. [Google Scholar] [CrossRef] [PubMed]
- Gundersen, H.J.G.; Jensen, E.B. The Efficiency of Systematic Sampling in Stereology and Its Prediction. J. Microsc. 1987, 147, 229–263. [Google Scholar] [CrossRef]
- Glaser, E.M.; Wilson, P.D. The Coefficient of Error of Optical Fractionator Population Size Estimates: A Computer Simulation Comparing Three Estimators. J. Microsc. 1998, 192, 163–171. [Google Scholar] [CrossRef]
- Abercrombie, M. Estimation of Nuclear Population from Microtome Sections. Anat. Rec. 1946, 94, 239–247. [Google Scholar] [CrossRef]
- Clarke, P.G.H. An Unbiased Correction Factor for Cell Counts in Histological Sections. J. Neurosci. Methods 1993, 49, 133–140. [Google Scholar] [CrossRef]
- Hedreen, J.C. What Was Wrong With the Abercrombie and Empirical Cell Counting Methods? A Review. Anat. Rec. 1998, 250, 373–380. [Google Scholar] [CrossRef]
- Vreven, A.; Aston-Jones, G.; Pickering, A.E.; Poe, G.R.; Waterhouse, B.; Totah, N.K. In Search of the Locus Coeruleus: Guidelines for Identifying Anatomical Boundaries and Electrophysiological Properties of the Blue Spot in Mice, Fish, Finches, and Beyond. J. Neurophysiol. 2024, 132, 226–239. [Google Scholar] [CrossRef]
- McKinney, A.; Hu, M.; Hoskins, A.; Mohammadyar, A.; Naeem, N.; Jing, J.; Patel, S.S.; Sheth, B.R.; Jiang, X. Cellular Composition and Circuit Organization of the Locus Coeruleus of Adult Mice. eLife 2023, 12, e80100. [Google Scholar] [CrossRef]
- Kelberman, M.A.; Rorabaugh, J.M.; Anderson, C.R.; Marriott, A.; DePuy, S.D.; Rasmussen, K.; McCann, K.E.; Weiss, J.M.; Weinshenker, D. Age-Dependent Dysregulation of Locus Coeruleus Firing in a Transgenic Rat Model of Alzheimer’s Disease. Neurobiol. Aging 2023, 125, 98–108. [Google Scholar] [CrossRef]

Disclaimer/Publisher’s Note: The statements, opinions and data contained in all publications are solely those of the individual author(s) and contributor(s) and not of MDPI and/or the editor(s). MDPI and/or the editor(s) disclaim responsibility for any injury to people or property resulting from any ideas, methods, instructions or products referred to in the content. |
© 2026 by the authors. Licensee MDPI, Basel, Switzerland. This article is an open access article distributed under the terms and conditions of the Creative Commons Attribution (CC BY) license.
Share and Cite
Scotto, M.; Galgani, A.; Boido, M.; Mohammady, N.; Vercelli, A.; Giorgi, F.S. Stereological Assessment of Locus Coeruleus in the Mouse: A Methodological Study in Pups and Adult Animals. Methods Protoc. 2026, 9, 64. https://doi.org/10.3390/mps9020064
Scotto M, Galgani A, Boido M, Mohammady N, Vercelli A, Giorgi FS. Stereological Assessment of Locus Coeruleus in the Mouse: A Methodological Study in Pups and Adult Animals. Methods and Protocols. 2026; 9(2):64. https://doi.org/10.3390/mps9020064
Chicago/Turabian StyleScotto, Marco, Alessandro Galgani, Marina Boido, Nooria Mohammady, Alessandro Vercelli, and Filippo S. Giorgi. 2026. "Stereological Assessment of Locus Coeruleus in the Mouse: A Methodological Study in Pups and Adult Animals" Methods and Protocols 9, no. 2: 64. https://doi.org/10.3390/mps9020064
APA StyleScotto, M., Galgani, A., Boido, M., Mohammady, N., Vercelli, A., & Giorgi, F. S. (2026). Stereological Assessment of Locus Coeruleus in the Mouse: A Methodological Study in Pups and Adult Animals. Methods and Protocols, 9(2), 64. https://doi.org/10.3390/mps9020064