
Protocol for the Systematic Quantitative Ultrastructural Analysis of Mitochondria in Cardiac Tissue
 , , and
Abstract
1. Introduction
2. Experimental Design
2.1. Materials
- Cardioplegic solution (Dr. Franz Köhler Chemie GmbH, Bensheim, Germany, CUSTODIOL®);
- Liquid nitrogen;
- Karnovsky Fixative (aqueous buffered glutaraldehyde solution);
- Sodium Cacodylate 0.1 M (ScienceServices, Munich, Germany Article#E12310);
- Osmiumtetraoxide, 2% (ScienceServices, Munich, Germany Article#19100);
- Double-distilled water;
- Ethanol (Honeywell Chemicals, Offenbach, Germany, Article#32205-2.5L-GL);
- Propylene oxide (Sigma Aldrich, Darmstadt, Germany, Article#110205-1L);
- EPON resin (ScienceServices, Munich, Germany Article#14120);
- Aqueous 2% uranyl acetate solution (Serva, Heidelberg, Germany, Article# 77870.02);
- Two-percent lead citrate solution (Leica, Wetzlar, Germany, Article# 16707235).
2.2. Equipment
- LYNX microscopy tissue processor (Reichert-Jung, Wetzlar, Germany);
- Leica Ultracut S Microtome (Leica-Reichert, Wetzlar, Germany);
- LEO 912AB electron microscope (Zeiss, Oberkochen, Germany);
- Side-mounted camera with a 2k × 2k resolution and iTEM software version 5.2 (OSIS, Muenster, Germany);
- Graphics tablet Huion Inspiroy Dial 2 (Huion, Shenzhen, China);
- RADIUS version 2.2 (EMSIS, Muenster, Germany);
- Excel version 1808 (Microsoft, Redmond, WA, USA);
- GraphPad Prism version 9.5.1 (GraphPad Software, San Diego, CA, USA).
3. Procedure
3.1. Sample Acquisition and Evaluation
3.1.1. Sample Acquisition and Handling
- Acquire representative tissue samples from the left ventricle of the human heart in open heart surgery, while being mindful of the presence of stents and fibrosis.
- After removal, transfer the samples into a cardioplegic solution (CUSTODIOL®, Dr. Franz Köhler Chemie GmbH, Bensheim, Germany) at 4 °C.
- Transport the samples out of the operating room into the laboratory to snap-freeze them in liquid nitrogen.
3.1.2. Sample Preparation for TEM
- Thaw samples in Karnovsky Fixative (an aqueous buffered glutaraldehyde solution) for at least 48 h.
- Embed the samples (post fixation with osmium tetroxide, dehydration, infiltration with EPON) in the LYNX microscopy tissue processor (Reichert-Jung, Wetzlar, Germany) following the embedding protocol (Section 5.1).
- Cut semi-thin sections (0.75 µm) using the Leica Ultracut S Microtome (Leica-Reichert, Wetzlar, Germany).
- Stain the semi-thin sections with toluidine blue and basic fuchsin following the staining protocol (Section 5.2).
- Select relevant areas.
- Trim away non-relevant areas of the sample block as needed.
- Cut ultra-thin sections (80 nm) using the Leica Ultracut S Microtome (Leica-Reichert, Wetzlar, Germany).
- Contrast the ultra-thin sections with aqueous 2% uranyl acetate and 2% lead citrate solutions for 10 min each using the contrasting protocol (Section 5.3).
3.1.3. Image Acquisition and Analysis
- For sample documentation, use the 2k × 2k side-mounted camera of a LEO 912AB electron microscope (Zeiss, Oberkochen, Germany) with iTEM software version 5.2 (OSIS, Muenster, Germany) to depict the mitochondria of the cardiac tissue at 10,000× magnification.
- For the evaluation of ultrastructural images, open the acquired images using the RADIUS version 2.2 software (EMSIS, Muenster, Germany).
- Select areas for evaluation (measuring frame), excluding interstitial space and artifacts.
- Use the Huion Inspiroy Dial 2 graphic tablet to individually annotate the mitochondria using the freehand polygon function.
- Obtain the measured values of area, perimeter, and sphericity from RADIUS version 2.2 (EMSIS, Muenster, Germany).
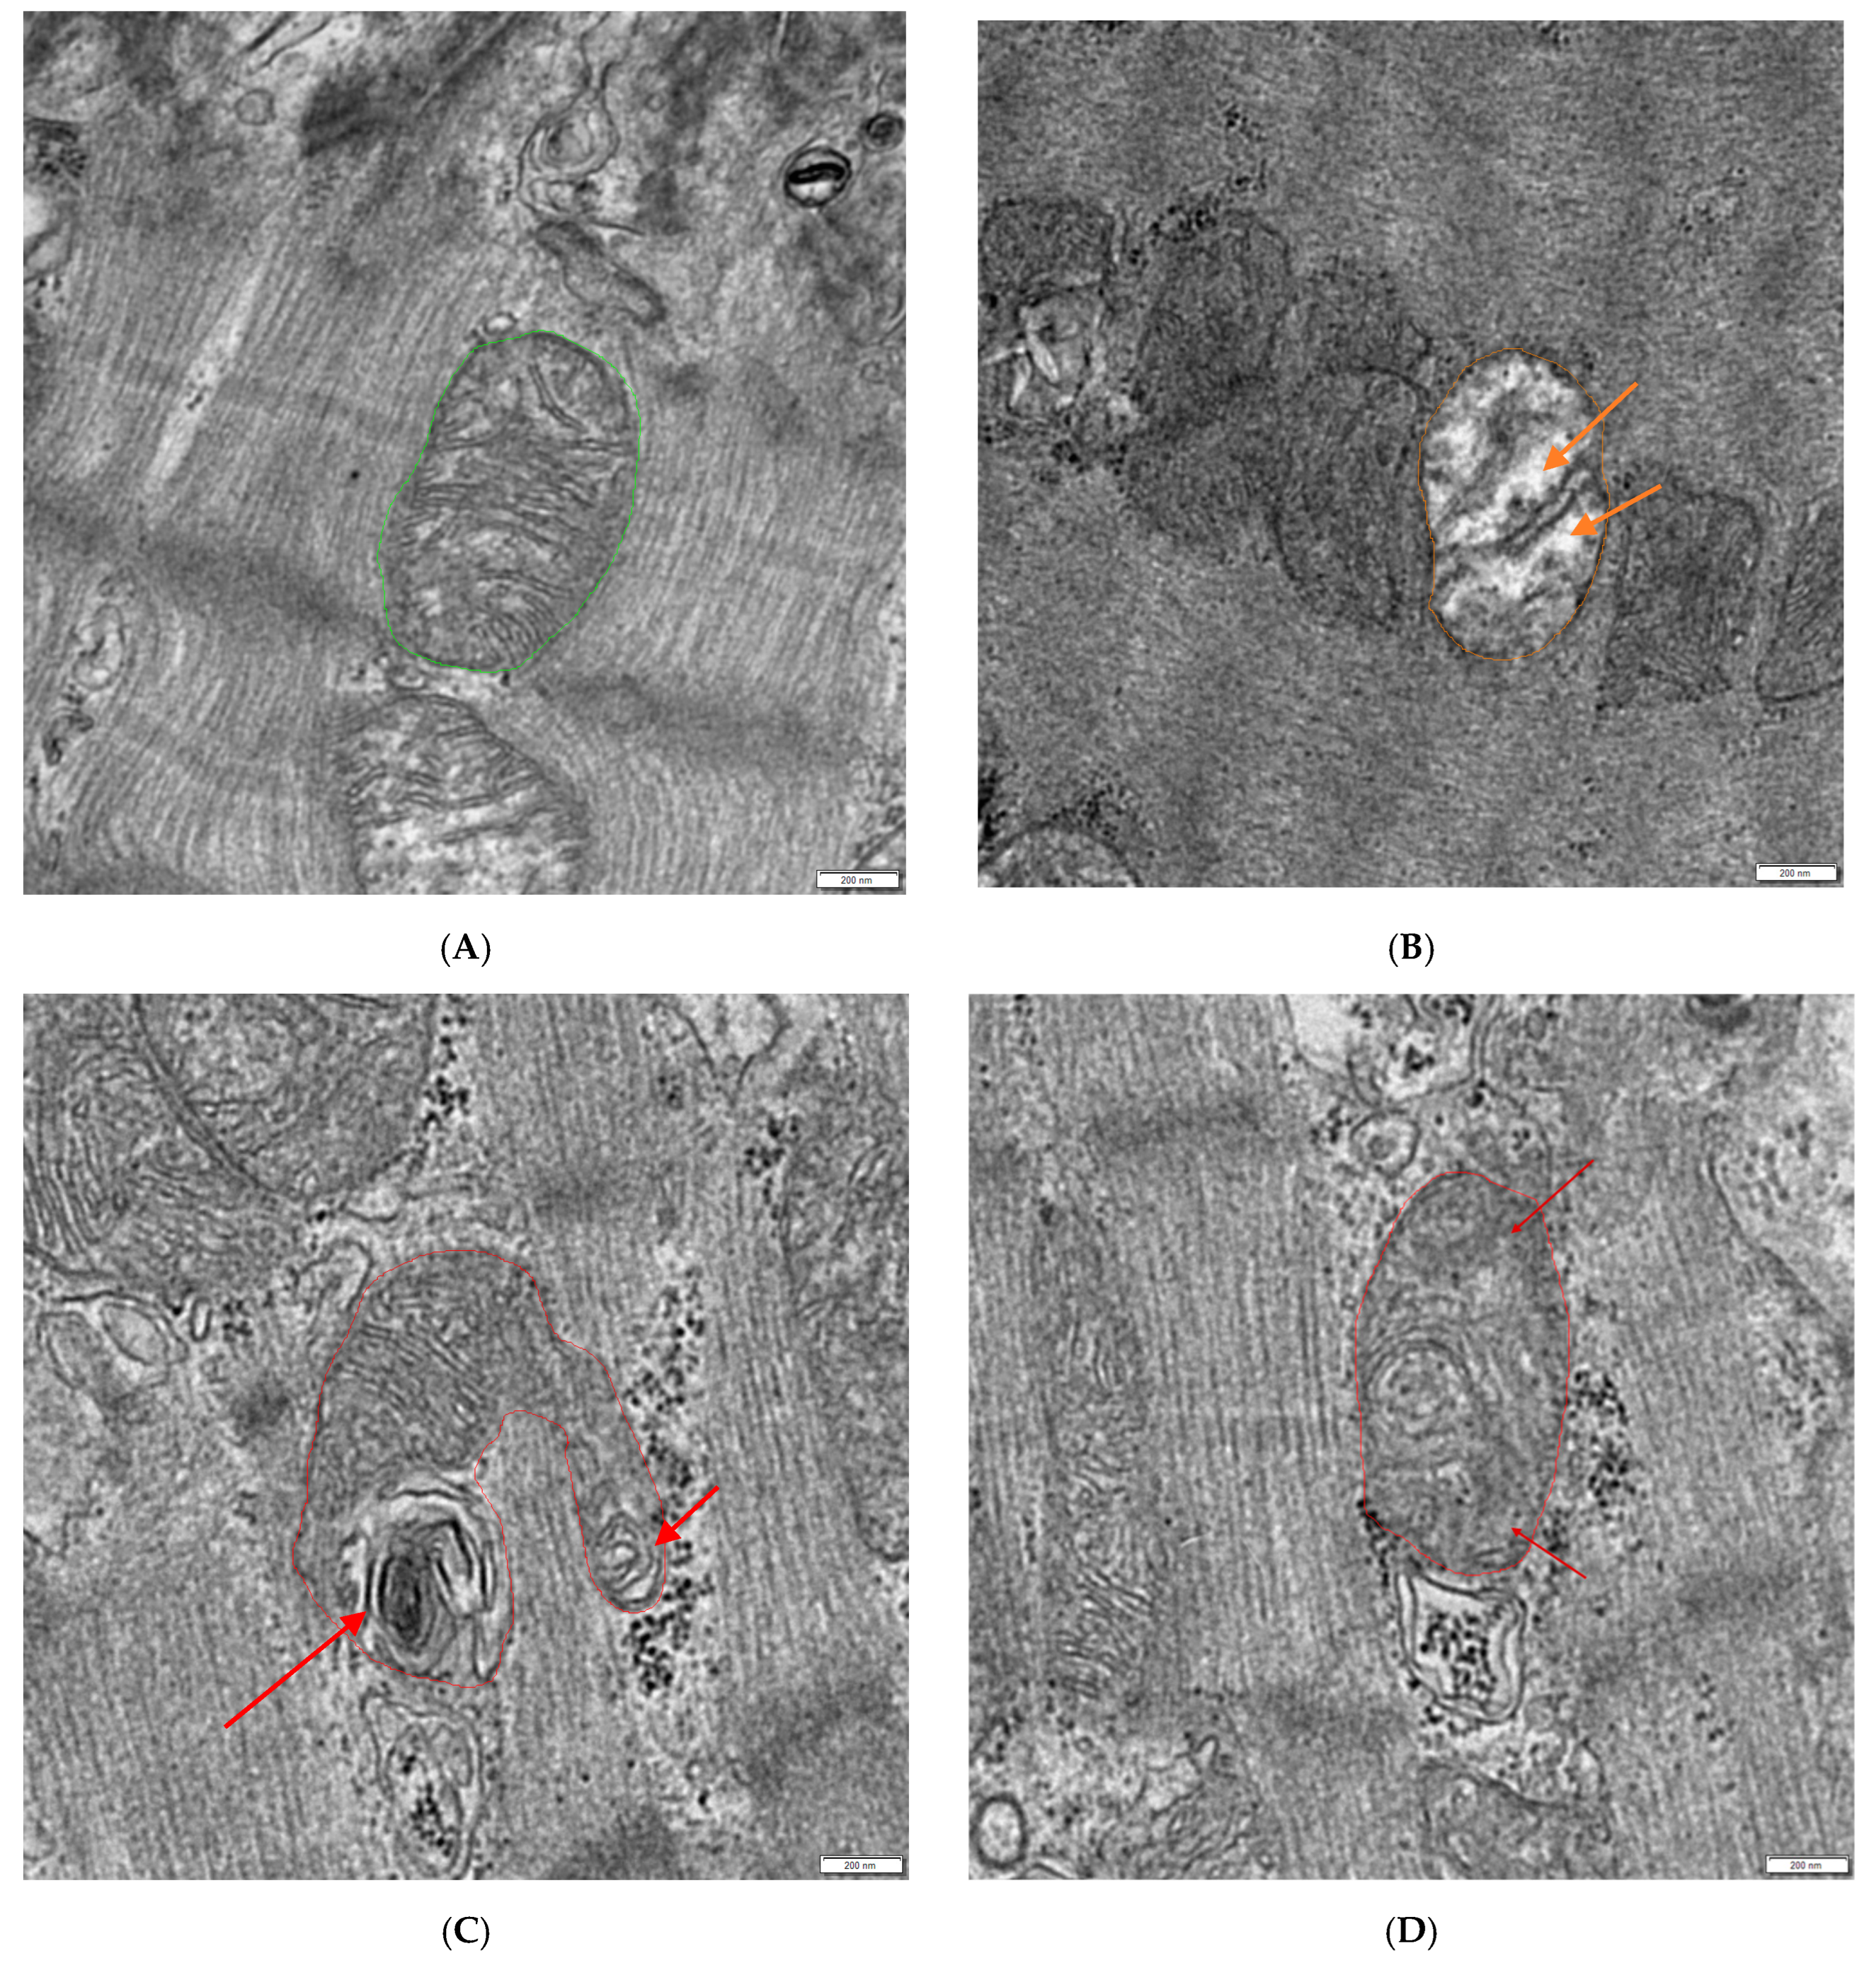
- Manually evaluate which mitochondria appear normal, hydropic (decreased matrix density with loss of cristae), or otherwise defective (lamellar structures arising from mitochondria or the loss of cristae without the loss of matrix density) and count them (see Figure 1).
- Obtain the mean gray value of the annotated mitochondria using the RADIUS version 2.2 software (EMSIS, Muenster, Germany).
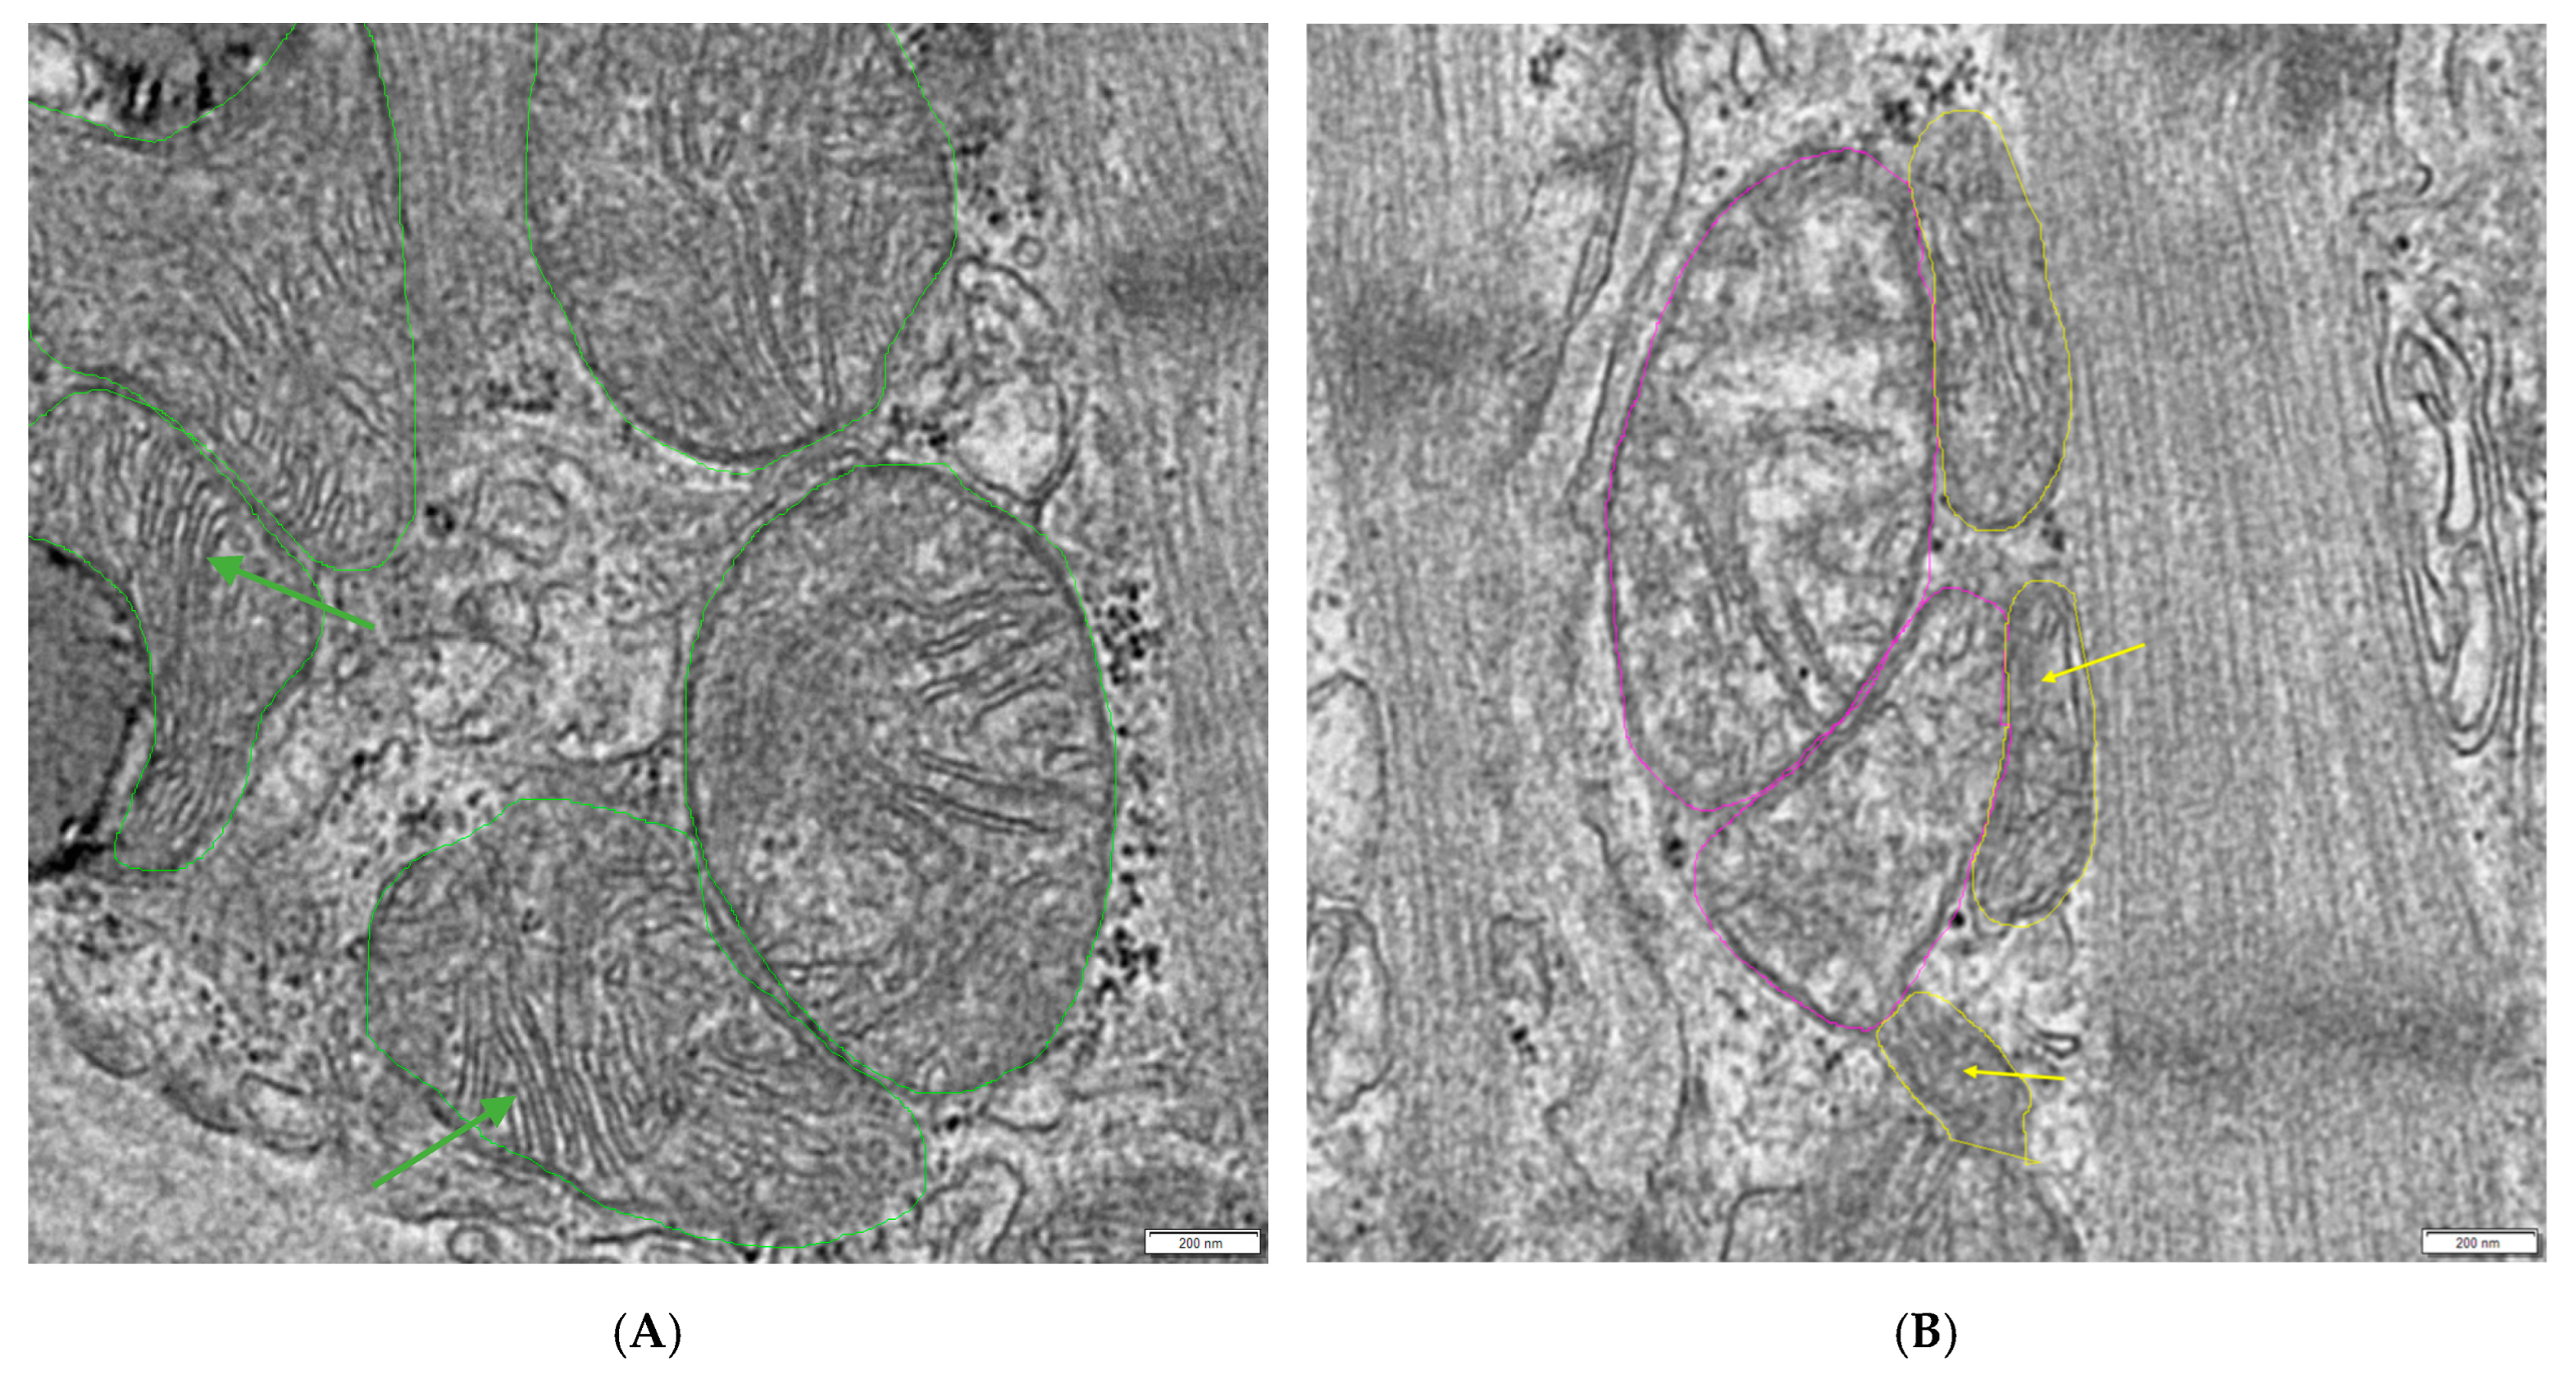
- Select 3 normal mitochondria with dense matrices and clearly visible cristae (see Figure 2A).
- Use Excel version 1808 (Microsoft, Redmond, WA, USA) to calculate the mean gray value of these 3 mitochondria (base line) and calculate the cut off limit using the multiplication factor 1.1 (1.1 × base line = cut off limit).
- If the mean gray value of the borderline mitochondria is equal or greater than the calculated cut off limit, count them as hydropic.
3.1.4. Calculation of the Conglomeration Score and Statistical Analysis
- Use Excel version 1808 (Microsoft, Redmond, WA, USA) to calculate the conglomeration score (CS) (Section 3.3). If a measuring frame (MF) shows a cluster of mitochondria that is no longer situated in between but is overgrowing the muscle fibers, this MF is counted as conglomerated. Depending on the size of the MF, the area that shows the conglomeration is weighted proportionally to the total analyzed area per patient.
- Use Excel version 1808 (Microsoft, Redmond, WA, USA) to count the total number of annotated mitochondria and the number of normal, hydropic, and otherwise defect mitochondria;
- Transfer your raw data to GraphPad Prism version 9.5.1 (GraphPad Software, San Diego, CA, USA) using a separate column data table for each measured parameter.
- Conduct either a t-test (2 groups) or a one-way ANOVA (more than 2 groups) for each data table.
- Create a new column table for the correlation of measurement parameters. Enter the data so that the individual measurement parameters form columns and ensure that the patient data in each column is always entered in the same order of rows (example: from top to bottom, patient 1 to patient 10).
- Create a correlation matrix for this table.
3.2. Conglomeration Score Calculation
no; and MF3 = 80 µm2, conglomeration = yes.
3.3. Definition of the Multiplication Factor
4. Expected Results
5. Reagents Setup
5.1. Embedding Protocol
5.2. Staining Protocol
- Place the glass slide containing the semi-thin sections on a heat plate at 80 °C.
- Apply 0.1% aqueous toluidine blue solution on the slide and stain for 60 s.
- Rinse off the toluidine blue with double-distilled water.
- Place the glass slide back onto the heat plate.
- Apply 0.1% basic fuchsin solution on the slide and stain for 30 s.
- Rinse of the basic fuchsin with double-distilled water.
- Dry the slide on the heat plate.
5.3. Contrasting Protocol
- Line the bottom of two Petri dishes with parafilm.
- Cover a Petri dish lid with aluminum foil and place it on one of the Petri dish bottoms (Petri dish 1).
- Place one of the Petri dish bottoms into a slightly larger Petri dish, place sodium hydroxide pellets in the space between, and cover with a lid (Petri dish 2).
- Prepare three 100 mL beakers containing double-distilled water.
- Put a drop of uranyl acetate onto the parafilm-covered surface of Petri dish one and a drop of lead citrate in Petri dish 2.
- Place the copper grid containing the ultra-thin section on the uranyl acetate drop with the sample side down.
- Cover the Petri dish with the lid and wait for 10 min.
- Wash the copper grid by carefully dunking the grid vertically into the water multiple times for each beaker.
- Dry the residual water by blotting with a piece of filter paper at the edge of the grid.
- Place the copper grid containing the ultra-thin section on the lead citrate drop with the sample side down.
- Cover the Petri dish with the lid and wait for 10 min.
- Wash the copper grid by carefully dunking the grid vertically into the water multiple times for each beaker.
- Dry the residual water by blotting with a piece of filter paper at the edge of the grid.
- Place grids into a new Petri dish to dry and cover it with a lid.
Author Contributions
Funding
Institutional Review Board Statement
Informed Consent Statement
Data Availability Statement
Acknowledgments
Conflicts of Interest
References
- Chen, W.; Zhao, H.; Li, Y. Mitochondrial dynamics in health and disease: Mechanisms and potential targets. Signal Transduct. Target. Ther. 2023, 8, 333. [Google Scholar] [CrossRef] [PubMed]
- Gorman, G.S.; Chinnery, P.F.; DiMauro, S.; Hirano, M.; Koga, Y.; McFarland, R.; Suomalainen, A.; Thorburn, D.R.; Zeviani, M.; Turnbull, D.M. Mitochondrial diseases. Nat. Rev. Dis. Primers 2016, 2, 16080. [Google Scholar] [CrossRef] [PubMed]
- Zong, Y.; Li, H.; Liao, P.; Chen, L.; Pan, Y.; Zheng, Y.; Zhang, C.; Liu, D.; Zheng, M.; Gao, J. Mitochondrial dysfunction: Mechanisms and advances in therapy. Signal Transduct. Target. Ther. 2024, 9, 124. [Google Scholar] [CrossRef] [PubMed]
- Jenkins, B.C.; Neikirk, K.; Katti, P.; Claypool, S.M.; Kirabo, A.; McReynolds, M.R.; Hinton, A., Jr. Mitochondria in disease: Changes in shapes and dynamics. Trends Biochem. Sci. 2024, 49, 346–360. [Google Scholar] [CrossRef] [PubMed]
- Shami, G.J.; Cheng, D.; Verhaegh, P.; Koek, G.; Wisse, E.; Braet, F. Three-dimensional ultrastructure of giant mitochondria in human non-alcoholic fatty liver disease. Sci. Rep. 2021, 11, 3319. [Google Scholar] [CrossRef] [PubMed]
- Ghadially, F.N. Ultrastructural Pathology of the Cell and Matrix: A Text and Atlas of Physiological and Pathological Alterations in the Fine Structure of Cellular and Extracellular Components, 3rd ed.; Butterworths: London, UK, 1988. [Google Scholar]
- Trotta, A.P.; Chipuk, J.E. Mitochondrial dynamics as regulators of cancer biology. Cell Mol. Life Sci. 2017, 74, 1999–2017. [Google Scholar] [CrossRef] [PubMed]
- Keskinoz, E.N.; Celik, M.; Toklucu, E.S.; Birisik, K.; Erisir, A.; Oz-Arslan, D. Mitochondrial Alterations in Alzheimer’s Disease: Insight from the 5xFAD Mouse Model. Mol. Neurobiol. 2024, 62, 7075–7092. [Google Scholar] [CrossRef] [PubMed]
- Zick, M.; Rabl, R.; Reichert, A.S. Cristae formation-linking ultrastructure and function of mitochondria. Biochim. Biophys. Acta 2009, 1793, 5–19. [Google Scholar] [CrossRef] [PubMed]
- Brandt, T.; Mourier, A.; Tain, L.S.; Partridge, L.; Larsson, N.G.; Kühlbrandt, W. Changes of mitochondrial ultrastructure and function during ageing in mice and Drosophila. elife 2017, 6, e24662. [Google Scholar] [CrossRef] [PubMed]
- Polo, C.C.; Fonseca-Alaniz, M.H.; Chen, J.H.; Ekman, A.; McDermott, G.; Meneau, F.; Krieger, J.E.; Miyakawa, A.A. Three-dimensional imaging of mitochondrial cristae complexity using cryo-soft X-ray tomography. Sci. Rep. 2020, 10, 21045. [Google Scholar] [CrossRef] [PubMed]
- Huang, C.; Deng, K.; Wu, M. Mitochondrial cristae in health and disease. Int. J. Biol. Macromol. 2023, 235, 123755. [Google Scholar] [CrossRef] [PubMed]
- Rumbeiha, W.K.; Kim, D.-S.; Min, A.; Nair, M.; Giulivi, C. Disrupted brain mitochondrial morphology after in vivo hydrogen sulfide exposure. Sci. Rep. 2023, 13, 18129. [Google Scholar] [CrossRef] [PubMed]
- Demeter-Haludka, V.; Kovács, M.; Petrus, A.; Patai, R.; Muntean, D.M.; Siklós, L.; Végh, Á. Examination of the Role of Mitochondrial Morphology and Function in the Cardioprotective Effect of Sodium Nitrite Administered 24 h Before Ischemia/Reperfusion Injury. Front. Pharmacol. 2018, 9, 286. [Google Scholar] [CrossRef] [PubMed]
- Duranova, H.; Valkova, V.; Knazicka, Z.; Olexikova, L.; Vasicek, J. Mitochondria: A worthwhile object for ultrastructural qualitative characterization and quantification of cells at physiological and pathophysiological states using conventional transmission electron microscopy. Acta Histochem. 2020, 122, 151646. [Google Scholar] [CrossRef] [PubMed]
- Schönmehl, R.; Mendelsohn, D.H.; Winter, L.; Pabel, S.; Niedermair, T.; Evert, K.; Cheung, W.H.; Wong, R.M.Y.; Schmitt, V.H.; Keller, K.; et al. Comparative Analysis of Mitochondria Surrounding the Intercalated Discs in Heart Diseases-An Ultrastructural Pilot Study. Int. J. Mol. Sci. 2024, 25, 7644. [Google Scholar] [CrossRef] [PubMed]
- Hinton, A., Jr.; Claypool, S.M.; Neikirk, K.; Senoo, N.; Wanjalla, C.N.; Kirabo, A.; Williams, C.R. Mitochondrial Structure and Function in Human Heart Failure. Circ. Res. 2024, 135, 372–396. [Google Scholar] [CrossRef] [PubMed]
- Vue, Z.; Neikirk, K.; Vang, L.; Garza-Lopez, E.; Christensen, T.A.; Shao, J.; Lam, J.; Beasley, H.K.; Marshall, A.G.; Crabtree, A.; et al. Three-dimensional mitochondria reconstructions of murine cardiac muscle changes in size across aging. Am. J. Physiol. Heart Circ. Physiol. 2023, 325, H965–H982. [Google Scholar] [CrossRef] [PubMed]
- Paraskevaidis, I.; Kourek, C.; Farmakis, D.; Tsougos, E. Mitochondrial Dysfunction in Cardiac Disease: The Fort Fell. Biomolecules 2024, 14, 1534. [Google Scholar] [CrossRef] [PubMed]

| Vial | Chemical | Time |
|---|---|---|
| 1 | Sodium Cacodylate 0.1 M | 30 min |
| 2 | Sodium Cacodylate 0.1 M | 30 min |
| 3 | Sodium Cacodylate 0.1 M + 2% OsO4 (1:1) (final concentration 1%) | 120 min |
| 4 | Sodium Cacodylate 0.1 M | 30 min |
| 5 | Double-distilled water | 10 min |
| 6 | Double-distilled water | 10 min |
| 7 | Double-distilled water | 10 min |
| 8 | Ethanol 50% | 15 min |
| 9 | Ethanol 70% | 15 min |
| 10 | Ethanol 90% | 15 min |
| 11 | Ethanol 95% | 15 min |
| 12 | Ethanol 100% | 15 min |
| 13 | Ethanol 100% | 15 min |
| 14 | Ethanol 100% | 15 min |
| 15 | 1,2-Propylene oxide | 30 min |
| 16 | 1,2-Propylene oxide | 30 min |
| 17 | 1,2-Propylene oxide + EPON (1:1) | 180 min |
| 18 | EPON | 600–900 min |
Disclaimer/Publisher’s Note: The statements, opinions and data contained in all publications are solely those of the individual author(s) and contributor(s) and not of MDPI and/or the editor(s). MDPI and/or the editor(s) disclaim responsibility for any injury to people or property resulting from any ideas, methods, instructions or products referred to in the content. |
© 2025 by the authors. Licensee MDPI, Basel, Switzerland. This article is an open access article distributed under the terms and conditions of the Creative Commons Attribution (CC BY) license (https://creativecommons.org/licenses/by/4.0/).
Share and Cite
Schönmehl, R.; Winter, L.; Mendelsohn, D.H.; Cheung, W.-H.; Wong, R.M.Y.; Pabel, S.; Sossalla, S.; Brochhausen, C. Protocol for the Systematic Quantitative Ultrastructural Analysis of Mitochondria in Cardiac Tissue. Methods Protoc. 2025, 8, 87. https://doi.org/10.3390/mps8040087
Schönmehl R, Winter L, Mendelsohn DH, Cheung W-H, Wong RMY, Pabel S, Sossalla S, Brochhausen C. Protocol for the Systematic Quantitative Ultrastructural Analysis of Mitochondria in Cardiac Tissue. Methods and Protocols. 2025; 8(4):87. https://doi.org/10.3390/mps8040087
Chicago/Turabian StyleSchönmehl, Rebecca, Lina Winter, Daniel H. Mendelsohn, Wing-Hoi Cheung, Ronald Man Yeung Wong, Steffen Pabel, Samuel Sossalla, and Christoph Brochhausen. 2025. "Protocol for the Systematic Quantitative Ultrastructural Analysis of Mitochondria in Cardiac Tissue" Methods and Protocols 8, no. 4: 87. https://doi.org/10.3390/mps8040087
APA StyleSchönmehl, R., Winter, L., Mendelsohn, D. H., Cheung, W.-H., Wong, R. M. Y., Pabel, S., Sossalla, S., & Brochhausen, C. (2025). Protocol for the Systematic Quantitative Ultrastructural Analysis of Mitochondria in Cardiac Tissue. Methods and Protocols, 8(4), 87. https://doi.org/10.3390/mps8040087