

Expression and Site-Specific Biotinylation of Human Cytosolic 5′-Nucleotidase 1A in Escherichia coli

 , , , , and
Abstract
1. Introduction
2. Materials and Methods
- Steam steriliser;
- Incubator shaker;
- Benchtop centrifuge;
- Benchtop microcentrifuge;
- Refrigerated high-speed centrifuge;
- Sonicator;
- Microplate spectrophotometer;
- pH meter;
- Magnetic stirrer and stir bars;
- Gel casting equipment;
- Gel electrophoresis system;
- Refrigerators and freezers (4 °C, −20 °C, and −80 °C);
- Flow cytometer;
- Air-displacement pipettes and tips;
- Pipette controller and serological pipettes;
- Centrifuge tubes (1.5 mL, 15 mL, and 50 mL);
- 10 cm Petri dishes;
- Baffled shake flasks (250 mL, 500 mL, and 1000 mL);
- Disposable sterile inoculating loops;
- Orbital shaker;
- Rolling platform;
- Gel imaging system;
- 10 mL syringes;
- 18 gauge needles;
- 2 mL screw-top tubes;
- Trypan Blue solution 0.4%;
- Cell counting slides.
2.1. cN1A Expression Vector
2.2. E. coli Host Strain
2.3. Electrocompetent E. coli Preparation
- Streak BL21(DE3)pLysS E. coli onto an LB agar plate and incubate overnight at 37 °C.
- Select a single colony and inoculate it into 30 mL of SOB medium.
- Incubate overnight at 37 °C with shaking at 200 RPM.
- Inoculate 1 L SOB medium with 10 mL of the overnight culture and incubate at 37 °C with shaking at 200 RPM.
- Monitor bacterial growth by transferring 100 µL of the culture into a 96-well flat-bottom plate every 30–60 min and measuring optical density at 600 nm (OD600) using a microplate reader.
- Continue incubation for approximately 4 h until OD600 reaches 0.5.
- Transfer the culture into 10 × 50 mL centrifuge tubes using a 25 mL serological pipette.
- Store the remaining culture at 4 °C until ready to process.
- Centrifuge the tubes at 1700× g for 10 min at 4 °C to pellet the cells.
- Discard the supernatant.
- Fill the tubes with the remaining culture and repeat centrifugation.
- Discard the supernatant.
- Wash the pellets three times with 40 mL cold 10% glycerol by resuspending the cells and centrifuging at 1700× g for 10 min at 4 °C.
- Resuspend the final pellets in 5 mL cold 10% glycerol and combine all cells into two 50 mL centrifuge tubes.
- Centrifuge again at 1700× g for 10 min at 4 °C and discard the supernatant.
- Resuspend each pellet in 750 µL cold 10% glycerol.
- Aliquot 100 µL into 2 mL screw-cap tubes and store at −80 °C as electrocompetent glycerol stocks.
2.4. Transformation of Electrocompetent E. coli with the cN1A Vector
- Thaw100 µL of electrocompetent glycerol stock on ice.
- Divide the thawed cells evenly into two 1.5 mL microcentrifuge tubes:
- One tube for transformation (T).
- One tube as an untransformed control (C).
- Add 100 pg of pET-30a(+)[cN1A] plasmid DNA to the T tube and gently mix by flicking.
- Add the same volume of sterile water to the C tube and gently mix by flicking.
- Incubate both tubes on ice for 10–15 min.
- Transfer the transformation mixture into a pre-chilled electroporation cuvette.
- Perform electroporation using the following settings:
- Voltage: 1800 V
- Pulse duration: 3.8 s
- Immediately add 1950 µL of SOC medium to the cuvette.
- Transfer the contents into a 15 mL centrifuge tube.
- Incubate at 37 °C with shaking at 200 RPM for 1 h to allow recovery.Important: Loosely cap the tube to allow aeration.
- After recovery, add each entire culture to 5 mL of LB medium in separate 50 mL centrifuge tubes and incubate overnight at 37 °C with shaking at 200 RPM.Important: Loosely cap the tubes to allow aeration.
- Treat the control tube identically, except for the following:
- Supplement the LB medium with 34 µg/mL chloramphenicol only (no kanamycin).
- The next day, assess both cultures for turbidity as an indication of bacterial growth.
- Centrifuge the transformed culture at 3800× g for 10 min at 8 °C.
- Discard the supernatant and resuspend the cell pellet in 500 µL of cold 10% glycerol.
- Transfer the entire volume into a 2 mL screw-cap tube and store at −80 °C as transformed glycerol stock.
2.5. Small-Scale Expression Analysis
- Using a sterile inoculation loop, gently touch the surface of the transformed E. coli BL21(DE3)pLysS[cN1A] glycerol stock.Important: Do not allow the stock to thaw.
- Streak the bacteria onto an LB agar plate.
- Incubate the plate overnight at 37 °C.
- Using a sterile inoculation loop, transfer a single colony into 3 mL of LB medium in a 50 mL centrifuge tube.
- Incubate at 37 °C with shaking at 200 RPM for 3 h.Important: Loosely cap the tubes to allow aeration.
- Transfer the entire 3 mL starter culture into 100 mL of LB medium in a 500 mL baffled shaker flask.
- Incubate at 37 °C with shaking at 200 RPM.
- Monitor culture growth hourly by measuring OD600.
- When OD600 reaches 0.6, divide the culture evenly into two 50 mL subcultures in 250 mL baffled shaker flasks.
- Induce one subculture with 1 mM IPTG; leave the second as an uninduced control.
- Continue incubation for 4 h at 37 °C with shaking at 200 RPM.
- Collect 1 mL from each culture into two 1.5 mL microcentrifuge tubes for total protein analysis.
- Centrifuge at 10,000× g for 3 min to pellet the cells.
- Discard the supernatant.
- Resuspend each pellet in 100 µL PBS and add 100 µL of 2× sample loading buffer.
- Freeze samples at −20 °C until SDS-PAGE analysis.
- Centrifuge remaining cultures at 6000× g for 10 min to pellet the cells.
- Transfer the supernatant to fresh 50 mL centrifuge tubes.
- To analyse the extracellular fraction, transfer 0.5 mL of the supernatant to a 10 kDa molecular weight cut-off (MWCO) centrifugal filter unit.
- Centrifuge at 5000× g for 20 min (until concentrated to 100 µL) at 8 °C.
- Mix the concentrate with an equal volume of 2× sample loading buffer.
- Store at −20 °C until SDS-PAGE.
- Resuspend cell pellets in 4 mL cold cell lysis buffer.
- Sonicate using 10 bursts of 5 s each at 40% amplitude.
- Centrifuge the lysate at 14,000× g for 10 min to separate soluble and insoluble material.
- Transfer the supernatant containing the soluble fractions to fresh 15 mL centrifuge tubes.
- Mix 100 µL of the soluble fractions with 2× sample loading buffer and freeze at −20 °C until SDS-PAGE analysis.
- Wash the insoluble pellet (inclusion bodies) twice with 750 µL PBS:
- (a)
- Resuspend the pellet thoroughly.
- (b)
- Centrifuge at 10,000× g for 10 min.
- (c)
- Discard the supernatant.
- Resuspend the final pellet in 1.5 mL of urea denaturing buffer.
- Alternate vortexing and incubating for 10–15 min until the pellet is fully solubilised.
- Mix 100 µL of this fraction with 2× sample loading buffer.
- Freeze at −20 °C until SDS-PAGE.
2.6. Optimisation of Induction Conditions Using Dot Blot Assay
- Prepare samples for analysis.
- (a)
- Prepare a small-scale culture as described in steps 1–8 of Section 2.5.
- (b)
- Monitor OD600 regularly. When OD600 reaches 0.6, aliquot 10 mL of culture into each of five 50 mL centrifuge tubes and label as test conditions 1, 3, 4, 7, and 8.
- (c)
- Immediately add IPTG as follows:
- 0.5 mM IPTG to tubes 1 and 7.
- 1.0 mM IPTG to tubes 4 and 8.
- Do not add IPTG to tube 3 (uninduced control).
- (d)
- Incubate the tubes under the conditions listed in Table 5:
- Tubes 1, 3, and 4: 16 h at 23 °C.
- Tubes 7 and 8: 4 h at 37 °C.
- (e)
- Continue incubating the remaining culture until OD600 reaches 1.0.
- (f)
- Aliquot 10 mL of culture into each of five additional 50 mL centrifuge tubes and label as test conditions 2, 5, 6, 9, and 10.
- (g)
- Add IPTG as follows:
- 0.5 mM IPTG to tubes 2 and 5.
- 1.0 mM IPTG to tubes 6 and 10.
- Do not add IPTG to tube 9 (uninduced control).
- (h)
- Incubate these tubes under the following conditions:
- Tubes 2 and 6: 16 h at 23 °C.
- Tubes 5, 9, and 10: 4 h at 37 °C.
- (i)
- At the end of the induction period, transfer 100 µL aliquots from each culture into 1.5 mL microcentrifuge tubes.
- (j)
- Lyse the cells by sonicating at 20 kHz using ten consecutive 1 s bursts.
- (k)
- Store the lysates at −20 °C until the analysis.
- Perform dot blot analysis:
- (a)
- Spot 5 µL of each lysate directly onto a nitrocellulose membrane.
- (b)
- Label the membrane with a permanent marker indicating the position and identity of each spot.
- (c)
- Allow the membrane to air-dry at room temperature for 20 min.
- (d)
- Block unoccupied binding sites by incubating the membrane in 5% skimmed milk/0.1% Tween-20/TBS buffer (blocking buffer) for 1 h at 23 °C on an orbital shaker.
- (e)
- Prepare 10 mL of rabbit anti-cN1A primary antibody diluted 1:500 in blocking buffer. Flood the membrane and incubate for 1 h at 23 °C on a rolling platform.
- (f)
- Recover the primary antibody solution and store at −20 °C.Note: This solution may be reused up to three times without loss of efficacy.
- (g)
- Wash the membrane three times in 20 mL 0.1% Tween-20/TBS (TBST) for 10 min each wash at 23 °C on an orbital shaker.
- (h)
- Prepare 10 mL of goat anti-rabbit IgG-HRP secondary antibody diluted 1:10,000 in blocking buffer. Flood the membrane and incubate for 1 h at 23 °C on a rolling platform.
- (i)
- Recover the secondary antibody solution and store at −20 °C.Note: This solution may also be reused up to three times without loss of efficacy.
- (j)
- Repeat the washing steps. During the final wash, replace TBST with TBS.
- (k)
- Prepare 7 mL of enhanced chemiluminescence (ECL) solution according to the manufacturer’s instructions.
- (l)
- Incubate the membrane in ECL substrate for 10 min.
- (m)
- Visualise and quantify the chemiluminescent signal using a gel imaging system and software.
2.7. Large-Scale Protein Expression
- Prepare a starter culture as described in Steps 1–5 of Section 2.5.
- Inoculate 250 mL of LB medium in a 1 L baffled flask with the entire 3 mL starter culture.
- Incubate the culture for 2 h at 37 °C with shaking at 200 RPM.
- Induce protein expression by adding 125 µL of IPTG (final concentration 0.5 mM). Continue incubation at 37 °C, 200 RPM for 4 hs.
- Harvest the culture in five 50 mL conical tubes by centrifugation at 6000× g, 8 °C for 10 min.
- Wash each pellet twice with 40 mL of cold PBS.
- Resuspend the pellets in 5 mL of cold PBS, and pool all pellets into a single 50 mL conical tube.
- Centrifuge one more time at 6000× g at 8 °C for 10 min, and discard the supernatant.
- Either store the final washed pellet at −20 °C or proceed to lysis:
- (a)
- Resuspend the pellet in 5 mL cold lysis buffer.
- (b)
- Lyse cells by sonication (5 cycles of 10 s on / 10 s off at 40% amplitude).
- Centrifuge the lysate at 6000× g at 8 °C for 10 min. Collect the supernatant into a fresh 15 mL conical tube (soluble fraction).
- Inspect the pellet. If uneven in colour (light and dark patches), repeat the lysis step with an additional 1–2 mL of lysis buffer.
- Confirm successful enrichment of inclusion bodies by the presence of a homogeneously pale, sand-coloured pellet.
- Resuspend the final pellet in 2 mL of urea denaturing buffer.
- Alternate vortexing and incubating for 10–15 min until the pellet is fully solubilised.
- Proceed immediately to protein purification or store the lysate at −20 °C.
2.8. Protein Purification
- Prepare buffers:
- (a)
- Adjust wash buffer and elusion buffer pH with concentrated HCl.
- (b)
- Adjust elution buffer pH with concentrated NaOH.
- Prepare the Ni-NTA column:
- (a)
- Gently resuspend the resin in a Fast Start column by inversion several times.
- (b)
- Break the seal at the outlet of the column.
- (c)
- Open the screw cap and allow the storage buffer to drain out.Important: The outlet seal must be broken before the screw cap is removed.
- Bind the His-tagged protein:
- (a)
- Apply up to 10 mL of the clear cell lysate supernatant to the column.
- (b)
- Allow the lysate to flow through the column resin under gravity.
- (c)
- Collect the flow-through fraction into a 15 mL centrifuge tube.
- (d)
- Load the same column with up to 10 mL of the lysed inclusion bodies.
- (e)
- Collect the flow-through fraction into a new 15 mL centrifuge tube.
- (f)
- Add 5 µL of 2× sample loading buffer to 5 µL of the flow-through from each fraction and store at −20 °C for SDS-PAGE analysis.
- Wash the column:
- (a)
- Wash the column twice with 4 mL of denaturing wash buffer.
- (b)
- Collect each wash fraction into a separate 15 mL centrifuge tube.
- (c)
- Add 5 µL of 2× sample loading buffer to 5 µL of each wash and store at −20 °C for SDS-PAGE analysis.
- Elute the His-tagged protein:
- (a)
- Elute bound protein twice with 1 mL of denaturing elution buffer.
- (b)
- Collect each eluted fraction into a separate 15 mL centrifuge tube.
- (c)
- Add 5 µL of 2× sample loading buffer to 5 µL of each wash and store at −20 °C for SDS-PAGE analysis.
- Dialyse the eluted protein for biotinylation:
- (a)
- Hydrate a Slide-A-Lyzer dialysis cassette with a 3500 Da MWCO by submerging it into a deionised water for 2 min.
- (b)
- Using an 18-gauge needle, inject up to 10 mL of the eluted cN1A into the cassette.Note: Mark the corner used for injecting the sample with a permanent marker.
- (c)
- Secure the cassette in a float buoy ensuring that the injecting site is at the top.Warning: While the cassette has an internal gasket that seals after the needle is withdrawn, its failure may result in the loss of protein unless the cassette is secured the correct way up.
- (d)
- Float the cassette in 1 L of 50 mM bicine buffer (pH 8.3).
- (e)
- Dialyse overnight at 4 °C with gentle stirring.
- Analyse purification fractions:
- (a)
- Analyse the flow-through, wash, and elution fractions with SDS-PAGE and Western blot as described in Section 2.11.
2.9. Determination of Protein Concentration by Bicinchoninic Acid (BCA) Assay
- Prepare working reagent (WR) by mixing BCA Reagent A and BCA Reagent B at a 50:1 ratio (2 mL A + 40 µL B is sufficient for the set of standards and one unknown sample).
- Prepare a dilution series of bovine serum albumin (BSA) in the same buffer as the samples, following the volumes outlined in Table 6.
- Pipette 25 µL of each standard and undiluted cN1A-AviTag into a 96-well flat-bottom plate in duplicate.
- Add 200 µL of WR to each well using a multichannel pipette.
- Mix the samples thoroughly by pipetting three times.
- Seal the plate with a plastic cover and incubate at 37 °C for 30 min.Note: Incubation time can be increased to lower the minimum detection level of the reagent and the working range of the assay as long as the standards and the samples are treated identically.
- Allow the plate to cool to 23 °C (approximately 10 min).
- Measure the absorbance at 562 nm using a microplate reader.
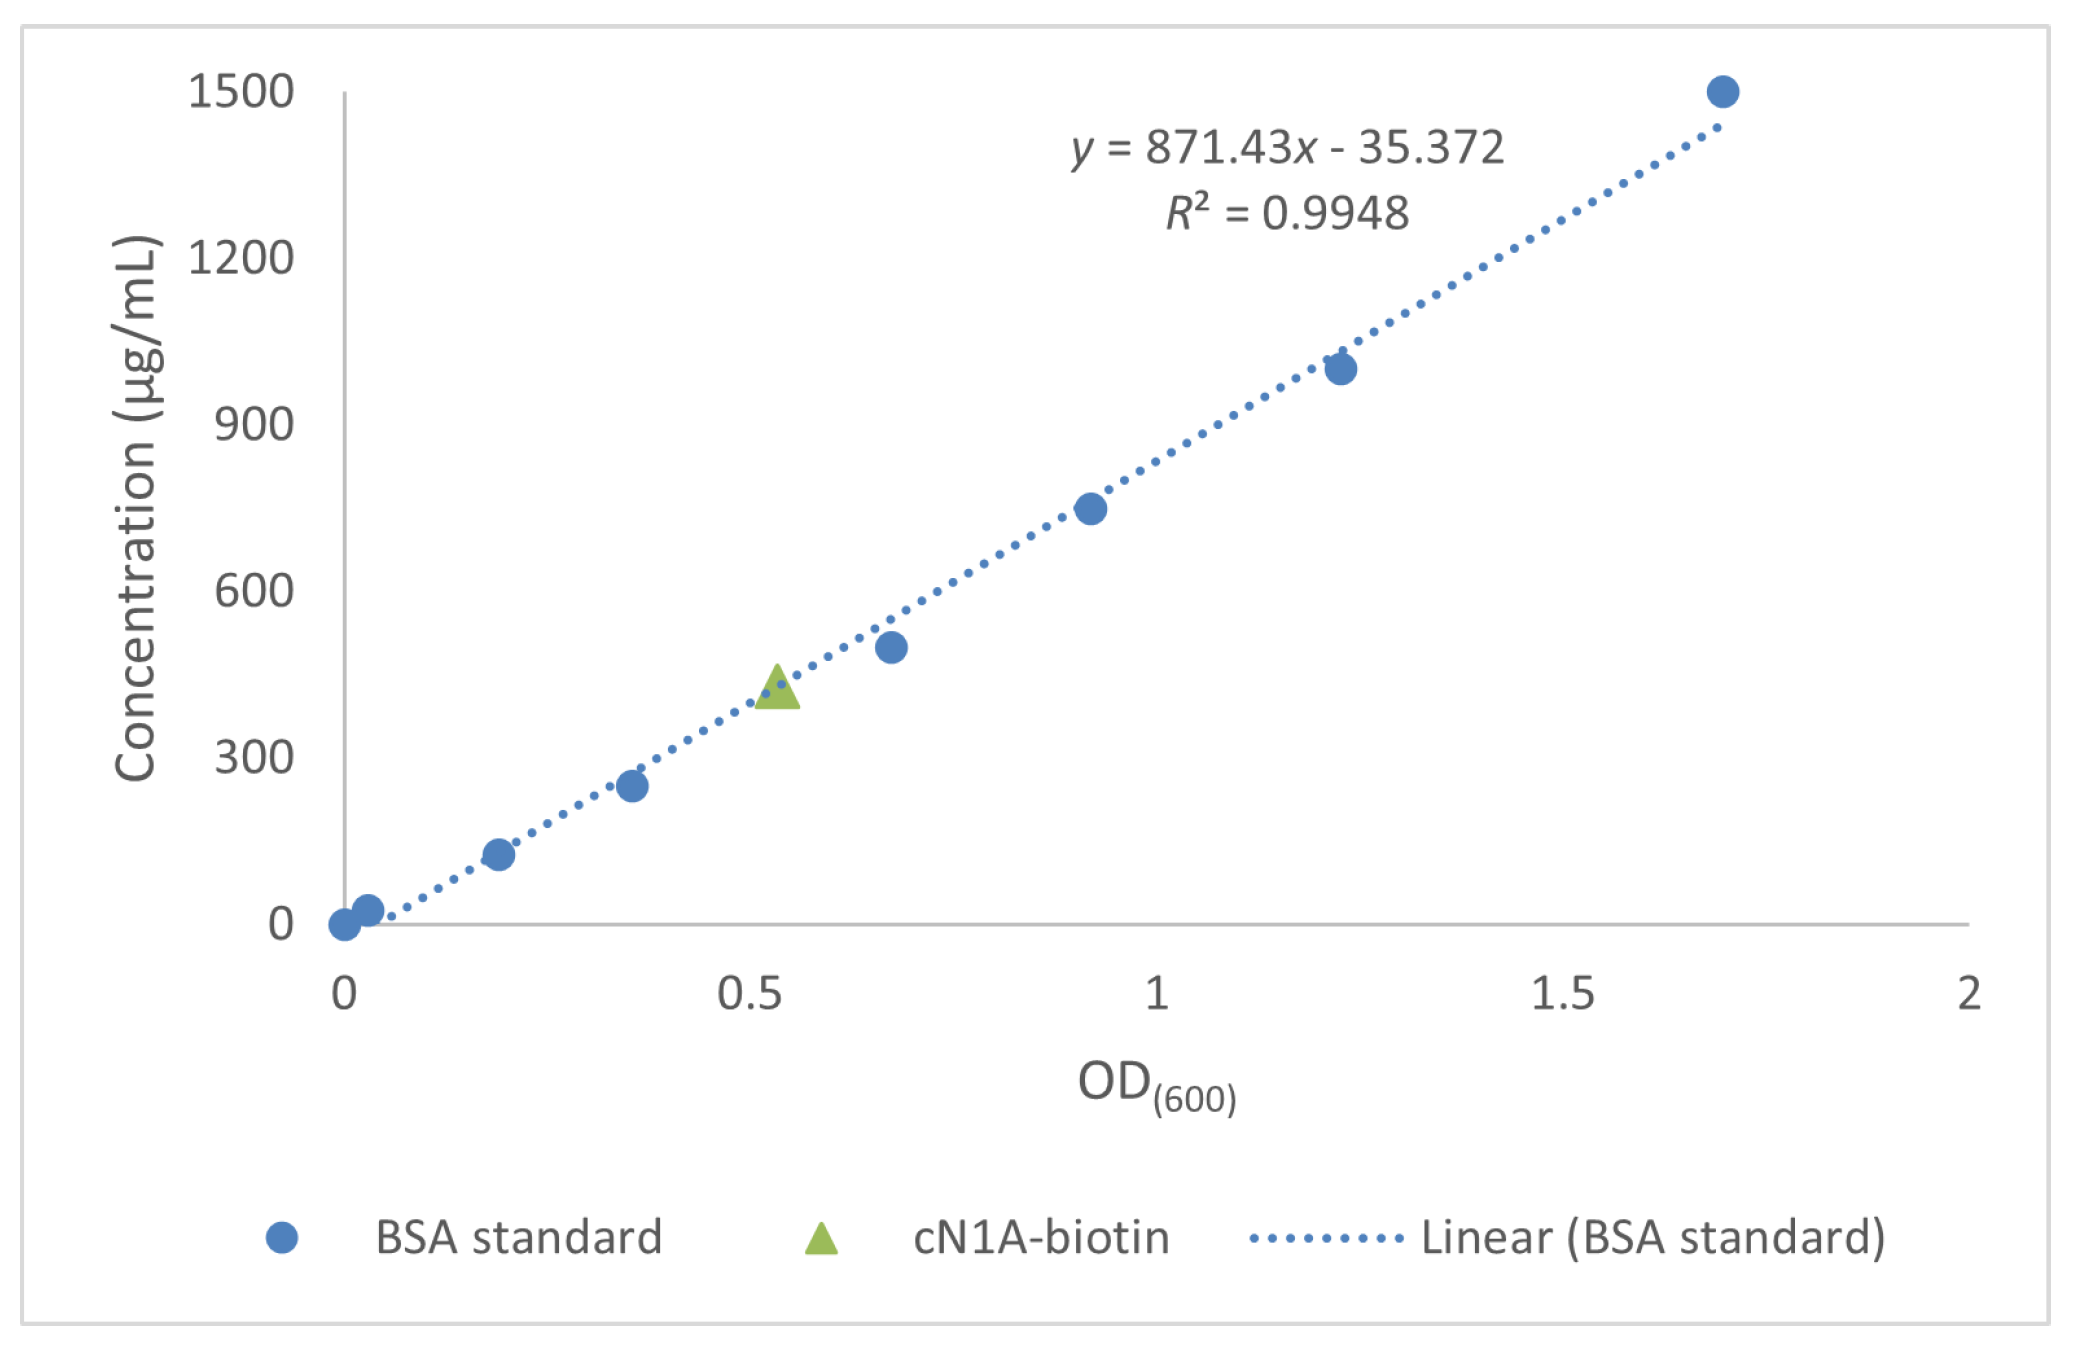
- Generate a standard curve from the BSA standards and calculate the concentration of the unknown sample using the best-fit line.
2.10. Recombinant cN1A Biotinylation
- Reconstitute the lyophilised BirA ligase in 20 µL of the BirA Resuspension buffer (both supplied).
- Add ATP to the 10× SuperMix buffer (both supplied).
- Prepare a 4 mL biotinylation reaction by mixing:
- 400 µL of 10× SuperMix.
- 8 µg of BirA ligase.
- 1.8 mg of cN1A-AviTag.
- Incubate the reaction mixture for 35 min at RT with gentle agitation.
- Dialyse the biotinylated protein to remove unreacted biotin and exchange the reaction buffer for storage buffer (50 mM Tris, 500 mM NaCl, pH 8.0). Follow the procedure described in Section 2.8 Step 5.
- Determine the concentration of biotinylated cN1A using the BCA assay, as described in Section 2.9.
2.11. Gel Electrophoresis and Western Blot
- SDS-PAGE:
- (a)
- Prepare the resolving 12% polyacrylamide gel solution:
Component Final Concentration / Volume 40% Acrylamide Solution (29:1 bis-acrylamide ratio) 12% 1.5 M Tris-HCl, pH 8.8 25% diH2O 4.4 mL SDS 1 0.1% APS 2 0.05% TEMED 3 0.05% 1 Prepare as a 20% stock solution and store at room temperature. 2 Prepare as a 10% stock solution, aliquot, and store at −20 °C. 3 Add immediately before pouring the gel. - (b)
- Assemble the casting module using 1 mm glass plates.
- (c)
- Pour the resolving gel solution to fill approximately three-quarters of the cassette height.
- (d)
- Carefully overlay the gel with 1 cm of deionised water using a transfer pipette to prevent air bubbles entering the gel and to level the gel surface.
- (e)
- Allow the gel to polymerise at ambient temperature for 20 min.
- (f)
- Meanwhile, prepare the stacking 4% polyacrylamide gel solution:
Component Final Concentration/Volume 40% Acrylamide Solution (29:1 bis-acrylamide ratio) 4% 0.5 M Tris-HCl, pH 6.8 25% Glycerol 25% Bromophenol blue 0.0048% SDS 1 0.1% APS 2 0.05% TEMED 3 0.05% 1 Prepare as a 20% stock solution and store at room temperature. 2 Prepare as a 10% stock solution, aliquot, and store at −20 °C. 3 Add immediately before pouring the gel. - (g)
- Pour off the water from the polymerised resolving gel.
- (h)
- Pour the stacking gel solution on top of the resolving gel.
- (i)
- Carefully insert a 10-well 1 mm comb without trapping air bubbles.
- (j)
- Allow the stacking gel to polymerise for 20 min at ambient temperature.
- (k)
- Thaw previously prepared samples and heat for 10 min at 95 °C to denature proteins.
- (l)
- Assemble the gel tank and fill it with SDS-PAGE running buffer.
- (m)
- Gently remove the comb from the gel and rinse the wells with SDS-PAGE running buffer using a transfer pipette.
- (n)
- Load each well with 10 µL of sample or 5 µL of Precision Plus protein standard (Bio-Rad).Note: Load empty wells with 1× sample loading buffer.
- (o)
- Perform electrophoresis at 17 V/cm (equivalent to 120 V in a Bio-Rad Mini-PROTEAN tank) for 90 min.Warning: Always turn off the power before opening the electrophoresis tank.
- Coomassie blue staining:Warning: Do not perform Coomassie blue staining if protein transfer is required for Western blotting.
- (a)
- Remove the gel from the glass cassette into a suitable staining container.
- (b)
- Submerge the gel in 0.1% Coomassie blue solution for 10 min on an orbital shaker.
- (c)
- Discard the staining solution and destain the gel in deionised water overnight on an orbital shaker.
- Western blotting:
- (a)
- Remove the gel from the glass cassette and assemble the transfer cassette by placing the SDS-PAGE gel and a nitrocellulose membrane between filter papers saturated with 1× transfer buffer.Note: Pre-assembled transfer sandwiches are pre-saturated with transfer buffer.
- (b)
- Perform semi-dry protein transfer at 1.3 A for 7 min.Note: If using the Power Blotter system (Invitrogen), select the pre-set Mixed-Range MW (25–150 kDa) programme.
- (c)
- Block the membrane with 5% skimmed milk/TBST blocking buffer for 1 h at 23 °C.
- (d)
- Incubate with primary antibody overnight at 4 °C on a rolling platform, using the dilutions listed in Table 7.
- (e)
- Wash the membrane three times for 10 min each in TBST on a rotary shaker.
- (f)
- Incubate with secondary antibody for 1 h at room temperature on a rolling platform, using the dilutions listed in Table 7.
- (g)
- Wash the membrane two times for 10 min each in TBST, followed by a final 10 min wash in TBS.
- (h)
- For chemiluminescent signal development, submerge the membrane in 7 mL ECL substrate for 10 min at ambient temperature.
- (i)
- Image the bands using a gel imaging system.
2.12. Example of Application: Identification of cN1A-Reactive B Cells by Flow Cytometry
- Isolate Peripheral Blood Mononuclear Cells (PBMCs) from 40 to 50 mL of venous blood using your laboratory’s preferred protocol.Note: Blood should be processed within two hours of collection to ensure high cell viability.
- Count the cells using the Trypan Blue exclusion method and manual or automated counting.
- Resuspend PBMC at a concentration of 5 × 10⁷ cells/mL in PBS containing 2% foetal calf serum (FCS) and 1 mM EDTA for B cell enrichment.Alternatively, PBMC may be cryopreserved for analysis at a later timepoint.
- Enrich B cells using the EasySep Human Pan-B Cell Enrichment Kit (STEMCELL Technologies) following the manufacturer’s instructions.
- Count the enriched B cells using the Trypan Blue exclusion method and manual or automated counting.
- Resuspend B cells in RPMI 1640 supplemented with 5% FCS at a concentration of 1 × 10⁶ cells/mL and transfer into a well of an appropriate culture plate based on the final suspension volume.
- Add recombinant biotinylated cN1A at 10 μg/mL and incubate the plate at 37 °C with 5% CO2 for one hour to allow cN1A to bind.
- Collect the cells and transfer into a 5 mL round-bottom tube.
- Centrifuge the suspension at 400× g for 5 min to pellet the cells and discard the supernatant.
- Wash the cells by resuspending the pellet in 2 mL PBS with 2% FCS (FACS buffer) and then centrifuge again at 400× g for 5 min to remove unbound cN1A.
- Prepare 100 μL of staining cocktail per 1 × 10⁶ cells by adding fluorochrome-conjugated reagents (Table 8) to FACS buffer.
- Add the staining cocktail to the cells, gently resuspend the pellet, and stain in the dark on wet ice for 20 min.
- Wash the cells with 2 mL FACS buffer.
- Resuspend the pellet in 300 μL FACS buffer and acquire on a flow cytometer.
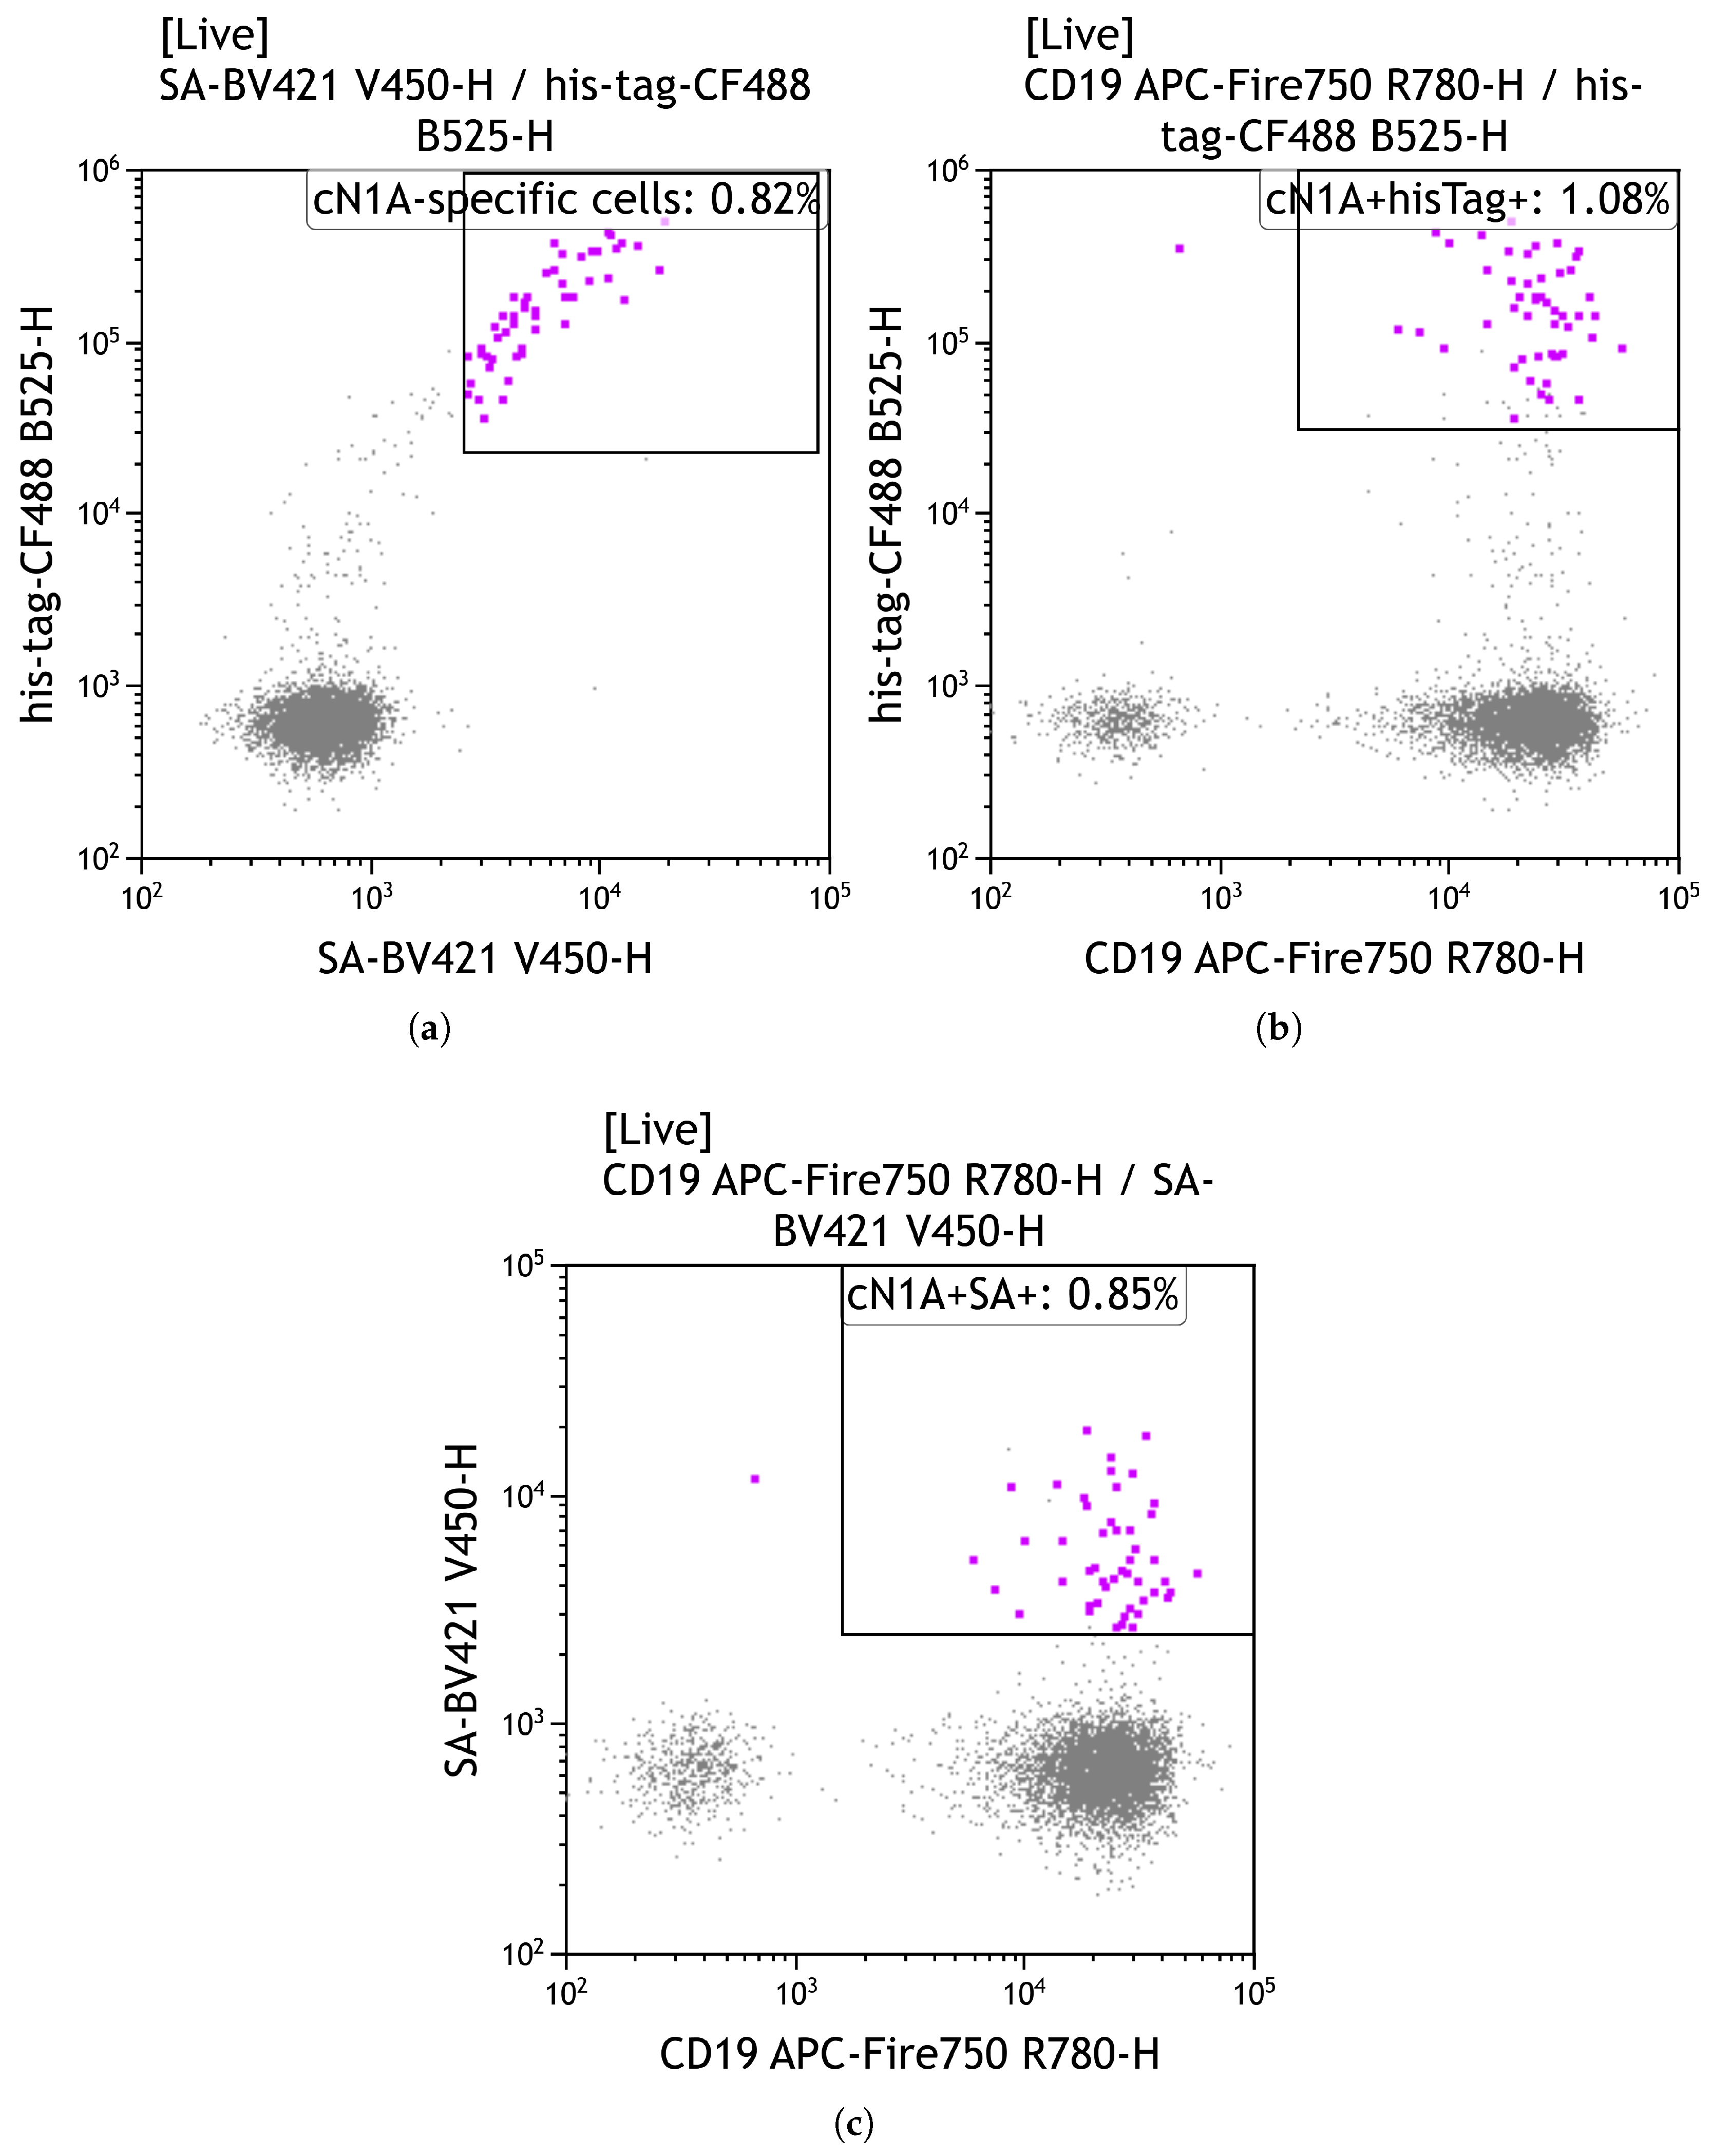
- Gate on live (EF506−) CD19+ BV421+ CF488+ cells to identify cN1A-reactive B cells.
3. Results
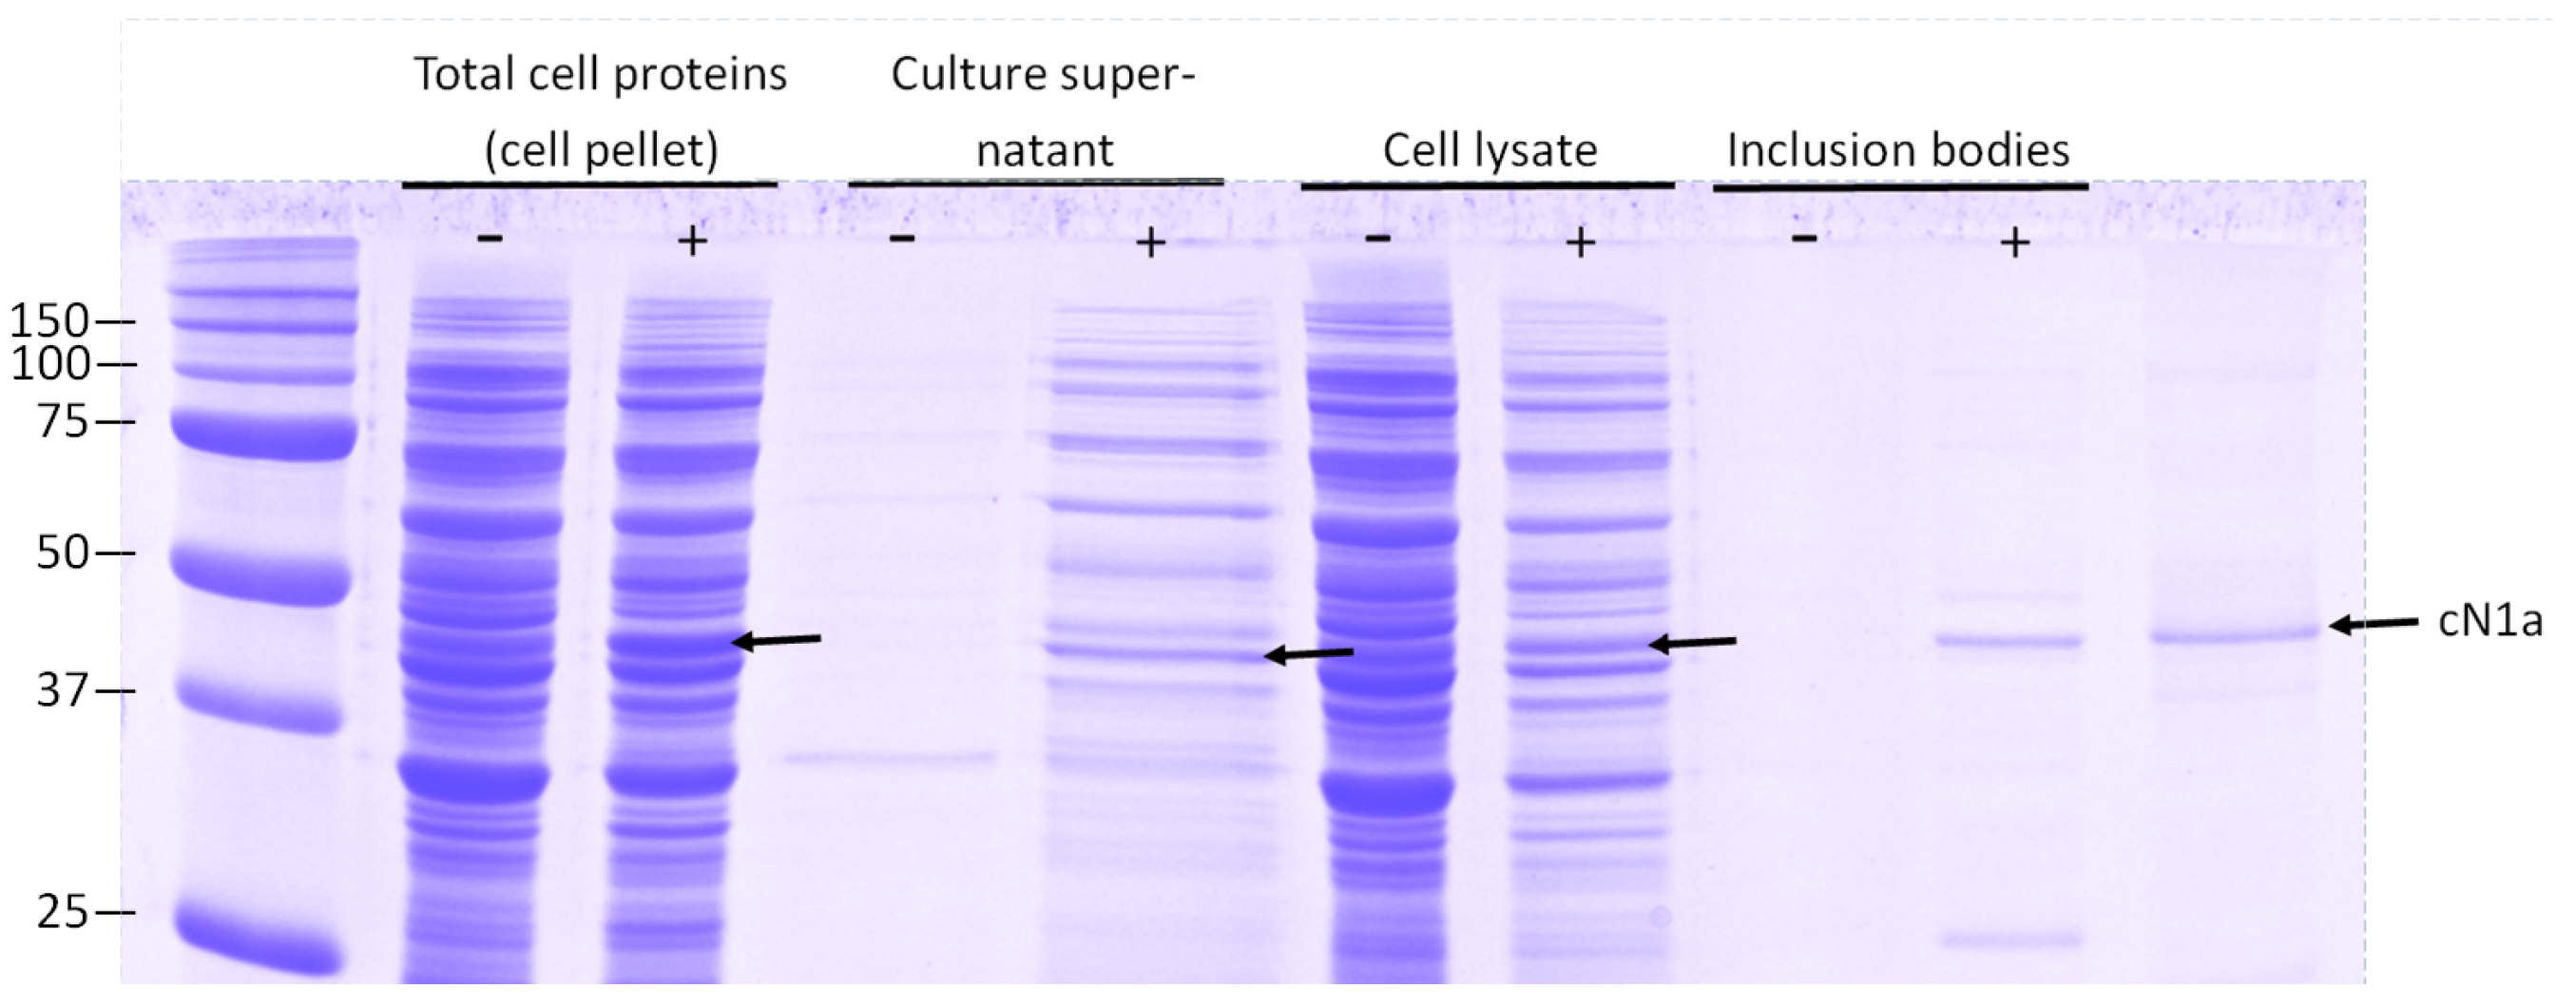
3.1. Analysis of Intracellular and Extracellular cN1A Expression
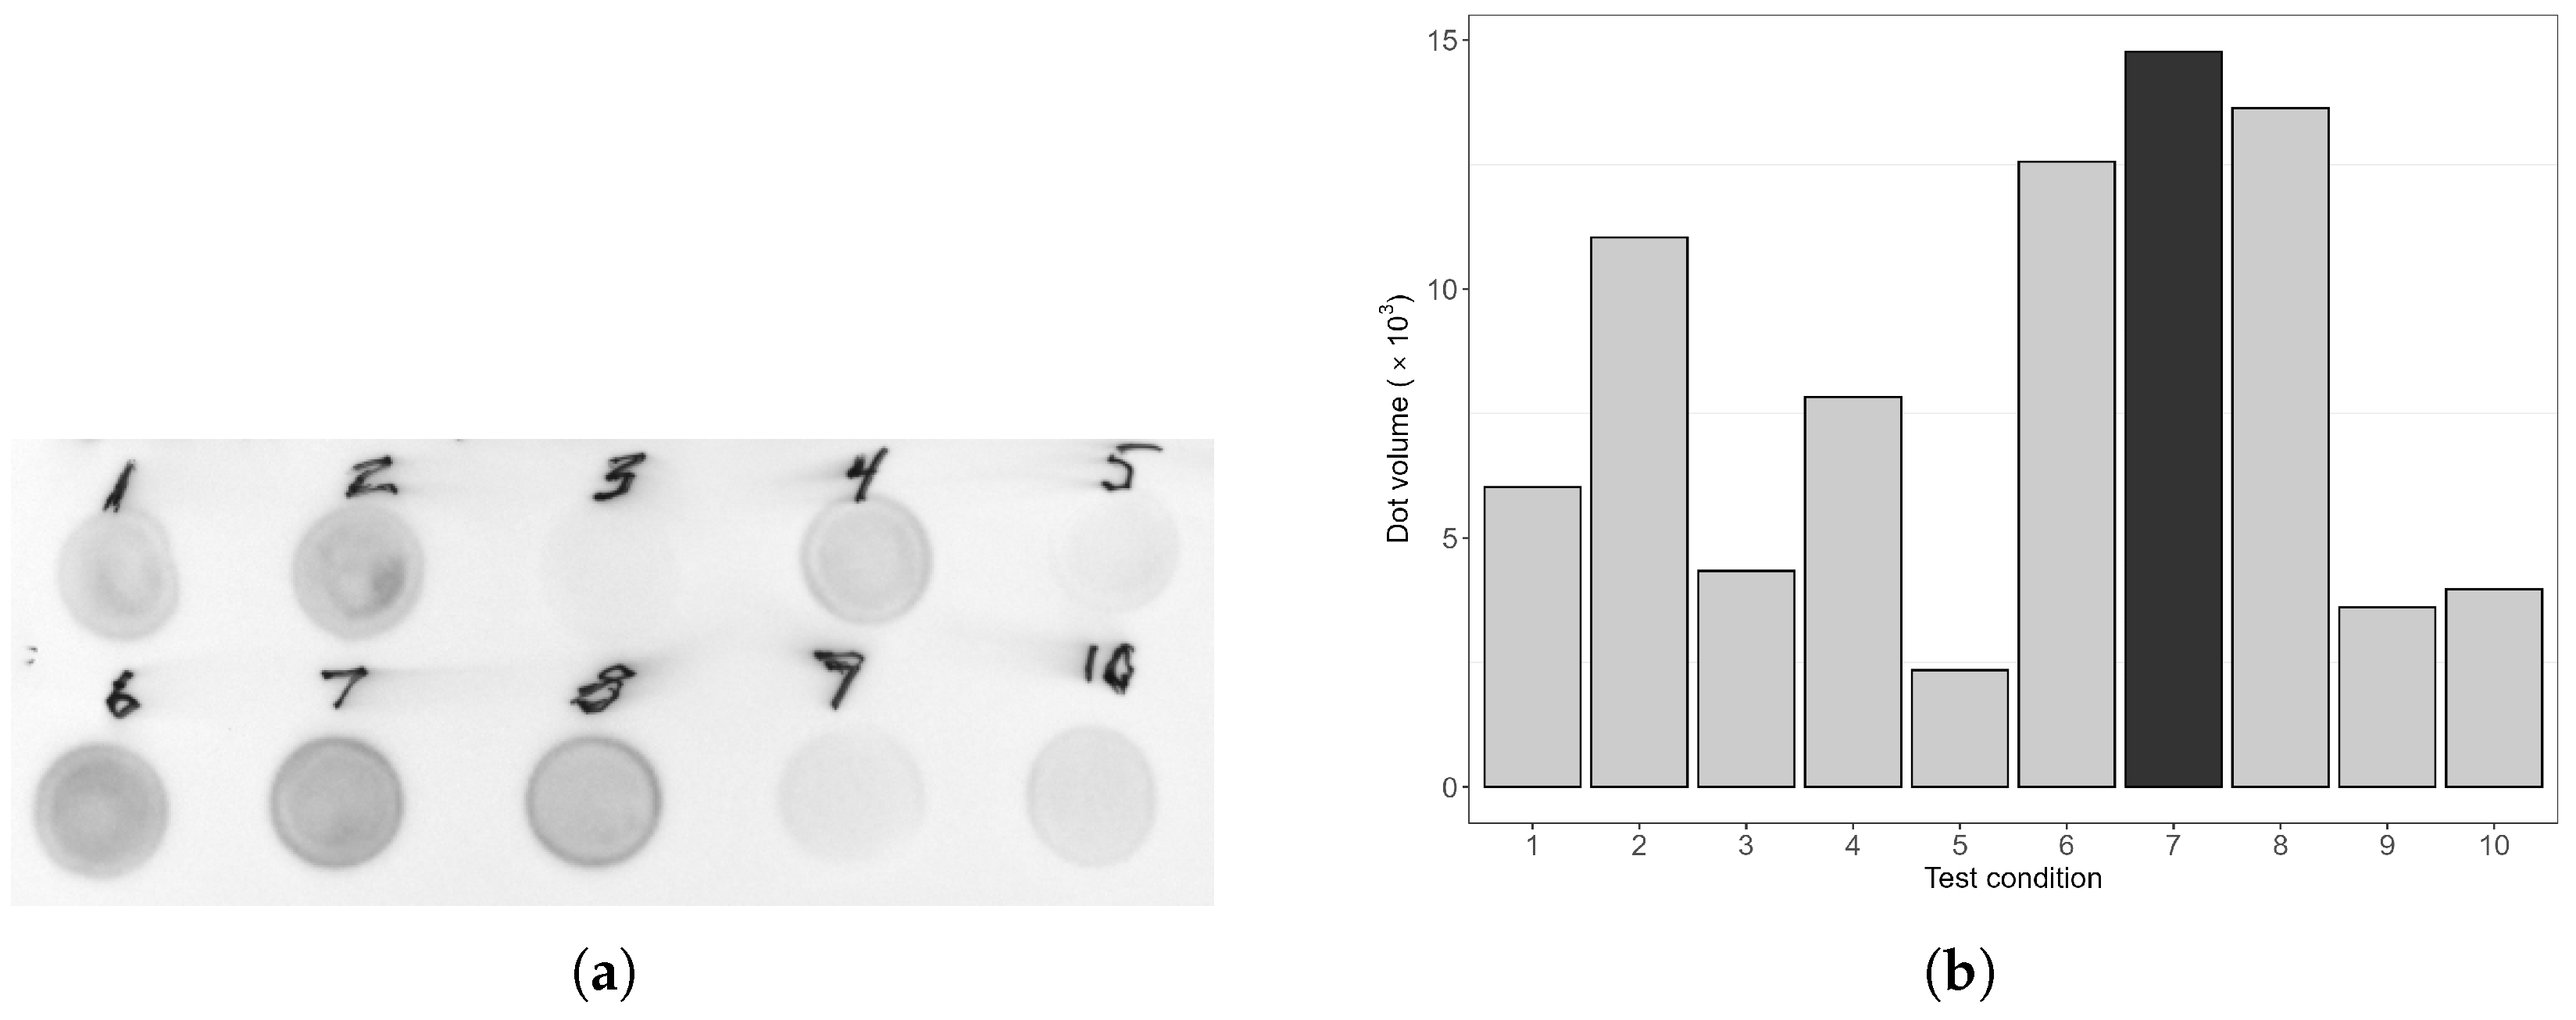
3.2. Induction Condition Optimisation
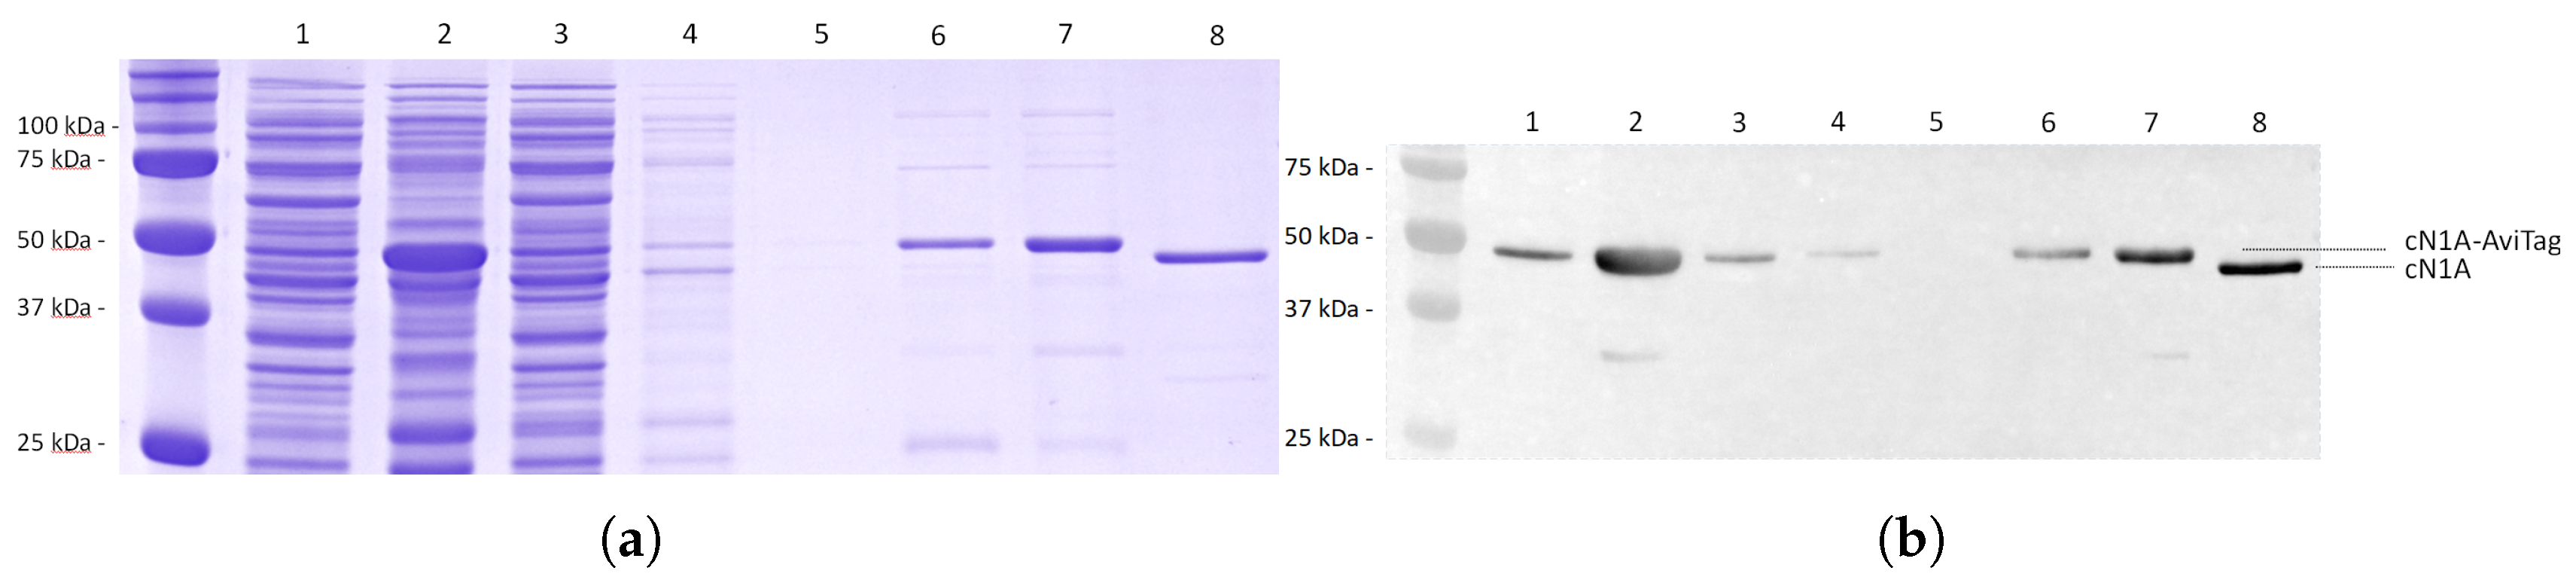
3.3. Monitoring of the Protein Purification
3.4. AviTag-cN1A Biotinylation
3.5. Antibody Recognition of the Recombinant Biotinylated cN1A
3.6. Verification of Biotinylated cN1A Binding to Circulating B Cells
4. Discussion
Supplementary Materials
Author Contributions
Funding
Institutional Review Board Statement
Informed Consent Statement
Data Availability Statement
Acknowledgments
Conflicts of Interest
Abbreviations
| cN1A | Cytosolic 5′-nucleotidase 1A |
| 5NT | 5′-nucleotidase |
| IBM | Inclusion Body Myositis |
| E. coli | Escherichia coli |
| IPTG | Isopropyl -D-1-thiogalactopyranoside |
| EDTA | Ethylenediaminetetraacetic acid |
| FCS | Foetal Calf Serum |
| SDS-PAGE | Sodium Dodecyl Sulphate–Polyacrylamide Gel Electrophoresis |
| BCA | Bicinchoninic Acid Assay |
References
- Pisetsky, D.S. Pathogenesis of autoimmune disease. Nat. Rev. Nephrol. 2023, 19, 509–524. [Google Scholar] [CrossRef] [PubMed]
- Sureshchandra, S.; Lewis, S.A.; Doratt, B.M.; Jankeel, A.; Ibraim, I.C.; Messaoudi, I. Single-cell profiling of T and B cell repertoires following SARS-CoV-2 mRNA vaccine. JCI Insight 2021, 6, e153201. [Google Scholar] [CrossRef] [PubMed]
- Altman, J.D.; Moss, P.A.H.; Goulder, P.J.R.; Barouch, D.H.; McHeyzer-Williams, M.G.; Bell, J.I.; McMichael, A.J.; Davis, M.M. Phenotypic Analysis of Antigen-Specific T Lymphocytes. Science 1996, 274, 94–96. [Google Scholar] [CrossRef] [PubMed]
- Tiller, T.; Meffre, E.; Yurasov, S.; Tsuiji, M.; Nussenzweig, M.C.; Wardemann, H. Efficient generation of monoclonal antibodies from single human B cells by single cell RT-PCR and expression vector cloning. J. Immunol. Methods 2008, 329, 112–124. [Google Scholar] [CrossRef] [PubMed]
- Lamb, C.L.; Price, E.; Field, K.P.; Dayton, C.; McIndoo, E.R.; Katahira, E.J.; Stevens, D.L.; Hobdey, S.E. Enrichment of antigen-specific class-switched B cells from individuals naturally immunized by infection with Group A Streptococcus. mSphere 2019, 4, e00598-19. [Google Scholar] [CrossRef] [PubMed]
- Chen, I.; Howarth, M.; Lin, W.; Ting, A.Y. Site-specific labeling of cell surface proteins with biophysical probes using biotin ligase. Nat. Methods 2005, 2, 99–104. [Google Scholar] [CrossRef] [PubMed]
- Pluk, H.; van Hoeve, B.J.; van Dooren, S.H.; Stammen-Vogelzangs, J.; van der Heijden, A.; Schelhaas, H.J.; Verbeek, M.M.; Badrising, U.A.; Arnardottir, S.; Gheorghe, K.; et al. Autoantibodies to cytosolic 5′-nucleotidase 1A in inclusion body myositis. Ann. Neurol. 2013, 73, 397–407. [Google Scholar] [CrossRef] [PubMed]
- Larman, H.B.; Salajegheh, M.; Nazareno, R.; Lam, T.; Sauld, J.; Steen, H.; Kong, S.W.; Pinkus, J.L.; Amato, A.A.; Elledge, S.J.; et al. Cytosolic 5′-nucleotidase 1A autoimmunity in sporadic inclusion body myositis. Ann. Neurol. 2013, 73, 408–418. [Google Scholar] [CrossRef] [PubMed]
- Lloyd, T.E.; Christopher-Stine, L.; Pinal-Fernandez, I.; Tiniakou, E.; Petri, M.; Baer, A.; Danoff, S.K.; Pak, K.; Casciola-Rosen, L.A.; Mammen, A.L. Cytosolic 5′-nucleotidase 1A As a Target of Circulating Autoantibodies in Autoimmune Diseases. Arthritis Care Res. 2016, 68, 66–71. [Google Scholar] [CrossRef] [PubMed]
- Rietveld, A.; van den Hoogen, L.L.; Bizzaro, N.; Blokland, S.L.M.; Daehnrich, C.; Gottenberg, J.E.; Houen, G.; Johannsen, N.; Mandl, T.; Meyer, A.; et al. Autoantibodies to Cytosolic 5′-Nucleotidase 1A in Primary Sjogren’s Syndrome and Systemic Lupus Erythematosus. Front. Immunol. 2018, 9, 1200. [Google Scholar] [CrossRef] [PubMed]
- Lilleker, J.B.; Rietveld, A.; Pye, S.R.; Mariampillai, K.; Benveniste, O.; Peeters, M.T.; Miller, J.A.; Hanna, M.G.; Machado, P.M.; Parton, M.J.; et al. Cytosolic 5′-nucleotidase 1A autoantibody profile and clinical characteristics in inclusion body myositis. Ann. Rheum Dis. 2017, 76, 862–868. [Google Scholar] [CrossRef] [PubMed]
- Goyal, N.A.; Cash, T.M.; Alam, U.; Enam, S.; Tierney, P.; Araujo, N.; Mozaffar, F.H.; Pestronk, A.; Mozaffar, T. Seropositivity for NT5c1A antibody in sporadic inclusion body myositis predicts more severe motor, bulbar and respiratory involvement. J. Neurol. Neurosurg. Psychiatry 2016, 87, 373–378. [Google Scholar] [CrossRef] [PubMed]
- Lucchini, M.; Maggi, L.; Pegoraro, E.; Filosto, M.; Rodolico, C.; Antonini, G.; Garibaldi, M.; Valentino, M.; Siciliano, G.; Tasca, G.; et al. Anti-cN1A Antibodies Are Associated with More Severe Dysphagia in Sporadic Inclusion Body Myositis. Cells 2021, 10, 1146. [Google Scholar] [CrossRef] [PubMed]
- Tawara, N.; Yamashita, S.; Zhang, X.; Korogi, M.; Zhang, Z.; Doki, T.; Matsuo, Y.; Nakane, S.; Maeda, Y.; Sugie, K.; et al. Pathomechanisms of anti–cytosolic 5′-nucleotidase 1A autoantibodies in sporadic inclusion body myositis. Ann. Neurol. 2017, 81, 512–525. [Google Scholar] [CrossRef] [PubMed]
- Yamashita, S.; Tawara, N.; Zhang, Z.; Nakane, S.; Sugie, K.; Suzuki, N.; Nishino, I.; Aoki, M. Pathogenic role of anti-cN1A autoantibodies in sporadic inclusion body myositis. J. Neurol. Neurosurg. Psychiatry 2023, 94, 1018–1024. [Google Scholar] [CrossRef] [PubMed]
- Kramp, S.L.; Karayev, D.; Shen, G.; Metzger, A.L.; Morris, R.I.; Karayev, E.; Lam, Y.; Kazdan, R.M.; Pruijn, G.J.; Saschenbrecker, S.; et al. Development and evaluation of a standardized ELISA for the determination of autoantibodies against cN-1A (Mup44, NT5C1A) in sporadic inclusion body myositis. Auto Immun. Highlights 2016, 7, 16. [Google Scholar] [CrossRef] [PubMed]
- Beckett, D.; Kovaleva, E.; Schatz, P.J. A minimal peptide substrate in biotin holoenzyme synthetase-catalyzed biotinylation. Protein Sci. 1999, 8, 921–929. [Google Scholar] [CrossRef] [PubMed]
- Hasegawa, H.; Suzuki, E.; Maeda, S. Horizontal plasmid transfer by transformation in Escherichia coli: Environmental factors and possible mechanisms. Front. Microbiol. 2018, 9, 2365. [Google Scholar] [CrossRef] [PubMed]
- Walldeén, K.; Stenmark, P.; Nyman, T.; Flodin, S.; Gräslund, S.; Loppnau, P.; Bianchi, V.; Nordlund, P. Crystal structure of human cytosolic 5′-nucleotidase II: Insights into allosteric regulation and substrate recognition. J. Biol. Chem. 2007, 282, 17828–17836. [Google Scholar] [CrossRef] [PubMed]


| Reagent | Manufacturer | Catalog No. |
|---|---|---|
| GenePulser Xcell module | Bio-Rad Laboratories, Hercules, CA, USA | AU390060 |
| MicroPulser Electroporation Cuvettes, 0.1 cm gap | Bio-Rad Laboratories, Hercules, CA, USA | 1652083 |
| Ni-NTA Fast Start Kit | Qiagen, Hilden, Germany | 30600 |
| BCA Protein Assay Kit | Pierce Biotechnology, Rockford, IL, USA | 23227 |
| PowerBlotter Semi-dry Transfer System | Invitrogen, Carlsbad, CA, USA | PB0012 |
| Nitrocellulose/Filter Paper Sandwiches | Bio-Rad Laboratories, Hercules, CA, USA | 1620213 |
| Centrifugal filter units Amicon Ultra-15 | Merck KGaA, Darmstadt, Germany | UFC901024 |
| Lyophilised biotin–protein ligase reaction kit | Avidity, Aurora, CO, USA | BirA500-RT |
| EasySep Human Pan-B cell enrichment kit | StemCell Technologies, Vancouver, BC, Canada | 19554 |
| Reagent | Manufacturer | Catalog No. |
|---|---|---|
| Yeast extract | Oxoid, Basingstoke, Hampshire, UK | LP0021 |
| Tryptone | Oxoid, Basingstoke, Hampshire, UK | LP0021 |
| Lennox LB broth powder | Invitrogen, Carlsbad, CA, USA | 12780052 |
| Lennox LB agar | Invitrogen, Carlsbad, CA, USA | 22700025 |
| Phosphate Buffered Saline tablets | Thermo Fisher Scientific, Paisley, UK | 18912-014 |
| Skimmed milk powder | Merck KGaA, Darmstadt, Germany | 115363 |
| Tris Buffered Saline tablets | Sigma-Aldrich, St. Louis, MO, USA | 4155256 |
| SureCast Acrylamide 40% | Invitrogen, Carlsbad, CA, USA | HC2040 |
| Tris Base | Sigma-Aldrich, St. Louis, MO, USA | T6066 |
| Glycine | CSA Scientific, Melbourne, VIC, Australia | GA007-500G |
| Glycerol | Univar Solutions, Downers Grove, IL, USA | 1009311 |
| 0.04% Bromophenol Blue | Sigma-Aldrich, St. Louis, MO, USA | 318744 |
| Sodium Dodecyl Sulphate (SDS) | Sigma-Aldrich, St. Louis, MO, USA | L3771 |
| Ammonium Persulphate (APS) | Pierce Biotechnology, Rockford, IL, USA | 17874 |
| TEMED | Pierce Biotechnology, Rockford, IL, USA | 17919 |
| Precision Plus Protein Standards | Bio-Rad Laboratories, Hercules, CA, USA | 1610374 |
| Coomassie Brilliant Blue R-250 | Bio-Rad Laboratories, Hercules, CA, USA | 161-0400 |
| Tween-20 | Sigma-Aldrich, St. Louis, MO, USA | P2287 |
| Triton X-100 | Sigma-Aldrich, St. Louis, MO, USA | X100 |
| Clarity Western ECL substrate | Bio-Rad Laboratories, Hercules, CA, USA | 1705060 |
| Bicine | Sigma-Aldrich, St. Louis, MO, USA | B3876 |
| Foetal Calf Serum | Serana, Melbourne, VIC, Australia | S-FBSPG-AU-015 |
| RPMI 1640 | Thermo Fisher Scientific, Paisley, UK | 11835055 |
| 0.5 M EDTA | Life Technologies, Grand Island, NY, USA | 15575-020 |
| Component | Final Concentration |
|---|---|
| SOB medium 1 | |
| Tryptone | 0.02% w/v |
| Yeast Extract | 0.005% w/v |
| Sodium Chloride | 8.6 mM |
| Potassium Chloride | 2.5 mM |
| Magnesium Chloride | 10 mM |
| Magnesium Sulphate | 10 mM |
| SOC medium 1 | |
| Tryptone | 0.02% w/v |
| Yeast Extract | 0.005% w/v |
| Sodium Chloride | 8.6 mM |
| Potassium Chloride | 2.5 mM |
| Magnesium Chloride | 10 mM |
| Magnesium Sulphate | 10 mM |
| Glucose | 20 mM |
| Cell lysis buffer, pH 8.0 | |
| Tris base | 50 mM |
| NaCl | 150 mM |
| Triton X-100 | 0.5% v/v |
| Urea denaturing buffer, pH 8.0 | |
| Tris base | 50 mM |
| Urea | 8 M |
| SDS-PAGE running buffer | |
| Tris base | 25 mM |
| Glycine | 192 mM |
| SDS 2 | 0.1% w/v |
| 2× sample loading buffer | |
| Tris-HCl, pH6.8 | 65.8 mM |
| SDS 2 | 2% w/v |
| Glycerol | 26.3% v/v |
| Bromophenol blue | 0.01% w/v |
| Feature | Genotype | Critical Features |
|---|---|---|
| BL21 | B F− ompT gal dcm lon hsdSB (r− m−) | Deficient in Lon and OmpT proteases |
| (DE3) | lacI lacUV5-T7p07 ind1 sam7 nin5 | T7 RNA polymerase under the control of the lac UV5 promoter |
| pLysS | T7p20 orip15A(CmR) | Chloramphenicol resistance; T7 phage lysozyme—reduced expression when not induced |
| Test Number | OD600 | Induction Duration (h) | Induction Temperature (°C) | IPTG 1 Concentration (mM) |
|---|---|---|---|---|
| 1 | 0.6 | 16 | 23 | 0.5 |
| 2 | 1.0 | 16 | 23 | 0.5 |
| 3 | Uninduced control | 16 | 23 | 0 |
| 4 | 0.6 | 16 | 23 | 1.0 |
| 5 | 1.0 | 4 | 37 | 0.5 |
| 6 | 1.0 | 16 | 23 | 1.0 |
| 7 | 0.6 | 4 | 37 | 0.5 |
| 8 | 0.6 | 4 | 37 | 1.0 |
| 9 | Uninduced control | 4 | 37 | 0 |
| 10 | 1.0 | 4 | 37 | 1.0 |
| Vial | Volume of Diluent (µL) | Volume and Source of BSA (µL) | Final BSA Concentration (µg/mL) |
|---|---|---|---|
| A | 0 | 60 of stock | 2000 |
| B | 25 | 75 of stock | 1500 |
| C | 65 | 65 of stock | 1000 |
| D | 35 | 35 of vial B dilution | 750 |
| E | 65 | 65 of vial C dilution | 500 |
| F | 65 | 65 of vial E dilution | 250 |
| G | 65 | 65 of vial F dilution | 125 |
| H | 80 | 20 of vial G dilution | 25 |
| I | 80 | 0 | 0 (Blank) |
| Primary Ab | Dilution | Manufacturer | Secondary Ab | Dilution | Manufacturer |
|---|---|---|---|---|---|
| Human -human cN1A | 1:1000 | In-house | Goat -human IgG/IgM/IgA—HRP | 1:10,000 | Invitrogen |
| Rabbit -human cN1A | 1:500 | Sigma-Aldrich | Goat -rabbit IgG—HRP | 1:10,000 | Invitrogen |
| - | - | - | Streptavidin-HRP | 1:10,000 | BioLegend |
| Antibody Conjugate | Manufacturer | Catalogue # | Volume (μL) per 1 × Cells |
|---|---|---|---|
| CD19-APC-Fire750 | BioLegend, San Diego, CA, USA | 302257 | 5 |
| Streptavidin-BV421 | BioLegend, San Diego, CA, USA | 405226 | 2.5 |
| Polyhis-tag-CF488 | Merck KGaA, Darmstadt, Germany | SAB4600048 | 5 |
| eFluor 506 viability dye | Invitrogen, Carlsbad, CA, USA | 65-0866-14 | 2.5 |
Disclaimer/Publisher’s Note: The statements, opinions and data contained in all publications are solely those of the individual author(s) and contributor(s) and not of MDPI and/or the editor(s). MDPI and/or the editor(s) disclaim responsibility for any injury to people or property resulting from any ideas, methods, instructions or products referred to in the content. |
© 2025 by the authors. Licensee MDPI, Basel, Switzerland. This article is an open access article distributed under the terms and conditions of the Creative Commons Attribution (CC BY) license (https://creativecommons.org/licenses/by/4.0/).
Share and Cite
Slater, N.; Sooda, A.; Mastaglia, F.L.; Fletcher, S.; Watson, M.; Needham, M.; Coudert, J.D. Expression and Site-Specific Biotinylation of Human Cytosolic 5′-Nucleotidase 1A in Escherichia coli. Methods Protoc. 2025, 8, 66. https://doi.org/10.3390/mps8030066
Slater N, Sooda A, Mastaglia FL, Fletcher S, Watson M, Needham M, Coudert JD. Expression and Site-Specific Biotinylation of Human Cytosolic 5′-Nucleotidase 1A in Escherichia coli. Methods and Protocols. 2025; 8(3):66. https://doi.org/10.3390/mps8030066
Chicago/Turabian StyleSlater, Nataliya, Anuradha Sooda, Frank L. Mastaglia, Sue Fletcher, Mark Watson, Merrilee Needham, and Jerome D. Coudert. 2025. "Expression and Site-Specific Biotinylation of Human Cytosolic 5′-Nucleotidase 1A in Escherichia coli" Methods and Protocols 8, no. 3: 66. https://doi.org/10.3390/mps8030066
APA StyleSlater, N., Sooda, A., Mastaglia, F. L., Fletcher, S., Watson, M., Needham, M., & Coudert, J. D. (2025). Expression and Site-Specific Biotinylation of Human Cytosolic 5′-Nucleotidase 1A in Escherichia coli. Methods and Protocols, 8(3), 66. https://doi.org/10.3390/mps8030066