Determination of the Minimum Cell-to-Cell Adhesion Time Using Optical Tweezers in Leukemia and Lymphoma Research
Abstract
1. Introduction
2. Experimental Design
2.1. Reagents
- RPMI 1640 Medium (Gibco, Waltham, MA, USA, Cat. No.: 11875093).
- 1% Penicillin/Streptomycin (Gibco, Waltham, MA, USA, Cat. No.: 15140122).
- Fetal Bovine Serum (FBS) (Gibco, Waltham, MA, USA, Cat. No.: A5256701).
- HEPES buffer (Sigma-Aldrich, Darmstadt, Germany, Cat. No.: H4034-25G).
- Phosphate-buffered saline (PBS), pH 7.4 suitable for cell culture (Gibco, Waltham, MA, USA, Cat. No.: 10010023).
- Trypsin-EDTA, 0.05% (Gibco, Waltham, MA, USA, Cat. No.: 25300096)
- Trypan blue (TB) solution, 0.4% (Gibco, Waltham, MA, USA, Cat. No.: 15250061).
- Sonidegib (NVP-LDE225) (Selleck Chemicals, Houston, TX, USA, Cat. No.: S2151).
- Doxorubicin (Sigma-Aldrich, Darmstadt, Germany, Cat No.: D1515).
- AMD3100 (plerixafor), (Sigma-Aldrich, Darmstadt, Germany, Cat No.: 239820).
- Dimethyl sulfoxide (DMSO) for molecular biology (Sigma-Aldrich, Darmstadt, Germany, Cat. No.: D8418).
- Sterile water.
2.2. Materials
- Pipette 100–1000 µL (Eppendorf, Hamburg, Germany, Cat. No.: 3123000063).
- Pipette 20–200 µL (Eppendorf, Hamburg, Germany, Cat. No.: 3123000055).
- Pipette 2–20 µL (Eppendorf, Hamburg, Germany, Cat. No.: 3123000098).
- Pipette filter tips: 10 uL, 100 µL, 1000 µL (VWR, Radnor, PA, USA, Cat. No.: 613-5091; 613-0860, and 613-0899).
- Sterile serological pipettes: 10 mL (Grenier Bio-One, Frickenhausen, Germany, Cat. No.: 607180).
- Eppendorf safe-lock tubes: 1.5 mL (Eppendorf, Hamburg, Germany, Cat. No.: 0030120086).
- T25 flasks for cell suspension (Sarstedt, Nümbrecht, Germany, Cat. No.: 83.3910.502).
- T75 cell culture treated flasks (Sarstedt, Nümbrecht, Germany, Cat. No.: 83.3911).
- Centrifuge tubes: 15 mL (Eppendorf, Hamburg, Germany, Cat. No.: EP0030122194).
- Sterile high glass-bottom 35 mm dish (IBIDI, Martinsried, Germany, Cat. No.: 81158).
- Petri Dish, PS, 150 mm × 20 mm, 148 cm2, sterile (SPL Life Science, Suwon, Republic of Korea, Cat. No.: S10150).
- EVE Cell Counting Slides (NanoEntek, Seoul, Korea, Cat. No.: NE-EVS-50).
2.3. Cell Lines
- Ri-1 (B-cell non-Hodgkin lymphoma, German Collection of Microorganisms and Cell Cultures (DSMZ), Braunschweig, Germany, Cat. No.: ACC 585).
- RAJI (Burkitt lymphoma, American Type Culture Collection (ATCC), Manassas, VA, USA, Cat. No.: CCL-86).
- Toledo (B-cell non-Hodgkin lymphoma, ATCC, Manassas, VA, USA, Cat. No.: CRL-2631).
- OCI-AML3 (acute myeloid leukemia, DSMS, Braunschweig, Germany, Cat. No.: ACC 582).
- H-5 (mesenchymal stromal cells, ATCC, Manassas, VA, USA, Cat. No.: CRL-3611).
2.4. Equipment
- Centrifuge for cell culture (EBA 20, Hettich Zentrigugen, Tuttlingen, Germany; Cat. No.: 2002).
- Inverted microscope for cell culture (Olympus, Tokyo, Japan, Cat. No.: IX73).
- Standard 37 °C, 5% CO2 humidified cell culture incubator (Esco Technologies, Inc., Saint Louis, MO, USA, Cat. No.: CCL).
- Multigas incubator (Galaxy 48 R/48 S CO2, Eppendorf, Hamburg, Germany; Cat. No.: CO48332001).
- Biological safety cabinet (Scanlaf, Höör, Sweeden, Cat. No.: 9.002.022.000).
- Automated Cell Counter (NanoEntek, Seoul, Republic of Korea; Cat. No.: EVE-MC)
- Vortex (NeoLab, Heidelberg, Germany, Cat. No.: D-6012).
2.5. Optical Tweezers Setup
- Inverted microscope with an UplanFLN 100×/1.3 microscope objective. (Olympus, Hamburg, Germany, Cat. No.: IX71).
- Nd:YAG 1064 nm laser (Laser Quantum, Stockport, UK, Cat. No.: Ventus 1064).
- Galvano-mirror XY scanning system (Thorlabs, Newton, NJ, USA, Cat. No.: GVS002).
- Lense 1 (Thorlabs, Newton, NJ, USA, Cat. No.: AC254-050-B-ML).
- Lense 2 (Thorlabs, Newton, NJ, USA, Cat. No.: AC508-200-B-ML).
- Dichroic mirrors (Thorlabs, Newton, NJ, USA Cat. No.: DMSP805R).
- Digital camera (Mikrotron GmbH, Unterschleißheim, Germany, Cat. No.: MC1362).
3. Procedure
3.1. Mesenchymal Stromal Cell Line Maintenance and Preparation for Experiments
- CRITICAL STEP 1: Start by preparing the glass-bottom dishes with mesenchymal stromal cells from the H-5 cell line for 72 h prior to manipulations using optical tweezers. For a single experiment, approximately 5 dishes will be required. H-5 cells were purchased from American Type Culture Collection (ATCC) and stored in liquid nitrogen until use. We recommend using early-passage cells (up to passage 10), along with associated histological and genetic analyses.
- CRITICAL STEP 2: Prepare RPMI medium supplemented with 10% FBS, 1% Penicillin/Streptomycin, and 10 mM HEPES buffer. The required volumes should be incubated in a water bath at 37 °C prior to use in cell culture.
- Culture the mesenchymal stromal cells of the H-5 line aseptically in T75 flasks under standard conditions (37 °C, 5% CO2) in complete RPMI 1640 medium.
- When the cells reach 80–90% confluence, proceed to enzymatic dissociation.
- Aspirate the cell medium and wash the cell monolayer twice with pre-warmed phosphate-buffered saline (PBS).
- Add 2 mL of 0.05% trypsin-1 mM EDTA to cover the cells and incubate the flask at 37 °C for 5 min to facilitate cell detachment.
- Add 2 mL of pre-warmed complete RPMI-1640 medium to stop the action of trypsin.
- Gently suspend the H-5 cells with a 10 mL serological pipette, collect the cells, and transfer them into a sterile 15 mL tube.
- Centrifuge the cells at 300× g for 7 min, discard the supernatant, and resuspend the cell pellet in 1 mL of pre-warmed culture medium.
- Count the number and viability of stromal cells, for example, using an automated cell counter and Trypan blue (TB) dye.
- Dilute the H-5 cells to the desired concentration of 2 × 10⁵ cells/mL.
- Seed 100 µL of the cell solution as a single drop in the central part of the glass-bottom dish.
- Place the glass-bottom dishes in a large Petri dish. To prevent the cells from drying out, add an extra dish with sterile PBS.
- Gently transfer the dishes to the incubator, avoiding spilling the drop to the sides.
- After 24 h of incubation, wash off the cells that have not adhered to the glass with 2 mL of PBS, and add 1 mL of fresh pre-warmed culture medium.
- Incubate the cells for the next 48–72 h until they reach a spindle-shaped morphology.
3.2. Culturing and Preparation of Leukemia/Lymphoma (LL) Cell Lines for Experiments
- CRITICAL STEP: Leukemia–lymphoma cell lines are cultured in RPMI 1640 medium containing FBS and antibiotics according to the manufacturer’s instructions. Low-passage-number samples need to be generated for use in subsequent experiments for each cell line, frozen, and stored in liquid nitrogen until needed.
- Thaw the vial by gentle agitation in a 37 °C water bath.
- Seed the LL cell lines in complete culture medium in T25 flasks dedicated to cell suspension. Use the seeding densities presented in Table 1.
- Maintain the cell culture at the optimal cell density (please see Table 1) by splitting the saturated culture 1:2 to 1:3 every 2–3 days.
- Prior to preparing LL cell suspensions for the experiments, transfer the contents of the flask to a centrifuge tube containing 9 mL of complete culture medium and centrifuge the cells at 300× g for 7 min at room temperature.
- CRITICAL STEP: Start preparing samples no earlier than 30 min before the planned experiment.
- 5.
- Discard the supernatant and resuspend the cell pellet with 4 mL of complete culture medium.
- 6.
- Determine the cell viability with Trypan blue, which should be >95%.
- 7.
- Prepare the cell suspension at a concentration of 1 × 10⁴ cells/mL.
- 8.
- Incubate the sample at 37 °C until optical manipulations.
3.3. Optical Tweezer Experimental Setup and Calibration
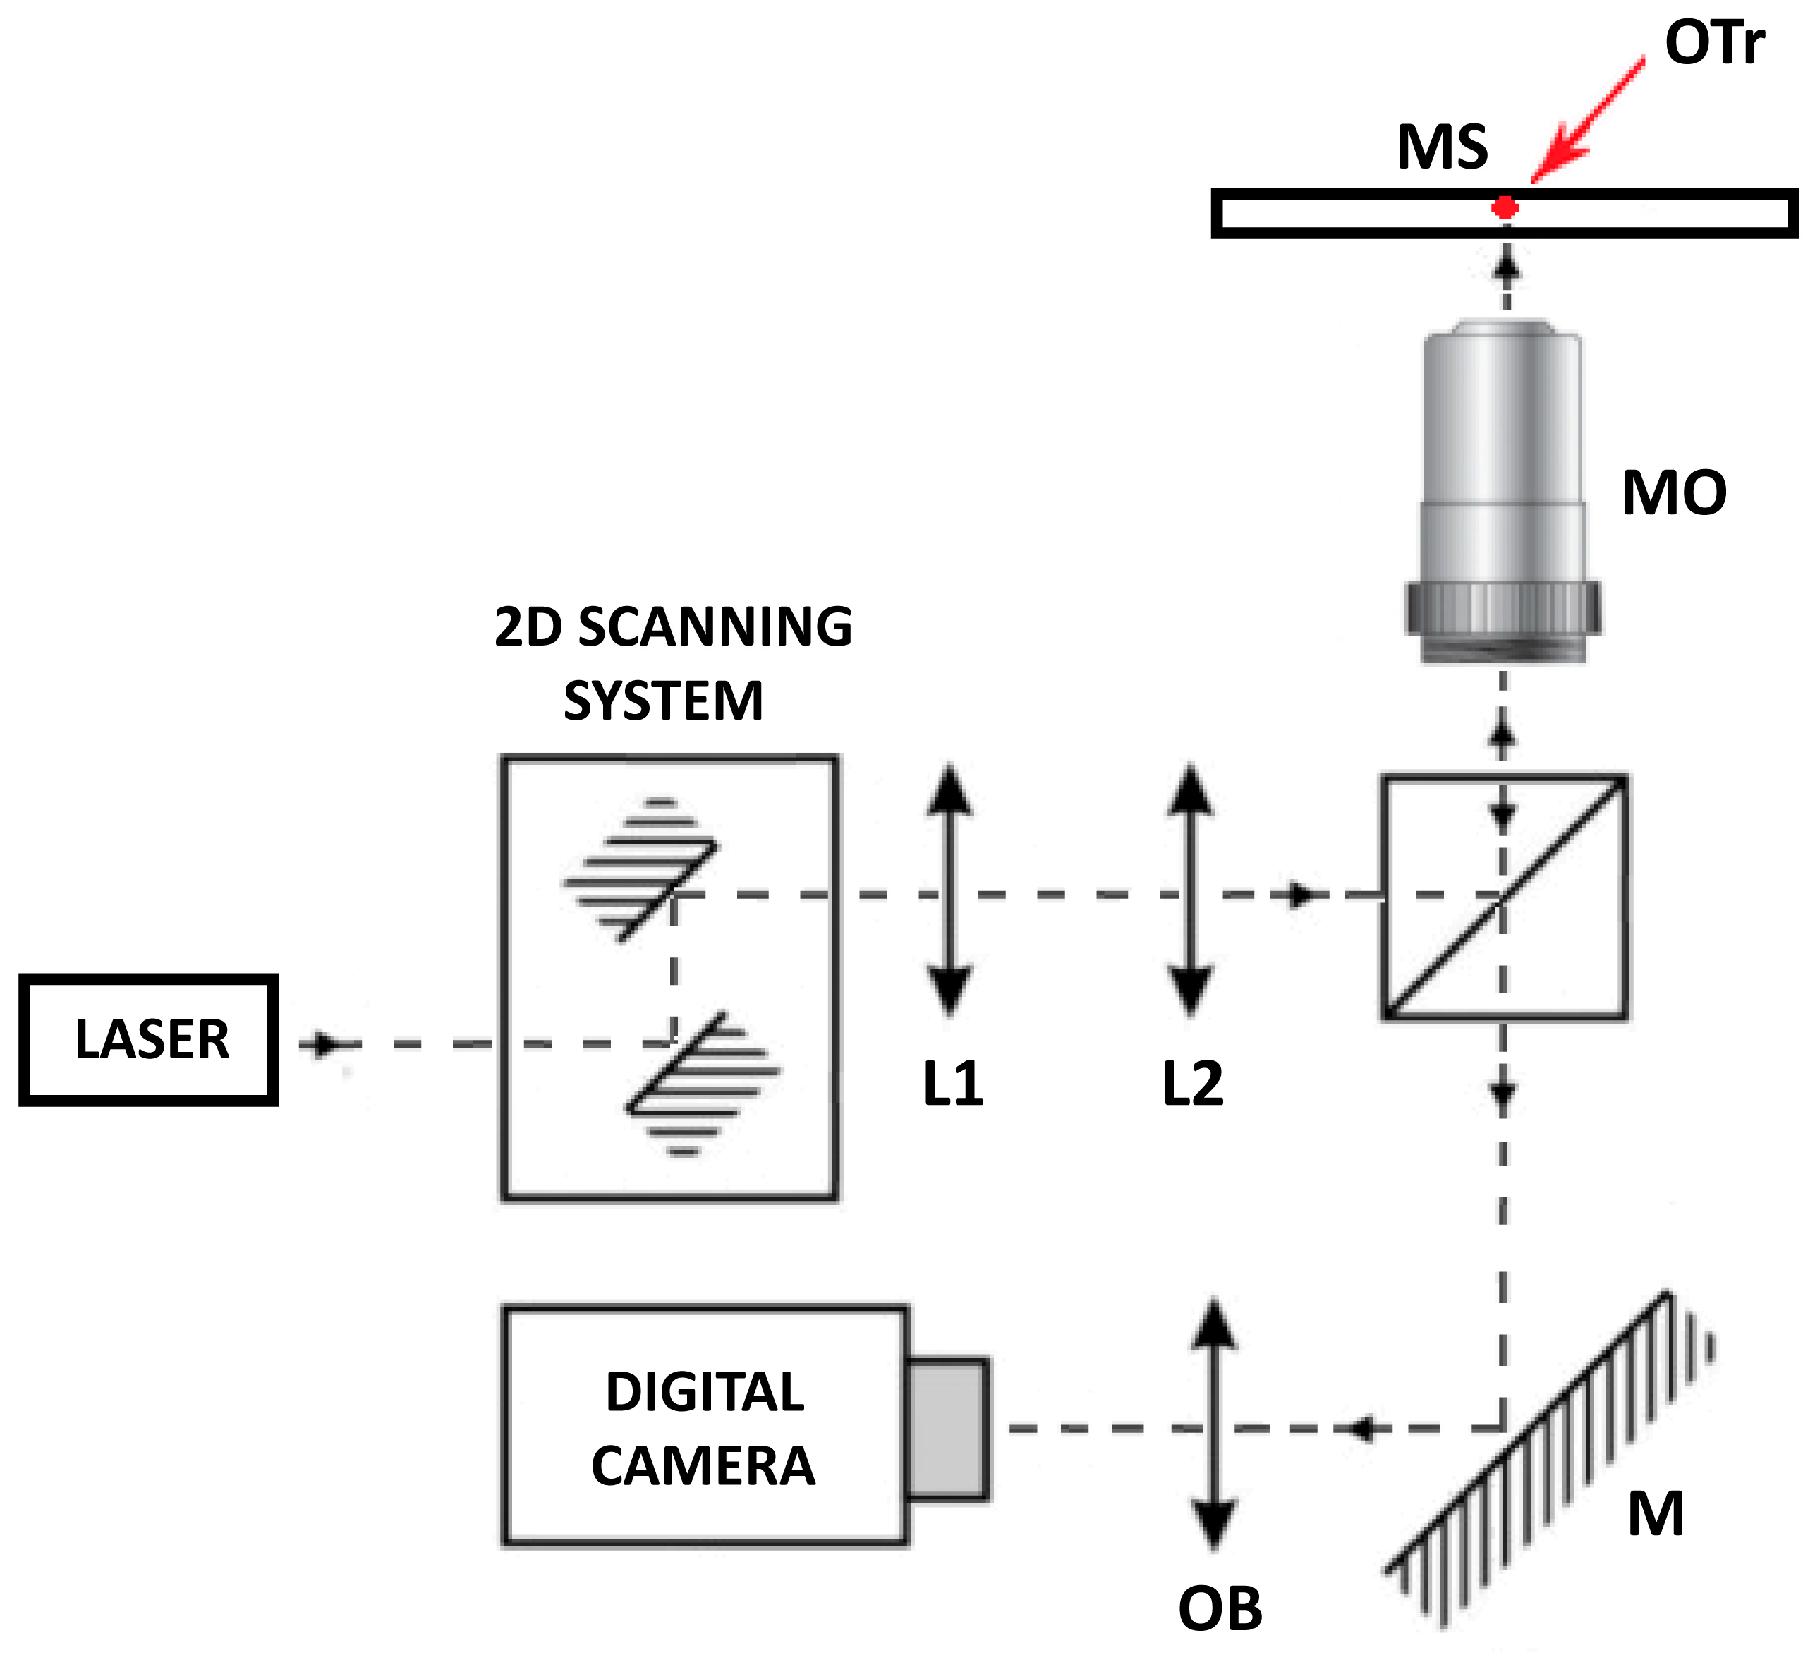
- CRITICAL STEP: In this work, we do not focus on the optical tweezer building protocol; rather, we provide the main functional steps of optical tweezer systems, which are achieved in both commercial and custom-built systems. In our custom-built system, presented in Figure 2, the given trap stiffness was achieved for a laser power of 100 mW at the entrance of the microscope objective, measured with a 3 µm polystyrene bead (Polybead Microspheres, Polysciences, Warrington, PA, USA). The minimal invasiveness of the laser on lymphoma cells was previously confirmed [23,24,25,26] while still maintaining the ability to manipulate living cells. All procedures were carried out at room temperature, specifically 22–24 °C.
- Turn on the laser and adjust the power to achieve a trap stiffness of approximately 50 pN/µm in the optical tweezer system.
- Allow the laser to stabilize by keeping it on for about 10 min before beginning any work.
- Launch the computer software. In the software window, you will see an image of the microscope sample. Utilize the markers displayed on the screen to move the optical trap in any desired direction.
- CRITICAL STEP: In our study, we used custom software written in Visual Studio 2019 C++. The program displays an image of a microscopic sample on the monitor and couples the mouse cursor movements with the control of the Thorlabs GVS002 XY galvo-scanners, enabling precise movement of the focused laser beam to the locations indicated by the cursor on the screen.
- 4.
- Add 30 μL of immersion medium to the center of the microscope objective and place a 35 mm glass-bottom microscopy dish on the microscope stage.
- 5.
- Carefully turn the micrometer adjustment screw of the microscope up and down until the laser beam is sharply focused into a single, bright point on the screen.
- 6.
- Add 1 × 10³ LL cells to 100 µL of culture medium and place the cell suspension in the center of the glass-bottom dish as a single drop. Wait for approximately 5 min until the cells sink to the bottom of the dish.
- 7.
- Use the microscope stage movements to locate a floating lymphoma cell. Activate the optical trap by clicking on the trap cursor on the screen to engage with the cell. Attempt to move the LL cell to the desired position. A cell suitable for manipulation must be able to move easily in the intended direction.
3.4. Trapping Procedure and Determination of Minimum Cell-to-Cell Adhesion
- Place a glass-bottom dish with mesenchymal stromal cells on the microscope stage.
- Position the MSC cell, to which the LL cell will be attached, in the field of view of the microscope.
- Add 100 µL of the previously prepared suspension of LL cells. Wait approximately 5 min until the cells sink to the bottom.
- Identify a candidate cell under the microscope and position the optical trap over the cell of interest.
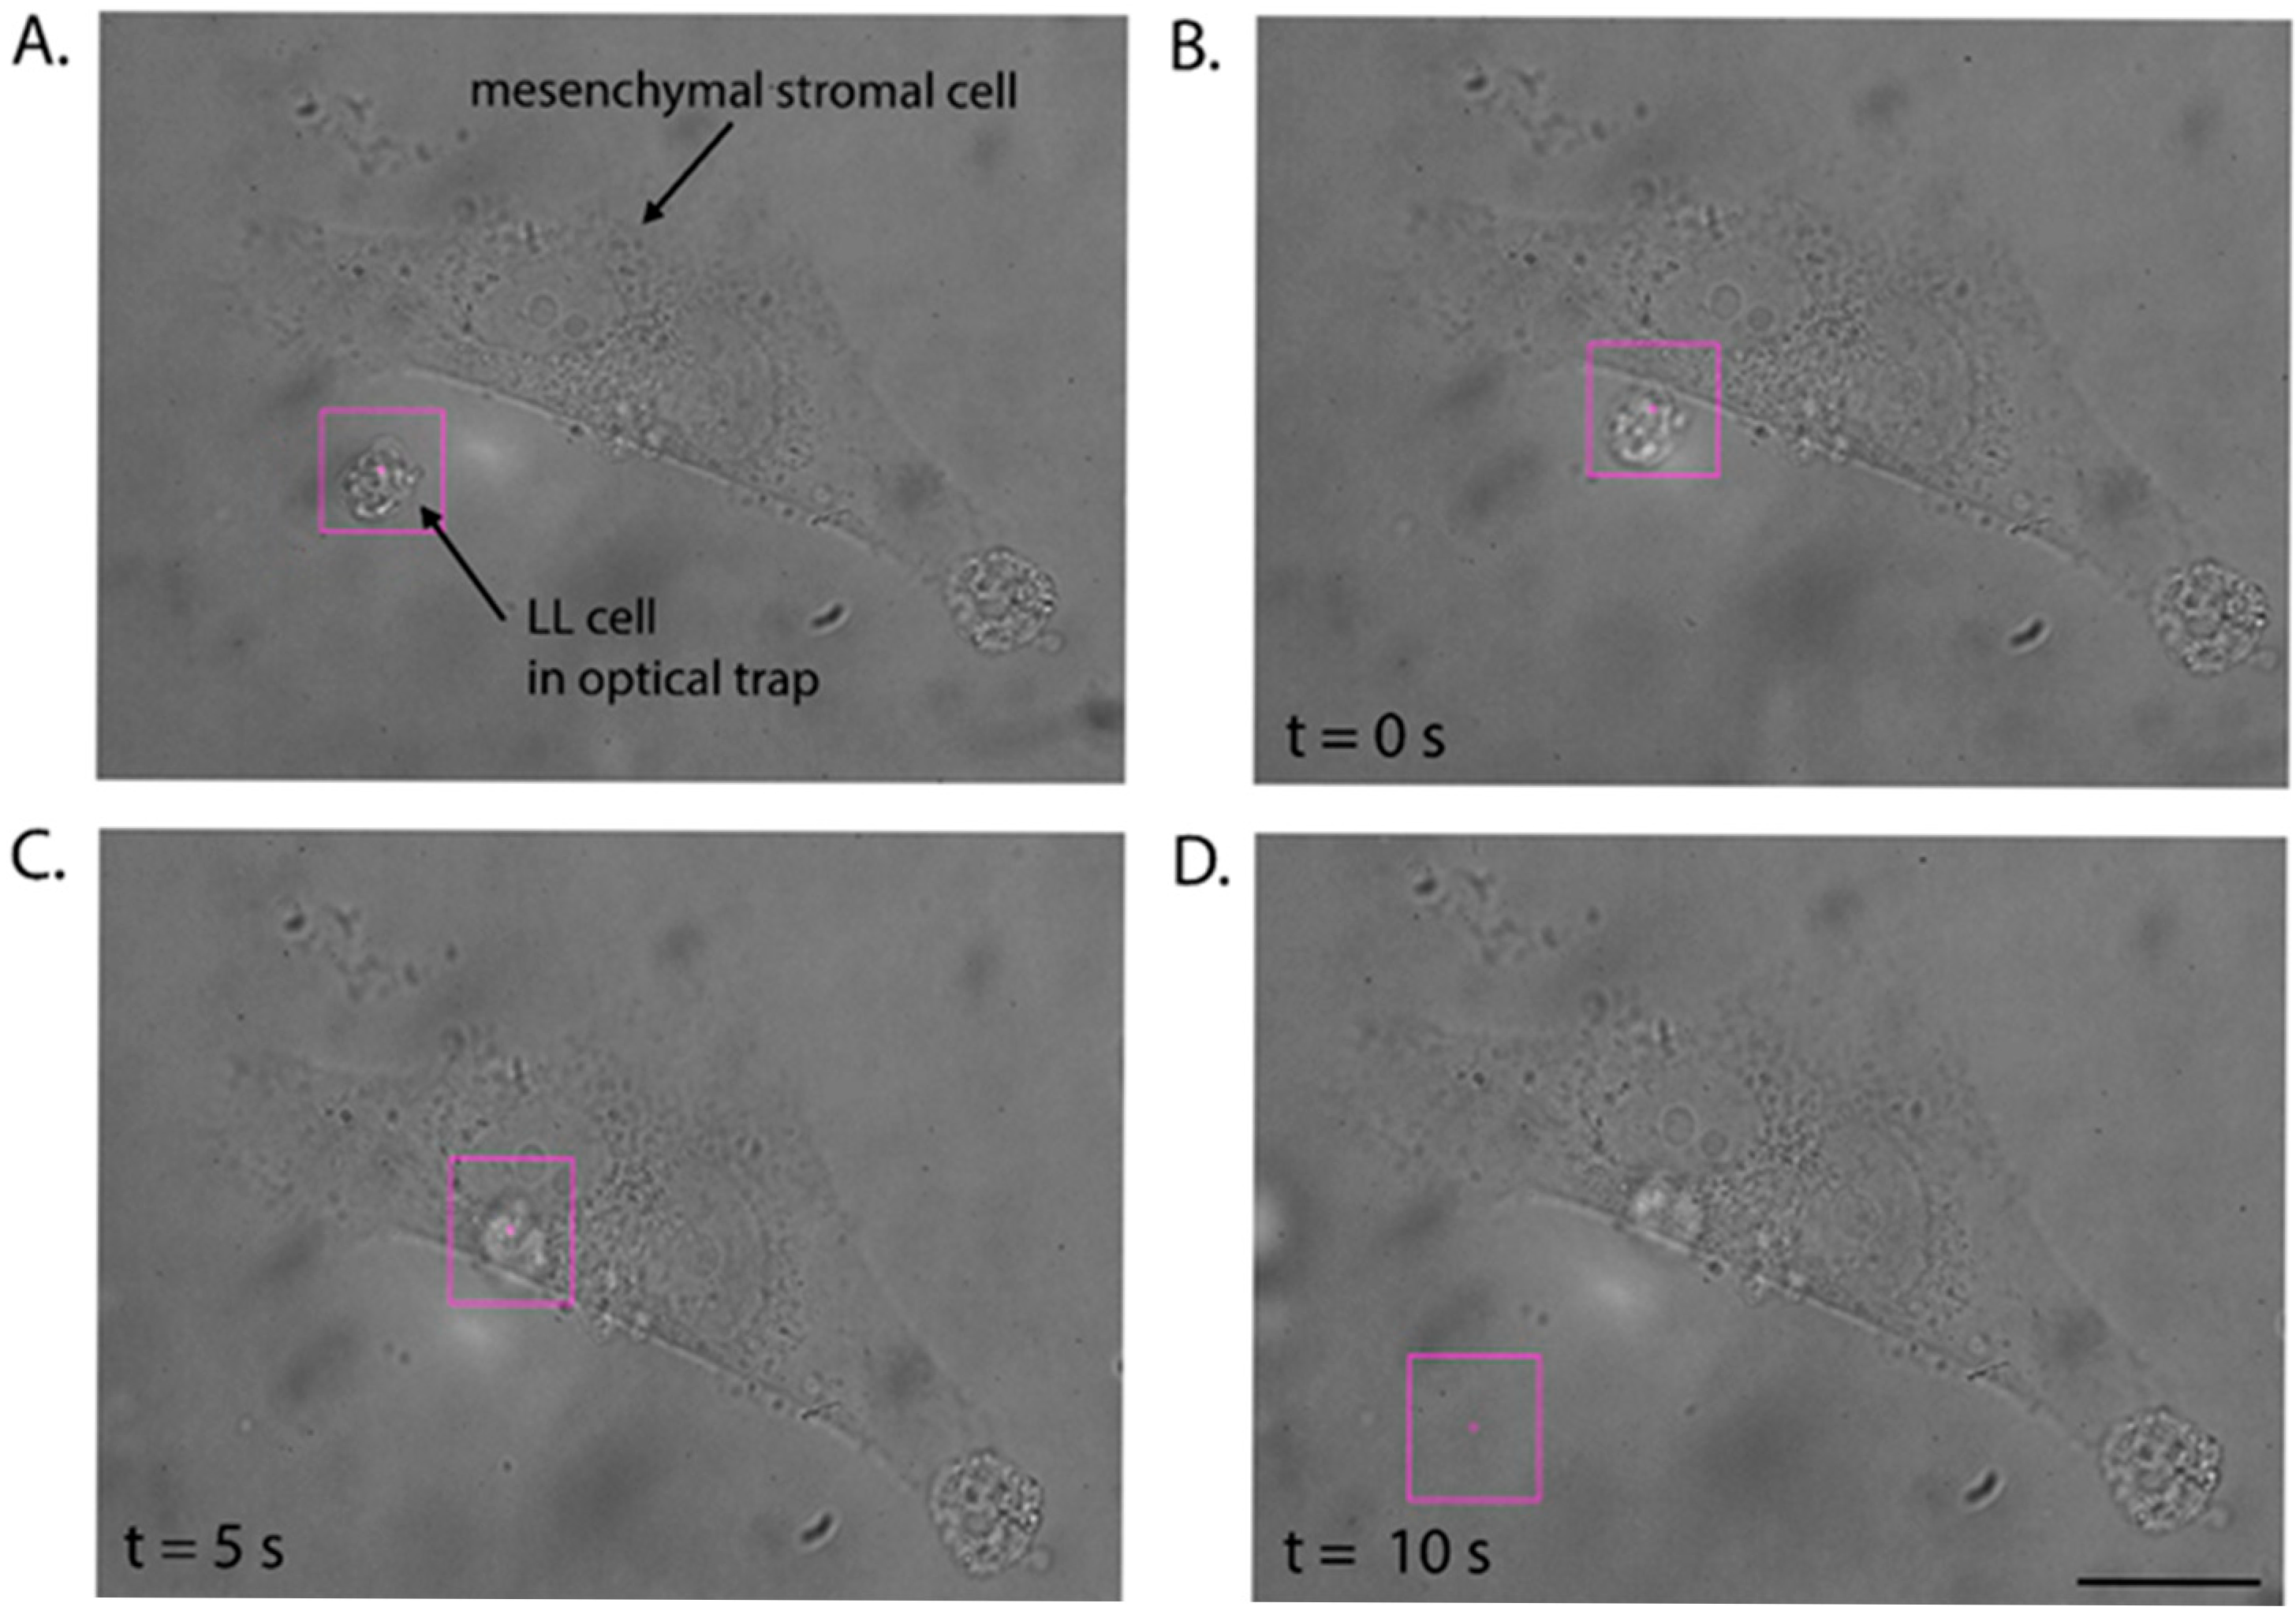
- Trap the cell with the optical tweezers (Figure 3A) and attempt to move it. The optical trap should allow the cells to move freely in the direction specified by the operator.
- Check if the given contact time is sufficient to initiate the formation of the adhesion junction between the cells. For this purpose, catch the LL cell in the optical trap and attempt to pull it away from the stromal cell during three detachment attempts (see Video S2).
- If the optical trap with the LL cell is retracted from the surface of the stromal cell, extend the adhesion time to 10 s.
- Repeat steps 7 and 8 to check if the nascent adhesion has formed. After an unsuccessful attempt, increase the contact time between the cells.
- Once the LL cell is permanently attached to the stromal cell, note the time at which adhesion occurred, and repeat the procedure with the next LL cell.
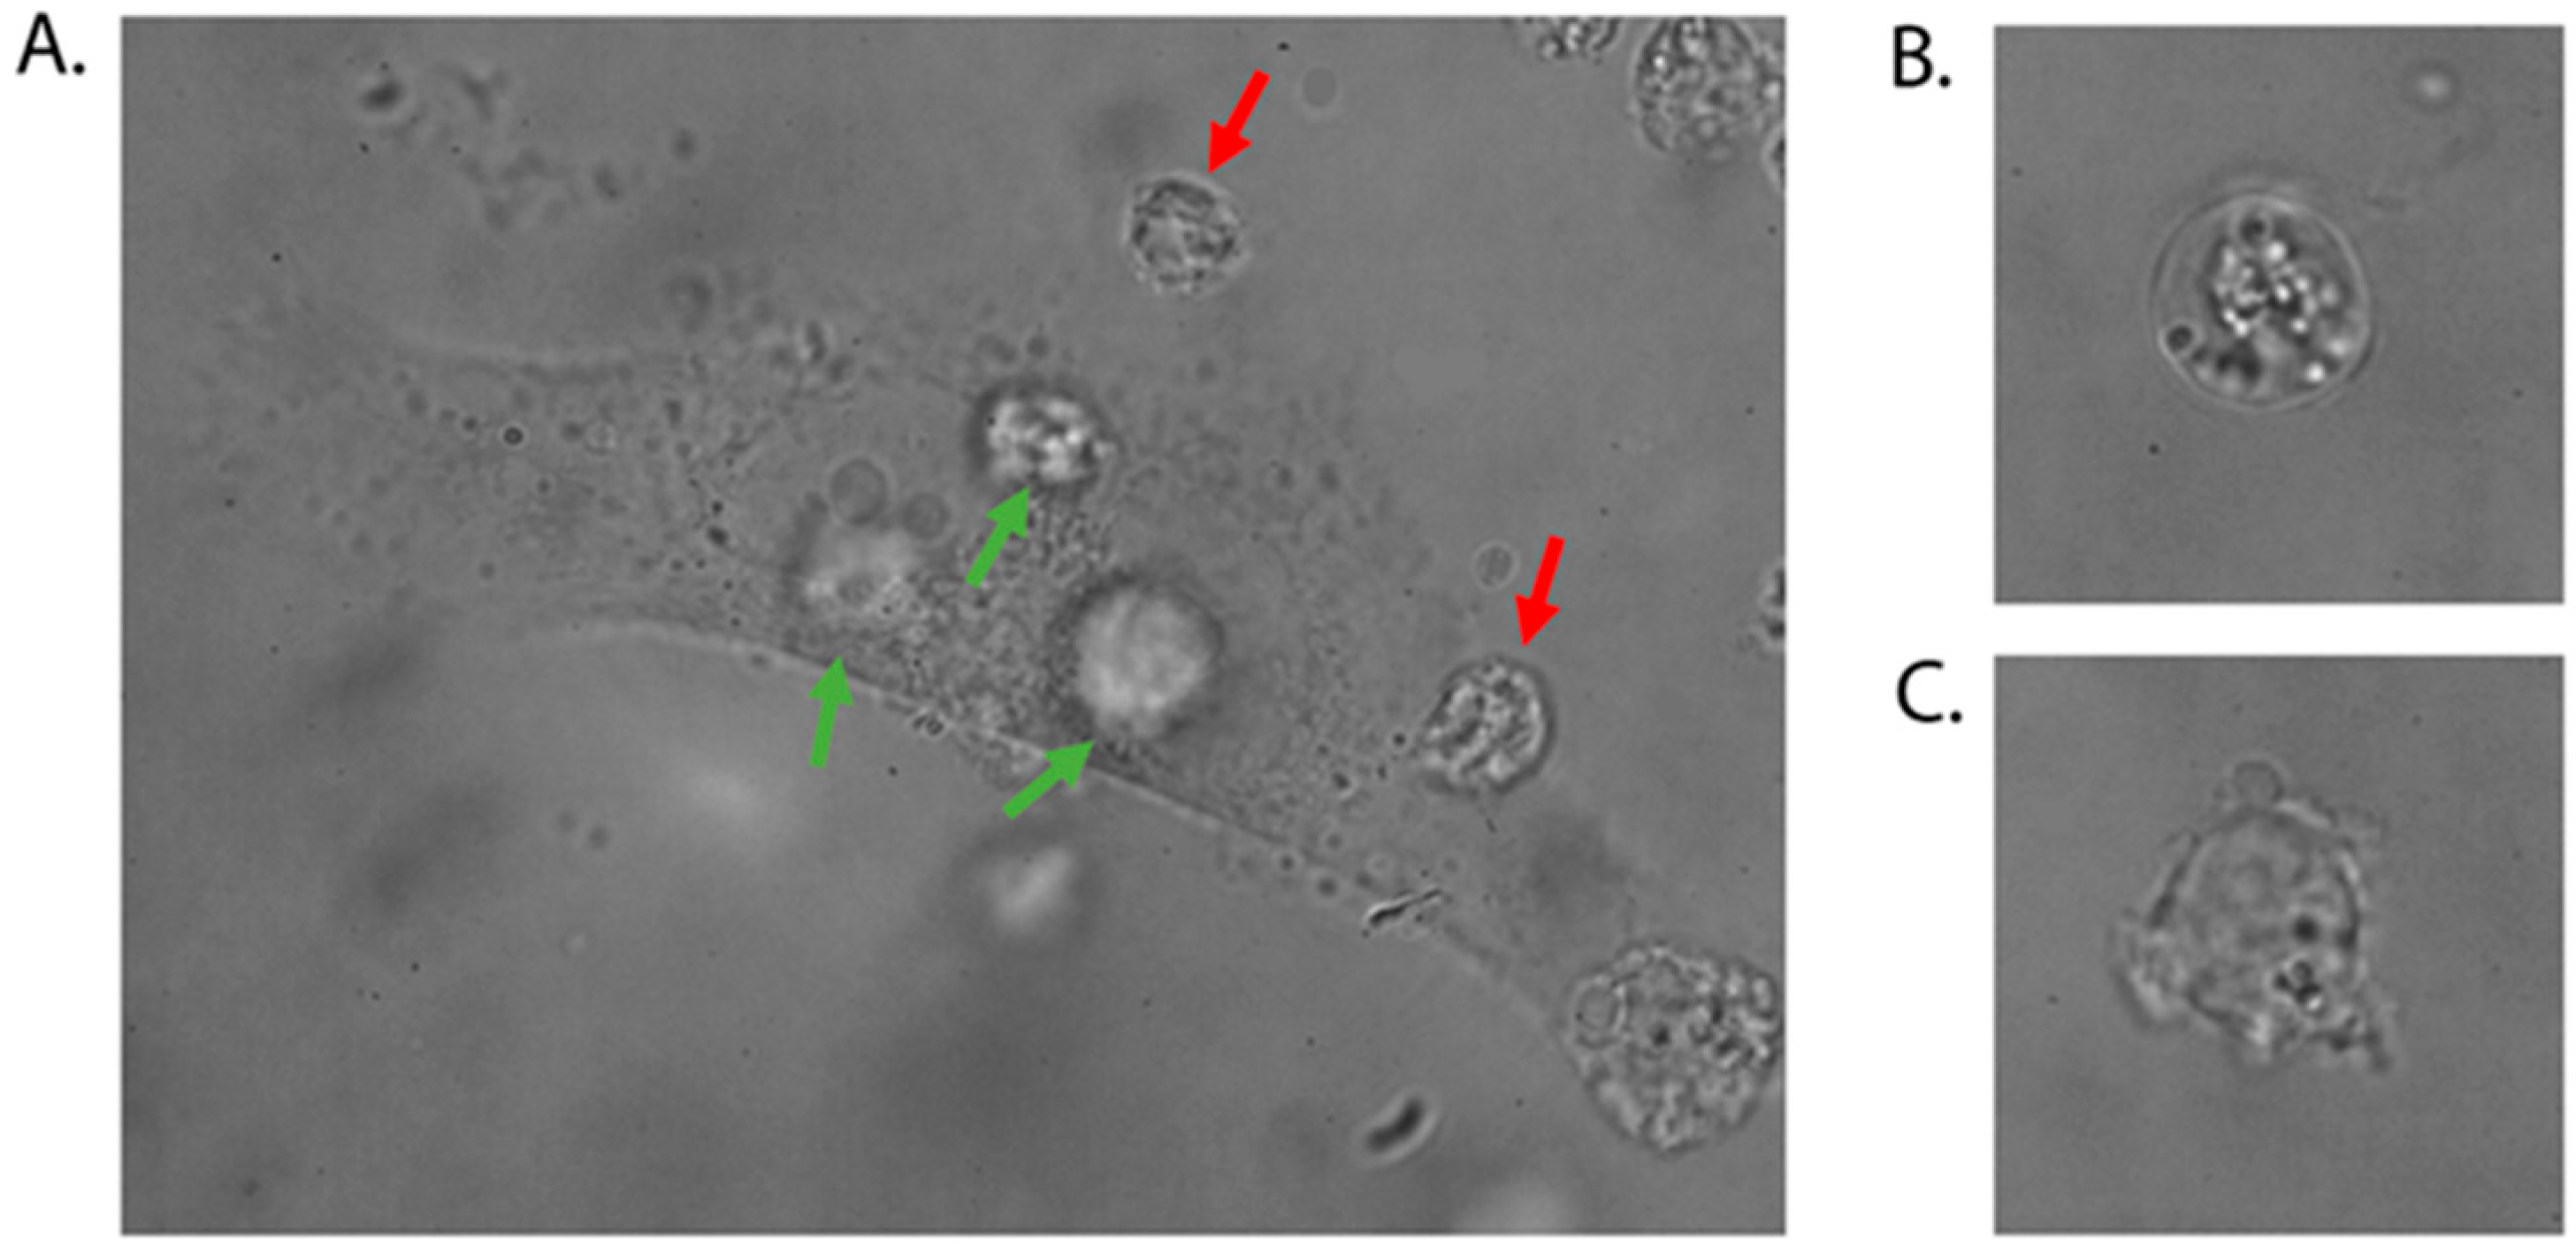
- CRITICAL STEP: To increase the throughput of the procedure, several LL cells can be attached to one MSCs cell, but LL cells should not adhere to each other. A glass-bottom dish with MSCs cells should be changed every 20 min.
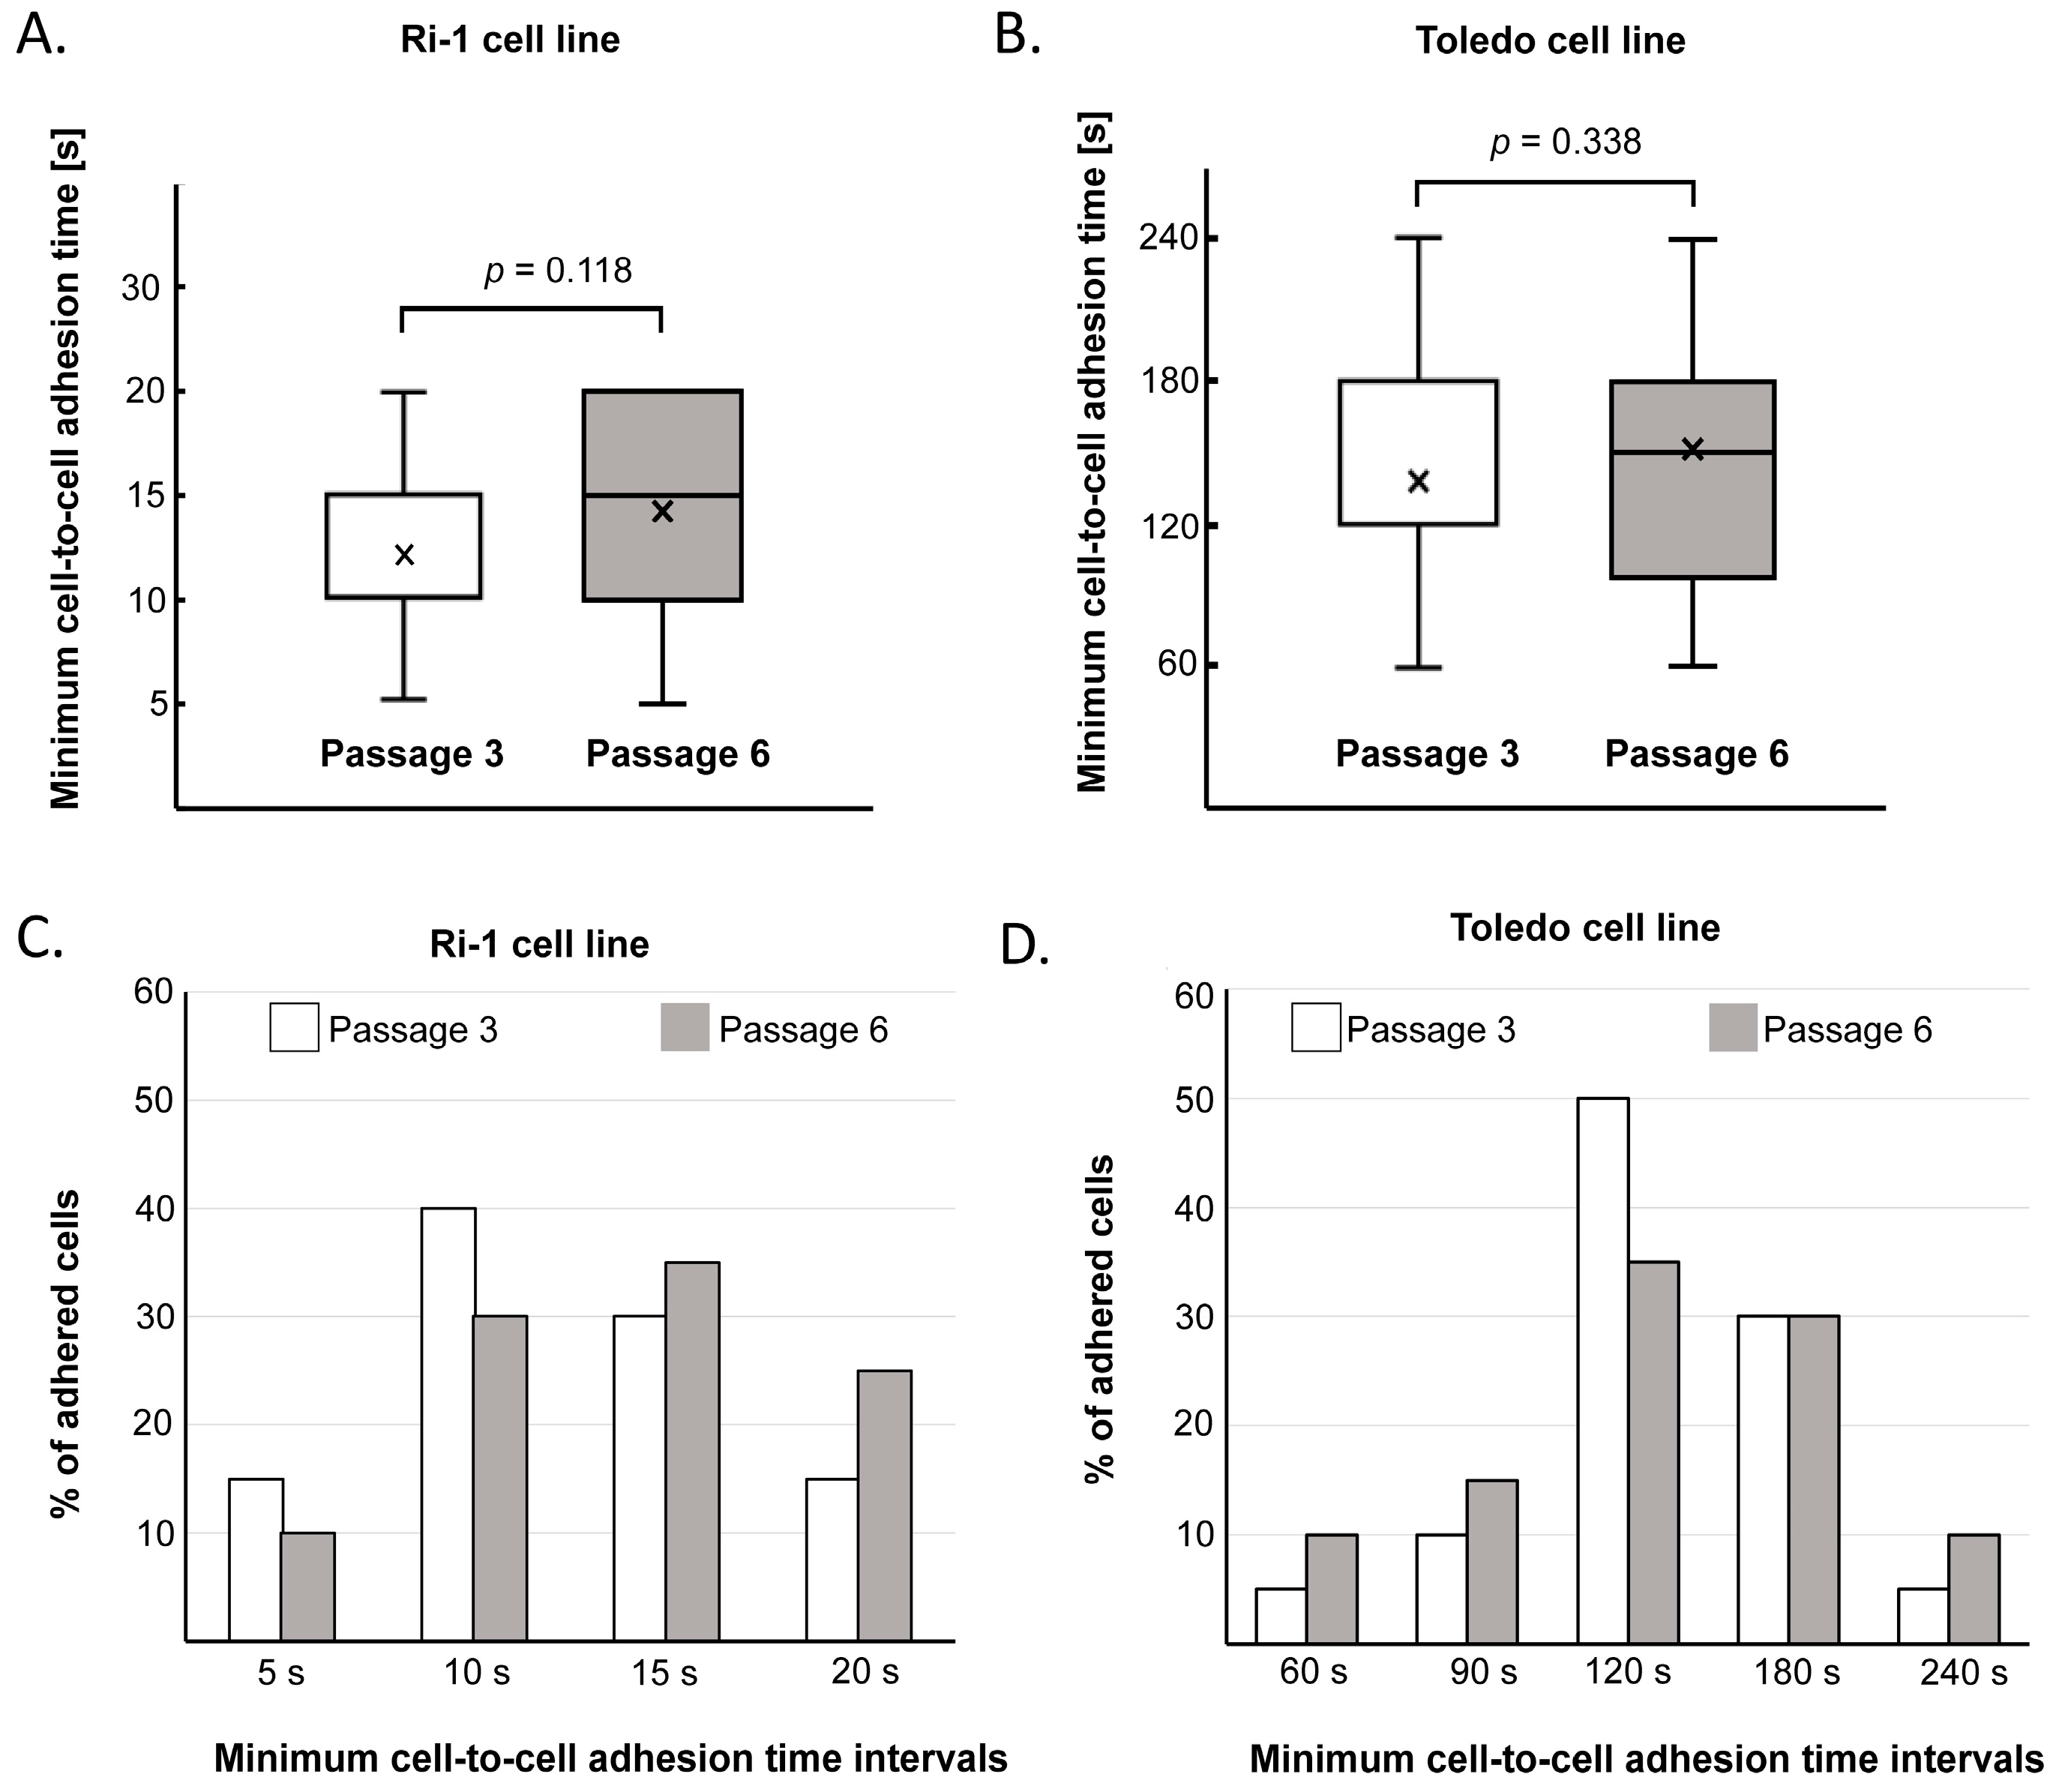
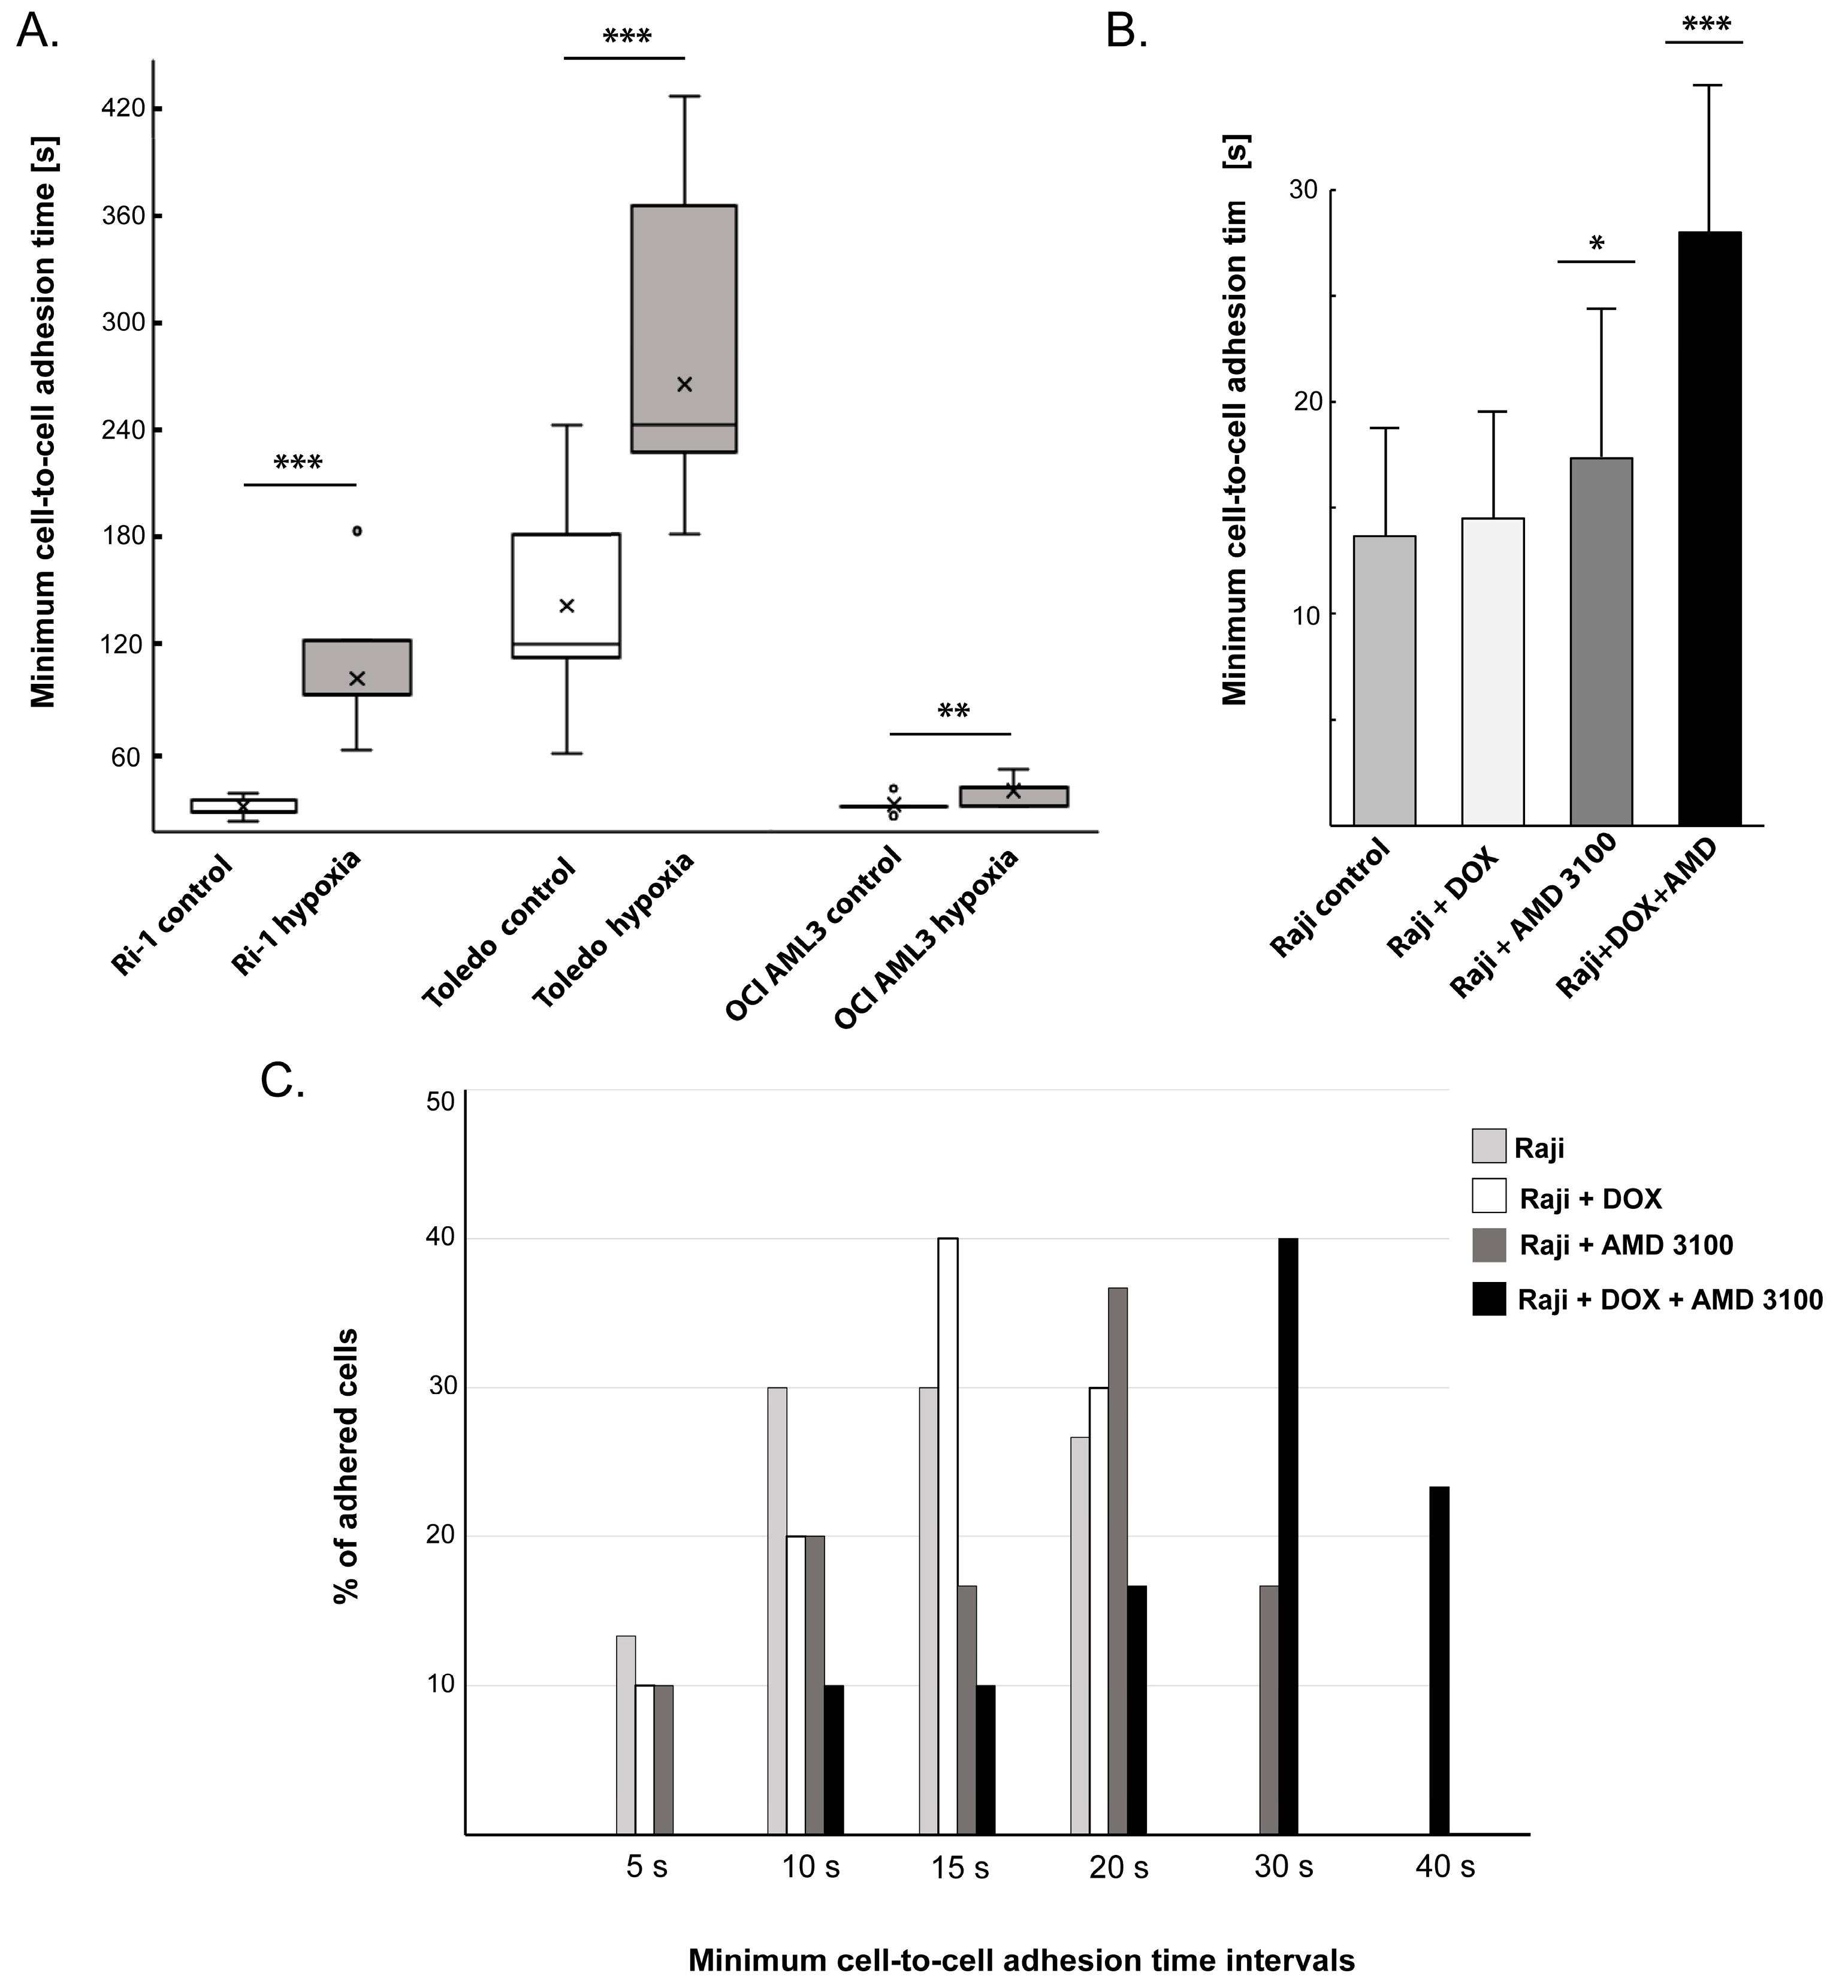
- The mean adhesion time will depend on the cell type and state. In general, distinct LL cell lines and primary cells differ significantly in average minimum adhesion time, ranging from 15.5 ± 8.4 to 132.9 ± 48.8 s for untreated B-cell lymphoma cell lines [23,24]. Thus, it is necessary to determine time intervals for each cell line in a preliminary experiment involving approximately 10 individual cells and adapt these values to the adhesive properties of the examined cells. For example, if the average minimum cell-to-cell adhesion time is established as 120 s, one can set the initial contact time to 60 s and then increase it successively every 30 s until a stable adhesive bond is formed.
- To avoid interferences with other cells, we used a cell concentration of 1 × 10⁵ LL cells/mL and discarded measurements with more than one cell inside the microscope field.
- MSCs used for experiments may exhibit specific shape geometries; however, the lymphoma cell should be positioned over a central region of the mesenchymal stromal cell near the nucleus.
- Control the lymphoma cell morphology during the experiment. If you observe an irregular bulge in the plasma membrane (blebbing of the plasma membrane), stop the experiment and apply a new dish with stromal cells.
3.5. Downstream Application 1: The Changes in Adhesion Under Hypoxic Treatment
- CRITICAL STEP 1: Cells can enter a state of hypoxia at varying oxygen concentrations; so, this should be investigated beforehand, for example, by evaluating the status of hypoxia-inducible factor 1α (HIF-1α). In our previous study, a significant increase in HIF-1α activity was detected in cells growing in the presence of 1% oxygen for 24 h; therefore, these conditions were considered hypoxic.
- CRITICAL STEP 2: For the evaluation of cell adhesion evaluation in hypoxia, a concentration of 1% oxygen was maintained during the manipulations by using an in-house fabricated hypoxic chamber [23].
- Culture LL cell lines as previously described in Section 3.2.
- Prior to hypoxic treatment, centrifuge, count, and seed cells in a new T25 flask according to the densities presented in Table 1. Prepare two identical flasks (twin cultures) for each cell line.
- In parallel, prepare MSCs as presented in Section 3.1.
- Set a multigas incubator to 1% oxygen (1% O2, 5% CO2, 94% N2).
- Preincubate the complete culture media in 1% oxygen overnight to reduce the O2 contained in the media.
- Place the flasks with LL cells and MSCs in hypoxia for 24 h.
- As a control, cultivate a T25 flask with the corresponding cells in complete RPMI in parallel for the same duration under standard (normoxic) conditions in a conventional incubator.
- After 24 h of cell cultivation under normoxia and hypoxia, centrifuge the cells, resuspend the cell pellet in 4 mL of culture medium, and determine the cell number.
- Homogenize the cell pellet quickly by pipetting up and down. Count the cells and prepare a suspension of 1 × 10⁴ cells/mL.
- Mount the hypoxic chamber on the motorized stage of the microscope. Control the level of oxygen inside the chamber.
- Place the glass-bottom dish with stromal cells inside the hypoxic chamber.
- Proceed with the manipulation with the optical tweezers as described in Section 3.4.
- CRITICAL STEP: The initial contact time required to establish cell-to-cell adhesion must be experimentally determined for each cell line during preliminary studies.
3.6. Downstream Application 2: The Changes in Adhesion Under Drug Treatment
- Prepare a stock solution of DOX (1 mM) and AMD3100 (5 mM) by dissolving the drugs in sterile deionized water. Store at −20 °C until use.
- Culture the Raji cell line as previously described in Section 3.2.
- To test the influence of the drugs on single cell adhesion, seed 5 × 10⁵ Raji cells in 1 mL of culture medium in a 12-well plate.
- Add either DOX, AMD3100, or both drugs to the Raji cells, resulting in final concentrations of 0.1 μM for DOX and 50 μM for AMD3100 in the culture medium.
- Incubate the cells under standard conditions for 48 h.
- Centrifuge the cells at 300× g for 7 min, remove all liquid, and add 4 mL of PBS; then, vortex to wash the cells.
- Centrifuge the cells again at 300× g for 7 min and remove all liquid using a serological pipette.
- Resuspend the cell pellets by adding 4 mL of fresh culture medium, count the cells, and determine cell viability using the TB assay.
- Prepare a working cell suspension of 1 × 10⁴ cells/mL.
- Proceed with the manipulation with the optical tweezers as described in Section 3.4.
- CRITICAL STEP: The initial contact time required to establish cell-to-cell adhesion must be experimentally determined for each cell line during preliminary studies.
4. Expected Results and Discussion
5. Patents
Supplementary Materials
Author Contributions
Funding
Informed Consent Statement
Data Availability Statement
Acknowledgments
Conflicts of Interest
Abbreviations
| OTs | Optical tweezers |
| LL | Leukemia–lymphoma |
| ECM | Extracellular matrix |
| SC | Stromal cells |
| BM | Bone marrow |
| MSCs | Mesenchymal stromal cells |
| B-NHL | B-cell non-Hodgkin lymphoma |
| DOX | Doxorubicin |
| AMD3100 | Plerixafor |
| CAMs | Cell adhesion molecules |
| SDF-1 | Stromal-derived factor-1 |
| FBS | Fetal bovine serum |
| PBS | Phosphate-buffered saline |
| DMSO | Dimethyl sulfoxide |
| ATCC | American Type Culture Collection |
| DSMZ | German Collection of Microorganisms and Cell Cultures |
| TB | Trypan blue |
| NA | Numerical aperture |
| DM | Dichroic mirror |
| L | Lens |
| M | Mirror |
| OB | Objective |
| MO | Microscope objective |
| MS | Microscopic sample |
| OTr | Optical trap |
| HIF-1α | Hypoxia-inducible factor 1α |
References
- Abedin, M.; King, N. Diverse evolutionary path to cell adhesion. Trends Cell Biol. 2010, 20, 734–742. [Google Scholar] [CrossRef] [PubMed]
- Khalili, A.A.; Ahmad, M.R. A Review of Cell Adhesion Studies for Biomedical and Biological Applications. Int. J. Mol. Sci. 2015, 16, 18149–18184. [Google Scholar] [CrossRef] [PubMed]
- Gumbiner, B.M. Cell Adhesion: The Molecular Basis of Tissue Architecture and Morphogenesis. Cell 1996, 84, 345–357. [Google Scholar] [CrossRef] [PubMed]
- Wang, P.; Li, J.; Wei, Q. Understanding the interplay between cell force and cell adhesion processes. Eng. Regen. 2023, 4, 277–288. [Google Scholar] [CrossRef]
- Guo, W.; Giancotti, F.G. Integrin signalling during tumour progression. Nat. Rev. Mol. Cell Biol. 2004, 5, 816–826. [Google Scholar] [CrossRef]
- Hanahan, D.; Weinberg, R.A. Hallmarks of cancer: The next generation. Cell 2011, 144, 646–674. [Google Scholar] [CrossRef]
- Yayan, J.; Franke, K.J.; Berger, M.; Windisch, W.; Rasche, K. Adhesion, metastasis, and inhibition of cancer cells: A comprehensive review. Mol. Biol. Rep. 2024, 51, 165. [Google Scholar] [CrossRef]
- Beri, P.; Popravko, A.; Yeoman, B.; Kumar, A.; Chen, K.; Hodzic, E.; Chiang, A.; Banisadr, A.; Placone, J.K.; Carter, H.; et al. Cell Adhesiveness Serves as a Biophysical Marker for Metastatic Potential. Cancer Res. 2020, 80, 901–911. [Google Scholar] [CrossRef]
- Indra, I.; Undyala, V.; Kandow, C.; Thirumurthi, U.; Dembo, M.; Beningo, K.A. An in vitro correlation of mechanical forces and metastatic capacity. Phys. Biol. 2011, 8, 015015. [Google Scholar]
- Hirohashi, S. Inactivation of the E-cadherin-mediated cell adhesion system in human cancers. Am. J. Pathol. 1998, 153, 333–339. [Google Scholar] [CrossRef]
- Harjunpää, H.; Llort Asens, M.; Guenther, C.; Fagerholm, S.C. Cell adhesion molecules and their roles and regulation in the immune and tumor microenvironment. Front. Immunol. 2019, 10, 1078. [Google Scholar] [CrossRef] [PubMed]
- Fedorchenko, O.; Baranski, Z.; Gebura, K.; Kynast-Wolf, G.; Trumpp, A.; Seiffert, M.; Niemann, C.U.; Wierda, W.G.; Keating, M.J.; Burger, J.A. CD44 regulates the apoptotic response and promotes disease development in chronic lymphocytic leukemia. Leukemia 2013, 27, 1581–1589. [Google Scholar] [CrossRef] [PubMed]
- Ungai-Salánki, R.; Haty, E.; Gerecsei, T.; Francz, B.; Béres, B.; Sztilkovics, M.; Székács, I.; Szabó, B.; Horvath, R. Single-cell adhesion strength and contact density drops in the M phase of cancer cells. Sci. Rep. 2021, 1, 18500. [Google Scholar] [CrossRef] [PubMed]
- Singh, A.K.; Cancelas, J.A. Gap Junctions in the Bone Marrow Lympho-Hematopoietic Stem Cell Niche, Leukemia Progression, and Chemoresistance. Int. J. Mol. Sci. 2020, 21, 796. [Google Scholar] [CrossRef]
- Sircar, A.; Chowdhury, S.M.; Hart, A.; Bell, W.C.; Singh, S.; Sehgal, L.; Epperla, N. Impact and Intricacies of Bone Marrow Microenvironment in B-cell Lymphomas: From Biology to Therapy. Int. J. Mol. Sci. 2020, 21, 904. [Google Scholar] [CrossRef]
- Jalali, S.; Ansell, S.M. Role of the Bone Marrow Niche in Supporting the Pathogenesis of Lymphoid Malignancies. Front. Cell Dev. Biol. 2021, 9, 692320. [Google Scholar] [CrossRef]
- Vianello, F.; Villanova, F.; Tisato, V.; Lymperi, S.; Ho, K.K.; Gomes, A.R.; Marin, D.; Bonnet, D.; Apperley, J.; Lam, E.W.; et al. Bone marrow mesenchymal stromal cells non-selectively protect chronic myeloid leukemia cells from imatinib-induced apoptosis via the CXCR4/CXCL12 axis. Haematologica 2010, 95, 1081–1089. [Google Scholar] [CrossRef]
- Humphries, M.J. Cell adhesion assays. Meth. Mol. Biol. 2009, 522, 203–210. [Google Scholar]
- Ungai-Salánki, R.; Peter, B.; Gerecsei, T.; Orgovan, N.; Horvath, R.; Szabó, B. A practical review on the measurement tools for cellular adhesion force. Adv. Colloid Interface Sci. 2019, 269, 309–333. [Google Scholar] [CrossRef]
- Kashef, J.; Franz, C.M. Quantitative methods for analyzing cell-cell adhesion in development. Dev. Biol. 2015, 401, 165–174. [Google Scholar] [CrossRef]
- Gao, D.; Jin, F.; Zhou, M.; Jiang, Y. Recent advances in single cell manipulation and biochemical analysis on microfluidics. Analyst 2019, 144, 766–781. [Google Scholar] [CrossRef] [PubMed]
- Fierro, F.A.; Taubenberger, A.; Puech, P.H.; Ehninger, G.; Bornhauser, M.; Muller, D.J.; Illmer, T. BCR/ABL expression of myeloid progenitors increases beta1-integrin mediated adhesion to stromal cells. J. Mol. Biol. 2008, 377, 1082–1093. [Google Scholar] [CrossRef] [PubMed]
- Duś-Szachniewicz, K.; Drobczyński, S.; Ziółkowski, P.; Kołodziej, P.; Walaszek, K.M.; Korzeniewska, A.K.; Agrawal, A.; Kupczyk, P.; Woźniak, M. Physiological Hypoxia (Physioxia) Impairs the Early Adhesion of Single Lymphoma Cell to Marrow Stromal Cell and Extracellular Matrix. Optical Tweezers Study. Int. J. Mol. Sci. 2018, 19, 1880. [Google Scholar] [CrossRef] [PubMed]
- Duś-Szachniewicz, K.; Gdesz-Birula, K.; Nowosielska, E.; Ziółkowski, P.; Drobczyński, S. Formation of Lymphoma Hybrid Spheroids and Drug Testing in Real Time with the Use of Fluorescence Optical Tweezers. Cells 2022, 11, 2113. [Google Scholar] [CrossRef]
- Gdesz-Birula, K.; Drobczyński, S.; Sarat, K.; Duś-Szachniewicz, K. Sonidegib Inhibits the Adhesion of Acute Myeloid Leukemia to the Bone Marrow in Hypoxia: An Optical Tweezer Study. Biomedicines 2025, 13, 578. [Google Scholar] [CrossRef]
- Duś-Szachniewicz, K.; Drobczyński, S.; Woźniak, M.; Zduniak, K.; Ostasiewicz, K.; Ziółkowski, P.; Korzeniewska, A.K.; Agrawal, A.K.; Kołodziej, P.; Walaszek, K.; et al. Differentiation of single lymphoma primary cells and normal B-cells based on their adhesion to mesenchymal stromal cells in optical tweezers. Sci. Rep. 2019, 9, 9885. [Google Scholar] [CrossRef]
- Ashkin, A.; Dziedzic, J.M.; Bjorkholm, J.E.; Chu, S. Observation of a single-beam gradient force optical trap for dielectric particles. Opt. Lett. 1986, 11, 288. [Google Scholar] [CrossRef]
- Bustamante, C.J.; Chemla, Y.R.; Liu, S.; Wang, M.D. Optical tweezers in single-molecule biophysics. Nat. Rev. Methods Primers 2021, 1, 25. [Google Scholar] [CrossRef]
- Killian, J.L.; Ye, F.; Wang, M.D. Optical Tweezers: A Force to Be Reckoned With. Cell 2018, 175, 1445–1448. [Google Scholar] [CrossRef]
- Koch, M.D.; Shaevitz, J.W. Introduction to Optical Tweezers. In Optical Tweezers. Methods in Molecular Biology; Gennerich, A., Ed.; Humana Press: New York, NY, USA, 2017; Volume 1486. [Google Scholar]
- Dhakal, K.R.; Lakshminarayanan, V. Chapter One–Optical Tweezers: Fundamentals and Some Biophysical Applications. Prog. Opt. 2018, 63, 1–31. [Google Scholar]
- Favre-Bulle, I.A.; Scott, E.K. Optical tweezers across scales in cell biology. Trends Cell Biol. 2022, 32, 932–946. [Google Scholar] [CrossRef] [PubMed]
- Choudhary, D.; Mossa, A.; Jadhav, M.; Cecconi, C. Bio-Molecular Applications of Recent Developments in Optical Tweezers. Biomolecules 2019, 9, 23. [Google Scholar] [CrossRef] [PubMed]
- Català-Castro, F.; Schäffer, E.; Krieg, M. Exploring cell and tissue mechanics with optical tweezers. J. Cell. Sci. 2022, 135, jcs259355, Erratum in: J. Cell. Sci. 2023, 136, jcs261843. [Google Scholar] [CrossRef] [PubMed]
- Arbore, C.; Perego, L.; Sergides, M.; Capitanio, M. Probing force in living cells with optical tweezers: From single-molecule mechanics to cell mechanotransduction. Biophys. Rev. 2019, 11, 765–782. [Google Scholar] [CrossRef]
- Zhang, H.; Liu, K.K. Optical tweezers for single cells. J. R. Soc. Interface 2008, 5, 671–690. [Google Scholar] [CrossRef]
- Ashkin, A. Optical trapping and manipulation of neutral particles using lasers. Proc. Natl. Acad. Sci. USA 1997, 94, 4853–4860. [Google Scholar] [CrossRef]
- Andersson, M.; Madgavkar, A.; Stjerndahl, M.; Wu, Y.; Tan, W.; Duran, R.; Niehren, S.; Mustafa, K.; Arvidson, K.; Wennerberg, A. Using optical tweezers for measuring the interaction forces between human bone cells and implant surfaces: System design and force calibration. Rev. Sci. Instrum. 2007, 78, 074302. [Google Scholar] [CrossRef]
- Fällman, E.; Schedin, S.; Jass, J.; Andersson, M.; Uhlin, B.E.; Axner, O. Optical tweezers based force measurement system for quantitating binding interactions: System design and application for the study of bacterial adhesion. Biosens. Bioelectron. 2004, 19, 1429–1437. [Google Scholar] [CrossRef]
- Helenius, J.; Heisenberg, C.-P.; Gaub, H.E.; Muller, D.J. Single-cell force spectroscopy. J. Cell Sci. 2008, 121, 1785–1791. [Google Scholar] [CrossRef]
- Drobczyński, S.; Duś-Szachniewicz, K.; Symonowicz, K.; Głogocka, D. Spectral analysis by a video camera in a holographic optical tweezers setup. Opt. Appl. 2013, 4, 739–747. [Google Scholar]
- Duś-Szachniewicz, K.; Gdesz-Birula, K.; Rymkiewicz, G. Development and Characterization of 3D Hybrid Spheroids for the Investigation of the Crosstalk Between B-Cell Non-Hodgkin Lymphomas and Mesenchymal Stromal Cells. OncoTargets Ther. 2022, 15, 683–697. [Google Scholar] [CrossRef]
- Janiszewska, M.; Primi, M.C.; Izard, T. Cell adhesion in cancer: Beyond the migration of single cells. J. Biol. Chem. 2020, 295, 2495–2505. [Google Scholar] [CrossRef]
- Drobczyński, S.; Duś-Szachniewicz, K. Real-time force measurement in double wavelength optical tweezers. J. Opt. Soc. Am. B 2017, 34, 38–43. [Google Scholar] [CrossRef]
- Miotto, M.; Scalise, S.; Leonetti, M.; Ruocco, G.; Peruzzi, G.; Gosti, G. A size-dependent division strategy accounts for leukemia cell size heterogeneity. Commun Phys. 2004, 7, 248. [Google Scholar] [CrossRef]
- Drexler, H.G.; Macleod, R.A. History of leukemia-lymphoma cell lines. Hum. Cell 2010, 23, 75–82. [Google Scholar] [CrossRef]
- Quentmeier, H.; Pommerenke, C.; Dirks, W.G.; Eberth, S.; Koeppel, M.; MacLeod, R.A.F.; Nagel, S.; Steube, K.; Uphoff, C.C.; Drexler, H.G. The LL-100 panel: 100 cell lines for blood cancer studies. Sci. Rep. 2019, 9, 8218. [Google Scholar] [CrossRef]
- Bertseva, E.; Grebenkov, D.; Schmidhauser, P.; Gribkova, S.; Jeney, S.; Forró, L. Optical trapping microrheology in cultured human cells. Eur. Phys. J. E Soft Matter. 2012, 35, 63. [Google Scholar] [CrossRef][Green Version]
- Hardiman, W.; Clark, M.; Friel, C.; Huett, A.; Pérez-Cota, F.; Setchfield, K.; Wright, A.J.; Tassieri, M. Living cells as a biological analog of optical tweezers–A non-invasive microrheology approach. Acta Biomater. 2023, 166, 317–325. [Google Scholar] [CrossRef]
- Zhong, Y.; He, S.; Ji, B. Mechanics in mechanosensitivity of cell adhesion and its roles in cell migration. Int. J. Comp. Mater. Sci. Eng. 2012, 1, 1250032. [Google Scholar] [CrossRef]
- Nagy, Á.G.; Kanyó, N.; Vörös, A.; Székács, I.; Bonyár, A.; Horvath, R. Population distributions of single-cell adhesion parameters during the cell cycle from high-throughput robotic fluidic force microscopy. Sci. Rep. 2022, 12, 7747. [Google Scholar] [CrossRef]
- Duś-Szachniewicz, K.; Gdesz-Birula, K.; Zduniak, K.; Wiśniewski, J.R. Proteomic-Based Analysis of Hypoxia- and Physioxia-Responsive Proteins and Pathways in Diffuse Large B-Cell Lymphoma. Cells 2021, 10, 2025. [Google Scholar] [CrossRef] [PubMed]
- Giuntoli, S.; Tanturli, M.; Di Gesualdo, F.; Barbetti, V.; Rovida, E.; Dello Sbarba, P. Glucose availability in hypoxia regulates the selection of chronic myeloid leukemia progenitor subsets with different resistance to imatinib-mesylate. Haematologica 2011, 96, 204–212. [Google Scholar] [CrossRef] [PubMed]
- Matolay, O.; Méhes, G. Sustain, Adapt, and Overcome-Hypoxia Associated Changes in the Progression of Lymphatic Neoplasia. Front. Oncol. 2019, 9, 1277. [Google Scholar] [CrossRef] [PubMed]
- Kciuk, M.; Gielecińska, A.; Mujwar, S.; Kołat, D.; Kałuzińska-Kołat, Ż.; Celik, I.; Kontek, R. Doxorubicin- An Agent with Multiple Mechanisms of Anticancer Activity. Cells 2023, 12, 659. [Google Scholar] [CrossRef]
- Bilgin, Y.M. Use of Plerixafor for Stem Cell Mobilization in the Setting of Autologous and Allogeneic Stem Cell Transplantations: An Update. J. Blood Med. 2021, 12, 403–412. [Google Scholar] [CrossRef]

| Cell Line | Seeding Density (Cells/mL) | Optimal Cell Density in Cell Culture |
|---|---|---|
| Ri-1 | 5 × 10⁵ | 1–2 × 10⁶ |
| Toledo | 5 × 10⁵ | 1 × 10⁶ |
| Oci-AML3 | 1–2 × 10⁵ | 1–2 × 10⁶ |
| Raji | 3 × 10⁵ | 0.5–1 × 10⁶ |
Disclaimer/Publisher’s Note: The statements, opinions and data contained in all publications are solely those of the individual author(s) and contributor(s) and not of MDPI and/or the editor(s). MDPI and/or the editor(s) disclaim responsibility for any injury to people or property resulting from any ideas, methods, instructions or products referred to in the content. |
© 2025 by the authors. Licensee MDPI, Basel, Switzerland. This article is an open access article distributed under the terms and conditions of the Creative Commons Attribution (CC BY) license (https://creativecommons.org/licenses/by/4.0/).
Share and Cite
Duś-Szachniewicz, K.; Drobczyński, S. Determination of the Minimum Cell-to-Cell Adhesion Time Using Optical Tweezers in Leukemia and Lymphoma Research. Methods Protoc. 2025, 8, 59. https://doi.org/10.3390/mps8030059
Duś-Szachniewicz K, Drobczyński S. Determination of the Minimum Cell-to-Cell Adhesion Time Using Optical Tweezers in Leukemia and Lymphoma Research. Methods and Protocols. 2025; 8(3):59. https://doi.org/10.3390/mps8030059
Chicago/Turabian StyleDuś-Szachniewicz, Kamila, and Sławomir Drobczyński. 2025. "Determination of the Minimum Cell-to-Cell Adhesion Time Using Optical Tweezers in Leukemia and Lymphoma Research" Methods and Protocols 8, no. 3: 59. https://doi.org/10.3390/mps8030059
APA StyleDuś-Szachniewicz, K., & Drobczyński, S. (2025). Determination of the Minimum Cell-to-Cell Adhesion Time Using Optical Tweezers in Leukemia and Lymphoma Research. Methods and Protocols, 8(3), 59. https://doi.org/10.3390/mps8030059


