
Optimal Selection of Sampling Points within Sewer Networks for Wastewater-Based Epidemiology Applications


Abstract
1. Introduction
2. Materials and Methods
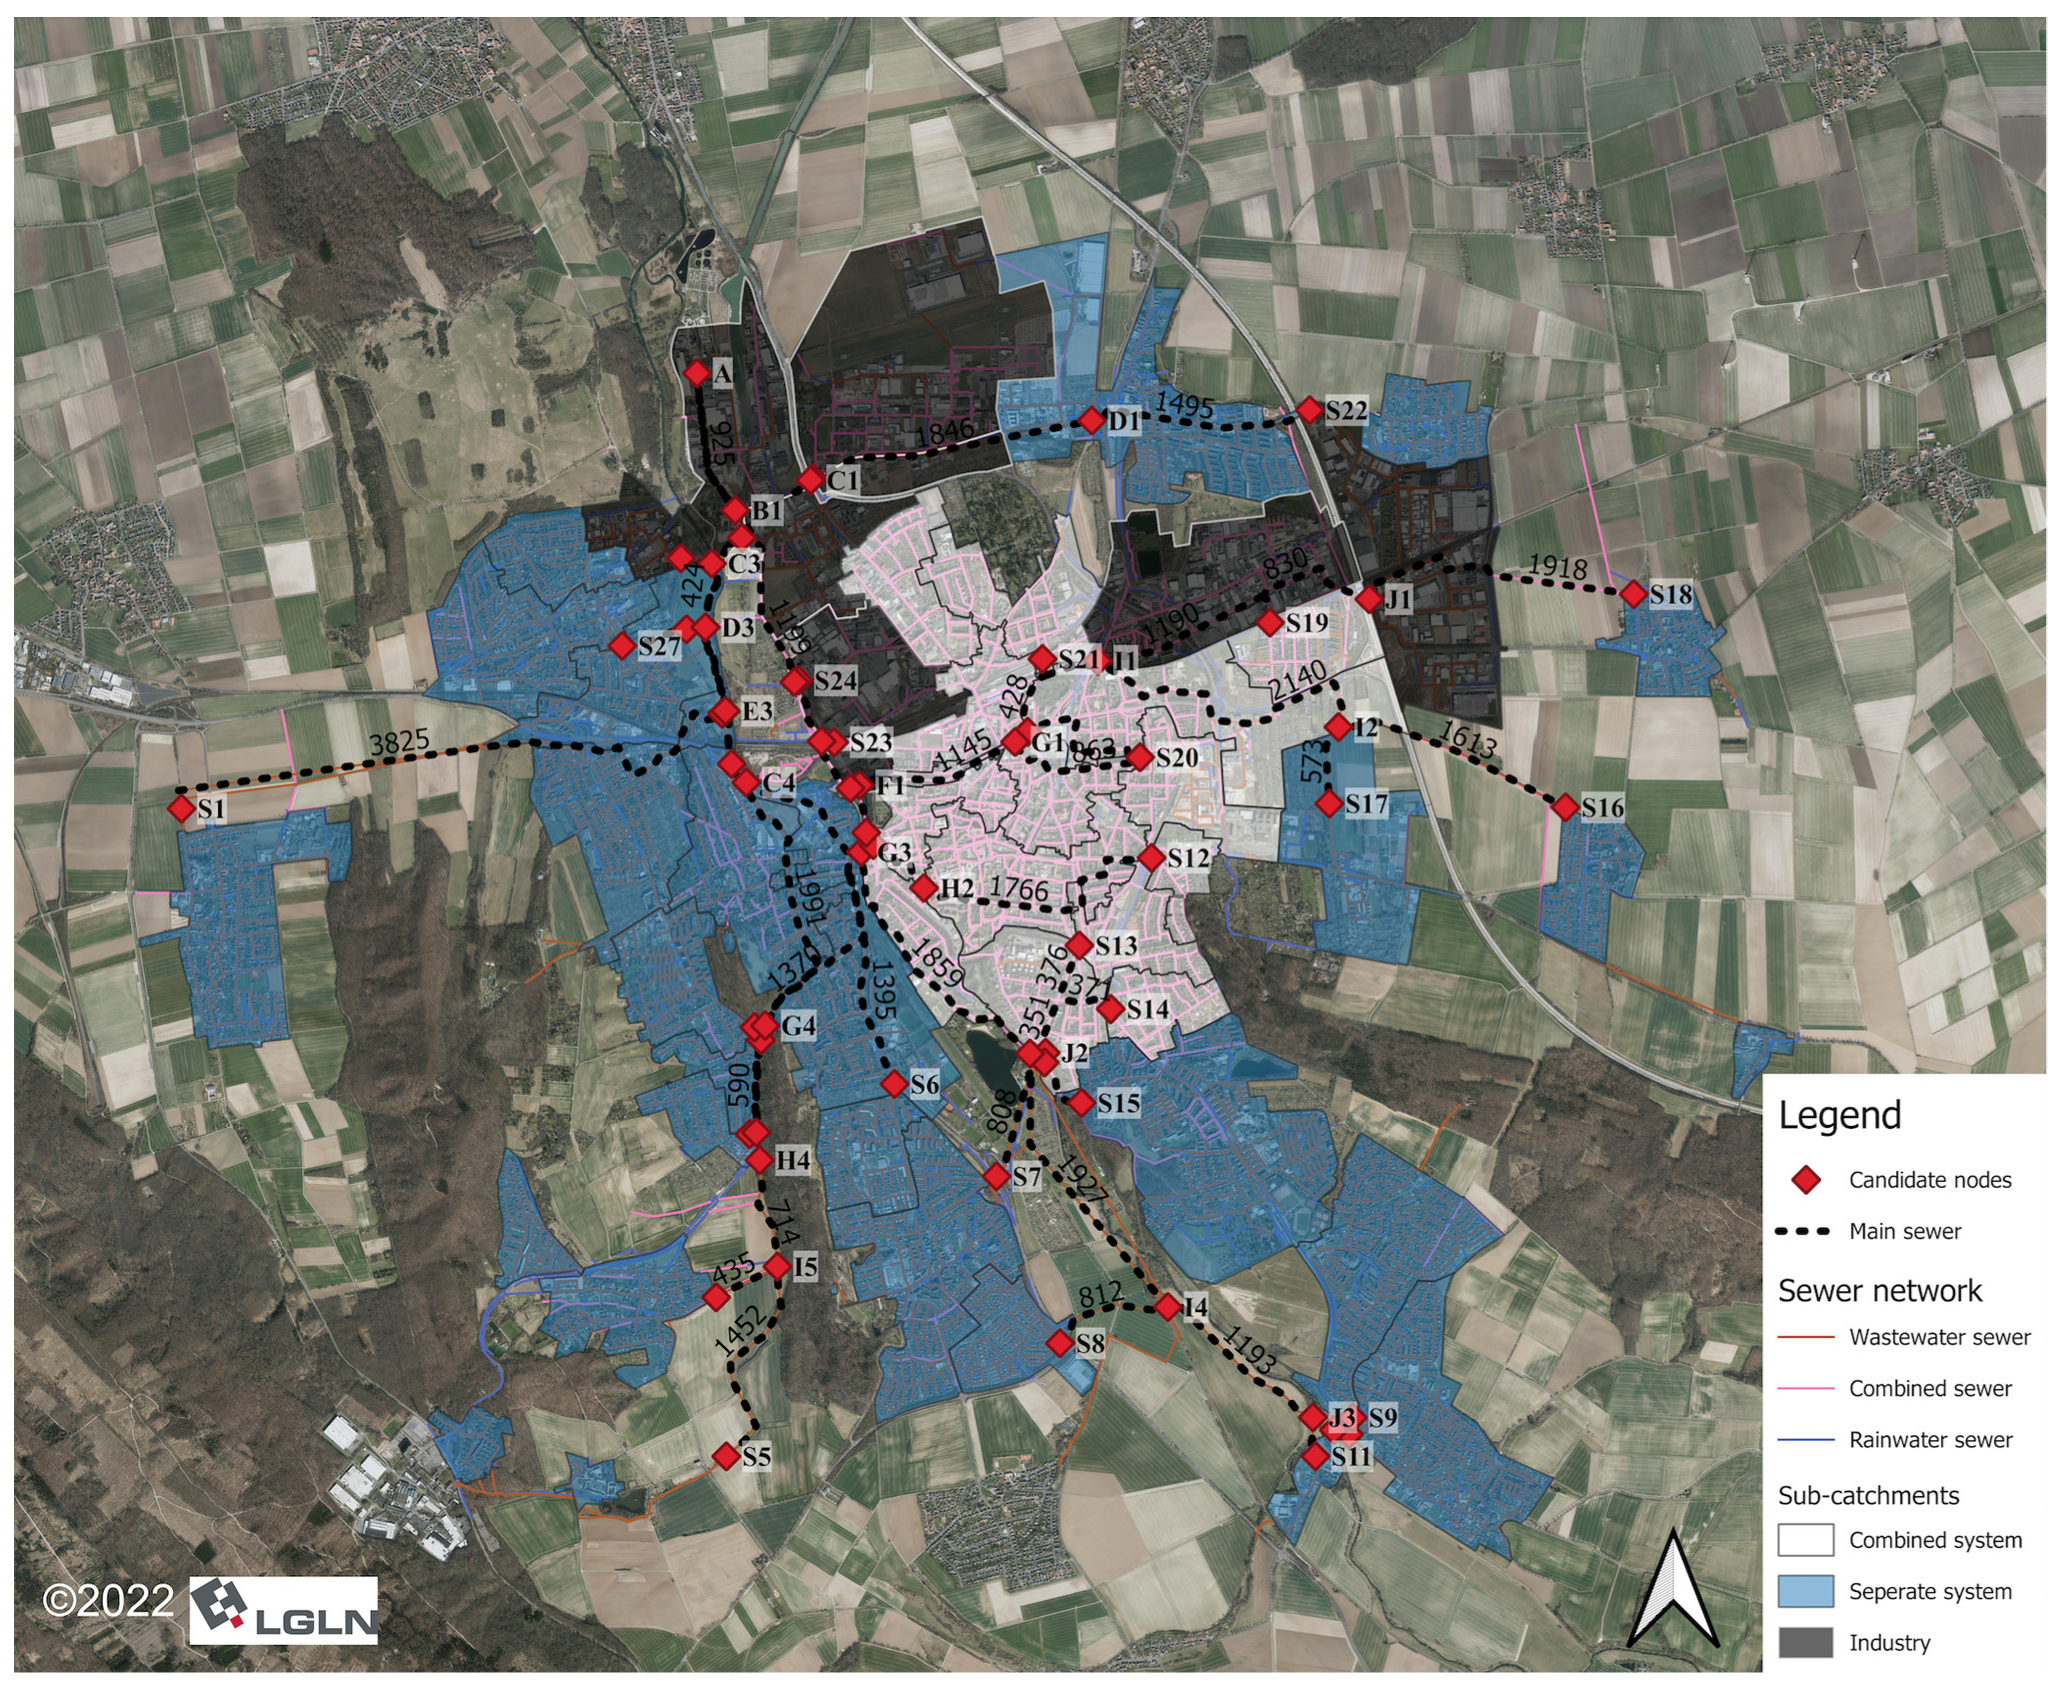
2.1. Study Area
2.2. Data
2.2.1. Sampling Data
2.2.2. Geographic Data
2.3. General Procedure
2.4. System Sensitivity
2.5. Optimization of Sampling Point Location
2.5.1. Information Theory
2.5.2. Probability Distribution
2.5.3. Signal Matrix and Entropy
2.5.4. Objective Function and Optimization Algorithm
| Algorithm 1. MIMR-based greedy selection algorithm to find optimal sampling points. | |
| 1 | Procedure ) Input: candidate set including all candidate nodes, catchment set including all sub-catchments, and desired number of candidate nodes . Output: selection set including optimally selected candidate nodes. |
| 2 | Initialize maximum joint entropy using Equation (3), selection set , temporary joint entropy . |
| 3 | for do |
| 4 | Calculate entropy for each candidate node using Equation (6) |
| 5 | end for |
| 6 | Assign optimal candidate node |
| 7 | Update |
| 8 | Update |
| 9 | while and do |
| 10 | for do |
| 11 | Calculate using Equation (7) |
| 12 | end for |
| 13 | Find local optimal candidate node using Equation (8) |
| 14 | Update |
| 15 | Update |
| 16 | Assign temporary joint entropy |
| 17 | end while |
| 18 | return |
3. Experimental Results and Discussion
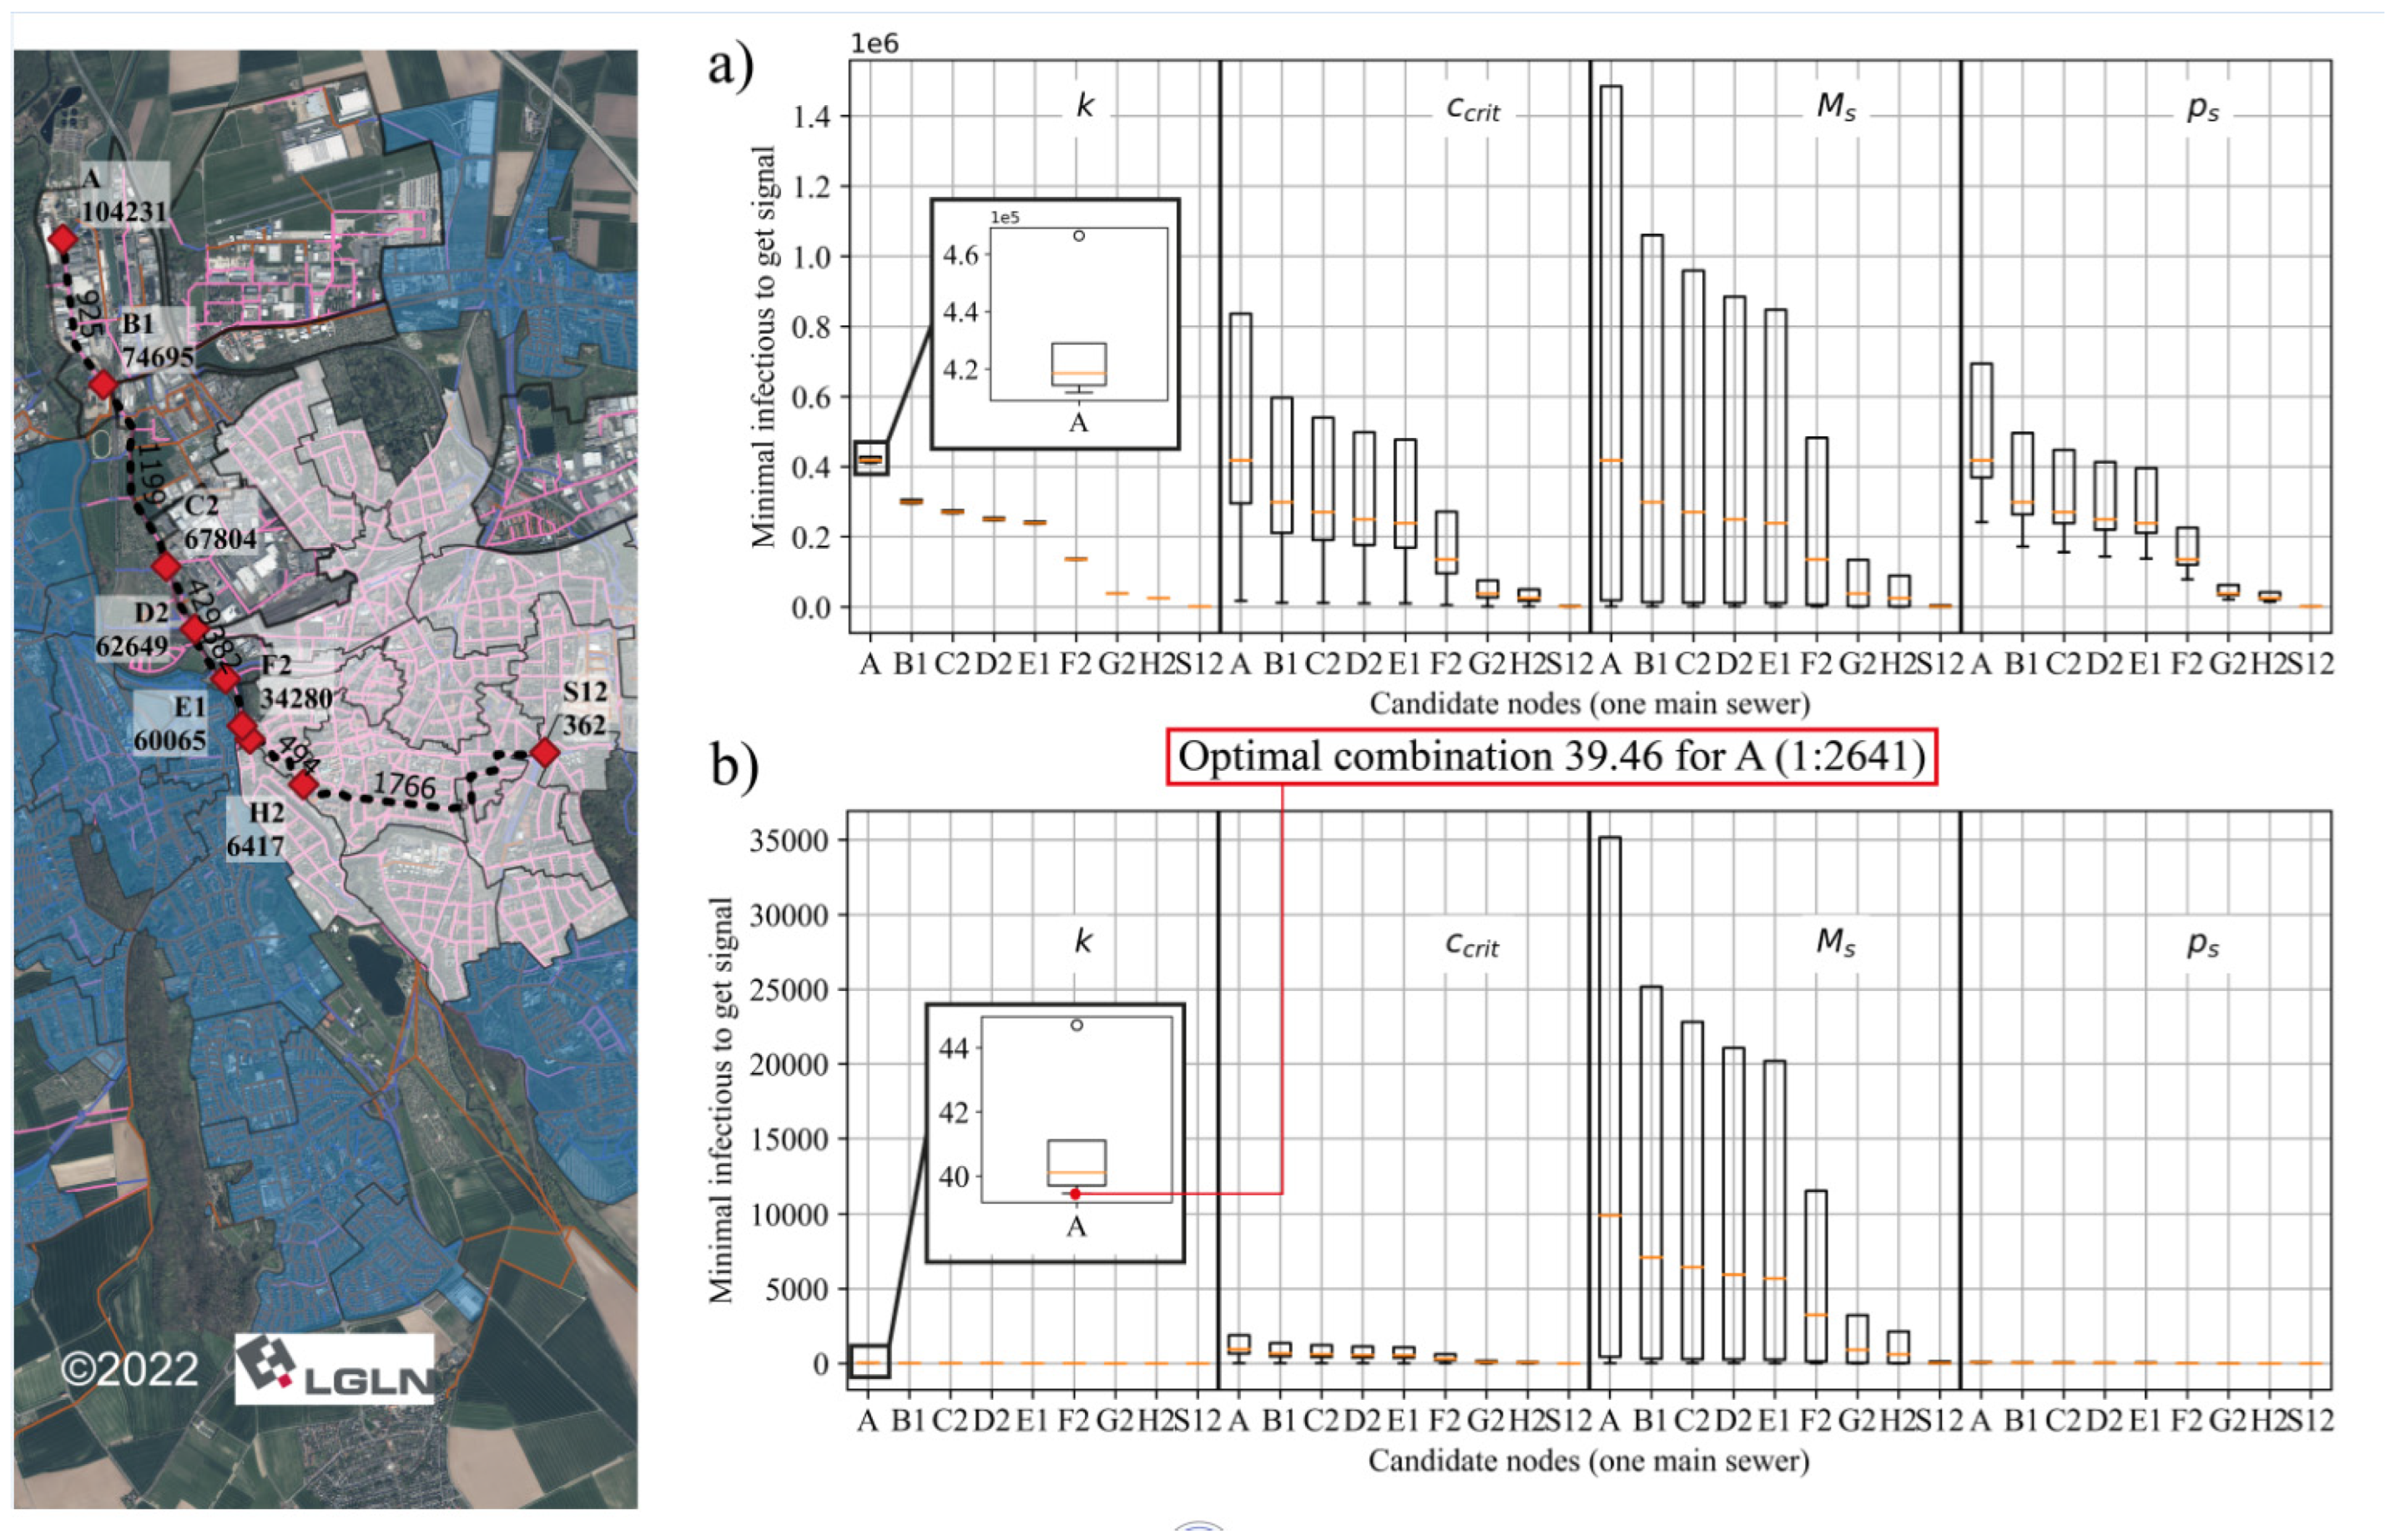
3.1. Determination of System Sensibility
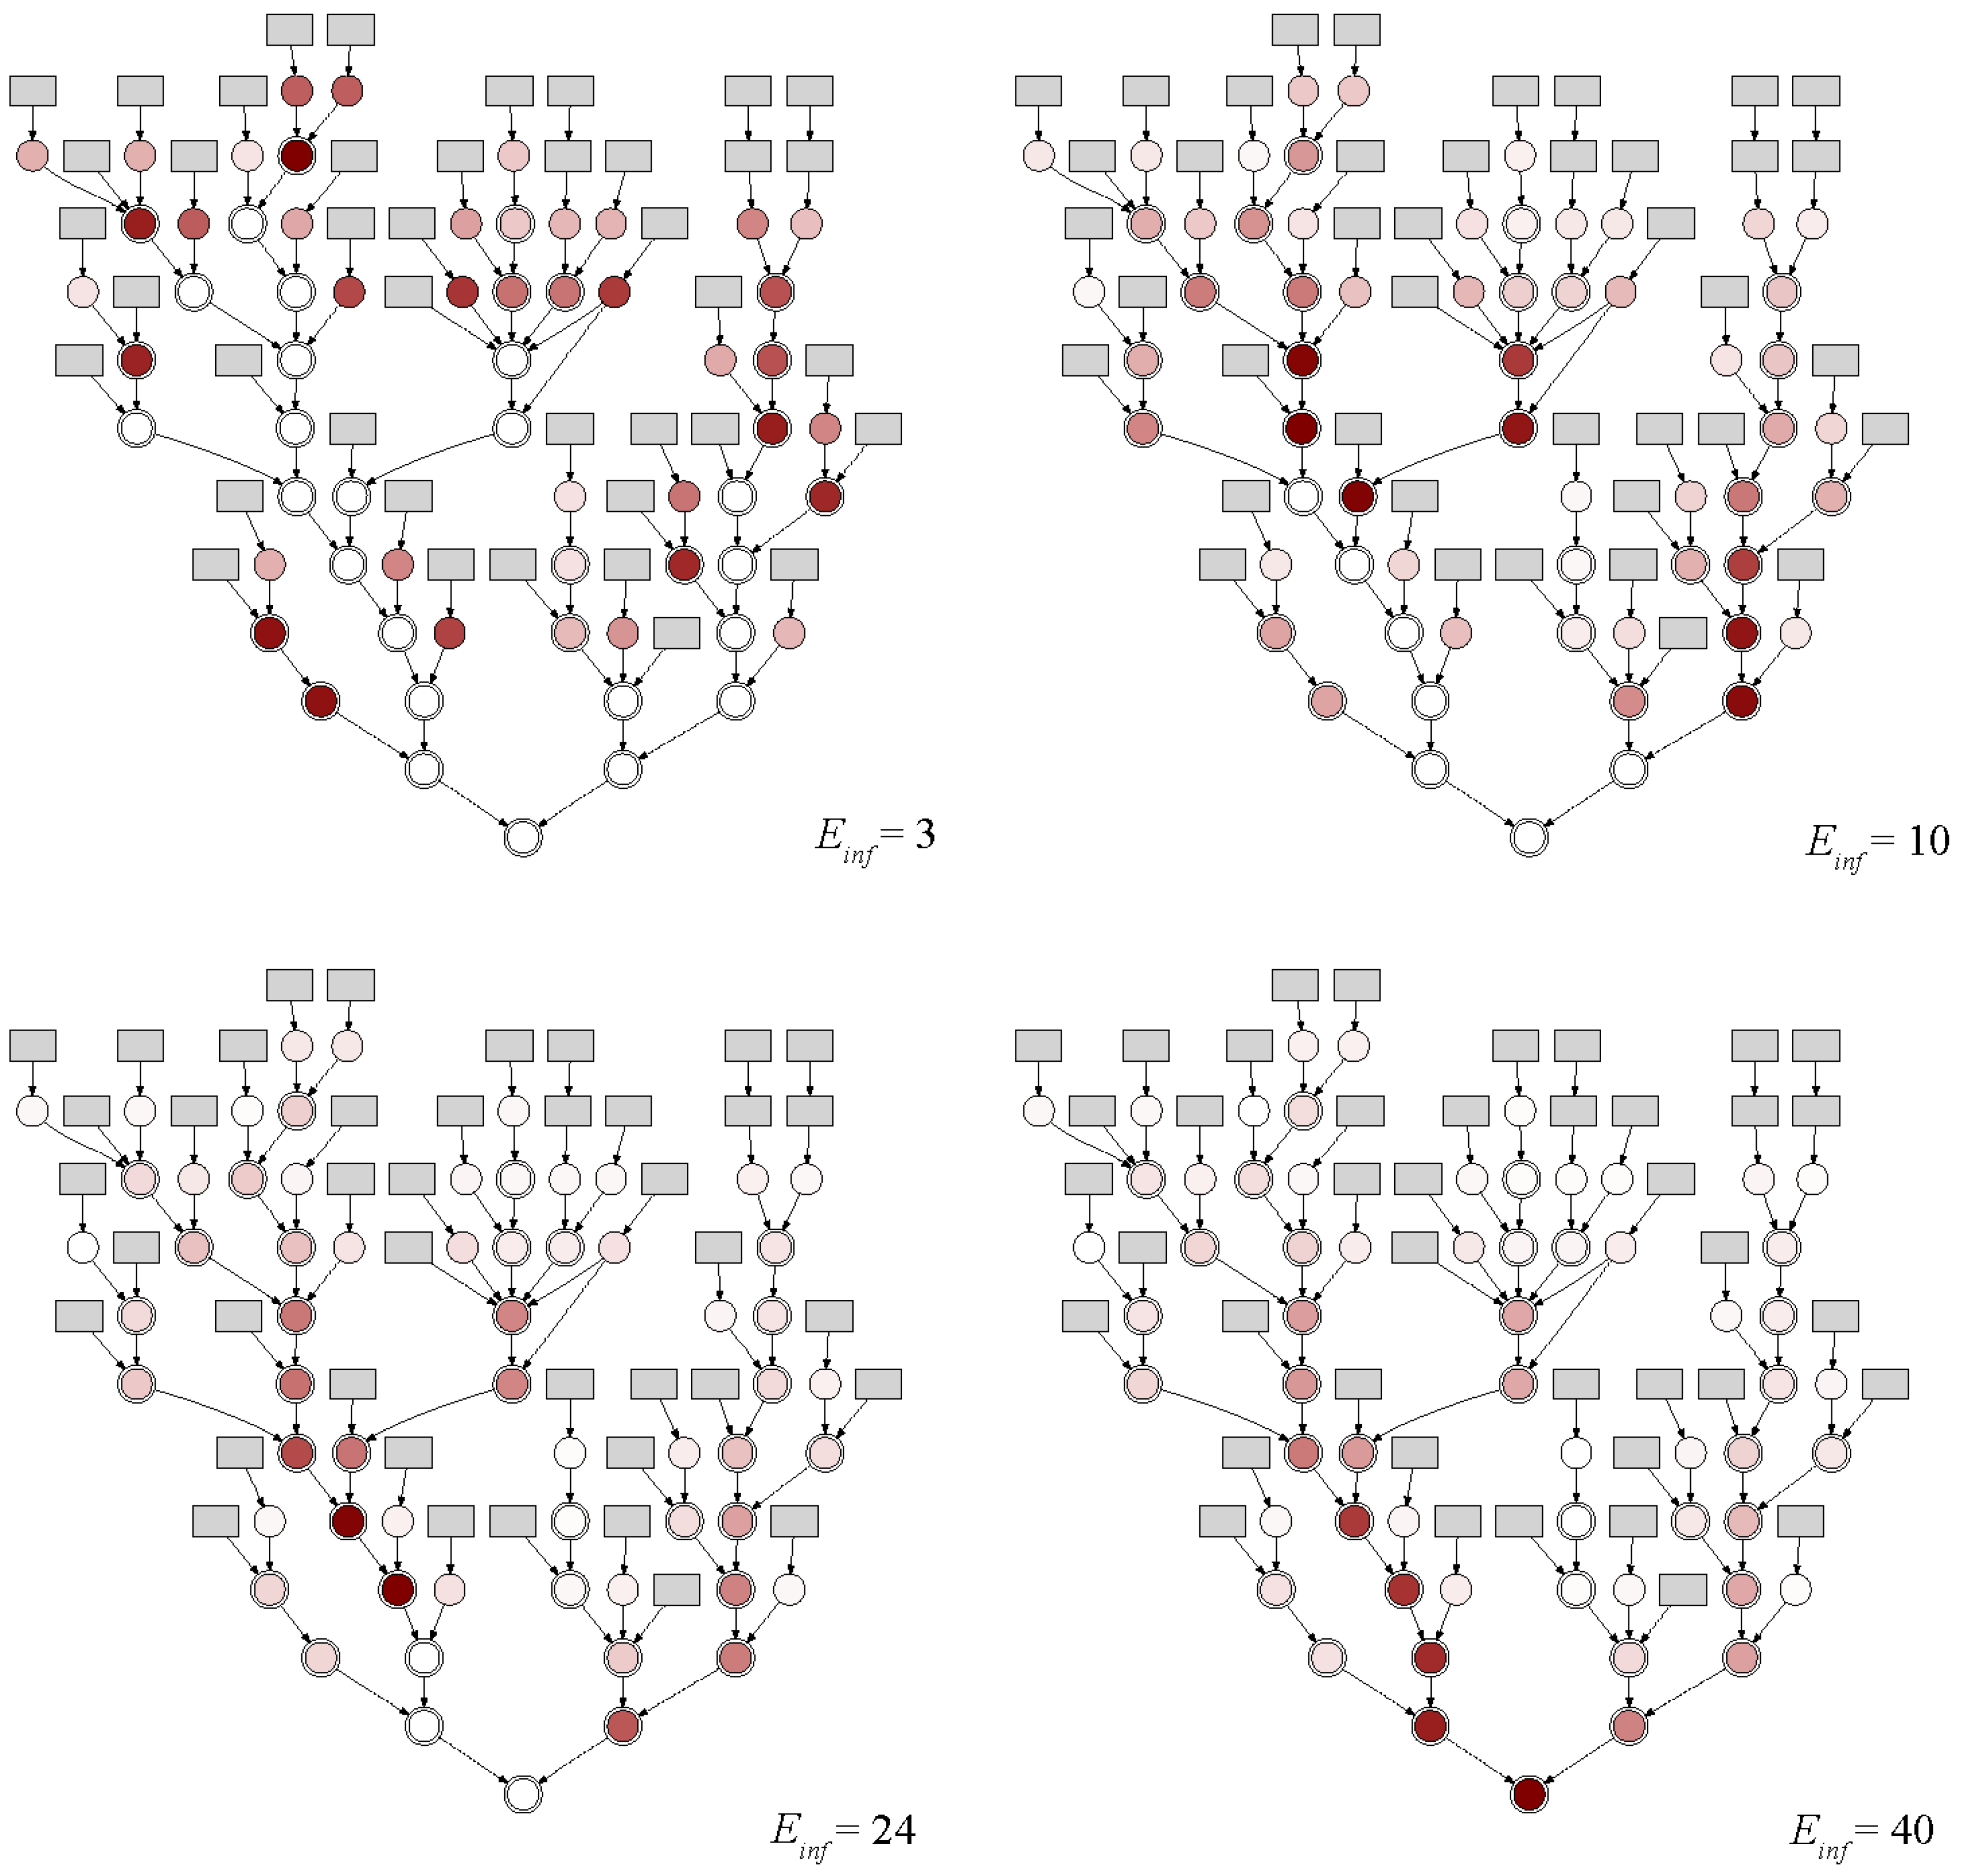
3.2. Optimization of Sampling Points
4. Conclusions
- Virus specific parameter values of SARS-CoV-2 from the literature are currently not sufficient for parametrizing our model.
- Number and locations for the sampling points depends on the expected sensitivity of the system.
- Increasing the number of sampling points does not necessarily improve the information content.
- Virus-related uncertainties have an impact on the placement and number of sampling points, but this impact is offset by the expected sensitivity.
- For the case study of Hildesheim, only 8 sampling points and less than 10 infected individuals per sub-catchment were required to identify potentially infected sub-catchments.
- The probability distribution function is simply based on the assumption that all infected people come from the same sub-catchment. For a better representation, epidemiological data could be used to estimate real infection distributions, as shown in Figure 5b.
- The flow time used to calculate the system sensitivity simply uses a constant. For further studies, 1D sewer models can be applied to better estimate the flow time and also simulate RNA loss, which is another limitation of the current approach.
Author Contributions
Funding
Institutional Review Board Statement
Informed Consent Statement
Data Availability Statement
Acknowledgments
Conflicts of Interest
Appendix A

| Parameter: Virus RNA Shedding Magnitude | ||
| copies/mL) | Literature | Comments |
| 2.9 | [31] | |
| 3.75 | [32] | Units adjusted |
| 4.55 | [16] | Units adjusted |
| 4.7 | [33] | |
| 5.8 | [32] | |
| 6.28 | [34] | Units adjusted |
| 7.1 | [31] | |
| Parameter: virus RNA Shedding probability | ||
| Values (%) | Literature | Comments |
| 10.1 | [35] | |
| 15.3 | [33] | |
| 29 | [36] | |
| 47.7 | [37] | |
| 48.1 | [33] | |
| 53.4 | [38] | |
| 54.5 | [16] | |
| 55 | [39] | |
| 83.3 | [32] | |
| Parameter: virus RNA decay in wastewater | ||
| Values (-) | Literature | Comments |
| 0.06 | [40] | |
| 0.084 | [41] | |
| 0.09 | [42] | |
| 0.183 | [43] | |
| 0.286 | [41] | |
| 0.67 | [42] | |
| Parameter: critical detection limit | ||
| Values (copies/mL) | Literature | Comments |
| 3.7 | [44] | |
| 9.2 | [44] | |
| 39.04 | [45] | |
| 59.4 | [45] | |
| 72.42 | [45] | |
| 78.96 | [45] | |
| 79.08 | [45] | |
| 98.42 | [45] | |
| 133.02 | [45] | |
| 159.08 | [45] | |
| 183.34 | [45] | |
| 301.22 | [45] | |
| 374.86 | [45] | |
| 533.78 | [45] | |
References
- Sims, N.; Kasprzyk-Hordern, B. Future perspectives of wastewater-based epidemiology: Monitoring infectious disease spread and resistance to the community level. Environ. Int. 2020, 139, 105689. [Google Scholar] [CrossRef] [PubMed]
- Wade, M.J.; Jacomo, A.L.; Armenise, E.; Brown, M.R.; Bunce, J.T.; Cameron, G.J.; Fang, Z.; Gilpin, D.F.; Graham, D.W.; Grimsley, J.M.; et al. Understanding and managing uncertainty and variability for wastewater monitoring beyond the pandemic: Lessons learned from the United Kingdom national COVID-19 surveillance programmes. J. Hazard. Mater. 2022, 424, 127456. [Google Scholar] [CrossRef] [PubMed]
- Mao, K.; Zhang, K.; Du, W.; Ali, W.; Feng, X.; Zhang, H. The potential of wastewater-based epidemiology as surveillance and early warning of infectious disease outbreaks. Curr. Opin. Environ. Sci. Health 2020, 17, 1–7. [Google Scholar] [CrossRef] [PubMed]
- Amoah, I.D.; Kumari, S.; Bux, F. Coronaviruses in wastewater processes: Source, fate and potential risks. Environ. Int. 2020, 143, 105962. [Google Scholar] [CrossRef] [PubMed]
- Praus, P. Information Entropy for Evaluation of Wastewater Composition. Water 2020, 12, 1095. [Google Scholar] [CrossRef]
- Saguti, F.; Magnil, E.; Enache, L.; Churqui, M.P.; Johansson, A.; Lumley, D.; Davidsson, F.; Dotevall, L.; Mattsson, A.; Trybala, E.; et al. Surveillance of wastewater revealed peaks of SARS-CoV-2 preceding those of hospitalized patients with COVID-19. Water Res. 2021, 189, 116620. [Google Scholar] [CrossRef] [PubMed]
- Prado, T.; Fumian, T.M.; Mannarino, C.F.; Resende, P.C.; Motta, F.C.; Eppinghaus, A.L.F.; do Vale, V.H.C.; Braz, R.M.S.; de Andrade, J.D.S.R.; Maranhão, A.G.; et al. Wastewater-based epidemiology as a useful tool to track SARS-CoV-2 and support public health policies at municipal level in Brazil. Water Res. 2021, 191, 116810. [Google Scholar] [CrossRef] [PubMed]
- Albastaki, A.; Naji, M.; Lootah, R.; Almeheiri, R.; Almulla, H.; Almarri, I.; Alreyami, A.; Aden, A.; Alghafri, R. First confirmed detection of SARS-CoV-2 in untreated municipal and aircraft wastewater in Dubai, UAE: The use of wastewater based epidemiology as an early warning tool to monitor the prevalence of COVID-19. Sci. Total Environ. 2021, 760, 143350. [Google Scholar] [CrossRef]
- Yaniv, K.; Shagan, M.; Lewis, Y.E.; Kramarsky-Winter, E.; Weil, M.; Indenbaum, V.; Elul, M.; Erster, O.; Brown, A.S.; Mendelson, E.; et al. City-level SARS-CoV-2 sewage surveillance. Chemosphere 2021, 283, 131194. [Google Scholar] [CrossRef]
- Larson, E.R.; Graham, B.M.; Achury, R.; Coon, J.J.; Daniels, M.K.; Gambrell, D.K.; Jonasen, K.L.; King, G.D.; LaRacuente, N.; Perrin-Stowe, T.I.; et al. From eDNA to citizen science: Emerging tools for the early detection of invasive species. Front. Ecol. Environ. 2020, 18, 194–202. [Google Scholar] [CrossRef]
- Calle, E.; Martínez, D.; Brugués-i-Pujolràs, R.; Farreras, M.; Saló-Grau, J.; Pueyo-Ros, J.; Corominas, L. Optimal selection of monitoring sites in cities for SARS-CoV-2 surveillance in sewage networks. Environ. Int. 2021, 157, 106768. [Google Scholar] [CrossRef] [PubMed]
- Larson, R.C.; Berman, O.; Nourinejad, M. Sampling manholes to home in on SARS-CoV-2 infections. PLoS ONE 2020, 15, e0240007. [Google Scholar] [CrossRef] [PubMed]
- Domokos, E.; Sebestyén, V.; Somogyi, V.; Trájer, A.J.; Gerencsér-Berta, R.; Horváth, B.O.; Tóth, E.G.; Jakab, F.; Kemenesi, G.; Abonyi, J. Identification of sampling points for the detection of SARS-CoV-2 in the sewage system. Sustain. Cities Soc. 2022, 76, 103422. [Google Scholar] [CrossRef] [PubMed]
- Gkatzioura, A.; Zafeirakou, A. Optimal Selection of Sampling Points for Detecting SARS-CoV-2 RNA in Sewer System Using NSGA-II Algorithm. Water 2023, 15, 4076. [Google Scholar] [CrossRef]
- Steinnocher, K.; Younsoo, K.; Köstl, M. Schätzung der Lokalen Bevölkerungsdichte in Stadtgebieten. Eine Fallstudie aus Daejon, Korea; AGIT 2006 Angewandte Geographische Informationsverarbeitung; Wichmann Verlag: Heidelberg, Germany, 2006; pp. 633–638. [Google Scholar]
- Li, X.; Zhang, S.; Shi, J.; Luby, S.P.; Jiang, G. Uncertainties in estimating SARS-CoV-2 prevalence by wastewater-based epidemiology. Chem. Eng. J. 2021, 415, 129039. [Google Scholar] [CrossRef] [PubMed]
- Crank, K.; Chen, W.; Bivins, A.; Lowry, S.; Bibby, K. Contribution of SARS-CoV-2 RNA shedding routes to RNA loads in wastewater. Sci. Total Environ. 2022, 806, 150376. [Google Scholar] [CrossRef] [PubMed]
- Rose, C.; Parker, A.; Jefferson, B.; Cartmell, E. The Characterization of Feces and Urine: A Review of the Literature to Inform Advanced Treatment Technology. Crit. Rev. Environ. Sci. Technol. 2015, 45, 1827–1879. [Google Scholar] [CrossRef]
- Brown, D.M.; Butler, D.; Orman, N.R.; Davies, J.W. Gross solids transport in small diameter sewers. Water Sci. Technol. 1996, 33, 25–30. [Google Scholar] [CrossRef]
- Statistisches Bundesamt (Destatis). Datenreport 2021: Ein Sozialbericht für die Bundesrepublik Deutschland; Bundeszentrale für Politische Bildung: Bonn, Germany, 2021. [Google Scholar]
- Alfonso, L.; Lobbrecht, A.; Price, R. Optimization of water level monitoring network in polder systems using information theory. Water Resour. Res. 2010, 46, W12553. [Google Scholar] [CrossRef]
- Amorocho, J.; Espildora, B. Entropy in the assessment of uncertainty in hydrologic systems and models. Water Resour. Res. 1973, 9, 1511–1522. [Google Scholar] [CrossRef]
- Shannon, C.E. A Mathematical Theory of Communication. Bell Syst. Tech. J. 1948, 27, 379–423. [Google Scholar] [CrossRef]
- Keum, J.; Kornelsen, K.; Leach, J.; Coulibaly, P. Entropy Applications to Water Monitoring Network Design: A Review. Entropy 2017, 19, 613. [Google Scholar] [CrossRef]
- Yoo, A.H.; Klyszejko, Z.; Curtis, C.E.; Ma, W.J. Strategic allocation of working memory resource. Sci. Rep. 2018, 8, 16162. [Google Scholar] [CrossRef] [PubMed]
- Keum, J.; Coulibaly, P. Information theory-based decision support system for integrated design of multivariable hydrometric networks. Water Resour. Res. 2017, 53, 6239–6259. [Google Scholar] [CrossRef]
- Alfonso, L.; Lobbrecht, A.; Price, R. Information theory-based approach for location of monitoring water level gauges in polders. Water Resour. Res. 2010, 46, W03528. [Google Scholar] [CrossRef]
- Alfonso, L.; He, L.; Lobbrecht, A.; Price, R. Information theory applied to evaluate the discharge monitoring network of the Magdalena River. J. Hydroinform. 2013, 15, 211–228. [Google Scholar] [CrossRef]
- Banik, A.; Brown, R.E.; Bamburg, J.; Lahiri, D.K.; Khurana, D.; Friedland, R.P.; Chen, W.; Ding, Y.; Mudher, A.; Padjen, A.L.; et al. Translation of Pre-Clinical Studies into Successful Clinical Trials for Alzheimer’s Disease: What Are the Roadblocks and How Can They Be Overcome? J. Alzheimer’s Dis. JAD 2015, 47, 815–843. [Google Scholar] [CrossRef]
- Li, C.; Singh, V.P.; Mishra, A.K. Entropy theory-based criterion for hydrometric network evaluation and design: Maximum information minimum redundancy. Water Resour. Res. 2012, 48, W05521. [Google Scholar] [CrossRef]
- Ng, K.; Poon, B.H.; Kiat Puar, T.H.; Shan Quah, J.L.; Loh, W.J.; Wong, Y.J.; Tan, T.Y.; Raghuram, J. COVID-19 and the Risk to Health Care Workers: A Case Report. Ann. Intern. Med. 2020, 172, 766–767. [Google Scholar] [CrossRef]
- Zhang, N.; Gong, Y.; Meng, F.; Bi, Y.; Yang, P.; Wang, F. Comparative study on virus shedding patterns in nasopharyngeal and fecal specimens of COVID-19 patients. Sci. China Life Sci. 2021, 64, 486–488. [Google Scholar] [CrossRef]
- Cheung, K.S.; Hung, I.F.; Chan, P.P.; Lung, K.C.; Tso, E.; Liu, R.; Ng, Y.Y.; Chu, M.Y.; Chung, T.W.; Tam, A.R.; et al. Gastrointestinal Manifestations of SARS-CoV-2 Infection and Virus Load in Fecal Samples from a Hong Kong Cohort: Systematic Review and Meta-analysis. Gastroenterology 2020, 159, 81–95. [Google Scholar] [CrossRef] [PubMed]
- Hoffmann, T.; Alsing, J. Faecal shedding models for SARS-CoV-2 RNA among hospitalised patients and implications for wastewater-based epidemiology. J. R. Stat. Soc. Ser. C Appl. Stat. 2023, 72, 330–345. [Google Scholar] [CrossRef]
- Kim, J.M.; Kim, H.M.; Lee, E.J.; Jo, H.J.; Yoon, Y.; Lee, N.J.; Son, J.; Lee, Y.J.; Kim, M.S.; Lee, Y.P.; et al. Detection and Isolation of SARS-CoV-2 in Serum, Urine, and Stool Specimens of COVID-19 Patients from the Republic of Korea. Osong Public Health Res. Perspect. 2020, 11, 112–117. [Google Scholar] [CrossRef] [PubMed]
- Wang, W.; Xu, Y.; Gao, R.; Lu, R.; Han, K.; Wu, G.; Tan, W. Detection of SARS-CoV-2 in Different Types of Clinical Specimens. JAMA 2020, 323, 1843–1844. [Google Scholar] [CrossRef] [PubMed]
- Lin, L.; Jiang, X.; Zhang, Z.; Huang, S.; Zhang, Z.; Fang, Z.; Gu, Z.; Gao, L.; Shi, H.; Mai, L.; et al. Gastrointestinal symptoms of 95 cases with SARS-CoV-2 infection. Gut 2020, 69, 997–1001. [Google Scholar] [CrossRef] [PubMed]
- Xiao, F.; Tang, M.; Zheng, X.; Liu, Y.; Li, X.; Shan, H. Evidence for Gastrointestinal Infection of SARS-CoV-2. Gastroenterology 2020, 158, 1831–1833. [Google Scholar] [CrossRef] [PubMed]
- Wu, Y.; Guo, C.; Tang, L.; Hong, Z.; Zhou, J.; Dong, X.; Yin, H.; Xiao, Q.; Tang, Y.; Qu, X.; et al. Prolonged presence of SARS-CoV-2 viral RNA in faecal samples. Lancet. Gastroenterol. Hepatol. 2020, 5, 434–435. [Google Scholar] [CrossRef] [PubMed]
- Hokajärvi, A.M.; Rytkönen, A.; Tiwari, A.; Kauppinen, A.; Oikarinen, S.; Lehto, K.M.; Kankaanpää, A.; Gunnar, T.; Al-Hello, H.; Blomqvist, S.; et al. The detection and stability of the SARS-CoV-2 RNA biomarkers in wastewater influent in Helsinki, Finland. Sci. Total Environ. 2021, 770, 145274. [Google Scholar] [CrossRef]
- Ahmed, W.; Bertsch, P.M.; Bibby, K.; Haramoto, E.; Hewitt, J.; Huygens, F.; Gyawali, P.; Korajkic, A.; Riddell, S.; Sherchan, S.P.; et al. Decay of SARS-CoV-2 and surrogate murine hepatitis virus RNA in untreated wastewater to inform application in wastewater-based epidemiology. Environ. Res. 2021, 770, 145274. [Google Scholar] [CrossRef]
- Bivins, A.; Greaves, J.; Fischer, R.; Yinda, K.C.; Ahmed, W.; Kitajima, M.; Munster, V.J.; Bibby, K. Persistence of SARS-CoV-2 in Water and Wastewater. Environ. Sci. Technol. Lett. 2020, 7, 937–942. [Google Scholar] [CrossRef]
- Mota, C.R.; Bressani-Ribeiro, T.; Araújo, J.C.; Leal, C.D.; Leroy-Freitas, D.; Machado, E.C.; Espinosa, M.F.; Fernandes, L.; Leão, T.L.; Chamhum-Silva, L.; et al. Assessing spatial distribution of COVID-19 prevalence in Brazil using decentralised sewage monitoring. Water Res. 2021, 202, 117388. [Google Scholar] [CrossRef] [PubMed]
- Gerrity, D.; Papp, K.; Stoker, M.; Sims, A.; Frehner, W. Early-pandemic wastewater surveillance of SARS-CoV-2 in Southern Nevada: Methodology, occurrence, and incidence/prevalence considerations. Water Res. X 2021, 10, 100086. [Google Scholar] [CrossRef] [PubMed]
- Ahmed, W.; Bivins, A.; Metcalfe, S.; Smith, W.J.; Verbyla, M.E.; Symonds, E.M.; Simpson, S.L. Evaluation of process limit of detection and quantification variation of SARS-CoV-2 RT-qPCR and RT-dPCR assays for wastewater surveillance. Water Res. 2022, 213, 118132. [Google Scholar] [CrossRef] [PubMed]


| Data Used | Data Source |
|---|---|
| Sewer network | Stadtentwässerung Hildesheim (SEHi) (2021) |
| Population statistics | Stadt Hildesheim (2022), https://www.stadt-hildesheim.de/rathaus-verwaltung/buerger-und-ratsinfo/stadtteile/ (accessed on 1 December 2022) |
| Land use map | Stadt Hildesheim (2015), https://www.stadt-hildesheim.de/wirtschaft-bauen/stadtplanung-und-stadtentwicklung/stadtentwicklung/flaechennutzungsplan/ (accessed on 1 December 2022) |
| Digital orthophoto (DOP) | Landesamt für Geoinformation und Landesvermessung Niedersachsen (LGLN) 2022, https://opengeodata.lgln.niedersachsen.de/#dop (accessed on 1 December 2022) |
| 3D building model | LGLN (2022), https://opengeodata.lgln.niedersachsen.de/#lod2 (accessed on 1 December 2022) |
| ALKIS-Dataset | LGLN (2021), provided by SEHi |
| Parameter | Value | Comments | Source |
|---|---|---|---|
| Feces production rate | 128 g/(person*day) | Wet mass | [18] |
| Feces density | 1.06 g/mL | [19] | |
| Average water consumption | 128 L/(person*day) | The value from 2019 | [20] |
| Factors | Labels | Unit | Min | 25% | 50% | 75% | Max |
|---|---|---|---|---|---|---|---|
| RNA shedding magnitude | /mL) | 2.90 | 4.15 | 4.70 | 6.04 | 7.10 | |
| RNA shedding probability | (%) | 10.1 | 29.0 | 48.1 | 54.5 | 83.3 | |
| RNA decay in wastewater | (/day) | 0.06 | 0.09 | 0.14 | 0.26 | 0.67 | |
| RNA critical detection limit | (copies/mL) | 3.70 | 62.66 | 88.75 | 177.28 | 533.78 |
| Probability | ||||||||||||
|---|---|---|---|---|---|---|---|---|---|---|---|---|
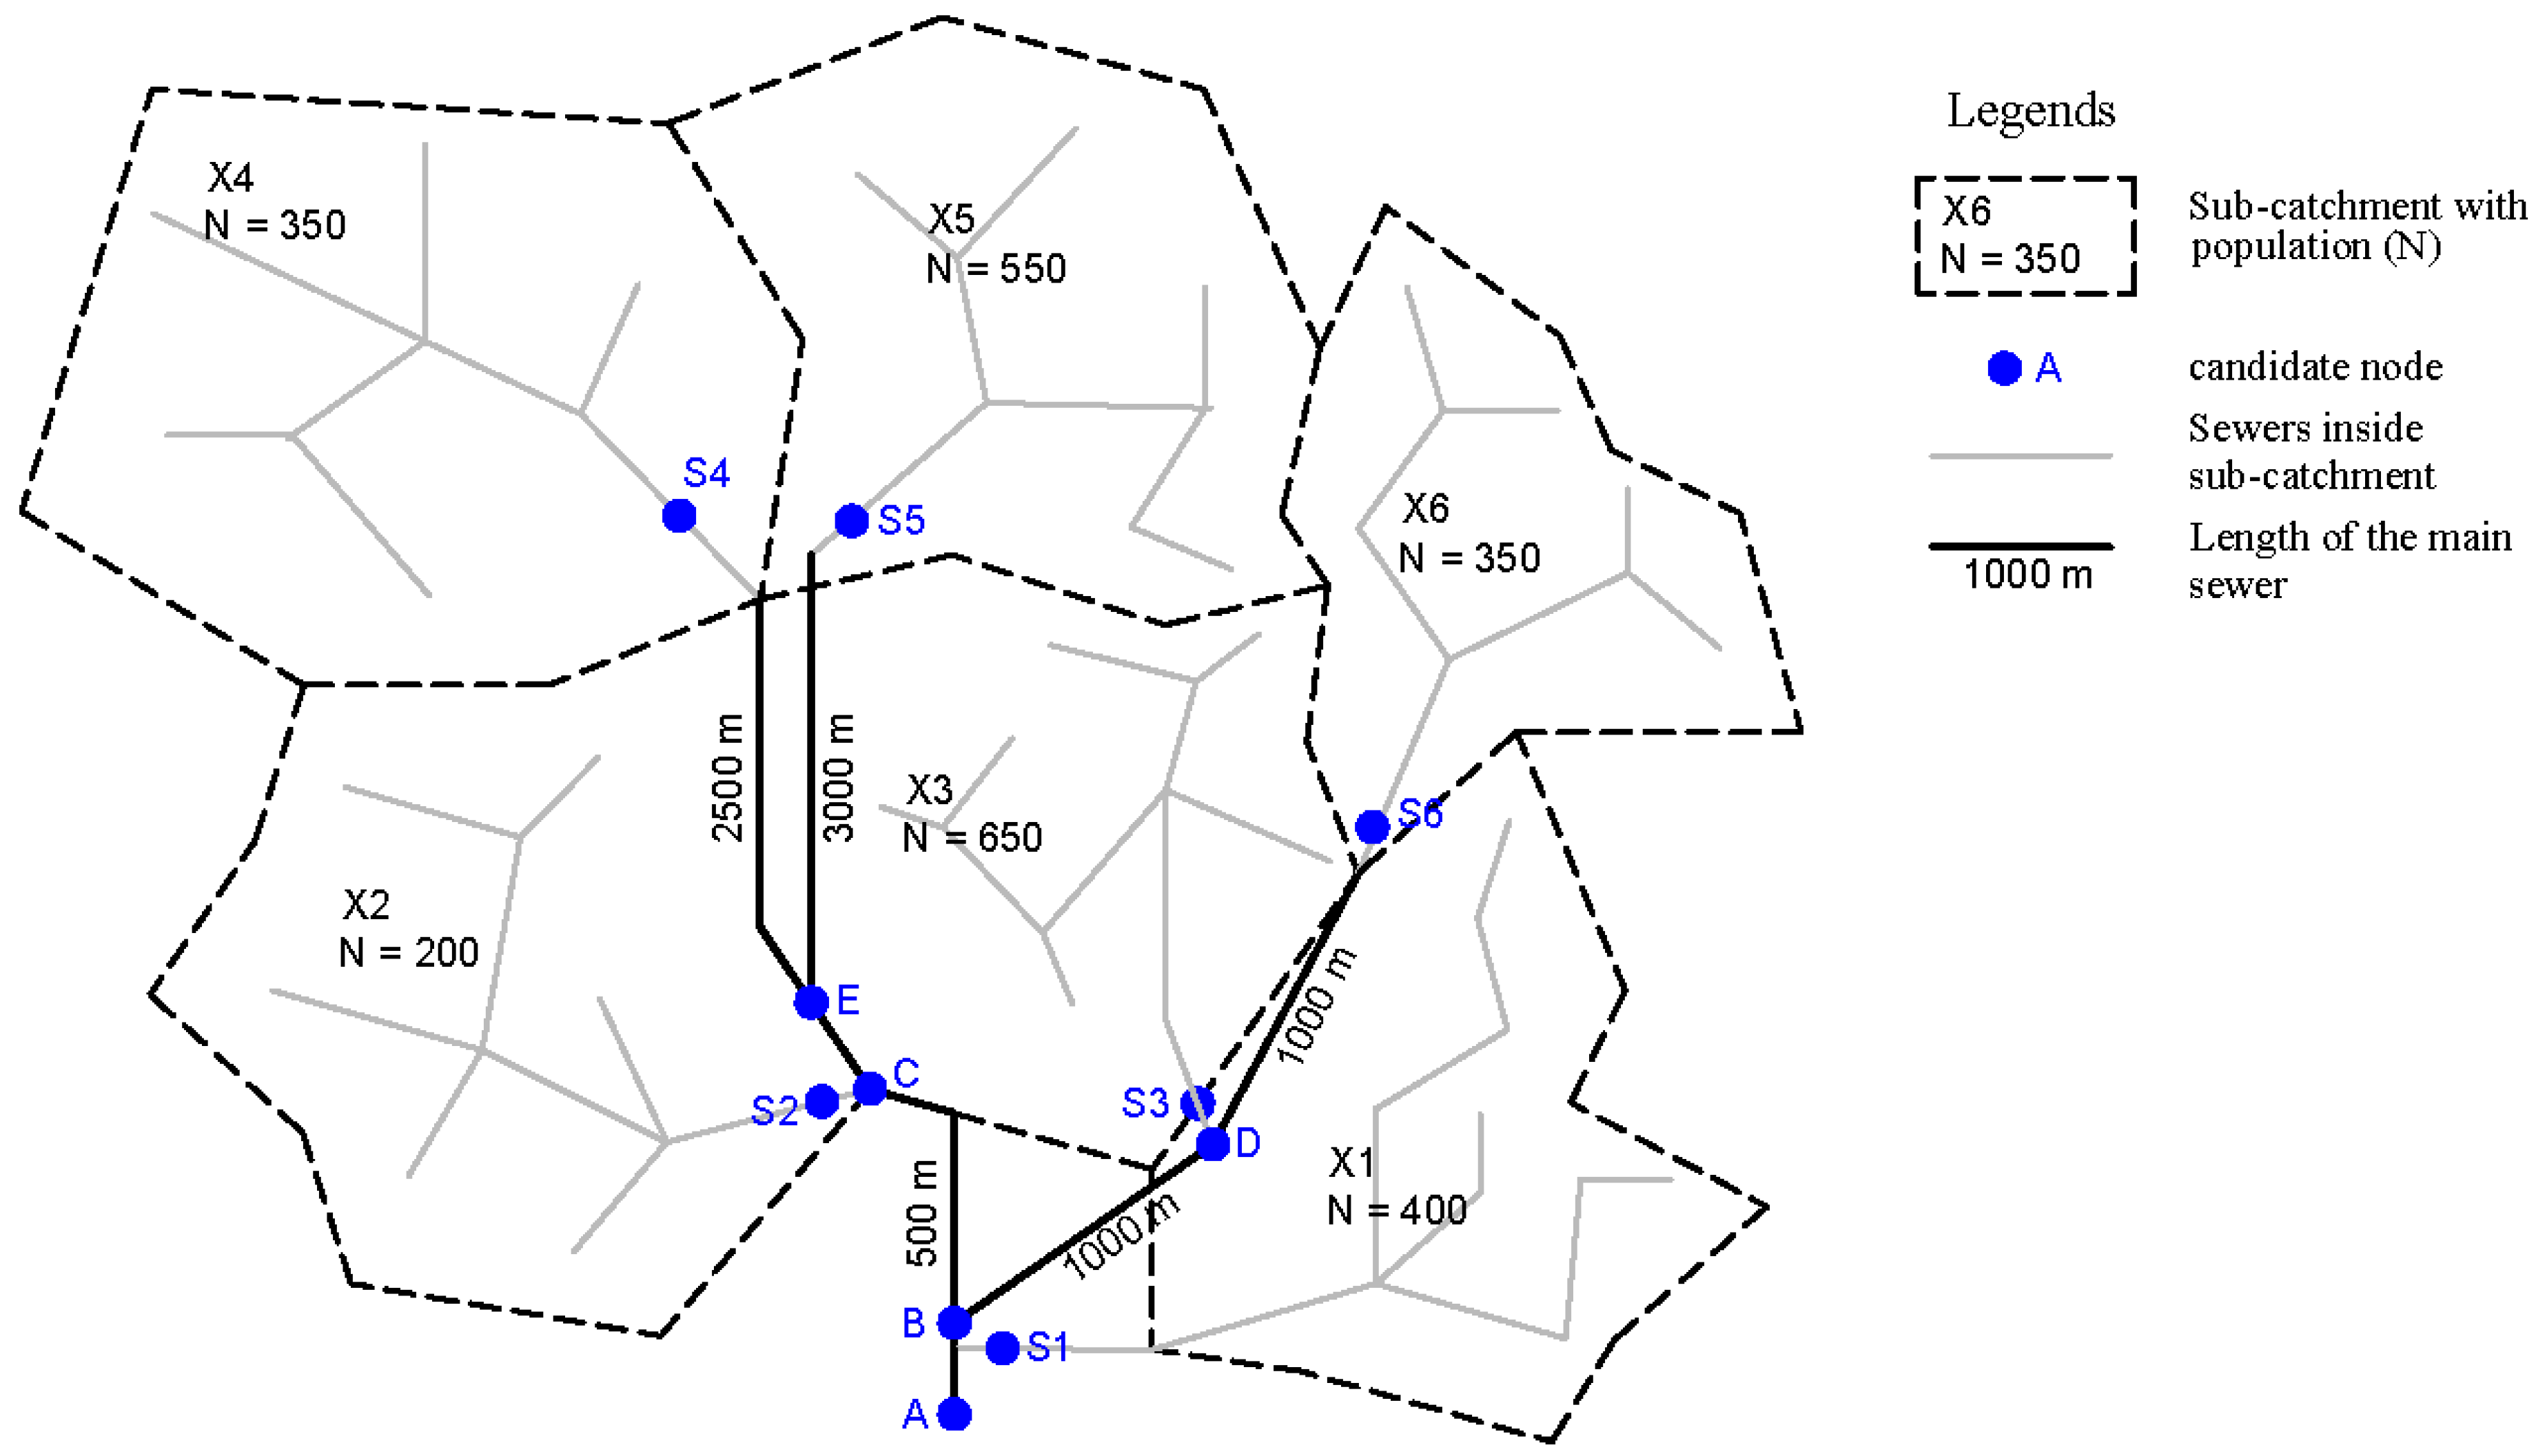
| A | B | C | D | E | S1 | S2 | S3 | S4 | S5 | S6 | ||
| X1 | − | − | − | − | − | + | − | − | − | − | − | 0.16 |
| X2 | − | + | + | − | − | − | + | − | − | − | − | 0.08 |
| X3 | − | + | − | + | − | − | − | + | − | − | − | 0.26 |
| X4 | − | + | + | − | + | − | − | − | + | − | − | 0.14 |
| X5 | − | + | + | − | + | − | − | − | − | + | − | 0.22 |
| X6 | − | + | − | + | − | − | − | − | − | − | + | 0.14 |
| (-) | (-) | (bits) | (%) | (-) | (%) |
| 1 | 17 | 1.86 | 37.4 | 26,000 | 24.9 |
| 2 | 20 | 3.55 | 71.3 | 58,046 | 55.7 |
| 3 | 20 | 4.43 | 89.1 | 80,925 | 77.6 |
| 4 | 16 | 4.85 | 97.4 | 94,018 | 90.2 |
| 6 | 15 | 4.85 | 97.4 | 94,018 | 90.2 |
| 8 | 11 | 4.95 | 99.4 | 99,834 | 95.8 |
| 9 | 8 | 4.95 | 99.4 | 99,834 | 95.8 |
| 10 | 7 (8) | 4.98 | 100.0 | 99,076 (104,231) | 95.1 (100.0) |
| 12 | 6 (7) | 4.98 | 100.0 | 99,076 (104,231) | 95.1 (100.0) |
| 13 | 5 (6) | 4.98 | 100.0 | 99,076 (104,231) | 95.1 (100.0) |
| 23 | 4 (5) | 4.98 | 100.0 | 99,076 (104,231) | 95.1 (100.0) |
| 24 | 3 (4) | 4.98 | 100.0 | 99,076 (104,231) | 95.1 (100.0) |
| 26 | 3 (4) | 4.98 | 100.0 | 98,750 (104,231) | 94.7 (100.0) |
| 29 | 2 | 4.98 | 100.0 | 104,231 | 100.0 |
| 40 | 1 | 4.98 | 100.0 | 104,231 | 100.0 |
| 1 | G3 | 1.51 | 0.00 | 1.21 | 24,623 |
| 2 | F1 | 2.88 | 0.11 | 2.28 | 25,785 |
| 3 | C3 | 4.02 | 0.34 | 3.15 | 21,192 |
| 4 | G2 | 4.40 | 0.51 | 3.42 | 9657 |
| 5 | C4 | 4.72 | 0.71 | 3.64 | 8344 |
| 6 | C1 | 4.91 | 0.92 | 3.74 | 6891 |
| 7 | S23 | 4.98 | 1.02 | 3.78 | 2584 |
| 8 | S24 | 4.98 | - | - | 5155 |
Disclaimer/Publisher’s Note: The statements, opinions and data contained in all publications are solely those of the individual author(s) and contributor(s) and not of MDPI and/or the editor(s). MDPI and/or the editor(s) disclaim responsibility for any injury to people or property resulting from any ideas, methods, instructions or products referred to in the content. |
© 2024 by the authors. Licensee MDPI, Basel, Switzerland. This article is an open access article distributed under the terms and conditions of the Creative Commons Attribution (CC BY) license (https://creativecommons.org/licenses/by/4.0/).
Share and Cite
Yao, Y.; Zhu, Y.; Nogueira, R.; Klawonn, F.; Wallner, M. Optimal Selection of Sampling Points within Sewer Networks for Wastewater-Based Epidemiology Applications. Methods Protoc. 2024, 7, 6. https://doi.org/10.3390/mps7010006
Yao Y, Zhu Y, Nogueira R, Klawonn F, Wallner M. Optimal Selection of Sampling Points within Sewer Networks for Wastewater-Based Epidemiology Applications. Methods and Protocols. 2024; 7(1):6. https://doi.org/10.3390/mps7010006
Chicago/Turabian StyleYao, Yao, Yibo Zhu, Regina Nogueira, Frank Klawonn, and Markus Wallner. 2024. "Optimal Selection of Sampling Points within Sewer Networks for Wastewater-Based Epidemiology Applications" Methods and Protocols 7, no. 1: 6. https://doi.org/10.3390/mps7010006
APA StyleYao, Y., Zhu, Y., Nogueira, R., Klawonn, F., & Wallner, M. (2024). Optimal Selection of Sampling Points within Sewer Networks for Wastewater-Based Epidemiology Applications. Methods and Protocols, 7(1), 6. https://doi.org/10.3390/mps7010006