
Laser Microdissection-Mediated Isolation of Butterfly Wing Tissue for Spatial Transcriptomics


Abstract
:1. Introduction
2. Experimental Design
3. Required Materials and Equipment
3.1. Materials
- Microcentrifuge tubes 1.5 mL (Eppendorf, Hamburg, Germany; Cat. No. T9661-500EA)
- PCR tubes 200 µL (Axygen, Union City, AZ, USA; Cat. No. 14-222-262)
- PEN membrane slides (PEN Membrane Glass Slides; Thermo Fisher Scientific, Waltham, MA, USA; Cat No. LCM0522)
- Fine straight tweezers (Dumont, Montignez, Switzerland; Cat. No. 11254-20)
- Stainless steel beads, 0.5 mm (Next Advance, Troy, NY, USA; Cat. No. SKU: SSB05)
- Filter Pipette tips (Axygen 200 µL and 1000 µL Universal Fit Filter Tips; Corning, AZ, USA; Cat. No. TF-200-R-S, TF-1000-R-S)
- Ice bucket with closed lid (Coleman; 5L)
- Flat spatula (Thomas Scientific; Thomas Scientific, Swedesboro, NJ, USA; Cat. No. 1208Y75)
- Zirconium beads, 0.1 mm (BioSpec; Bartlesville, OK, USA, Cat. No. 11079101z)
- LCM Adhesive Cap 500 (Zeiss, Oberkochen, Germany; Cat. No. 415190-9201-000)
3.2. Reagents for Fixation and Staining the Wing Tissue
- Histogene staining solution (Thermo Fisher Scientific, Waltham, MA, USA; Cat. No. KIT0415)
- Ethanol (Sigma Aldrich (Merck), Burlington, MA, USA; Cat. No. E7023-1L)
- Acetone (Sigma Aldrich (Merck), Burlington, MA, USA; Cat. No. 179124-1L)
- RNaseZap RNase Decontamination Solution (Thermo Fisher Scientific, Waltham, MA, USA; Cat. No. AM9780)
- UltraPure DNase/RNase-Free Distilled Water (Thermo Fisher Scientific, Waltham, MA, USA; Cat. No. 10977015)
- Proteinase K (NEB, Ipswich, NY, USA; Cat. No. P8107S)
3.3. Reagents for RNA Isolation and Verification of RNA Integrity
- Qiagen RNA isolation kit (RNeasy Plus Mini Kit (250); Qiagen, Hilden, Germany.; Cat. No. 74136)
- Agarose molecular grade (Vivantis; Cat. No. PC0701-500g)
- Trizma base (Sigma-Aldrich (Merck), Burlington, MA, USA; Cat. No. T1503-500G)
- EDTA (Thermo Fisher Scientific, MA, USA; Cat. No. 17892)
- Sodium Dodecyl Sulfate (SDS; Sigma-Aldrich (Merck), Burlington, MA, USA; Cat. No. 151-21-3)
- SYBRSafe (Invitrogen, Carlsbad, CA, USA; Cat. No. S33102)
- DNA ladder (ExactMark 100bp DNA Ladder; Axil Scientific, Singapore; Cat. No. BIO-5130-100ug)
- RNA Gel Loading Dye (Thermo Fisher Scientific, Waltham, MA, USA; Cat. No. R0641)
3.4. Equipment
- Zeiss Stemi 305 stereo microscope (Zeiss, Oberkochen, Germany)
- Zeiss laser microdissection microscope (Zeiss PALM microbeam-Laser microdissection; Zeiss, Oberkochen, Germany)
- Gel electrophoresis system (Bio-Rad, Hercules, CA, USA)
- Gel documentation system (Azure 200 Gel Imaging Workstation; Azure Biosystems, Dublin, CA, USA)
- Nanodrop ND-1000 Spectrophotometer (Nanodrop ND-1000; Thermo Fisher Scientific, Waltham, MA, USA)
- Homogenizer (Next Advance Bullet Blender; Next Advance, Troy, NY, USA)
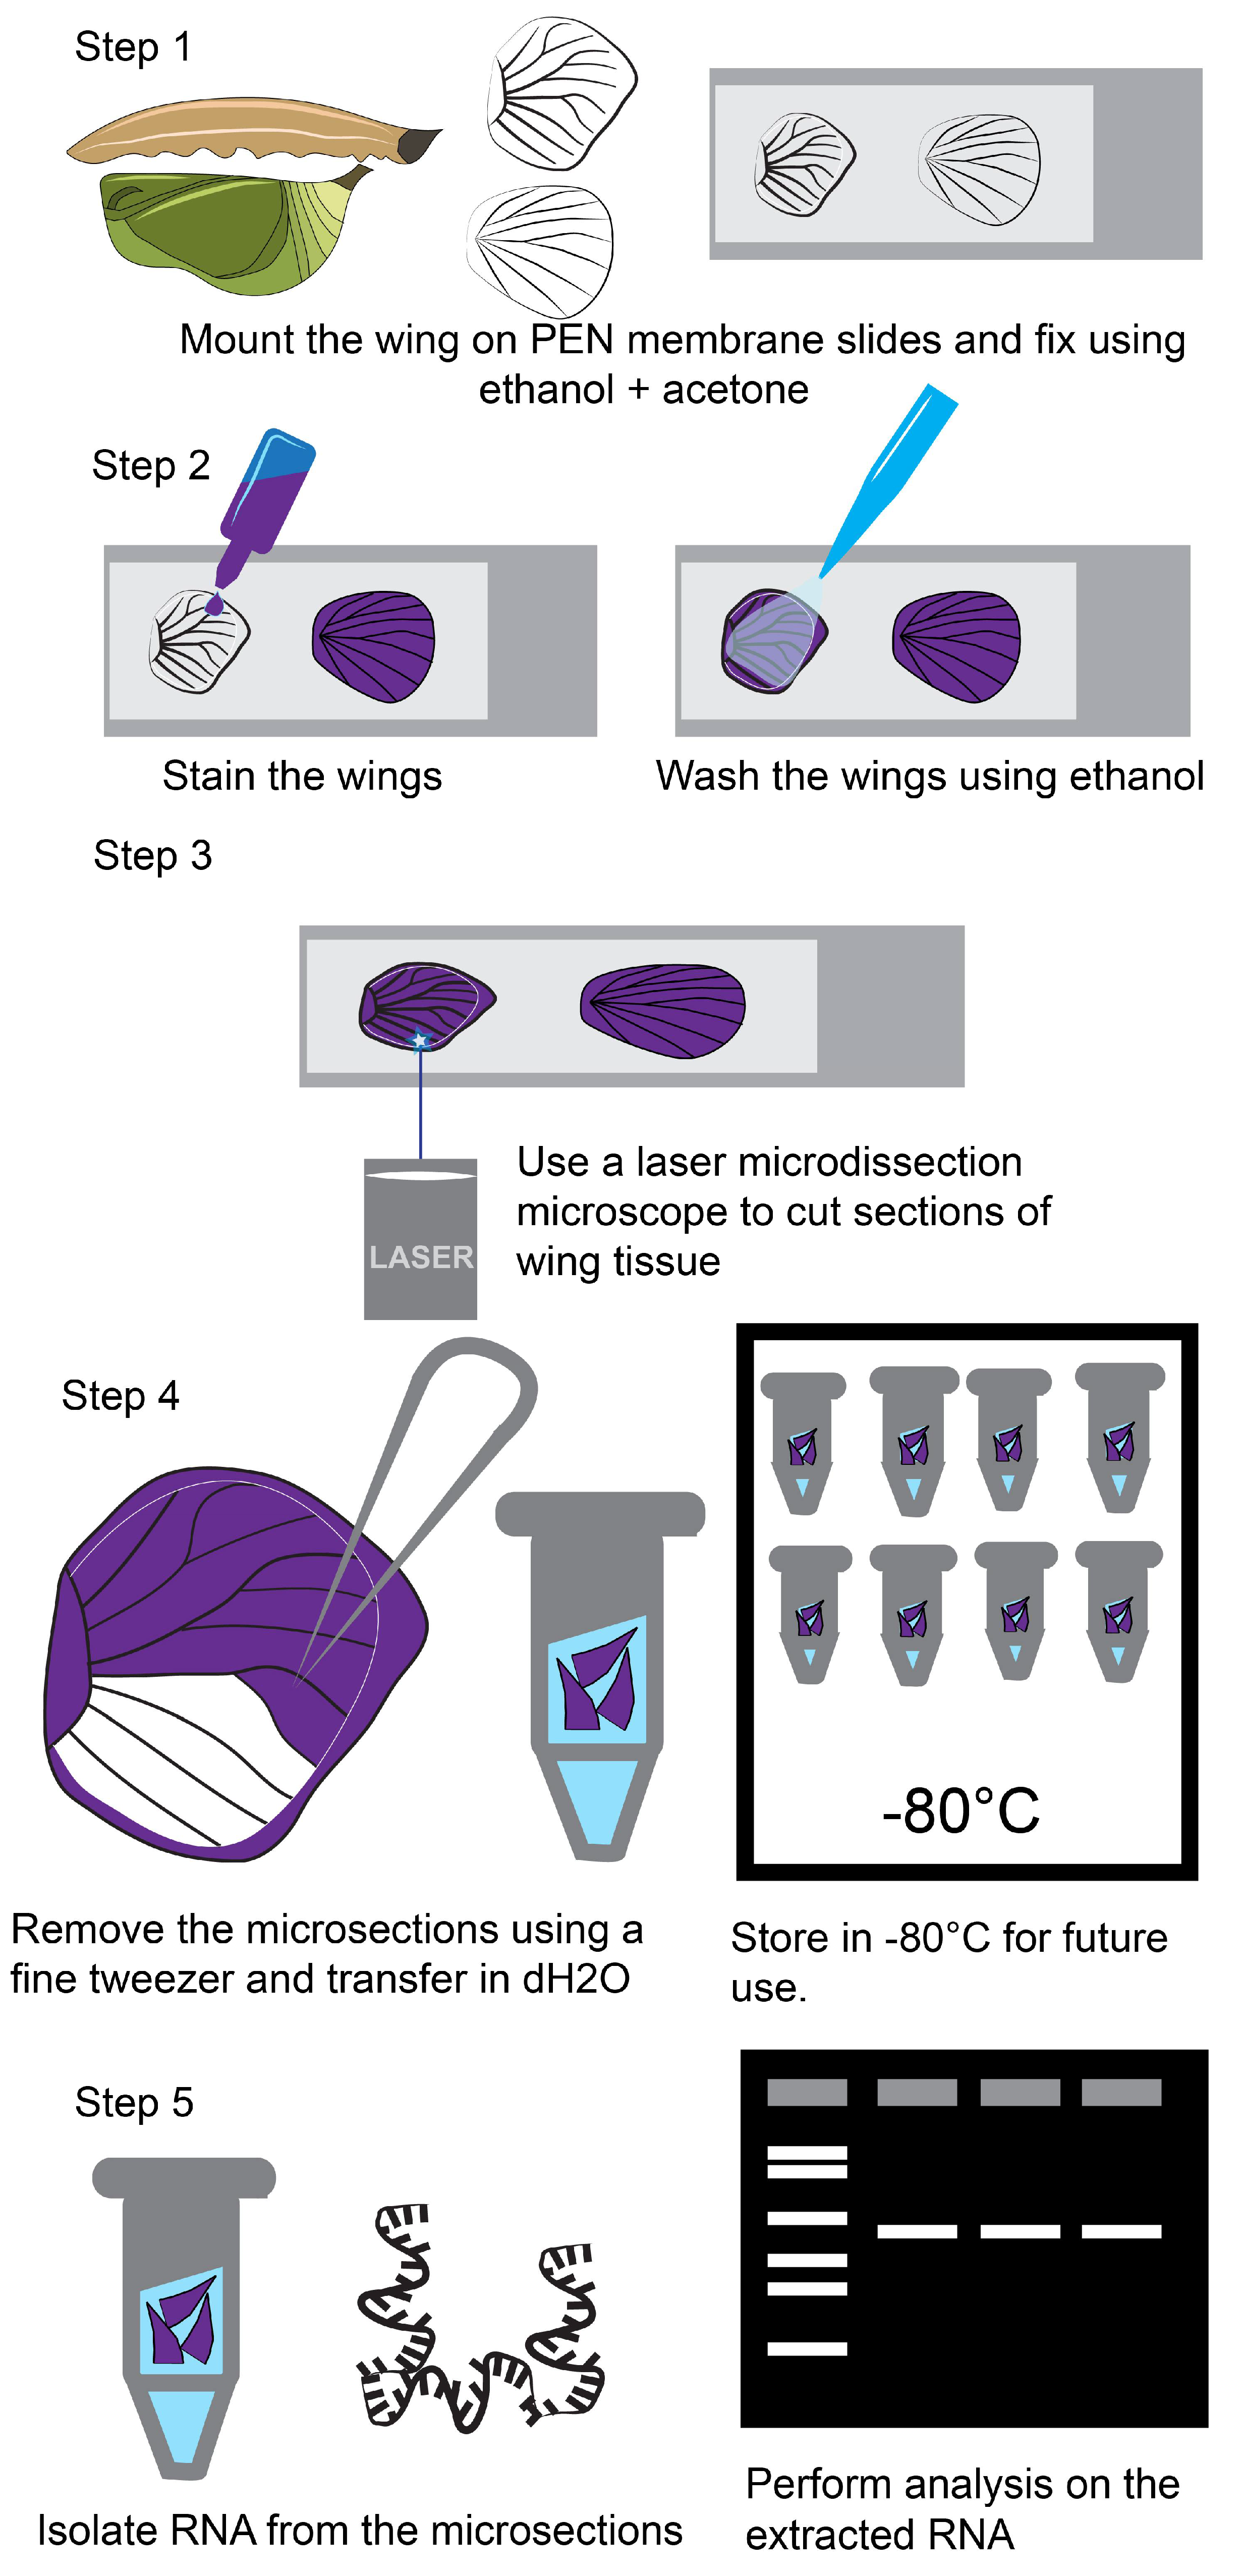
4. Procedure
4.1. Fixation of Wing Tissue Using Ethanol and Acetone on a PEN Membrane Slide
- Dissect the butterfly larval and pupal wings based on the protocol described in [35] and transfer wings into a 1.5 mL microcentrifuge tube with 1X PBS.
- Dehydrate the wings by adding a gradual concentration of 50, 75, and 100% ice-chilled alcohol mixed with PBS. Alternatively, dissected wings can be transferred to a PEN membrane slide and dehydrated on the slide by adding a gradual concentration of 50, 75, and 100% ice-chilled alcohol.
-
![Mps 05 00067 i001]()
- PAUSE STEP Dehydrated wings can be stored at −80 °C for up to 6 months.

- 3.
- After dehydration, move the wings to a PEN membrane slide. For the larval wings, use a 1000 µL pipette to transfer the wings and for the pupal wings use a flat spatula. The wings once dry will stick to the membrane of the slide.
- 4.
- Fix the wings twice with 100% ice-chilled acetone using a 1000 µL pipette.
-
![Mps 05 00067 i002]()
- CRITICAL STEP Keep the PEN membrane slide in an ice box as much as possible to avoid RNA degradation.

4.2. Staining of Wing Tissue
- After wing fixation use Histogene staining solution to stain the wings. Gently add a few drops of the staining solution on top of the wings and leave for 10–40 s, until a purple color is seen on the wing.
- Wash the wings with 100% EtOH using a 1000 µl pipette three times and let the wings dry on the slide.
- Move the slide to a 50 mL falcon tube.
-
![Mps 05 00067 i001]()
- PAUSE STEP Wings can be stored inside the falcon tube for over 6 months in a −80 °C freezer.
4.3. Dissection of the Wing Tissue Using a Laser Microdissection Microscope
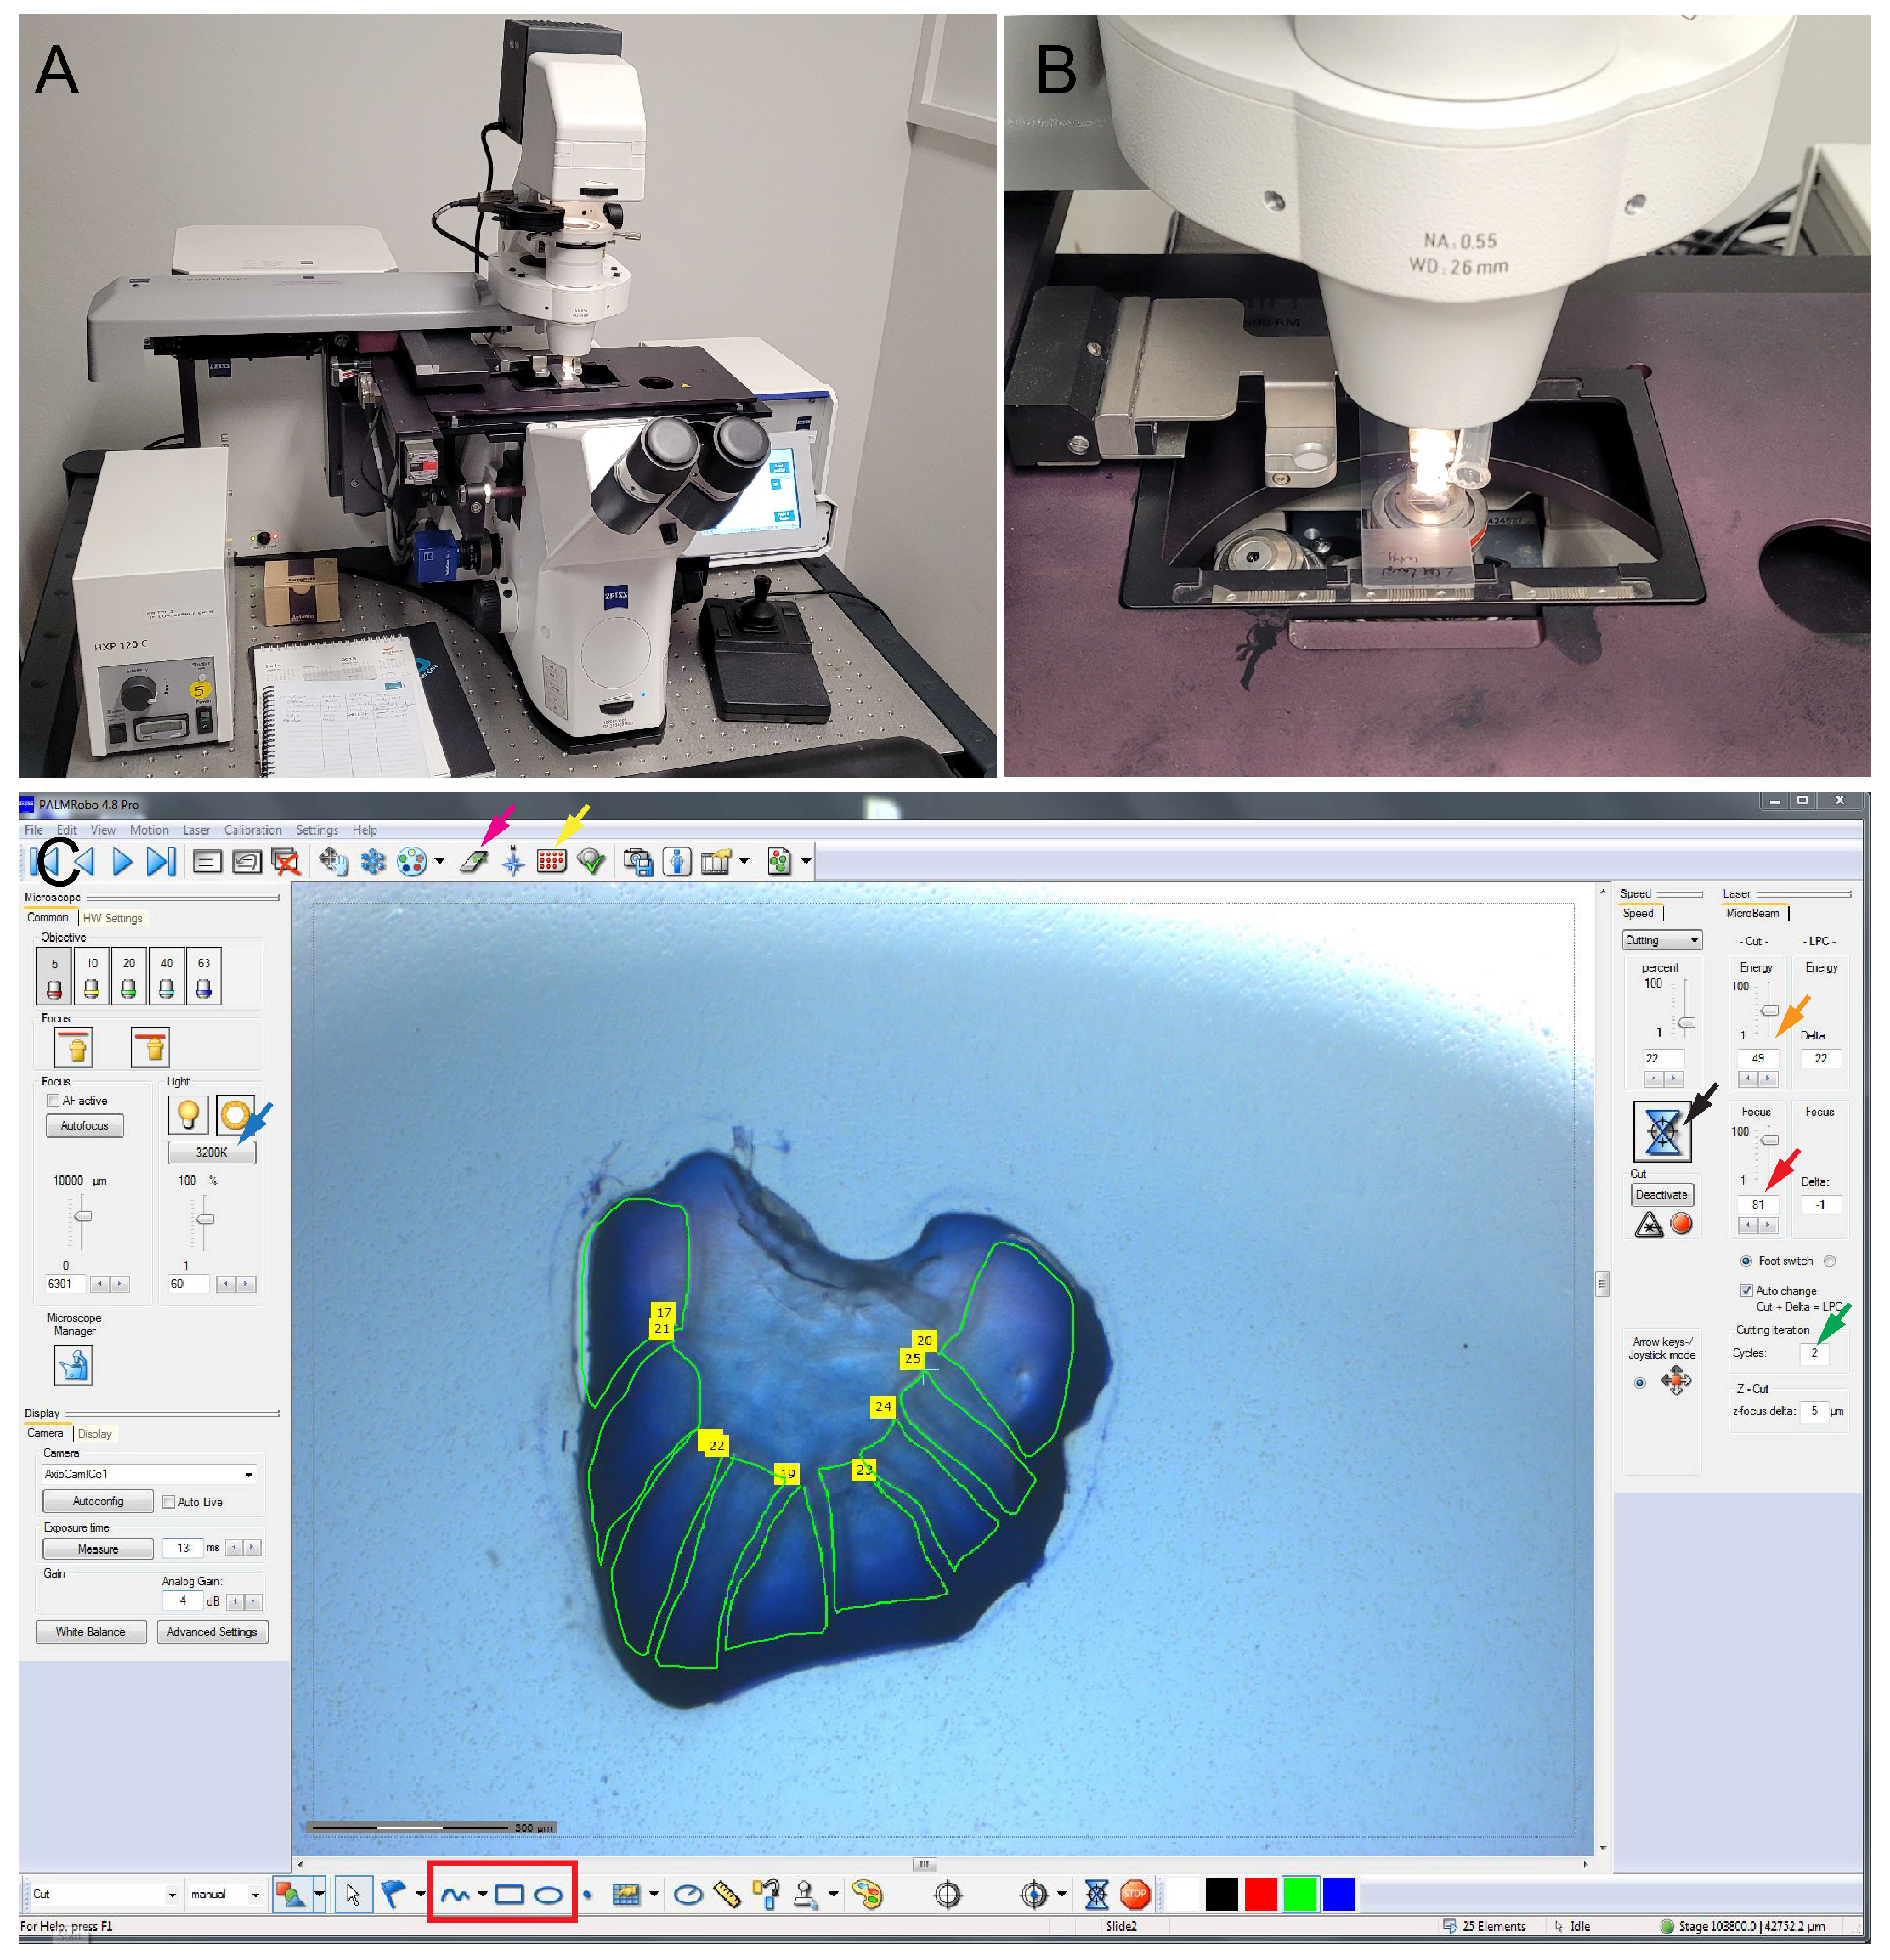
- Move the slide inside an ice box (Coleman ice bucket with crushed ice) to the laser microdissection microscope room.
- Turn on the microscope, turn on the PALMRobo 4.8 pro software, and mount the slide for dissection (Figure 2A,B).
- To mount the slide and the adhesive cap (LCM Adhesive caps 500), click on the button indicated by the red and yellow arrow in PALMRobo 4.8 pro software indicated in Figure 2C.Note: The adhesive caps are used only to allow the microscope to operate. The butterfly wing microsections are thick and hence very difficult to capture using the adhesive caps.
- Use the settings as mentioned in Table 2 for optimal cutting of the butterfly wing tissue.
- After the microdissection, transfer the slides back to the ice box and bring back to lab for isolation of the microsections and extraction of RNA.
-
![Mps 05 00067 i001]()
- PAUSE STEP Wings can be stored at this stage at −80 °C for up to 6 months.
4.4. Isolation of the Microdissected Tissues Using Fine Tweezers
- 1.
- Move the PEN membrane slide with the microdissected samples on an ice-filled Petri plate under a normal dissection microscope (Zeiss Stemi 305).
- 2.
- Prepare 200 µL tubes with 20 µL of molecular grade water on ice for the transfer of the microsections.
- 3.
- Using a fine tweezer carefully pick up the microsections and move them to the respective 200 µL tubes.
- 4.
- After all the sections are collected, move to RNA isolation.
-
![Mps 05 00067 i001]()
- PAUSE STEP Wings can be stored at this stage at −80 °C for up to 6 months.
4.5. RNA Extraction from the Microdissected Samples
- Add 100 µL of LCM lysis buffer (1% SDS in Tris-EDTA) and 10 µL of proteinase K to the 200 µL tubes with the microsections.
- Incubate the tubes at 55 °C in a water bath, vortex every 3 min, for a total of 9 min. At this step the microsections will partly dissolve in the LCM lysis buffer.
- After this step, proceed to RNA extraction using a kit of choice.
4.5.1. RNA Extraction Using Qiagen RNeasy Plus Mini Kit
- Transfer the 130 µL solution from the previous step to a 1.5 mL microcentrifuge tube.
- Add 350 µL of RLT plus buffer and a small amount of 0.1 mm zirconium beads.
- Place the tube in a homogenizer and homogenize for 3 min at the maximum rate.
- Remove the tubes and centrifuge at 14,000 rpm at 4 °C for 3 min.
- Transfer the supernatant to a gDNA eliminator spin column and centrifuge at 14,000 rpm for 30 s.
- Discard the column and to the flow-through add 350 µL 70% EtOH. Mix well and transfer to RNeasy spin column.
- Centrifuge at 14,000 rpm for 30 s and discard the flow-through.
- Add 700 µL of RW1 buffer to the column and centrifuge at 14,000 rpm for 30 s. Discard the flow-through.
- Add 500 µL of RPE buffer to the column and centrifuge at 14,000 rpm for 30 s. Discard the flow-through.
- Add 500 µL of RPE buffer to the column and centrifuge at 14,000 rpm for 2 min. Discard the flow-through and transfer the column to a 1.5 mL microcentrifuge tube.
- Add 20 µL molecular grade water to the column and let it sit for 3 min before centrifugation.
- Centrifuge at 14,000 rpm for 1 min. Discard the column and measure the concentration of the RNA in a nanodrop machine.
4.5.2. Evaluation of the Extracted RNA Using Agarose Gel Electrophoresis
- Prepare a 2% agarose gel by mixing 1 gm of agarose to 50 mL 1X TAE buffer.
- Mix 3 µL of RNA loading dye and 3 µL of RNA sample and load it in one of the agarose gel wells. Add ladder in the adjacent well.
- Run the gel for 30 min at 120 V and 400 mA.
- Image the gel in a gel documentation system. The RNA should appear as a clear band in the gel.
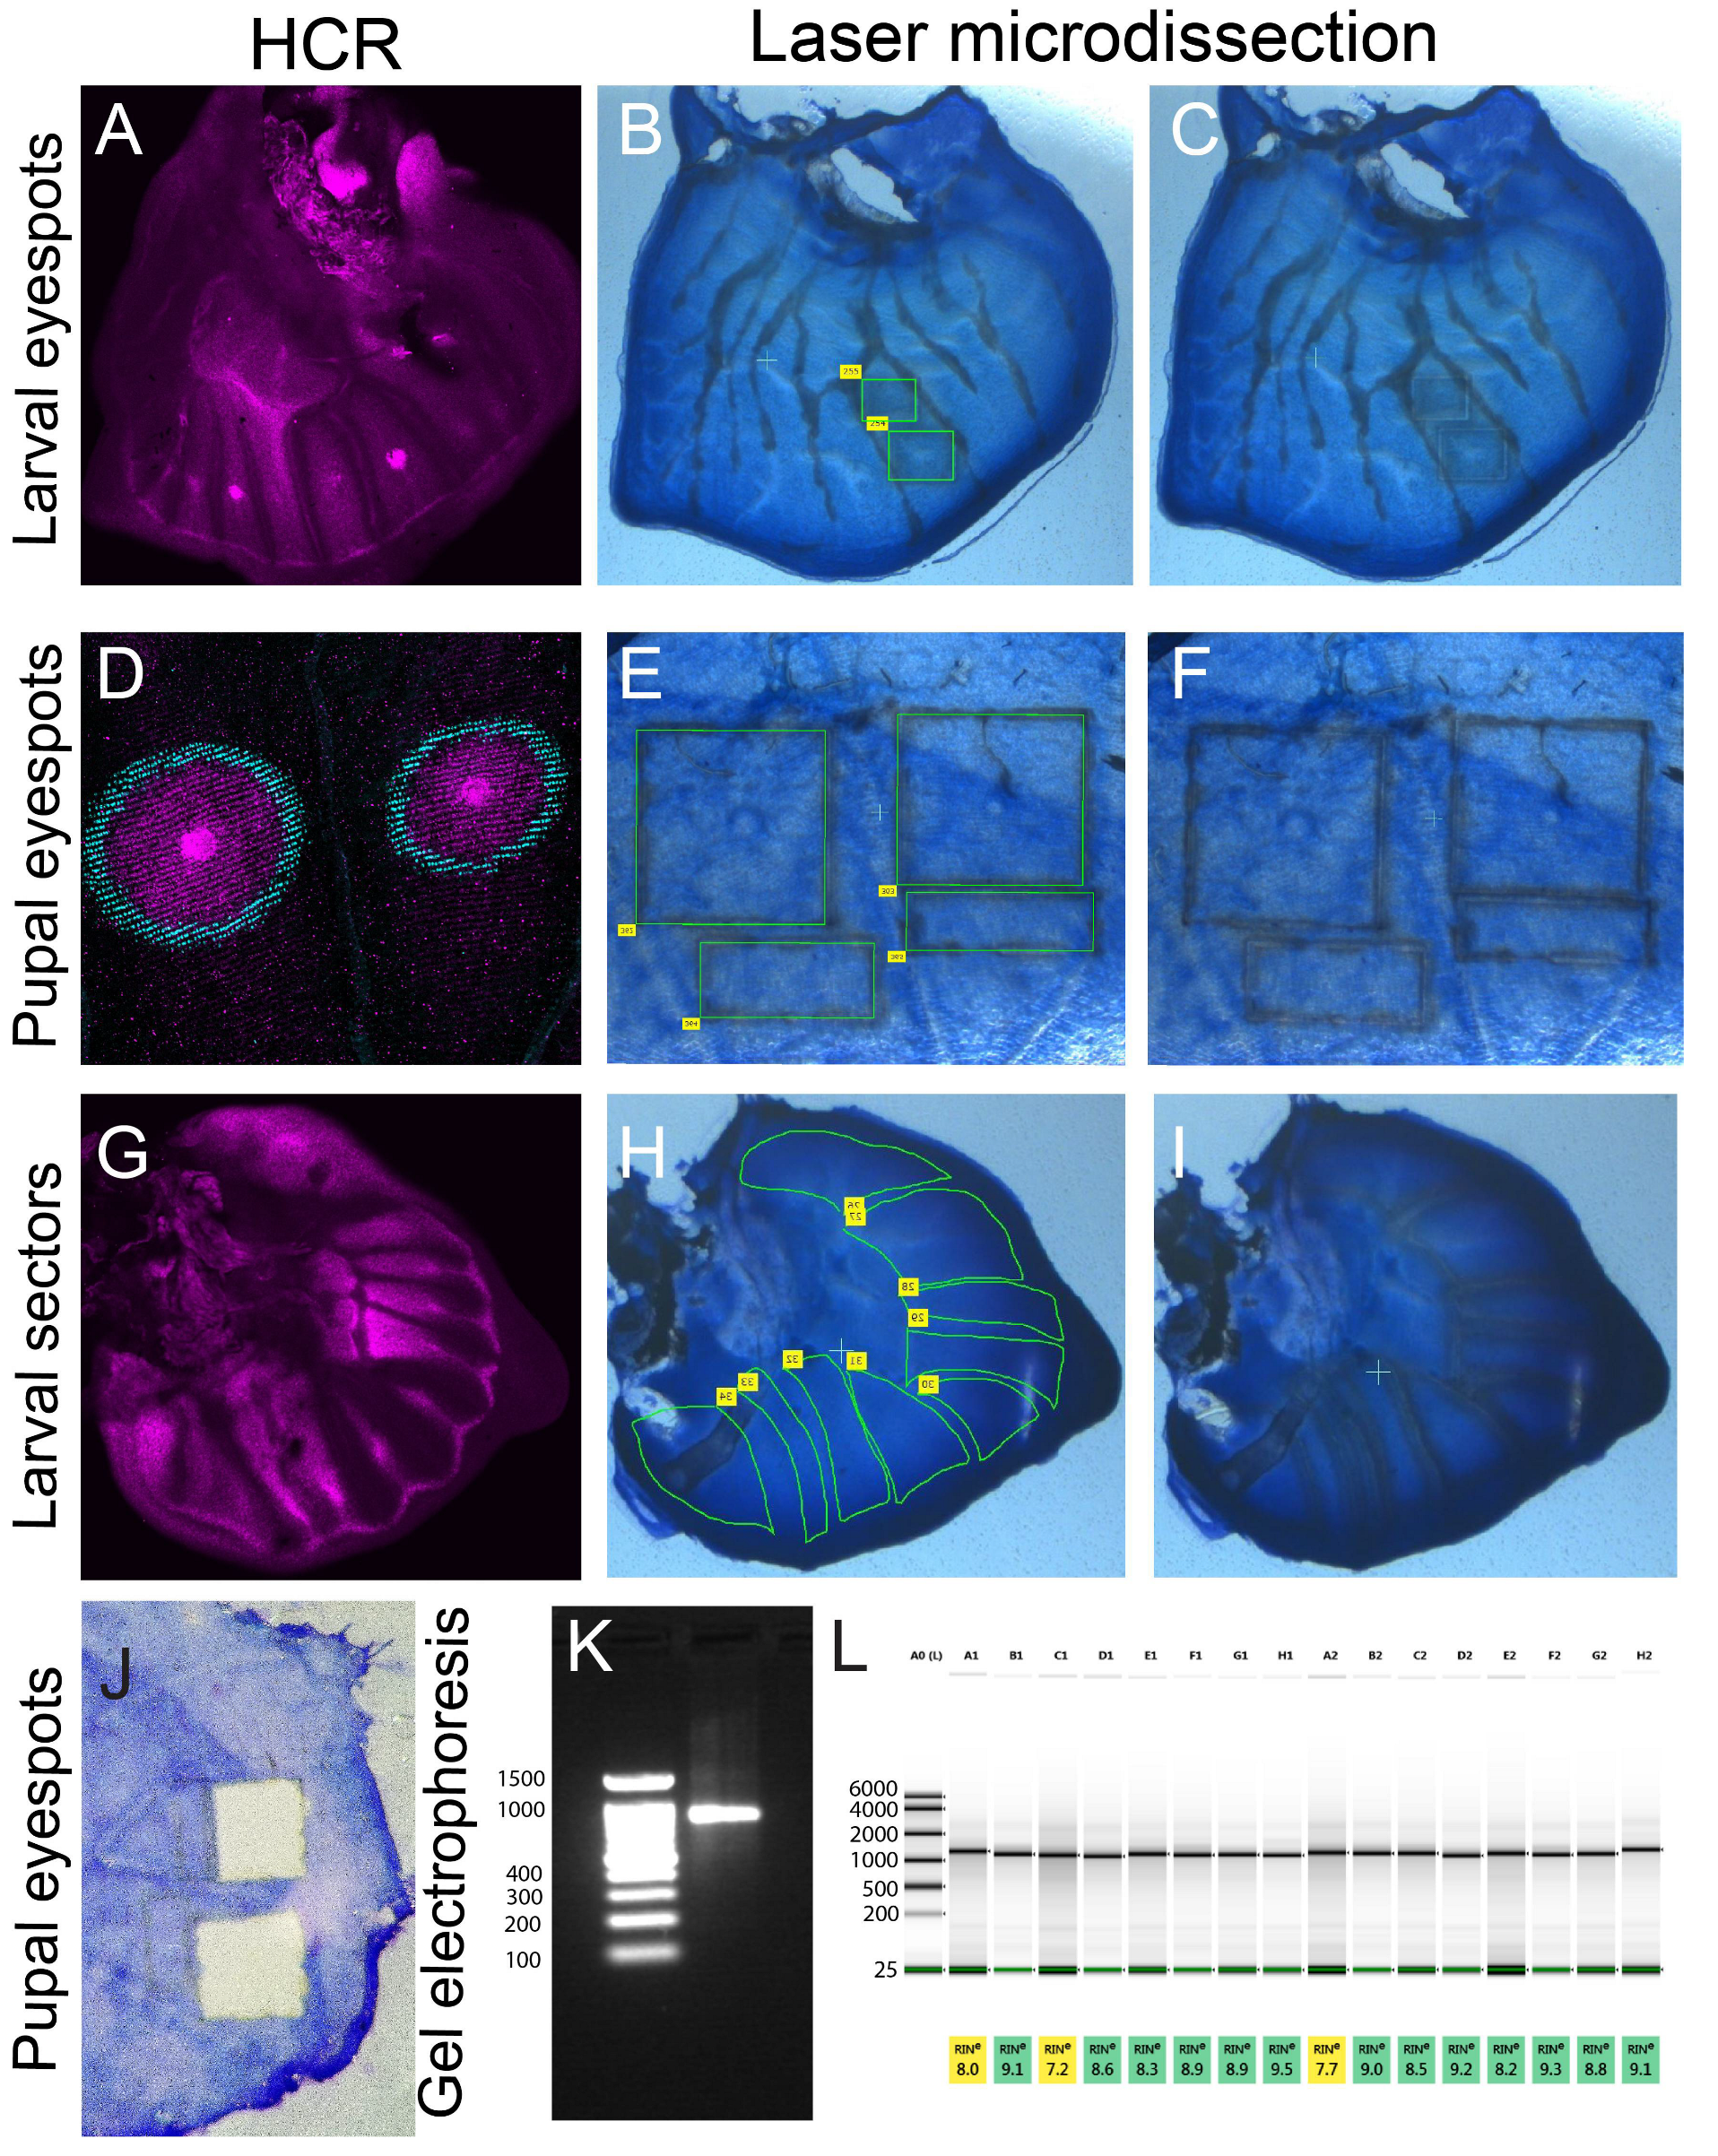
5. Expected Results
Staining, Dissection, and Analysis of Extracted RNA
6. Discussion
7. Reagents Setup
7.1. LCM Lysis Buffer (Table 4)
- In a 50 mL sterile falcon tube add 0.5 mL of 1M Tris Hcl (pH 8.0) and 0.1 mL 0.5M EDTA (pH 8.0).
- Prepare 10% SDS by mixing 10 g of SDS in 90 mL of dH2O in a beaker. Mix with gentle stirring.
- Add 5 mL of the 10% SDS and dH2O to the falcon tube till 50 mL and mix properly by shaking.
7.2. For 50X TAE Buffer (Table 5)
- Add 242 g of Trizma base and 18.61 g of EDTA in a 1-L bottle.
- Add 500 mL dH2O and add 57.1 mL glacial acetic acid.
- Adjust the volume to 1 L and autoclave.
Author Contributions
Funding
Institutional Review Board Statement
Informed Consent Statement
Data Availability Statement
Acknowledgments
Conflicts of Interest
References
- Chen, K.H.; Boettiger, A.N.; Moffitt, J.R.; Wang, S.; Zhuang, X. Spatially Resolved, Highly Multiplexed RNA Profiling in Single Cells. Science 2015, 348, 1360–1363. [Google Scholar] [CrossRef] [PubMed]
- Lubeck, E.; Coskun, A.F.; Zhiyentayev, T.; Ahmad, M.; Cai, L. Single-Cell in Situ RNA Profiling by Sequential Hybridization. Nat. Methods 2014, 11, 360–361. [Google Scholar] [CrossRef] [PubMed]
- Eng, C.H.L.; Lawson, M.; Zhu, Q.; Dries, R.; Koulena, N.; Takei, Y.; Yun, J.; Cronin, C.; Karp, C.; Yuan, G.C.; et al. Transcriptome-Scale Super-Resolved Imaging in Tissues by RNA SeqFISH+. Nature 2019, 568, 235–239. [Google Scholar] [CrossRef] [PubMed]
- Goh, J.J.L.; Chou, N.; Seow, W.Y.; Ha, N.; Cheng, C.P.P.; Chang, Y.C.; Zhao, Z.W.; Chen, K.H. Highly Specific Multiplexed RNA Imaging in Tissues with Split-FISH. Nat. Methods 2020, 17, 689–693. [Google Scholar] [CrossRef]
- Codeluppi, S.; Borm, L.E.; Zeisel, A.; La Manno, G.; van Lunteren, J.A.; Svensson, C.I.; Linnarsson, S. Spatial Organization of the Somatosensory Cortex Revealed by OsmFISH. Nat. Methods 2018, 15, 932–935. [Google Scholar] [CrossRef]
- Rodriques, S.G.; Stickels, R.R.; Goeva, A.; Martin, C.A.; Murray, E.; Vanderburg, C.R.; Welch, J.; Chen, L.M.; Chen, F.; Macosko, E.Z. Slide-Seq: A Scalable Technology for Measuring Genome-Wide Expression at High Spatial Resolution. Science 2019, 363, 1463–1467. [Google Scholar] [CrossRef]
- Wang, X.; Allen, W.E.; Wright, M.A.; Sylwestrak, E.L.; Samusik, N.; Vesuna, S.; Evans, K.; Liu, C.; Ramakrishnan, C.; Liu, J.; et al. Three-Dimensional Intact-Tissue Sequencing of Single-Cell Transcriptional States. Science 2018, 361, eaat5691. [Google Scholar] [CrossRef]
- Patel, A.P.; Tirosh, I.; Trombetta, J.J.; Shalek, A.K.; Gillespie, S.M.; Wakimoto, H.; Cahill, D.P.; Nahed, B.V.; Curry, W.T.; Martuza, R.L.; et al. Single-Cell RNA-Seq Highlights Intratumoral Heterogeneity in Primary Glioblastoma. Science 2014, 344, 1396–1402. [Google Scholar] [CrossRef]
- Shalek, A.K.; Satija, R.; Shuga, J.; Trombetta, J.J.; Gennert, D.; Lu, D.; Chen, P.; Gertner, R.S.; Gaublomme, J.T.; Yosef, N.; et al. Single-Cell RNA-Seq Reveals Dynamic Paracrine Control of Cellular Variation. Nature 2014, 510, 363–369. [Google Scholar] [CrossRef]
- Saliba, A.E.; Westermann, A.J.; Gorski, S.A.; Vogel, J. Single-Cell RNA-Seq: Advances and Future Challenges. Nucleic Acids Res. 2014, 42, 8845–8860. [Google Scholar] [CrossRef]
- Regev, A.; Teichmann, S.A.; Lander, E.S.; Amit, I.; Benoist, C.; Birney, E.; Bodenmiller, B.; Campbell, P.; Carninci, P.; Clatworthy, M.; et al. The Human Cell Atlas. eLife 2017, 6, 1–30. [Google Scholar] [CrossRef] [PubMed]
- Han, X.; Wang, R.; Zhou, Y.; Fei, L.; Sun, H.; Lai, S.; Saadatpour, A.; Zhou, Z.; Chen, H.; Ye, F.; et al. Mapping the Mouse Cell Atlas by Microwell-Seq. Cell 2018, 172, 1091–1107. [Google Scholar] [CrossRef]
- Nichterwitz, S.; Chen, G.; Aguila Benitez, J.; Yilmaz, M.; Storvall, H.; Cao, M.; Sandberg, R.; Deng, Q.; Hedlund, E. Laser Capture Microscopy Coupled with Smart-Seq2 for Precise Spatial Transcriptomic Profiling. Nat. Commun. 2016, 7, 12139. [Google Scholar] [CrossRef]
- Nichterwitz, S.; Nijssen, J.; Storvall, H.; Schweingruber, C.; Comley, L.H.; Allodi, I.; Van Der Lee, M.; Deng, Q.; Sandberg, R.; Hedlund, E. LCM-Seq Reveals Unique Transcriptional Adaptation Mechanisms of Resistant Neurons and Identifies Protective Pathways in Spinal Muscular Atrophy. Genome Res. 2020, 30, 1083–1096. [Google Scholar] [CrossRef] [PubMed]
- Aguila, J.; Cheng, S.; Kee, N.; Cao, M.; Deng, Q.; Hedlund, E. LCM-Seq Identifies Robust Markers of Vulnerable and Resistant Human Midbrain Dopamine Neurons. bioRxiv 2020, 1–29. [Google Scholar] [CrossRef]
- Teves, J.M.; Won, K.J. Mapping Cellular Coordinates through Advances in Spatial Transcriptomics Technology. Mol. Cells 2020, 43, 591–599. [Google Scholar] [PubMed]
- Emmert-Buck, M.R.; Bonner, R.F.; Smith, P.D.; Chuaqui, R.F.; Zhuang, Z.; Goldstein, S.R.; Weiss, R.A.; Liotta, L.A. Laser Capture Microdissection. Science 1996, 274, 998–1001. [Google Scholar] [CrossRef]
- Datta, S.; Malhotra, L.; Dickerson, R.; Chaffee, S.; Sen, C.K.; Roy, S. Laser Capture Microdissection: Big Data from Small Samples. Histol. Histopathol. 2015, 30, 1255–1269. [Google Scholar] [CrossRef]
- Schermelleh, L.; Thalhammer, S.; Heckl, W.; Pösl, H.; Cremer, T.; Schütze, K.; Cremer, M. Laser Microdissection and Laser Pressure Catapulting for the Generation of Chromosome-Specific Paint Probes. Biotechniques 1999, 27, 362–367. [Google Scholar] [CrossRef]
- Bonner, R.F.; Emmert-buck, M.; Cole, K.; Goldstein, S.; Liotta, L.A. Laser Capture Microdissection: Molecular Analysis of Tissue. Science 1997, 278, 1481–1483. [Google Scholar] [CrossRef]
- Simone, N.L.; Bonner, R.F.; Gillespie, J.W.; Emmert-Buck, M.R.; Liotta, L.A. Laser-Capture Microdissection: Opening the Microscopic Frontier to Molecular Analysis. Trends Genet. 1998, 14, 272–276. [Google Scholar] [CrossRef]
- Craven, R.A.; Banks, R.E. Laser Capture Microdissection and Proteomics: Possibilities and Limitation. Proteomics 2001, 1, 1200–1204. [Google Scholar] [CrossRef]
- Simone, N.L.; Paweletz, C.P.; Charboneau, L.; Petricoin, E.F.; Liotta, L.A. Laser Capture Microdissection: Beyond Functional Genomics to Proteomics. Mol. Diagn. 2000, 5, 301–307. [Google Scholar] [CrossRef] [PubMed]
- Sgroi, D.C.; Teng, S.; Robinson, G.; LeVangie, R.; Hudson, J.R.; Elkahloun, A.G. In Vivo Gene Expression Profile Analysis of Human Breast Cancer Progression. Cancer Res. 1999, 59, 5656–5661. [Google Scholar] [PubMed]
- Sheehan, K.M.; Calvert, V.S.; Kay, E.W.; Lu, Y.; Fishman, D.; Espina, V.; Aquino, J.; Speer, R.; Araujo, R.; Mills, G.B.; et al. Use of Reverse Phase Protein Microarrays and Reference Standard Development for Molecular Network Analysis of Metastatic Ovarian Carcinoma. Mol. Cell. Proteom. 2005, 4, 346–355. [Google Scholar] [CrossRef]
- Fend, F.; Specht, K.; Kremer, M.; Quintanilla-Martínez, L. Laser Capture Microdissection in Pathology. Methods Enzymol. 2002, 356, 196–206. [Google Scholar] [CrossRef] [PubMed]
- Yazdi, A.S.; Puchta, U.; Flaig, M.J.; Sander, C.A. Laser-Capture Microdissection: Applications in Routine Molecular Dermatopathology. J. Cutan. Pathol. 2004, 31, 465–470. [Google Scholar] [CrossRef]
- Meda, S.; Freund, N.; Norman, K.J.; Thompson, B.S.; Sonntag, K.C.; Andersen, S.L. The Use of Laser Capture Microdissection to Identify Specific Pathways and Mechanisms Involved in Impulsive Choice in Rats. Heliyon 2019, 5, e02254. [Google Scholar] [CrossRef]
- Luo, L.; Salunga, R.C.; Guo, H.; Bittner, A.; Joy, K.C.; Galindo, J.E.; Xiao, H.; Rogers, K.E.; Wan, J.S.; Jackson, M.R.; et al. Gene Expression Profiles of Laser-Captured Adjacent Neuronal Subtypes. Nat. Med. 1999, 5, 117–122. [Google Scholar] [CrossRef]
- Nawshad, A.; LaGamba, D.; Olsen, B.R.; Hay, E.D. Laser Capture Microdissection (LCM) for Analysis of Gene Expression in Specific Tissues during Embryonic Epithelial-Mesenchymal Transformation. Dev. Dyn. 2004, 230, 529–534. [Google Scholar] [CrossRef] [PubMed]
- Vandewoestyne, M.; Deforce, D. Laser Capture Microdissection in Forensic Research: A Review. Int. J. Legal Med. 2010, 124, 513–521. [Google Scholar] [CrossRef] [PubMed]
- Liew, L.C.; Wang, Y.; Peirats-Llobet, M.; Berkowitz, O.; Whelan, J.; Lewsey, M.G. Laser-Capture Microdissection RNA-Sequencing for Spatial and Temporal Tissue-Specific Gene Expression Analysis in Plants. J. Vis. Exp. 2020, 2020, 1–14. [Google Scholar] [CrossRef] [PubMed]
- Goldsworthy, S.M.; Stockton, P.S.; Trempus, C.S.; Foley, J.F.; Maronpot, R.R. Effects of Fixation on RNA Extraction and Amplification from Laser Capture Microdissected Tissue. Mol. Carcinog. 1999, 25, 86–91. [Google Scholar] [CrossRef]
- Espina, V.; Wulfkuhle, J.D.; Calvert, V.S.; VanMeter, A.; Zhou, W.; Coukos, G.; Geho, D.H.; Petricoin, E.F.; Liotta, L.A. Laser-Capture Microdissection. Nat. Protoc. 2006, 1, 586–603. [Google Scholar] [CrossRef]
- Das Banerjee, T.; Monteiro, A. Dissection of Larval and Pupal Wings of Bicyclus Anynana Butterflies. Methods Protoc. 2020, 3, 5. [Google Scholar] [CrossRef] [PubMed]
- Choi, H.M.T.; Schwarzkopf, M.; Fornace, M.E.; Acharya, A.; Artavanis, G.; Stegmaier, J.; Cunha, A.; Pierce, N.A. Third-Generation in Situ Hybridization Chain Reaction: Multiplexed, Quantitative, Sensitive, Versatile, Robust. Development 2018, 145, dev165753. [Google Scholar] [CrossRef]
- Das Banerjee, T.; Monteiro, A. Molecular Mechanisms Underlying Simplification of Venation Patterns in Holometabolous Insects. Development 2020, 147, dev196394. [Google Scholar] [CrossRef] [PubMed]
- Monteiro, A.; Glaser, G.; Stockslager, S.; Glansdorp, N.; Ramos, D. Comparative Insights into Questions of Lepidopteran Wing Pattern Homology. BMC Dev. Biol. 2006, 6, 52. [Google Scholar] [CrossRef]
- Marek, A.; Schüler, C.; Satué, M.; Haigl, B.; Erben, R.G. A Laser Capture Microdissection Protocol That Yields High Quality Rna from Fresh-Frozen Mouse Bones. J. Vis. Exp. 2019, 2019, e60197. [Google Scholar] [CrossRef] [PubMed]

| Experimental Stages | Time for Completion |
|---|---|
| 10 min |
| 10 min |
| 1–3 h |
| 1–2 h |
| 2 h |
| Sl. No. | Name | Setting |
|---|---|---|
| 1 | Light | 3200 K |
| 2 | Cut energy | 50% |
| 3 | Focus | 81 |
| 4 | Cutting iteration | 2 |
| 5 | Z-focus delta | 5 µm |
| Sl. No. | Sample Name | No. of Wings Used | RNA Amount (ng) * |
|---|---|---|---|
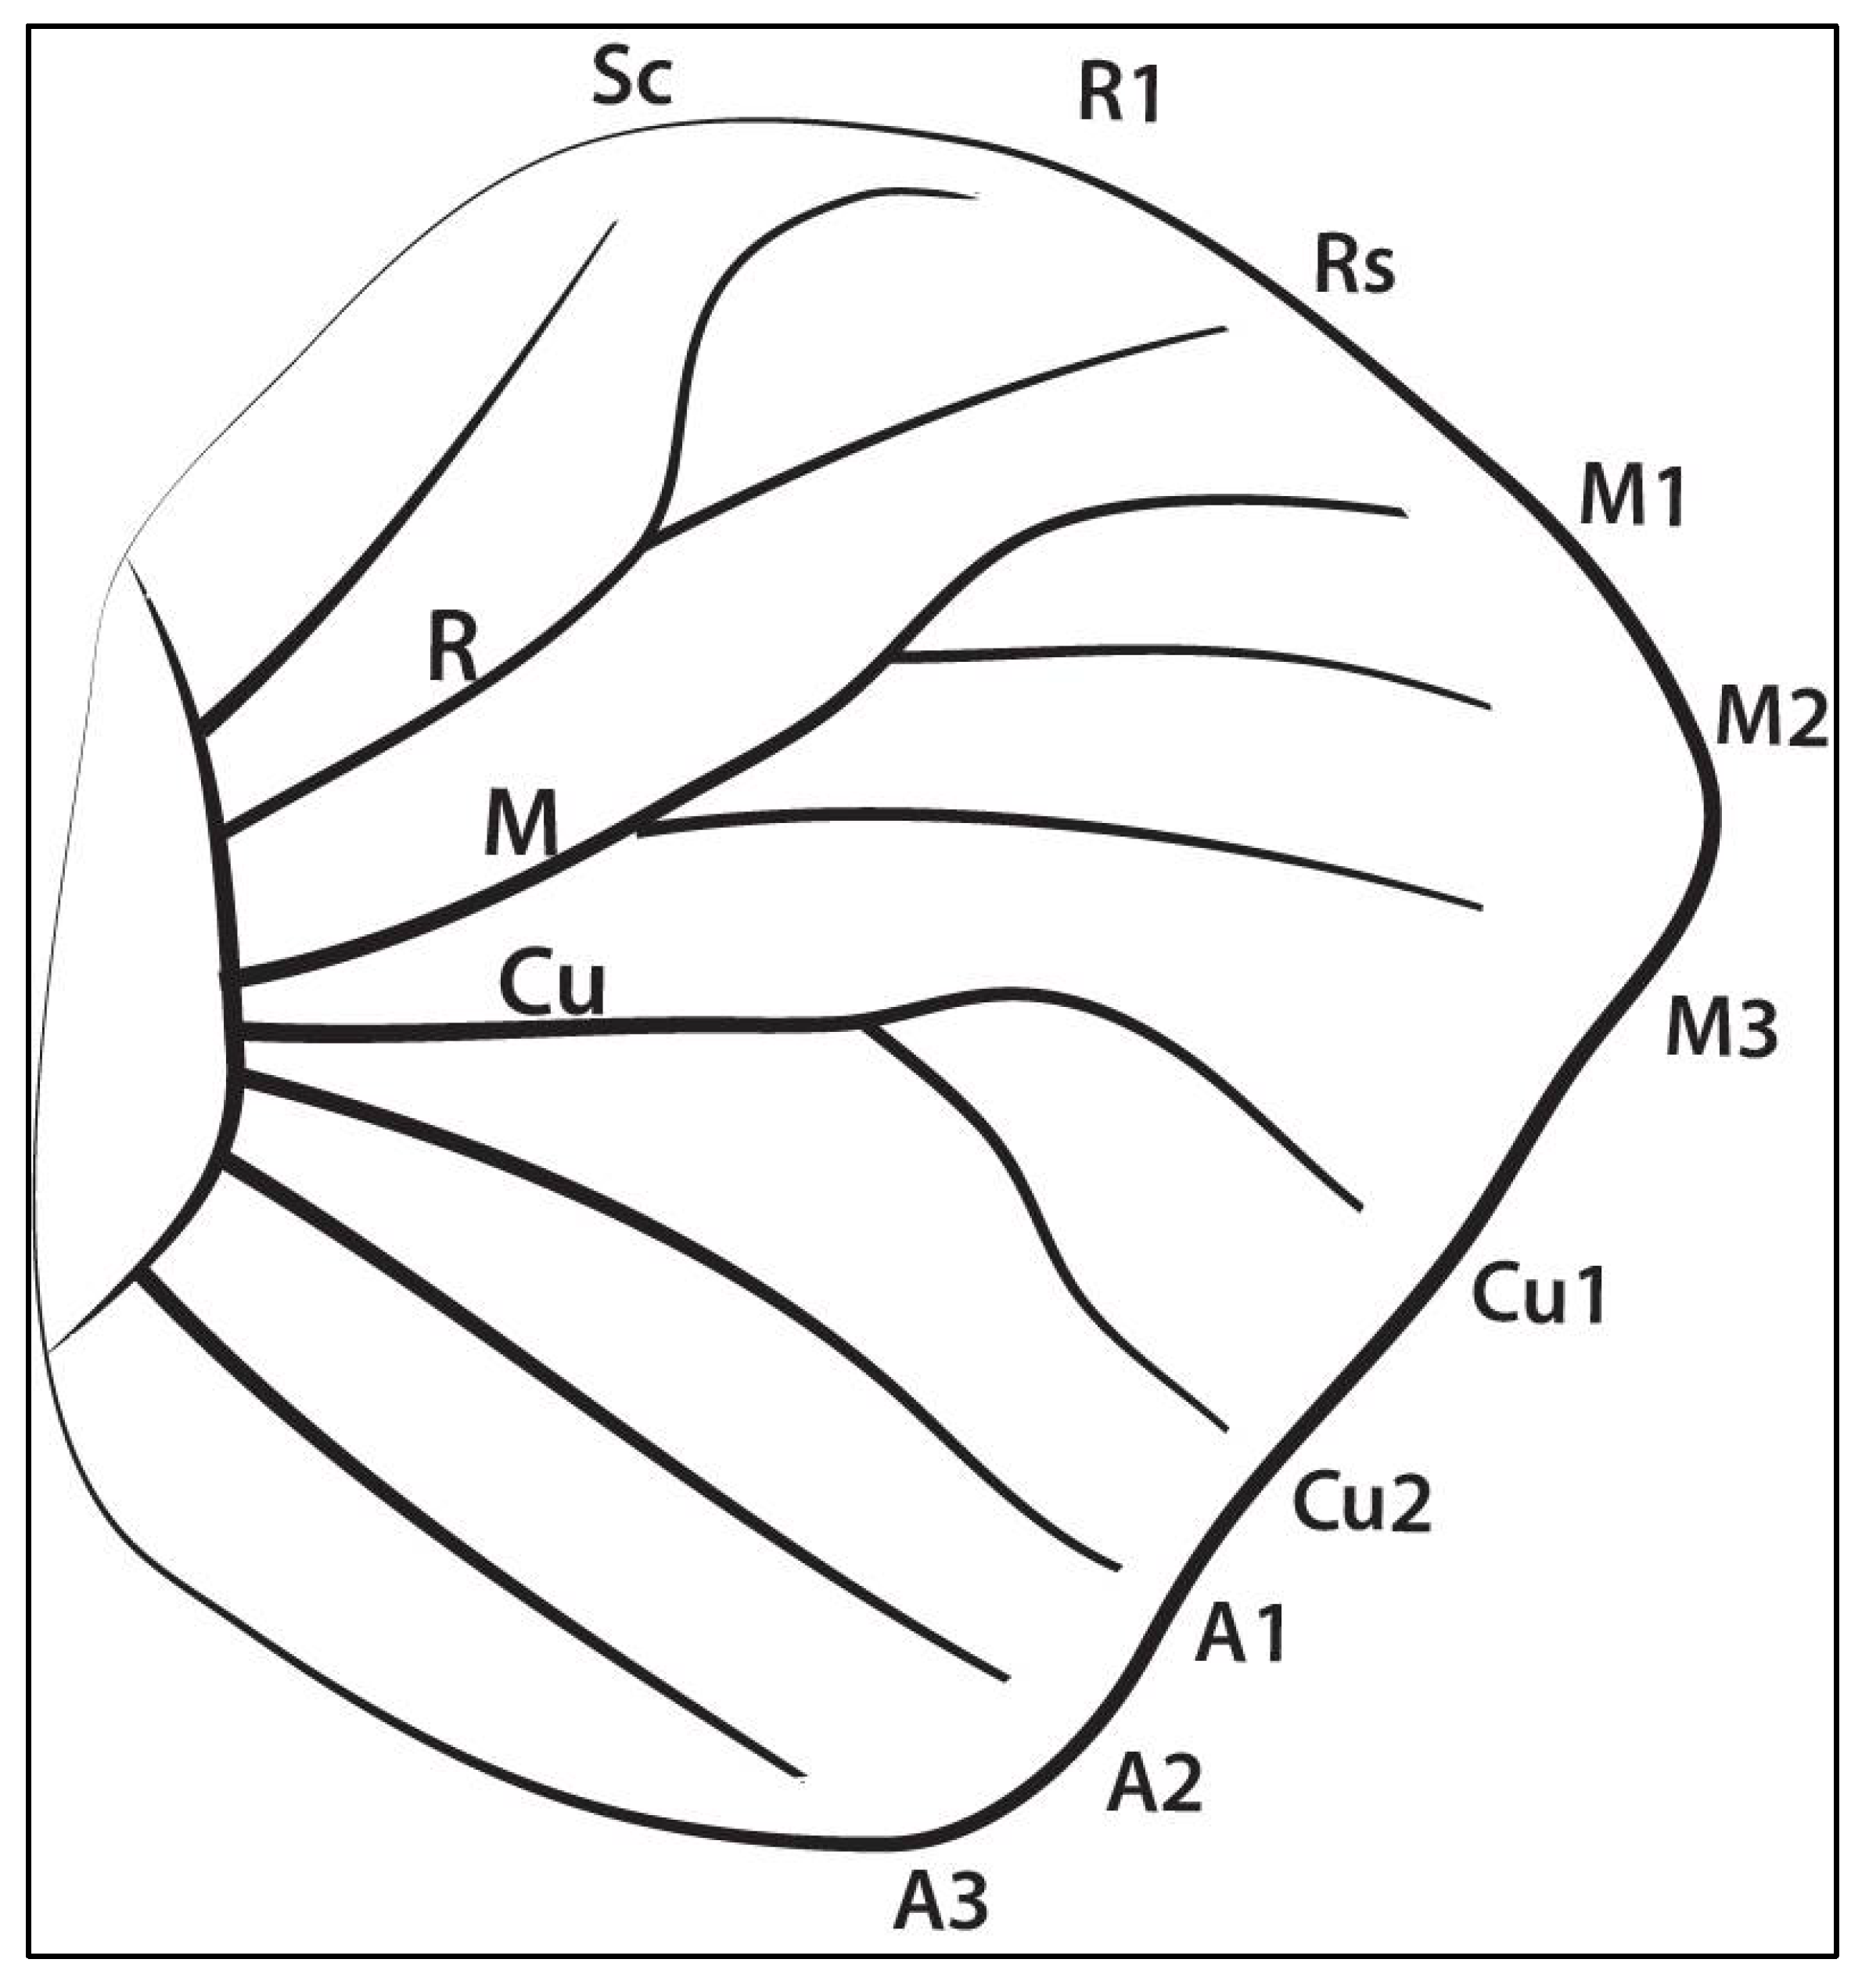
| 1 | Sector 1 (Rs–anterior margin) | 30 | 1596 |
| 2 | Sector 2 (M1-Sc+Rs) | 30 | 1406 |
| 3 | Sector 3 (M2-M1) | 30 | 1197 |
| 4 | Sector 4 (M3-M2) | 30 | 760 |
| 5 | Sector 5 (Cu1-M3) | 30 | 1026 |
| 6 | Sector 6 (Cu2-Cu1) | 30 | 1520 |
| 7 | Sector 7 (A1-Cu2) | 30 | 1178 |
| 8 | Sector 8 (A2-A1) | 30 | 1007 |
| 9 | Sector 9 (A2–posterior margin) | 30 | 2109 |
| 10 | Pupal eyespot | 4 | 1843 |
| 11 | Pupal control | 4 | 1197 |
| 12 | Larval eyespot (WS) | 30 | 1638 |
| 13 | Larval control (WS) | 30 | 650 |
| Sl. No. | Chemical | Amount |
|---|---|---|
| 1 | 1M Tris HCl (pH 8.0) | 0.5 mL |
| 2 | 0.5M EDTA (pH 8.0) | 0.1 mL |
| 3 | 10% SDS | 5 mL |
| 4 | dH2O | Till 50 mL |
| Sl. No. | Chemical | Amount |
|---|---|---|
| 1 | Trizma base | 242 g |
| 2 | EDTA | 18.61 g |
| 3 | Glacial Acetic Acid | 57.1 mL |
| 4 | dH2O | Till 100 mL |
Publisher’s Note: MDPI stays neutral with regard to jurisdictional claims in published maps and institutional affiliations. |
© 2022 by the authors. Licensee MDPI, Basel, Switzerland. This article is an open access article distributed under the terms and conditions of the Creative Commons Attribution (CC BY) license (https://creativecommons.org/licenses/by/4.0/).
Share and Cite
Banerjee, T.D.; Tian, S.; Monteiro, A. Laser Microdissection-Mediated Isolation of Butterfly Wing Tissue for Spatial Transcriptomics. Methods Protoc. 2022, 5, 67. https://doi.org/10.3390/mps5040067
Banerjee TD, Tian S, Monteiro A. Laser Microdissection-Mediated Isolation of Butterfly Wing Tissue for Spatial Transcriptomics. Methods and Protocols. 2022; 5(4):67. https://doi.org/10.3390/mps5040067
Chicago/Turabian StyleBanerjee, Tirtha Das, Shen Tian, and Antόnia Monteiro. 2022. "Laser Microdissection-Mediated Isolation of Butterfly Wing Tissue for Spatial Transcriptomics" Methods and Protocols 5, no. 4: 67. https://doi.org/10.3390/mps5040067
APA StyleBanerjee, T. D., Tian, S., & Monteiro, A. (2022). Laser Microdissection-Mediated Isolation of Butterfly Wing Tissue for Spatial Transcriptomics. Methods and Protocols, 5(4), 67. https://doi.org/10.3390/mps5040067