
Sandwich Enzyme-Linked Immunosorbent Assay for Quantification of Callose

 ,
,  ,
,  , and
, and 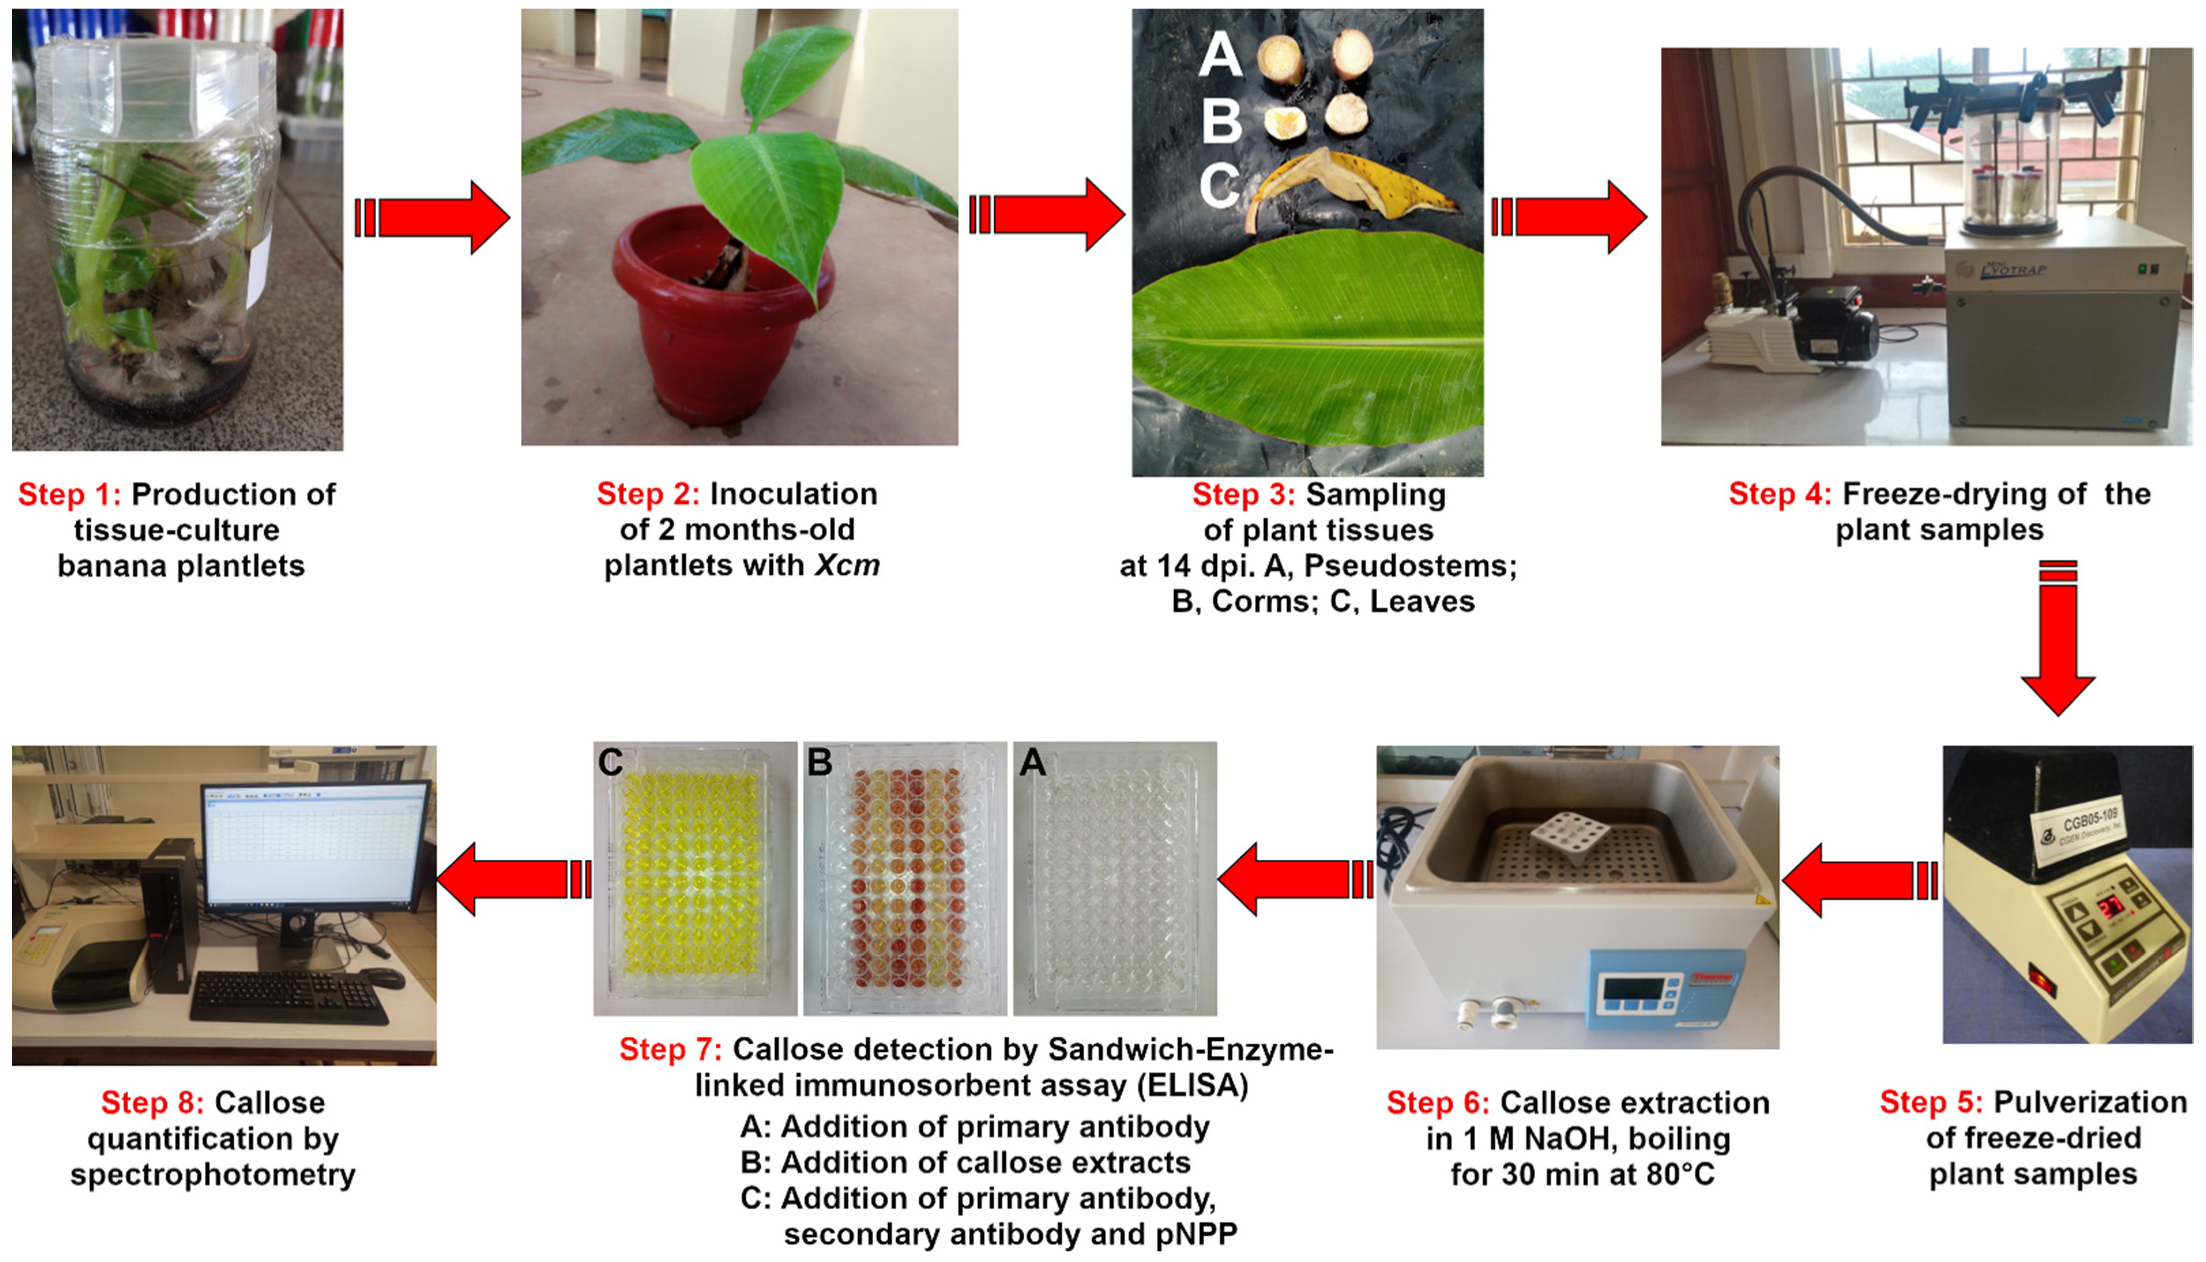
Abstract
1. Introduction
2. Experimental Design
2.1. Materials
- Xanthomonas campestris pv. musacearum bacterial isolates, causative agent of banana Xanthomonas wilt (BXW) disease in banana.
- Two and half months-old tissue culture-derived Musa balbisiana and “Mbwazirume” banana plantlets. Musa balbisiana is a diploid (genome BB) wild progenitor of cultivated banana whereas “Mbwazirume” is triploid (genome AAA-EA) and a local commercial banana variety in Uganda belonging to the larger group of East African highland banana (EAHB) genotypes.
- Sodium hydroxide (NaOH) (PanReac AppliChem ITW Reagents—PanReac Química SLU, Barcelona, Spain; Cat. No.: 141687.1210).
- Sodium chloride (NaCl) (PanReac AppliChem ITW Reagents—PanReac Química SLU, Barcelona, Spain; Cat. No.: A2942).
- Potassium di-hydrogen phosphate (KH2PO4) (PanReac AppliChem ITW Reagents—PanReac Química SLU, Barcelona, Spain; Cat. No.: 141509).
- Di-sodium hydrogen phosphate (Na2HPO4) (PanReac AppliChem ITW Reagents—PanReac Química SLU, Barcelona, Spain; Cat. No.: 141679).
- Potassium chloride (KCl) (PanReac AppliChem ITW Reagents—PanReac Química SLU, Barcelona, Spain; Cat. No.: A2939).
- Sodium azide (NaN3) (PanReac AppliChem ITW Reagents—PanReac Química SLU, Barcelona, Spain; Cat. No.: A1430).
- Hydrochloric acid (HCl) (PanReac AppliChem ITW Reagents—PanReac Química SLU, Barcelona, Spain; Cat. No.: 141020).
- Sodium carbonate (Na2CO3) (PanReac AppliChem ITW Reagents—PanReac Química SLU, Barcelona, Spain; Cat. No.: 141648).
- Sodium hydrogen carbonate (NaHCO3) (PanReac AppliChem ITW Reagents—PanReac Química SLU, Barcelona, Spain; Cat. No.: 141638).
- Polyvinylpyrrolidone (PVP) (PanReac AppliChem ITW Reagents—PanReac Química SLU, Barcelona, Spain; Cat. No.: A2260).
- Diethanolamine (PanReac AppliChem ITW Reagents—PanReac Química SLU, Barcelona, Spain; Cat. No.: 191287).
- Micropipette tips (Eppendorf, Hamburg, Germany; Brand: epT.I.P.S. ® Singles; Cat. No.: 022492209).
- Microcentrifuge tubes 1.5 mL (Eppendorf, Hamburg, Germany; Catalog No. 022363204).
- Microcentrifuge tubes 2 mL (Genesee Scientific Corp., San Diego, CA, USA; Cat. No.: 24–283).
- Reagent reservoirs (Thermo Fisher Scientific Inc., Waltham, MA, USA; Cat. No.: 15075).
- ELISA plates, 96-well, flat base, transparent, polystyrene, high binding (Sarstedt AG & Co. KG, Nümbrecht, Germany; Cat. No.: 82.1581.200).
- Laminarin (Alfa aesar, Haverhill, MA, USA; Cat. No.: J66193).
- Para-nitrophenyl phosphate (pNPP) (Merck KGaA, Darmstadt, Germany; Cat. No.: 20-106).
- Parafilm (Laboratory film) (Paul Marienfeld GmbH & Co. KG, Lauda-Königshofen, Germany; Cat. No.: 740751).
- Tween-20 (Biomatik Corporation, Ontario, Canada; Cat. No.: A4031).
- Bovine Serum Albumin (BSA) (Thermo Fisher Scientific, Waltham, MA, USA; Cat. No.: B14).
- Ultrapure distilled water (Thermo Fisher Scientific, Waltham, MA, USA; Cat. No.: 10-977-015).
- Blotting paper (Kim-Fay EA Limited, Nairobi, Kenya; Fay Kitchen towels).
- Aluminium foil (Kim-Fay EA Limited, Nairobi, Kenya).
- Primary antibody (1-3-β-glucan-directed mouse IgG) (Bio supplies Australia Pty Ltd., Melbourne, Australia; Cat. No.: 400-2).
- Primary antibody in coating buffer (see Reagents Setup).
- Primary antibody in blocking buffer (see Reagents Setup).
- Secondary antibody conjugated to Alkaline Phosphatase (anti-Mouse IgG-Alkaline phosphatase) (Sigma Life Sciences, Cherry Hill, NJ, USA; Cat. No.: A5153) (see Reagents Setup).
- Blocking buffer (see Reagents Setup).
- Coating buffer (see Reagents Setup).
- Wash buffer (see Reagents Setup).
- Conjugate buffer (see Reagents Setup).
- Substrate buffer (see Reagents Setup).
- Phosphate buffered saline (PBS) (see Reagents Setup).
- Para-nitrophenyl phosphate (pNPP) solution (see Reagents Setup).
- Microplate Manager® 6 Version 6 software (Bio-Rad Laboratories, Inc., Hercules, CA, USA; Cat. No.: 1689520).
2.2. Equipment
- Freeze-drier (LabWrench, Canada, USA; Brand: VirTis—BenchTop™ “K” series; Model: 4KBTXL; Cat. No.: 448053).
- Digital Shaker (Eppendorf, Hamburg, Germany; Brand: MixMate®; Cat. No.: 5353000529).
- Centrifuge (Eppendorf, Hamburg, Germany; Brand: 5425R; Cat. No.: 5406000240).
- Micropipettes (0.5–1000 μL) (Eppendorf, Hamburg, Germany; Brand: Research ® plus; Cat. No.: 3123000900).
- 12-channel micropipette (30–300 μL) (Eppendorf, Hamburg, Germany; Brand: 2100 series; Cat. No.: EP-12-300R).
- Microplate absorbance reader (Bio-Rad Laboratories, Inc., Hercules, CA, USA; iMark; Cat. No.: 1681135EDU).
- 405 nm filter for the iMark microplate reader (Lasec International Pty. Ltd., Cape Town, South Africa; Model: iMark 680; Cat. No.: BRD1681011).
- Incubator (Esco Lifesciences Group, Singapore; Isotherm® Forced Convection Incubator; Model: IFA-54-8, Cat. No.: 2100002).
- Combined refrigerator- freezer (4 °C and −20 °C) (Haier Medical and laboratory Co. Ltd., Qingda, China; Model: HYCD-282).
- Beadbeater 96 (BioSpec Products Inc., Bartlesville, OK, USA, Cat. No.: 1001EUR).
- Precision water bath (Thermo Fisher Scientific Inc., Newinton, CT, USA; Model: GP10; Cat. No.: TSGP10).
- Analytical balance (Mettler-Toledo AG, Greifensee, Switzerland; Model: ML204/01).
- pH meter (Hanna Instruments, Woonsocket, RI, USA; Model HI9126; S/N: 02310048991).
3. Procedure
3.1. Inoculation of Experimental Plants and Sampling
- OPTIONAL STEP Inoculate 2.5-month-old tissue-culture-derived banana plantlets (Musa balbisiana and Mbwazirume) (Figure 1, Step 1) with 200 µL of the PCR-confirmed Xcm inoculum (1 × 10⁸ cells) on the dorsal side of the leaf petioles [49] (Figure 1, Step 2). Quantification of callose using this method can be done in any plant samples depending on the objectives of the study. In our case, we wanted to assess callose production in two banana genotypes infected with Xcm as a biotic stress imposed on the plants.
- OPTIONAL STEP Inoculate the control plantlets with 200 µL of double distilled sterile water. Replicate the experiments 6–10 times and repeat at least 2–3 times (Figure 1, Step 2).
- Quickly excise banana leaf, pseudostem and corm samples at 14 days post-inoculation (dpi) (time of sampling is variable depending on experimental design) and place them into labeled 50 mL falcon tubes (Figure 1, Step 3).
- 4.
- Immediately immerse the 50 mL falcon tubes containing the samples into liquid nitrogen.
- 5.
- Transport the samples and store at −80 °C.
 PAUSE STEP The samples can be stored at −80 °C for up to 1 year or longer with minimal freeze–thaw cycles.
 3.2. Sample Preparation (Time to Completion: 3 Days 2 h)
 CRITICAL STEP The samples to be freeze-dried must never thaw and the Mini LYOTRAP freeze-drier must already have attained below 0 °C before placing the samples into it to avoid thawing the samples.
 3.3. Extraction of Callose from the Banana Samples (Time to Completion: 1 h)
- Allow the tube to cool to room temperature (approximately 5 min) and centrifuge at 12,000 rpm for 5 min.
- OPTIONAL STEP Transfer the supernatant (callose extract) to a sterile 2 mL eppendorf tube and dilute the leaves, pseudostems and corms with the blocking buffer (see Reagents Setup) at a ratio of 1:1, 1:1 and 1:2, respectively. The callose extract may or may not be diluted. Once required, dilution should be done in the blocking buffer and the dilution ratio needs to be optimized for different sample types to get absorbance that lies within the range of the standard curve.
PAUSE STEP The callose extract can be stored at −20 °C for up to 6 months with minimal freeze–thaw cycles. Thaw to room temperature before use.3.4. Preparation of Laminarin Standards and Blank (Time to Completion: 2 h)
- Incubate the resultant suspension of the standard at 80 °C in a water bath, with gentle shaking intervals, until all the laminarin dissolves (approximately 20–40 min).
- Cool the dissolved standard to room temperature (approximately 10 min).
- Using the blocking buffer (see Reagents Setup), prepare laminarin standards at concentrations of 80, 60, 40, 20, 10, 1, 0.5, 0.1 and 0.01 mg/mL from the concentrated stock of 100 mg/mL.
- Prepare the blank by mixing 1 M NaOH and the blocking buffer (see Reagents Setup) at a ratio of 1:2 (Use the dilution ratio used in Section 3.3, Step 3 above, for callose extract, if dilution is required).
PAUSE STEP The laminarin standards and the blank can be stored at −20 °C for up to 6 months with minimal freeze–thawing cycles. Thaw to room temperature before use.3.5. Quantification of Callose by S-ELISA (Time to Completion: 4 Days)
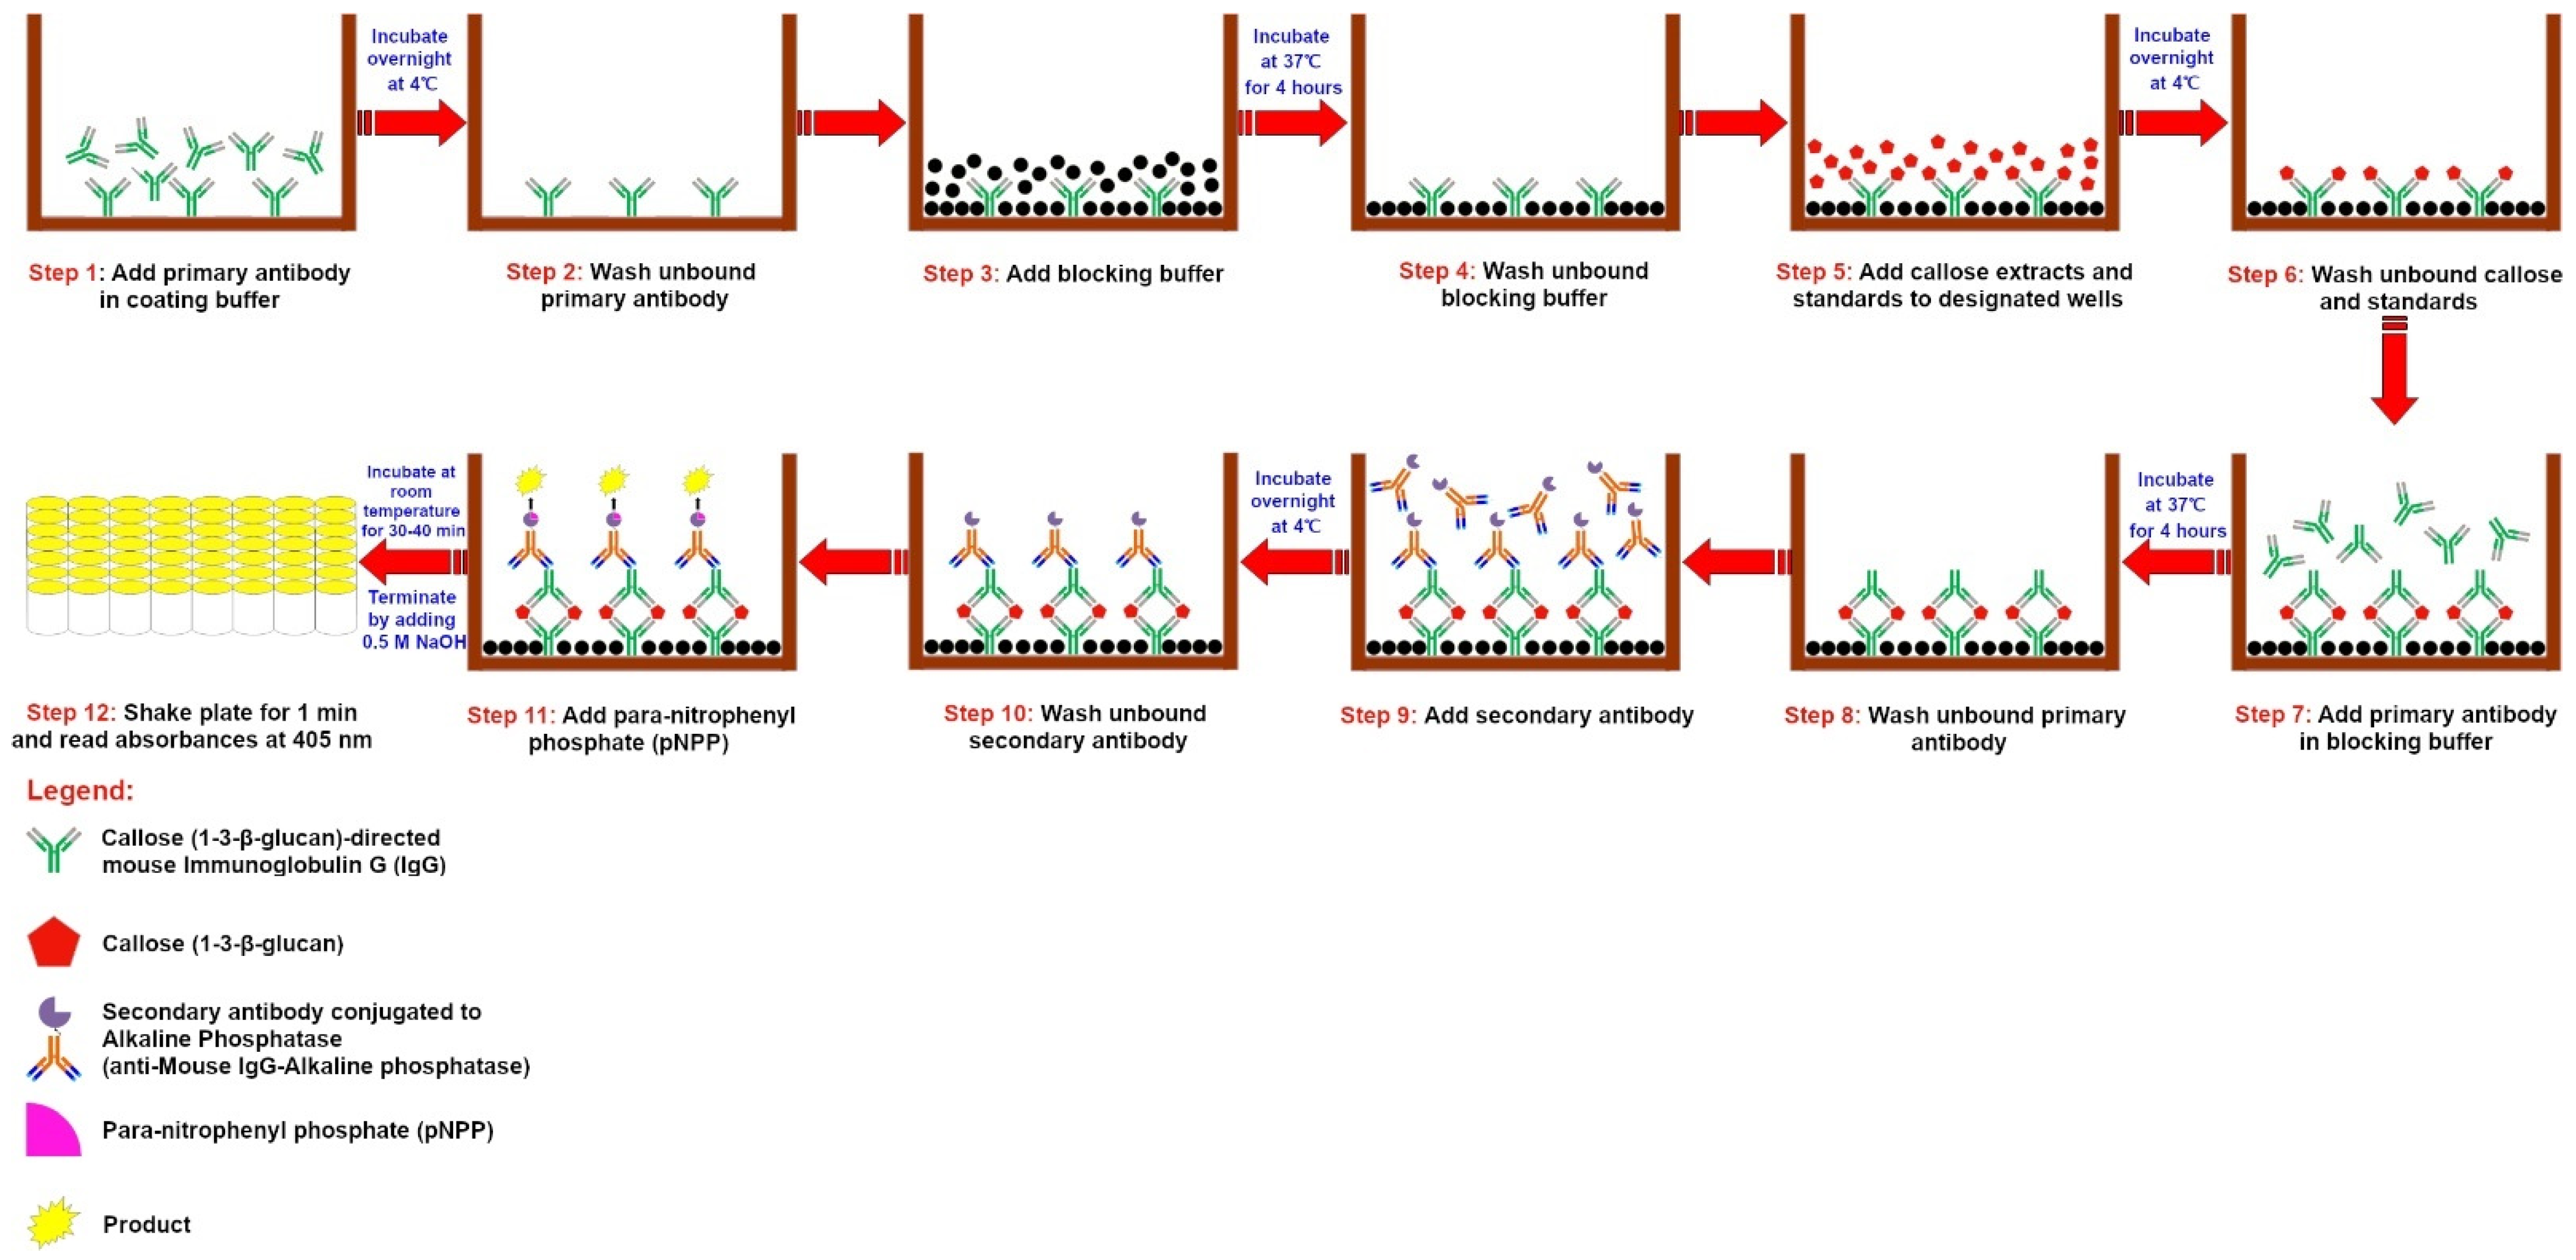
- Add 100 μL of the primary antibody (1-3-β-glucan-directed mouse IgG) in a coating buffer (see Reagents Setup) to each of the wells of the plate (Figure 2, Step 1).
- Seal the plate tightly with parafilm and incubate overnight at 4 °C in a refrigerator.
- The next day, place the plate on the bench and allow it to get to room temperature (approximately 10 min).
- Wash the plate by standard blotting and washing procedures [58]. Briefly, add 200 μL of the wash buffer (see Reagents Setup) to the plate, vortex at 500 rpm for 30 sec using MixMate® Digital Shaker (Eppendorf, Hamburg, Germany) and blot on tissue paper. Wash the plate 2 more times (Figure 2, Step 2).
CRITICAL STEP Do not allow the plate to completely dry and use a sterile micropipette tip to remove any bubbles present in the wells without touching the base and walls of the plate.
- 5.
- Add 200 μL of the blocking buffer (see Reagents Setup) to each of the wells of the plate (Figure 2, Step 3).
- 6.
- Seal the plate tightly with parafilm and incubate for 4 h at 37 °C.
- 7.
- Repeat Step 3 and 4 (Figure 2, Step 4).
- 8.
- Add 100 μL of the callose extracts obtained in Section 3.2 above to the designated wells of the plate (Figure 2, Step 5).
- 9.
- Add 100 μL of the laminarin standards obtained in Section 3.4 above to the designated wells of the plate (Figure 2, Step 5).
- 10.
- Add 100 µL of the blank obtained in Section 3.4 above to the designated wells of the plate (Figure 2, Step 5).
- 11.
- Repeat Step 2 to 4 (Figure 2, Step 6).
- 12.
- Add 100 µL of the primary antibody (1-3-β-glucan-directed mouse IgG) in blocking buffer (see Reagents Setup) to each of the wells of the plate (Figure 2, Step 7).
- 13.
- Repeat Step 6, then Step 3 to 4 above (Figure 2, Step 8).
- 14.
- 15.
- Repeat Step 2 to 4 above (Figure 2, Step 10).
- 16.
- Add 100 µL of freshly prepared para-nitrophenyl phosphate (pNPP) solution at a concentration of 1 mg/mL (see Reagents Setup) to each of the wells of the plate (Figure 2, Step 11).
- 17.
- VARIABLE STEP Incubate the plate on bench at room temperature for 30 min [60]. The incubation time may vary depending on the plant samples and standard used. In our case, laminarin had good readings between 20–40 min with best readings at 30 min.
- 18.
- Terminate the reaction by addition of 100 µL of freshly prepared stop solution (0.5 M NaOH) to each of the wells of the plate [60].
- 19.
4. Expected Results
5. Reagents Setup
- Phosphate-buffered saline (PBS), pH 7.4 (1 L) (store at −20 °C for up to 12 months).
- 8.0 g of sodium chloride (NaCl).
- 0.2 g of monobasic potassium phosphate (KH2PO4).
- 1.15 g of dibasic sodium phosphate (Na2HPO4).
- 0.2 g of potassium chloride (KCl).
- 0.2 g of sodium azide (NaN3).
- Dissolve in 900 mL of deionised H2O, adjust pH and make up to 1 L.
- Blocking buffer (1 L) (store at −20 °C for up to 6 months).
- 10 g of bovine serum albumin (BSA) (1% w/v).
- Dissolve in 900 mL of PBS, make up to 1 L with PBS.
- Coating buffer (pH 9.6) (1 L) (store at −20 °C for up to 12 months)
- 1.59 g of sodium carbonate (Na2CO3).
- 2.93 g of sodium bicarbonate (NaHCO3).
- 0.20 g of sodium azide (NaN3).
- Dissolve in 900 mL of deionised H2O, adjust pH and make up to 1 L.
- Primary antibody in coating buffer (store at −20 °C for up to 6 months)
- Reconstitute the lyophilized primary antibody according to manufacturer’s instruction to obtain the concentrated stock.
- Dilute the obtained stock in coating buffer to a working concentration of 2 μg/mL.
- Primary antibody in blocking buffer (store at −20 °C for up to 6 months)
- Reconstitute the lyophilized primary antibody according to manufacturer’s instruction to obtain the concentrated stock.
- Dilute the obtained stock in blocking buffer to a working concentration of 2 μg/mL.
- Wash buffer (1 L) (pH 7.5) (store at −20 °C for up to 12 months).
- 0.5 mL of Tween 20 (0.05% v/v).
- Dissolve in 990 mL of PBS, make up to 1 L with PBS.
- Conjugate buffer (1 L) (store at −20 °C for up to 6 months).
- 2 g of PVP (2% w/v).
- Dissolve in 900 mL of blocking buffer, make up to 1 L with blocking buffer.
- Secondary antibody (100 mL) (store at −20 °C for up to 6 months).
- 100 µL of secondary antibody concentrate.
- 100,000 µL of conjugate buffer (1:1000 ratio).
- Substrate buffer (1 L) (pH 9.8) (store at −20 °C for up to 12 months).
- 97 mL of diethanolamine.
- 600 mL of H2O.
- 0.2 g of sodium azide (NaN3).
- Adjust pH 9.8 and make up to 1 L with H2O.
- Para-nitrophenyl phosphate (pNPP) solution (store at −20 °C for up to 12 months).
Supplementary Materials
Author Contributions
Funding
Institutional Review Board Statement
Informed Consent Statement
Data Availability Statement
Conflicts of Interest
References
- Kelly, R.; Register, E.; Hsu, M.J.; Kurtz, M.; Nielsen, J. Isolation of a gene involved in 1,3-beta-glucan synthesis in Aspergillus nidulans and purification of the corresponding protein. J. Bacteriol. 1996, 178, 4381–4391. [Google Scholar] [CrossRef] [PubMed]
- Piršelová, B.; Matušíková, I. Callose: The plant cell wall polysaccharide with multiple biological functions. Acta Physiol. Plant. 2013, 35, 635–644. [Google Scholar] [CrossRef]
- Nedukha, O. Callose: Localization, functions, and synthesis in plant cells. Cytol. Genet. 2015, 49, 49–57. [Google Scholar] [CrossRef]
- Chen, X.-Y.; Kim, J.-Y. Callose synthesis in higher plants. Plant Signal. Behav. 2009, 4, 489–492. [Google Scholar] [CrossRef] [PubMed]
- Kashyap, A.; Planas-Marquès, M.; Capellades, M.; Valls, M.; Coll, N.S. Blocking intruders: Inducible physico-chemical barriers against plant vascular wilt pathogens. J. Exp. Bot. 2020, 72, 184–198. [Google Scholar] [CrossRef]
- Beckman, C.H.; Mueller, W.C.; Tessier, B.J.; Harrison, N.A. Recognition and callose deposition in response to vascular infection in Fusarium wilt-resistant or susceptible tomato plants. Physiol. Plant Pathol. 1982, 20, 1–10. [Google Scholar] [CrossRef]
- Cohen, Y.; Eyal, H.; Hanania, J. Ultrastructure, autofluorescence, callose deposition and lignification in susceptible and resistant muskmelon leaves infected with the powdery mildew fungus Sphaerotheca fuliginea. Physiol. Mol. Plant Pathol. 1990, 36, 191–204. [Google Scholar] [CrossRef]
- Underwood, W. The plant cell wall: A dynamic barrier against pathogen invasion. Front. Plant Sci. 2012, 3, 85. [Google Scholar] [CrossRef]
- Malinovsky, F.G.; Fangel, J.U.; Willats, W.G.T. The role of the cell wall in plant immunity. Front. Plant Sci. 2014, 5, 178. [Google Scholar] [CrossRef]
- Voigt, C.A. Callose-mediated resistance to pathogenic intruders in plant defense-related papillae. Front. Plant Sci. 2014, 5, 168. [Google Scholar] [CrossRef]
- Stone, B.A.; Clarke, A.E. Chemistry and Physiology of Higher Plant (1-3)-β-glucans (Callose); Stone, B.A., Clarke, A.E., Eds.; La Trobe University Press: Melbourne, Victoria, Australia, 1992. [Google Scholar]
- Nishimura, M.T.; Stein, M.; Hou, B.-H.; Vogel, J.P.; Edwards, H.; Somerville, S.C. Loss of a callose synthase results in salicylic acid-dependent disease resistance. Science 2003, 301, 969–972. [Google Scholar] [CrossRef] [PubMed]
- Ellinger, D.; Voigt, C.A. Callose biosynthesis in arabidopsis with a focus on pathogen response: What we have learned within the last decade. Ann. Bot. 2014, 114, 1349–1358. [Google Scholar] [CrossRef] [PubMed]
- Cheval, C.; Faulkner, C. Plasmodesmal regulation during plant–pathogen interactions. New Phytol. 2018, 217, 62–67. [Google Scholar] [CrossRef] [PubMed]
- Zavaliev, R.; Ueki, S.; Epel, B.L.; Citovsky, V. Biology of callose (β-1,3-glucan) turnover at plasmodesmata. Protoplasma 2011, 248, 117–130. [Google Scholar] [CrossRef] [PubMed]
- Zhou, J.; Spallek, T.; Faulkner, C.; Robatzek, S. CalloseMeasurer: A novel software solution to measure callose deposition and recognise spreading callose patterns. Plant Methods 2012, 8, 49. [Google Scholar] [CrossRef]
- Yun, M.H.; Torres, P.S.; Oirdi, M.E.; Rigano, L.A.; Gonzalez-Lamothe, R.; Marano, M.R.; Castagnaro, A.P.; Dankert, M.A.; Bouarab, K.; Vojnov, A.A. Xanthan induces plant susceptibility by suppressing callose deposition. Plant Physiol. 2006, 141, 178–187. [Google Scholar] [CrossRef]
- Voigt, C.A.; Schäfer, W.; Salomon, S. A comprehensive view on organ-specific callose synthesis in wheat (Triticum aestivum L.): Glucan synthase-like gene expression, callose synthase activity, callose quantification and deposition. Plant Physiol. Biochem. 2006, 44, 242–247. [Google Scholar] [CrossRef]
- Schenk, S.T.; Schikora, A. Staining of callose depositions in root and leaf tissues. Bio-Protocol 2015, 5, e1429. [Google Scholar] [CrossRef]
- Radford, J.E.; Vesk, M.; Overall, R.L. Callose deposition at plasmodesmata. Protoplasma 1998, 201, 30–37. [Google Scholar] [CrossRef]
- Piršelová, B.; Mistríková, V.; Libantová, J.; Moravčíková, J.; Matušíková, I. Study on metal-triggered callose deposition in roots of maize and soybean. Biologia 2012, 67, 698–705. [Google Scholar] [CrossRef]
- Mason, K.N.; Ekanayake, G.; Heese, A. Chapter 10—Staining and automated image quantification of callose in Arabidopsis cotyledons and leaves. In Methods in Cell Biology; Anderson, C.T., Haswell, E.S., Dixit, R., Eds.; Academic Press: Cambridge, MA, USA, 2020; pp. 181–199. [Google Scholar]
- Luna, E.; Pastor, V.; Robert, J.; Flors, V.; Mauch-Mani, B.; Ton, J. Callose deposition: A multifaceted plant defense response. Am. Phytopathol. Soc. 2011, 24, 183–193. [Google Scholar] [CrossRef] [PubMed]
- Leslie, M.E.; Rogers, S.W.; Heese, A. Increased callose deposition in plants lacking DYNAMIN-RELATED PROTEIN 2B is dependent upon POWDERY MILDEW RESISTANT 4. Plant Signal. Behav. 2016, 11, e1244594. [Google Scholar] [CrossRef] [PubMed]
- Kohari, M.; Yashima, K.; Desaki, Y.; Shibuya, N. Quantification of stimulus-induced callose spots on plant materials. Plant Biotechnol. 2016, 33, 11–17. [Google Scholar] [CrossRef]
- Chowdhury, J.; Henderson, M.; Schweizer, P.; Burton, R.A.; Fincher, G.B.; Little, A. Differential accumulation of callose, arabinoxylan and cellulose in nonpenetrated versus penetrated papillae on leaves of barley infected with Blumeria graminis f. sp. hordei. New Phytol. 2014, 204, 650–660. [Google Scholar] [CrossRef] [PubMed]
- Currier, H.B.; Strugger, S. Aniline blue and fluorescence microscopy of callose in bulb scales of Allium cepa L. Protoplasma 1956, 45, 552–559. [Google Scholar] [CrossRef]
- Hao, P.; Liu, C.; Wang, Y.; Chen, R.; Tang, M.; Du, B.; Zhu, L.; He, G. Herbivore-induced callose deposition on the sieve plates of rice: An important mechanism for host resistance. Plant Physiol. 2008, 146, 1810–1820. [Google Scholar] [CrossRef]
- Herburger, K.; Holzinger, A. Localization and quantification of callose in the streptophyte green algae Zygnema and Klebsormidium: Correlation with desiccation tolerance. Plant Cell Physiol. 2015, 56, 2259–2270. [Google Scholar]
- Herburger, K.; Holzinger, A. Aniline blue and Calcofluor white staining of callose and cellulose in the streptophyte green algae Zygnema and Klebsormidium. Bio-Protocol 2016, 6, e1969. [Google Scholar] [CrossRef]
- Ali, M.A.; Abbas, A.; Kreil, D.P.; Bohlmann, H. Overexpression of the transcription factor RAP2.6 leads to enhanced callose deposition in syncytia and enhanced resistance against the beet cyst nematode Heterodera schachtii in Arabidopsis roots. BMC Plant Biol. 2013, 13, 47. [Google Scholar] [CrossRef]
- Barratt, D.H.P.; Kölling, K.; Graf, A.; Pike, M.; Calder, G.; Findlay, K.; Zeeman, S.C.; Smith, A.M. Callose synthase GSL7 is necessary for normal phloem transport and inflorescence growth in Arabidopsis. Plant Physiol. 2010, 155, 328–341. [Google Scholar] [CrossRef]
- Blümke, A.; Falter, C.; Herrfurth, C.; Sode, B.; Bode, R.; Schäfer, W.; Feussner, I.; Voigt, C.A. Secreted fungal effector lipase releases free fatty acids to inhibit innate immunity-related callose formation during wheat head infection. Plant Physiol. 2014, 165, 346–358. [Google Scholar] [CrossRef] [PubMed]
- Böhlenius, H.; Mørch, S.M.; Godfrey, D.; Nielsen, M.E.; Thordal-Christensen, H. The multivesicular body-localized GTPase ARFA1b/1c is important for callose deposition and ROR2 syntaxin-dependent preinvasive basal defense in barley. Plant Cell 2010, 22, 3831–3844. [Google Scholar] [CrossRef] [PubMed]
- Qin, P.; Ting, D.; Shieh, A.; McCormick, S. Callose plug deposition patterns vary in pollen tubes of Arabidopsis thaliana ecotypes and tomato species. BMC Plant Biol. 2012, 12, 178. [Google Scholar] [CrossRef] [PubMed]
- Oliveira-Garcia, E.; Deising, H.B. Infection structure–specific expression of β-1,3-glucan synthase is essential for pathogenicity of Colletotrichum graminicola and evasion of β-glucan–triggered immunity in maize. Plant Cell 2013, 25, 2356–2378. [Google Scholar] [CrossRef] [PubMed]
- Ellinger, D.; Naumann, M.; Falter, C.; Zwikowics, C.; Jamrow, T.; Manisseri, C.; Somerville, S.C.; Voigt, C.A. Elevated early callose deposition results in complete penetration resistance to powdery mildew in Arabidopsis. Plant Physiol. 2013, 161, 1433–1444. [Google Scholar] [CrossRef]
- Zavaliev, R.; Epel, B. Imaging callose at plasmodesmata using aniline blue: Quantitative confocal microscopy. Methods Mol. Biol. 2015, 1217, 105–119. [Google Scholar]
- Rahnama, M.; Fleetwood, D.J.; Johnson, R.D. Histological methods to detect early-stage plant defense responses during artificial inoculation of Lolium perenne with Epichloë festucae. Bio-Protocol 2021, 11, e4013. [Google Scholar] [CrossRef]
- Schindelin, J.; Arganda-Carreras, I.; Frise, E.; Kaynig, V.; Longair, M.; Pietzsch, T.; Preibisch, S.; Rueden, C.; Saalfeld, S.; Schmid, B.; et al. Fiji: An open-source platform for biological-image analysis. Nat. Methods 2012, 9, 676–682. [Google Scholar] [CrossRef]
- Kimori, Y.; Baba, N.; Morone, N. Extended morphological processing: A practical method for automatic spot detection of biological markers from microscopic images. BMC Bioinform. 2010, 11, 373. [Google Scholar] [CrossRef]
- Tahara, K.; Norisada, M.; Hogetsu, T.; Kojima, K. Aluminum tolerance and aluminum-induced deposition of callose and lignin in the root tips of Melaleuca and Eucalyptus species. J. For. Res. 2005, 10, 325–333. [Google Scholar] [CrossRef]
- Kohler, A.; Schwindling, S.; Conrath, U. Extraction and quantitative determination of callose from Arabidopsis leaves. BioTechniques 2000, 28, 1084–1086. [Google Scholar] [CrossRef]
- Smith, M.M.; McCully, M.E. A critical evaluation of the specificity of aniline blue induced fluorescence. Protoplasma 1978, 95, 229–254. [Google Scholar] [CrossRef]
- Dahiya, P.; Brewin, N.J. Immunogold localization of callose and other cell wall components in pea nodule transfer cells. Protoplasma 2000, 214, 210–218. [Google Scholar] [CrossRef]
- Meikle, P.J.; Bonig, I.; Hoogenraad, N.J.; Clarke, A.E.; Stone, B.A. The location of (1→3)-β-glucans in the walls of pollen tubes of Nicotiana alata using a (1→3)-β-glucan-specific monoclonal antibody. Planta 1991, 185, 1–8. [Google Scholar] [CrossRef] [PubMed]
- Shedletzky, E.; Unger, C.; Delmer, D.P. A microtiter-based fluorescence assay for (1,3)-β-glucan synthases. Anal. Biochem. 1997, 249, 88–93. [Google Scholar] [CrossRef]
- Siefert, F.; Grossmann, K. Induction of chitinase and β-1,3-glucanase activity in sunflower suspension cells in response to an elicitor from Phytophthora megasperma f. sp. glycinea (Pmg). Evidence for regulation by ethylene and 1-aminocyclopropane-1-carboxylic acid (ACC). J. Exp. Bot. 1997, 48, 2023–2029. [Google Scholar] [CrossRef]
- Ssekiwoko, F.; Tushemereirwe, W.K.; Batte, M.; Ragama, P.E.; Kumakech, A. Reaction of banana germplasm to inoculum with Xanthomonas campestris pv. musacearum. Afr. Crop Sci. J. 2006, 14, 151–156. [Google Scholar]
- Mustafa, A.S.; Tugume, B.; Ssenku, J.; Ssemanda, P.; Athman, S.; Oryem-Origa, H.; Kubiriba, J.; Dinesh-Kumar, S.; Tugume, A. Xanthomonas campestris pv. musacearum bacterial infection induces organ-specific callose and hydrogen peroxide production in banana. PhytoFrontier 2022. [Google Scholar] [CrossRef]
- de Castro, M.D.; Izquierdo, A. Lyophilization: A useful approach to the automation of analytical processes? J. Autom. Chem. 1990, 12, 267–279. [Google Scholar] [CrossRef]
- Pearson, G.; Lago-Leston, A.; Valente, M.; Serrão, E. Simple and rapid RNA extraction from freeze-dried tissue of brown algae and seagrasses. Eur. J. Phycol. 2006, 41, 97–104. [Google Scholar] [CrossRef]
- Khaledi, N.; Taheri, P.; Falahati-Rastegar, M. Evaluation of resistance and the role of some defense responses in wheat cultivars to Fusarium head blight. J. Plant Prot. Res. 2018, 57, 398–408. [Google Scholar] [CrossRef][Green Version]
- Zhang, H.; Shi, W.L.; You, J.F.; Di Bian, M.; Qin, X.M.; Yu, H.; Liu, Q.; Ryan, P.R.; Yang, Z.M. Transgenic Arabidopsis thaliana plants expressing a β-1,3-glucanase from sweet sorghum (Sorghum bicolor L.) show reduced callose deposition and increased tolerance to aluminium toxicity. Plant Cell Environ. 2015, 38, 1178–1188. [Google Scholar] [CrossRef] [PubMed]
- Nelson, T.E.; Lewis, B.A. Separation and characterization of the soluble and insoluble components of insoluble laminaran. Carbohydr. Res. 1974, 33, 63–74. [Google Scholar] [CrossRef]
- Zvyagintseva, T.N.; Shevchenko, N.M.; Popivnich, I.B.; Isakov, V.V.; Scobun, A.S.; Sundukova, E.V.; Elyakova, L.A. A new procedure for the separation of water-soluble polysaccharides from brown seaweeds. Carbohydr. Res. 1999, 322, 32–39. [Google Scholar] [CrossRef]
- Rioux, L.E.; Turgeon, S.L.; Beaulieu, M. Characterization of polysaccharides extracted from brown seaweeds. Carbohydr. Polym. 2007, 69, 530–537. [Google Scholar] [CrossRef]
- Hosseini, S.; Vázquez-Villegas, P.; Rito-Palomares, M.; Martinez-Chapa, S.O. Enzyme-Linked Immunosorbent Assay (ELISA) from A to Z; Kumar, A., Rao, A.A., Eds.; Singapore 189721; Springer Nature: Singapore, 2018. [Google Scholar]
- Engvall, E.; Perlmann, P. Enzyme-linked immunosorbent assay (ELISA). Quantitative assay of immunoglobulin G. Immunochemistry 1971, 8, 871–874. [Google Scholar] [CrossRef]
- Reen, D.J. Enzyme-Linked Immunosorbent Assay (ELISA). In Basic Protein and Peptide Protocols; Walker, J.M., Ed.; Humana Press: Totowa, NJ, USA, 1994; pp. 461–466. [Google Scholar]
- Team, R.C. R: A Language and Environment for Statistical Computing, R version 3.6.3 ed.; R Foundation for Statistical Computing: Vienna, Austria, 2020. [Google Scholar]


Publisher’s Note: MDPI stays neutral with regard to jurisdictional claims in published maps and institutional affiliations. |
© 2022 by the authors. Licensee MDPI, Basel, Switzerland. This article is an open access article distributed under the terms and conditions of the Creative Commons Attribution (CC BY) license (https://creativecommons.org/licenses/by/4.0/).
Share and Cite
Mustafa, A.S.; Ssenku, J.E.; Ssemanda, P.; Ntambi, S.; Dinesh-Kumar, S.P.; Tugume, A.K. Sandwich Enzyme-Linked Immunosorbent Assay for Quantification of Callose. Methods Protoc. 2022, 5, 54. https://doi.org/10.3390/mps5040054
Mustafa AS, Ssenku JE, Ssemanda P, Ntambi S, Dinesh-Kumar SP, Tugume AK. Sandwich Enzyme-Linked Immunosorbent Assay for Quantification of Callose. Methods and Protocols. 2022; 5(4):54. https://doi.org/10.3390/mps5040054
Chicago/Turabian StyleMustafa, Abubakar S., Jamilu E. Ssenku, Paul Ssemanda, Saidi Ntambi, Savithramma P. Dinesh-Kumar, and Arthur K. Tugume. 2022. "Sandwich Enzyme-Linked Immunosorbent Assay for Quantification of Callose" Methods and Protocols 5, no. 4: 54. https://doi.org/10.3390/mps5040054
APA StyleMustafa, A. S., Ssenku, J. E., Ssemanda, P., Ntambi, S., Dinesh-Kumar, S. P., & Tugume, A. K. (2022). Sandwich Enzyme-Linked Immunosorbent Assay for Quantification of Callose. Methods and Protocols, 5(4), 54. https://doi.org/10.3390/mps5040054