Validation of Total Mercury in Marine Sediment and Biological Samples, Using Cold Vapour Atomic Absorption Spectrometry

 , ,
, ,  , and
, and
Abstract
:1. Introduction
2. Material and Methods
2.1. Apparatus, Chemicals, and Reagents
2.2. Sample Preparation
2.3. Sample Analysis
3. Results and Discussion
3.1. Method Validation
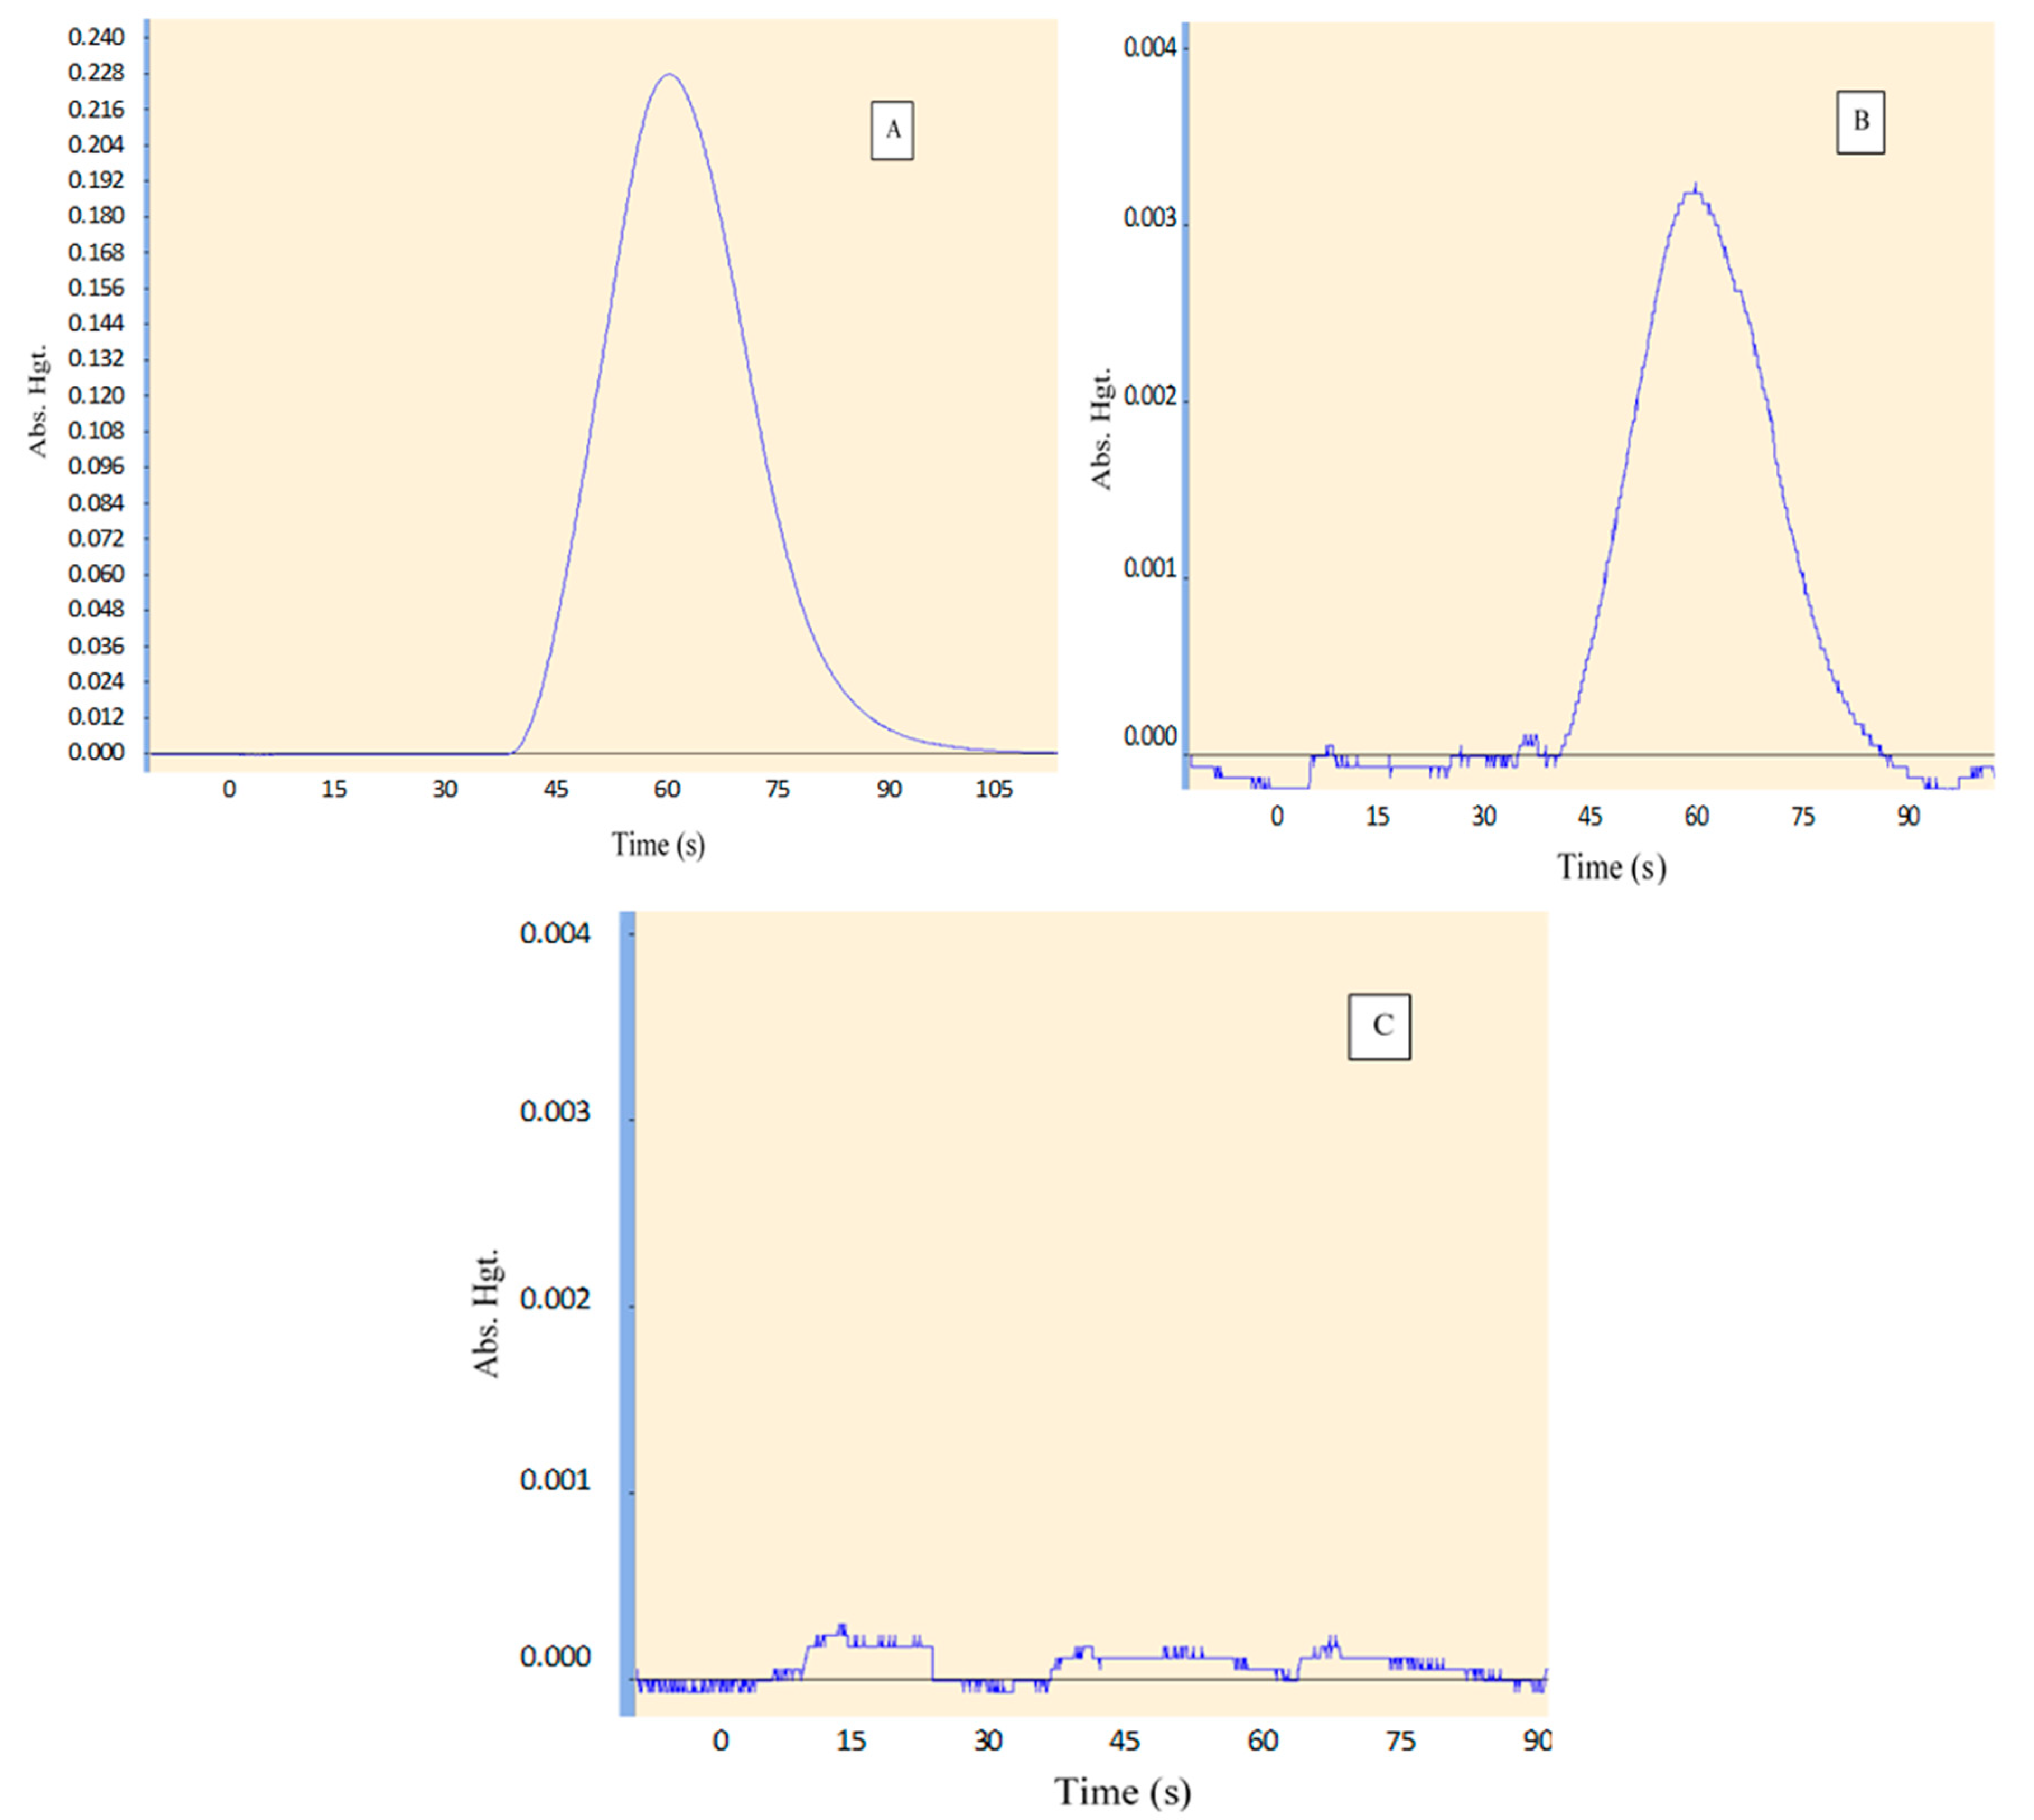
3.1.1. Selectivity
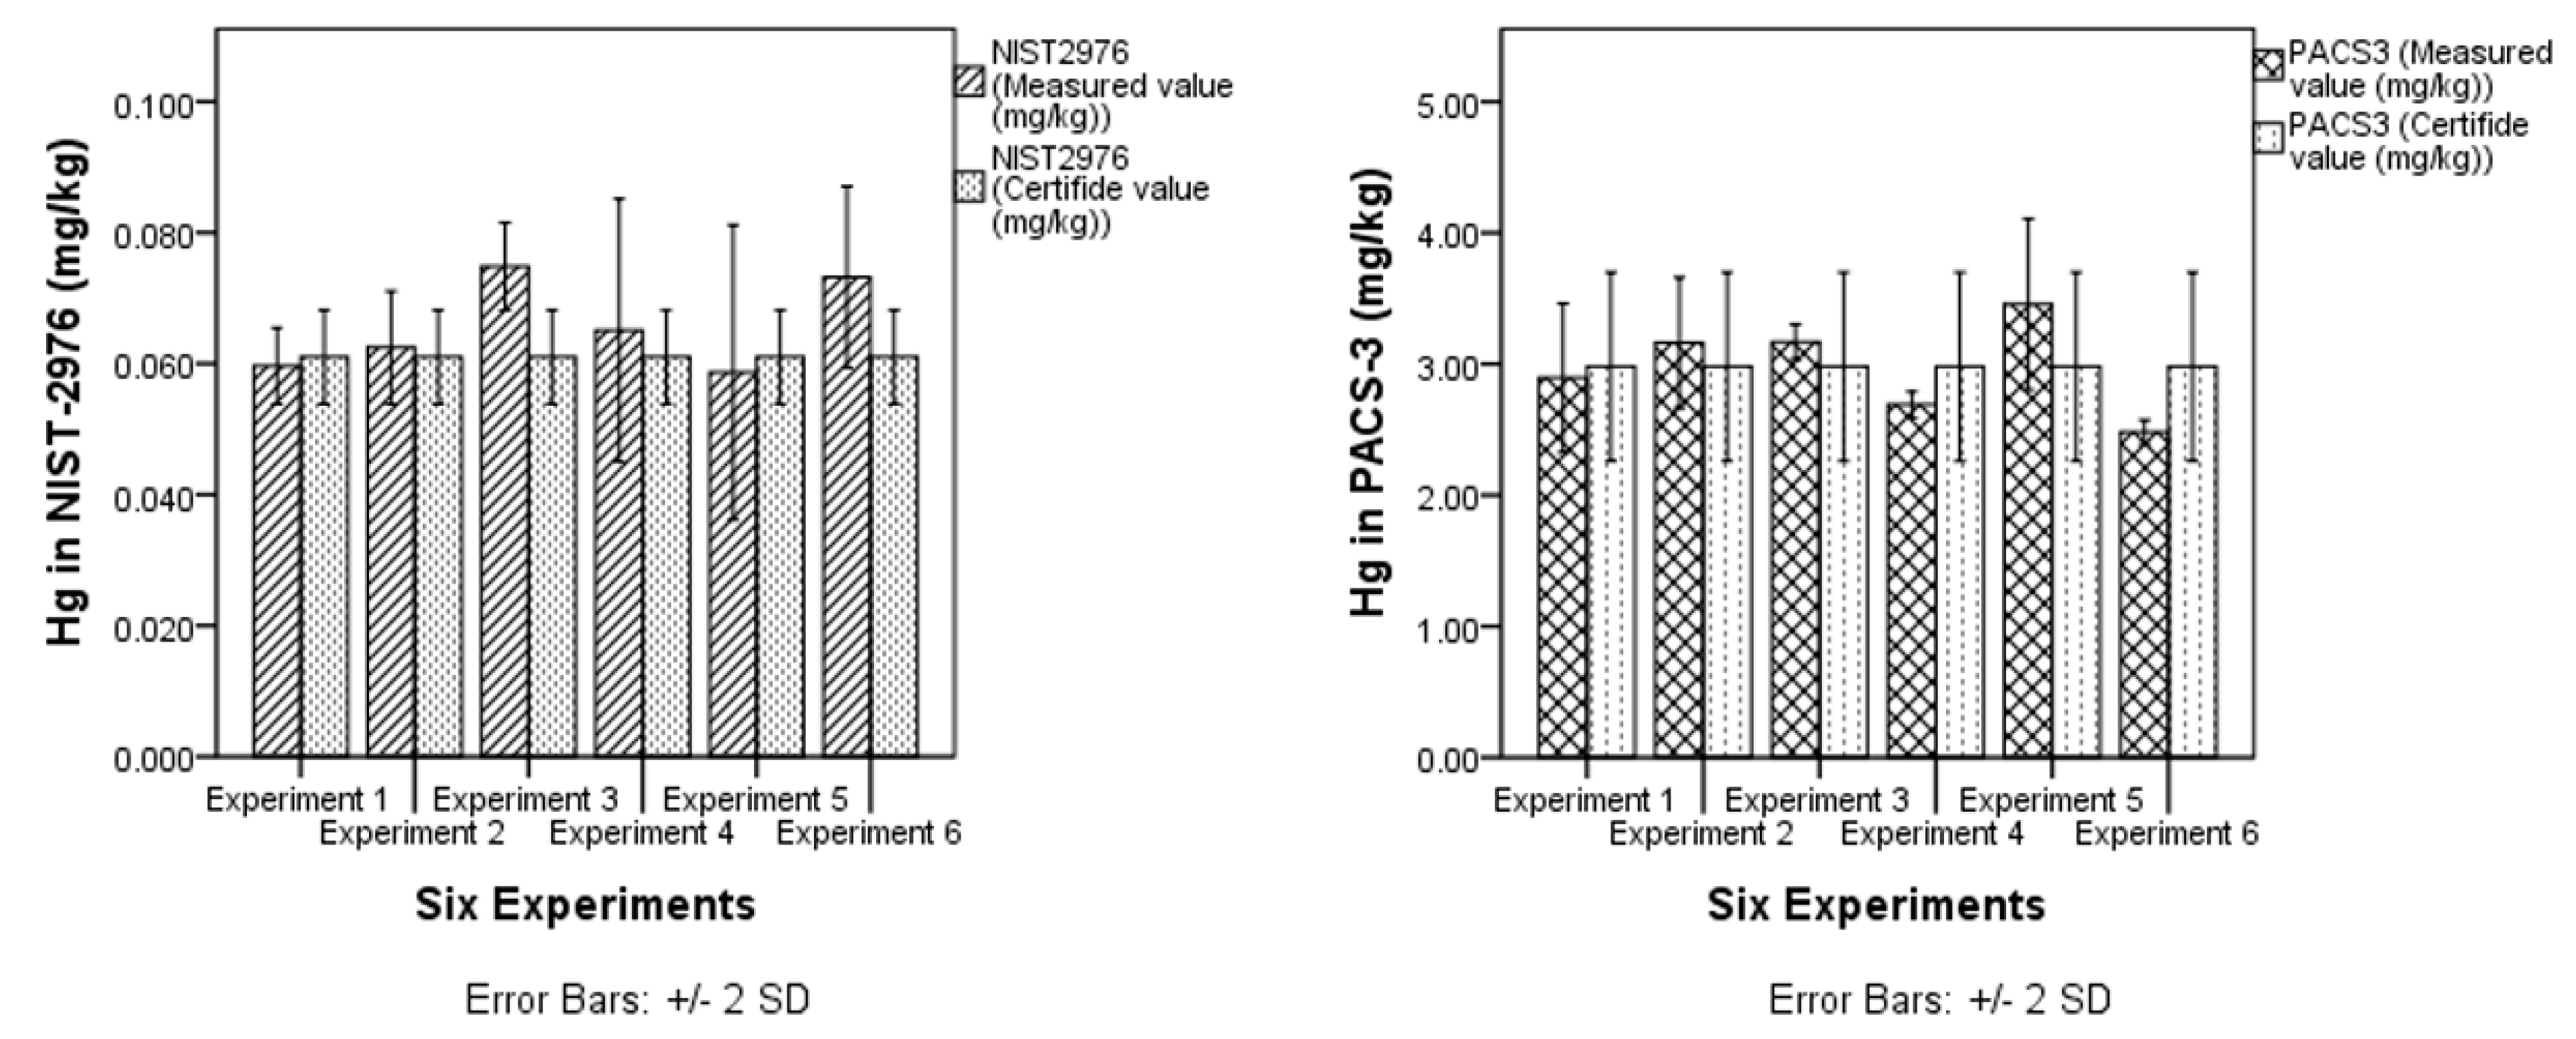
3.1.2. Trueness
3.1.3. Recovery and Matrix Effects
3.1.4. Precision
Repeatability
Intermediate Precision
3.1.5. Limit of Detection and Limit of Quantitation
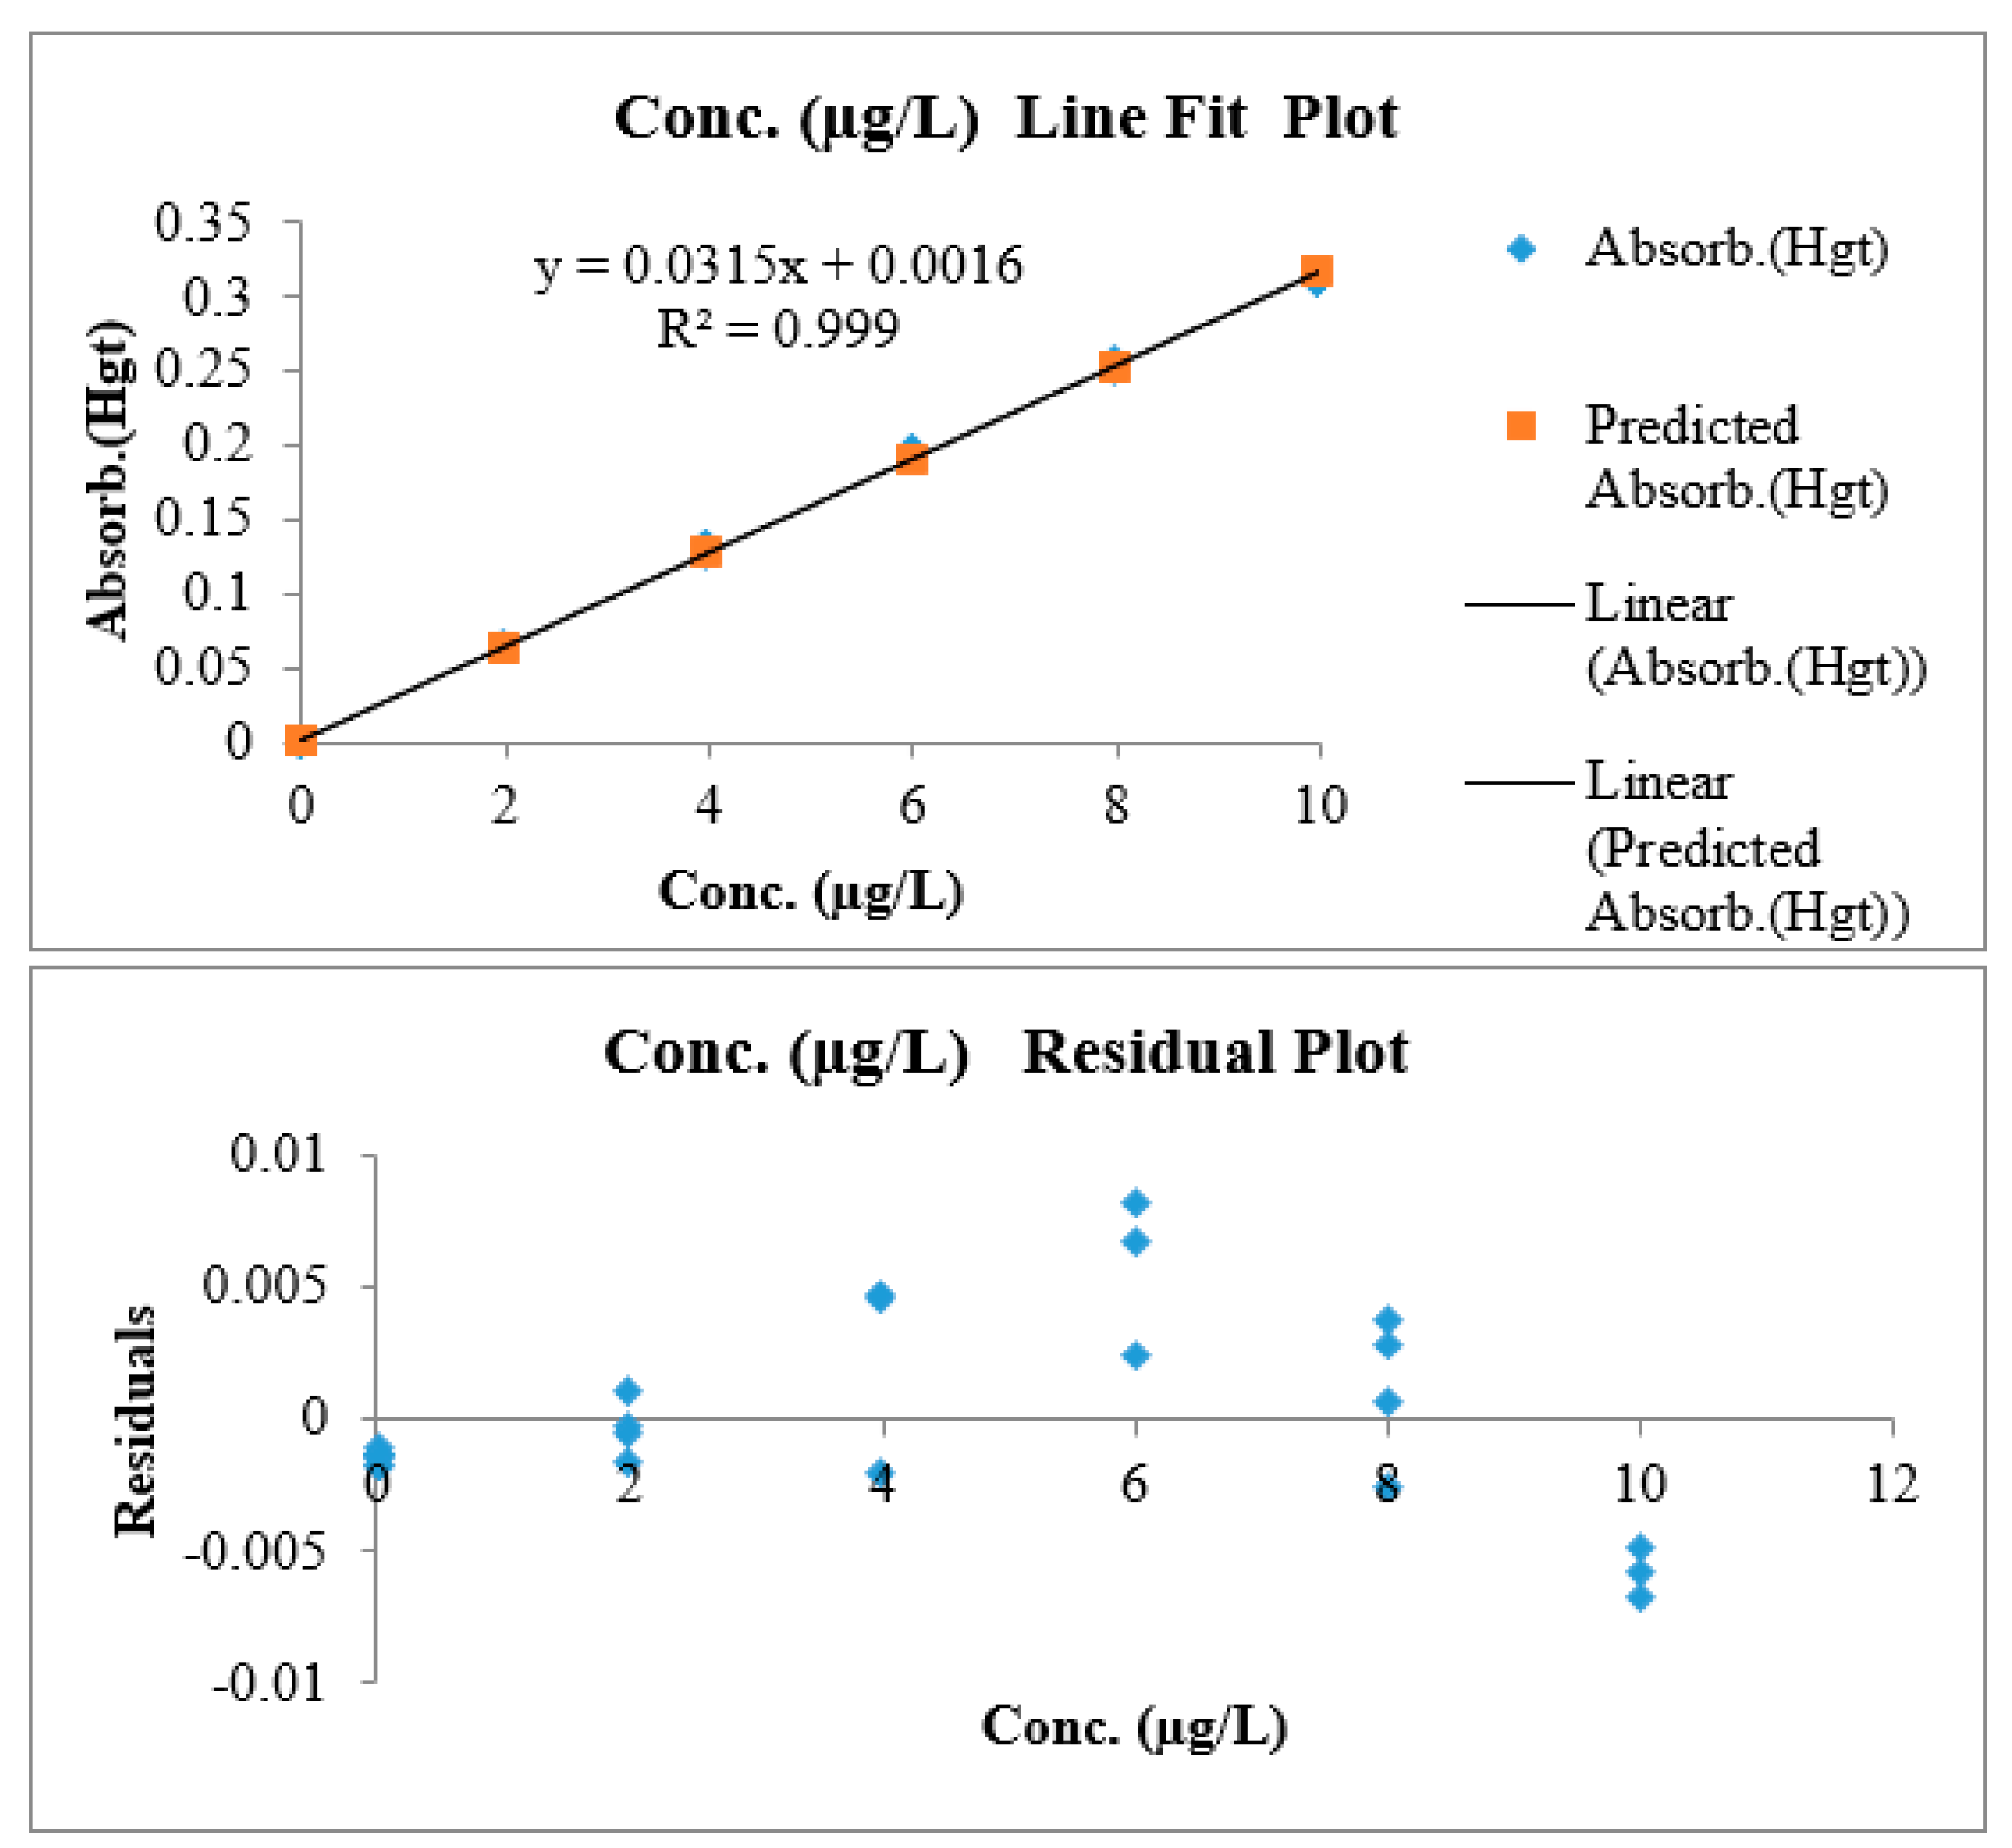
3.1.6. Linearity and Working Range
3.1.7. Ruggedness
4. Estimation of the Measurement Uncertainty (Quantifying Uncertainty in Analytical Measurement)
5. Validation Characteristics Evaluation
6. Conclusions
Author Contributions
Funding
Acknowledgments
Conflicts of Interest
References
- Risher, J.F.; Amler, S.N. Mercury exposure: Evaluation and intervention. The inappropriate use of chelating agents in the diagnosis and treatment of putative mercury poisoning. Neurotoxicology 2005, 26, 691–699. [Google Scholar] [CrossRef] [PubMed]
- Kopyc, E.B.E.; Pyrzysnska, K.; Garbos, S. Determination of Mercury by Cold-Vapor Atomic Absorption Spectrometry with Preconcentration on a Gold-Trap. Anal. Sci. 2000, 16, 1309–1312. [Google Scholar] [CrossRef]
- Drennan-Harris, L.R.; Wongwilawan, S.; Tyson, J.F. Trace determination of total mercury in rice by conventional inductively coupled plasma mass spectrometry. J. Anal. At. Spectrom. 2013, 28, 259–265. [Google Scholar] [CrossRef] [Green Version]
- Nascimento Neto, A.P.; Costa, L.C.; Kikuchi, A.N.; Furtado, D.M.; Araujo, M.Q.; Melo, M.C. Method validation for the determination of total mercury in fish muscle by cold vapour atomic absorption spectrometry. Food Addit. Contam. Part A 2012, 29, 617–624. [Google Scholar] [CrossRef] [PubMed]
- Mercury Instruments. AULA-254 Gold—Mercury Instruments—PDF Catalogue|Technical Documentation|Brochure. Available online: http://pdf.directindustry.com/pdf/mercury-instruments/aula-254-gold/187731-692409-_5.html (accessed on 20 August 2018).
- Tobergte, D.R.; Curtis, S. Microwave assisted acid digestion of sileceous and organically based matrices. J. Chem. Inf. Model. 2013, 53, 1689–1699. [Google Scholar]
- USEPA. Mercury in Sediment and Tissue Samples by Atomic Fluorescence Spectrometry; USEPA: Washington, DC, USA, 2007; pp. 1–19.
- O’Kelly, B.C. Oven-Drying Characteristics of Soils of Different Origins. Dry. Technol. 2007, 23, 1141–1149. [Google Scholar] [CrossRef]
- Obi, O.F.; Ezeoha, S.L.; Egwu, C.O. Evaluation of air oven moisture content determination procedures for pearl millet (Pennisetum glaucum L.). Int. J. Food Prop. 2016, 19, 454–466. [Google Scholar] [CrossRef]
- Eurachem. Guide to Quality in Analytical Chemistry an Aid to Accreditation; Eurachem: Middlesex, UK, 2016. [Google Scholar]
- Thompson, M.; Ellison, S.L.R.; Wood, R. Harmonized guidelines for single-laboratory validation of methods of analysis. Pure Appl. Chem. 2002, 74, 835–855. [Google Scholar] [CrossRef]
- USEPA. Mercury (Manual Cold Vapor Technique); USEPA: Washington, DC, USA, 1974; pp. 2–7.
- USEPA. Method 245.1: Determination of Mercury in Water by Cold Vapor Atomic Absorption Spectrometry; USEPA: Washington, DC, USA, 1994; Volume 2, pp. 1–18.
- Murphy, J.; Jones, P.; Hill, S.J. Determination of total mercury in environmental and biological samples by flow injection cold vapour atomic absorption spectrometry. Spectrochim. Acta Part B At. Spectrosc. 1996, 51, 1867–1873. [Google Scholar] [CrossRef]
- USEPA. EPA Method 7473 (SW-846): Mercury in Solids and Solutions by Thermal Decompostion, Amalgamation, and Atomic Absorption Spectrophotometry; USEPA: Washington, DC, USA, 1998.
- Eurachem. The Fitness for Purpose of Analytical Methods; Eurachem: Middlesex, UK, 2014. [Google Scholar]
- University of Tartu. Repeatability, Intermediate Precision and Reproducibility. Available online: https://sisu.ut.ee/lcms_method_validation/41-precision-trueness-accuracy (accessed on 26 June 2018).
- Miller, F.R.; Neill, J.W. Lack of fit tests for linear regression models with many predictor variables using minimal weighted maximal matchings. J. Multivar. Anal. 2016, 150, 14–26. [Google Scholar] [CrossRef]
- Analytical Methods Committee. Experimental design and optimisation (4): Plackett–Burman designs. Anal. Methods 2013, 5, 1901–1903. [Google Scholar] [CrossRef]
- Citac and Eurachem. Quantifying Uncertainty in Analytical Measurement, 2nd ed.; Citac and Eurachem: London, UK, 2000. [Google Scholar]
- NMKL. Guide in Validation of Alternative Proprietary Chemical Methods. Available online: http://www.aoac.org/aoac_prod_imis/AOAC_Docs/ISPAM/3.9NordValprotocolproprietarychemicalanalysis.pdf (accessed on 26 June 2018).
- Kruve, A.; Rebane, R.; Kipper, K.; Oldekop, M.-L.; Evard, H.; Herodes, K.; Ravio, P.; Leito, I. Tutorial review on validation of liquid chromatography–mass spectrometry methods: Part II. Anal. Chim. Acta 2015, 870, 8–28. [Google Scholar] [CrossRef] [PubMed]
- Ripp, J. Analytical Detection Limit Guidance and Laboratory Guide for Determining Method Detection Limits; Wisconsin Department of Natural Resources: Madison, WI, USA, 1996.


| CRM | n | NIST-2976 | Ref. Vale | PACS-3 | Ref. Vale |
|---|---|---|---|---|---|
| Mean value (mg/Kg) | 8 | 0.058 ± 0.002 | 0.061 ± 0.004 | 2.87± 0.15 | 2.98 ± 0.36 |
| CRM(NIST-2976) | CRM(PACS-3) | ||
|---|---|---|---|
| Bias = −0.002 | Bias = −0.28 | ||
| Relative bias = −4% | Relative bias = −9% | ||
| SD = 0.006 | u(lab) = 0.12 | ||
| u(ref) = 0.002 | u(ref) = 0.25 | ||
| |z| | 0.4 | |z| | 1.0 |
| Method | Matrix | Certified Value (µg/kg) | Avg. Measured Value (µg/kg) | Avg. % Rec | No. of Samples | RSD |
|---|---|---|---|---|---|---|
| EPA-7474 | NIST 8406 SED | 60 | 62 | 103% | 70 | 15% |
| NIST 1566 Oyster tissue | 84 | 81 | 97% | 72 | 15% | |
| EPA-7473 | Estuarine Sediment NIST SRM 1646 | 63 | 75 | 119% | N/A | 3% |
| Oyster Tissue NIST SRM 1566a | 64 | 68 | 106% | N/A | 3% |
| Level 1 (0.2 µg/L) | Level 2 (2 µg/L) | Level 3 (8 µg/L) | |
|---|---|---|---|
| Mean | 0.165 | 2.001 | 8.027 |
| SD | 0.008 | 0.030 | 0.077 |
| RSD | 5% | 2% | 1% |
| CRM | Mean/mg/kg | St. Dev. | RSD |
|---|---|---|---|
| PACS3 | 2.784 | 0.143 | 5.10% |
| NIST2976 | 0.062 | 0.003 | 4.80% |
| Slope | Intercept | n | p | Nominator | Denominator | MSSerror | MSSlof |
|---|---|---|---|---|---|---|---|
| 0.0316 | 0.0011 | 7 | 5 | 5 | 28 | 1.0 × 10⁻⁵ | 2.5 × 10⁻⁶ |
| Factor | Low Value (−1) | High Value (+1) | Experiment No. | Positive Effect | Negative Effect | Total Effect | Total Effect % | Mean Measured Values (mg/kg) | Ref. Value (mg/kg) | Recovery % |
| Temp/°C | 100 | 125 | E1 | 3.07 | −2.88 | 0.2 | 7% | |||
| Digestion time/h | 3 | 12 | E2 | 3.17 | −2.78 | 0.39 | 13% | |||
| Dilution volume/mL | 50 | 100 | E3 | 3.17 | −2.78 | 0.39 | 13% | |||
| Sample wt./g | 0.1 | 0.2 | E4 | 2.69 | −3.26 | −0.57 | −19% | |||
| Reagents (HNO3 + H2SO4) mL | 3 + 5 | 6 + 10 | E5 | 2.85 | −3.1 | −0.26 | −9% | 2.97 | 2.98 | 99 |
| Factor | Low Value (−1) | High Value (+1) | Experiment No. | Positive Effect | Negative Effect | Total Effect | Total Effect % | Mean Measured Values (mg/kg) | Ref. Value (mg/kg) | Recovery % |
| Temp/°C | 100 | 125 | E1 | 0.07 | −0.09 | −0.03 | −0.90% | |||
| Digestion time/h | 3 | 12 | E2 | 0.08 | −0.08 | −0.01 | −0.30% | |||
| Dilution volume/mL | 50 | 100 | E3 | 0.08 | −0.08 | 0 | 0.10% | |||
| Sample wt./g | 0.1 | 0.2 | E4 | 0.08 | −0.08 | 0 | −0.20% | |||
| Reagents (HNO3 + H2SO4) mL | 3 + 5 | 6 + 10 | E5 | 0.07 | −0.09 | −0.01 | −0.50% | 0.065 | 0.061 | 107 |
| Sum of Squares | df | Mean Square | F | Sig. | |
|---|---|---|---|---|---|
| Between Groups | 0.006 | 5 | 0.001 | 2.442 | 0.095 |
| Within Groups | 0.006 | 12 | 0.000 | ||
| Total | 0.012 | 17 |
| Sum of Squares | df | Mean Square | F | Sig. | |
|---|---|---|---|---|---|
| Between Groups | 0.370 | 5 | 0.074 | 2.213 | 0.121 |
| Within Groups | 0.401 | 12 | 0.033 | ||
| Total | 0.771 | 17 |
| Source of Uncertainty | Type | Measured Value | Error ± | Unit | uRelative | Probability Distribution | Divisor | Squared Standard Uncertainty (u²) |
|---|---|---|---|---|---|---|---|---|
| Repeatability of prepared 0.6 µg/L CRM | A | 6 × 10⁻⁴ | 5.5 × 10⁻⁶ | mg/L | 9.2 × 10⁻³ | Normal, 1s | 1 | 8.5 × 10⁻⁵ |
| Chemical Reagents purity | B | 1.00 | 5.0 × 10⁻³ | 5.0 × 10⁻³ | Rectangular | 1.73 | 8.4 × 10⁻⁶ | |
| Pipette 1 mL repeatability | A | 1.0 × 10⁻³ | 7.8 × 10⁻⁸ | L | 7.8 × 10⁻⁵ | Normal, 1s | 1 | 6.6 × 10⁻⁹ |
| Temperature effect on Pipette 1 mL Volume | B | 1.0 × 10⁻³ | 4.1 × 10⁻⁷ | L | 4.1 × 10⁻⁴ | Rectangular | 1.73 | 5.6 × 10⁻⁸ |
| Calibration st certificate uncertainty of pipette 1 mL | B | 1.0 × 10⁻³ | 3.4 × 10⁻⁶ | L | 3.4 × 10⁻³ | Triangular | 2.45 | 1.9 × 10⁻⁶ |
| Measuring flask 1 mL repeatability | A | 5.0 × 10⁻² | 4.3 × 10⁻⁶ | L | 8.6 × 10⁻⁵ | Normal, 1s | 1 | 7.4 × 10⁻⁹ |
| Temperature effect on flask 50 mL Volume | B | 5.0 × 10⁻² | 2.0 × 10⁻⁵ | L | 4.1 × 10⁻⁴ | Rectangular | 1.73 | 5.6 × 10⁻⁸ |
| Uncertainty of flask 50 mL | B | 5.0 × 10⁻² | 6.0 × 10⁻⁵ | L | 1.2 × 10⁻³ | Triangular | 2.45 | 2.4 × 10⁻⁷ |
| Concentration of the calibration standard | B | 1001 | 2 | mg/L | 2.0 × 10⁻³ | Normal, 2s | 2 | 1.0 × 10⁻⁶ |
| Tare weight repeatability | A | 100 | 3.7 × 10⁻³ | mg | 3.7 × 10⁻⁵ | Normal, 1s | 1 | 1.3 × 10⁻⁹ |
| Gross weight repeatability | A | 100 | 3.7 × 10⁻³ | mg | 3.7 × 10⁻⁵ | Normal, 1s | 1 | 1.3 × 10⁻⁹ |
| Balance linearity contribution (gross weight) | B | 100 | 0.1 | mg | 1.0 × 10⁻³ | Rectangular | 1.73 | 3.3 × 10⁻⁷ |
| Balance linearity contribution (tare weight) | B | 100 | 0.1 | mg | 1.0 × 10⁻³ | Rectangular | 1.73 | 3.3 × 10⁻⁷ |
| Balance readability (gross weight) | B | 100 | 0.01 | mg | 1.0 × 10⁻⁴ | Rectangular | 1.73 | 3.3 × 10⁻⁹ |
| Balance readability (tare weight) | B | 100 | 0.01 | mg | 1.0 × 10⁻⁴ | Rectangular | 1.73 | 3.3 × 10⁻⁹ |
| Combined standard uc | 0.0098 | |||||||
| Expanded U at 95% confidence interval (k = 2) | 2.0% |
| Parameter | Methodology | Acceptance Criteria | Results | Fulfil the Acceptance Criteria! |
|---|---|---|---|---|
| Selectivity | A specific and sharp peak of Hg produced during CRM analysis with no interferences | No interferences with the analyte peak. | Complies | Yes |
| Trueness | Relative bias was calculated for ten repeated CRMs | Relative bias shall not lie outside the limit of ±10%, and Zeta score shall less than or equal 2 to be satisfactory | Complies | Yes |
| Recovery | Two CRMs were used to calculate Recovery% = Measured value/Reference value. | ±10% of the reference value | Complies | Yes |
| Precision | Repeated CRMs through one day of analysis and intermediate resection over a long time. | Relative standard deviation (RSD) shall not exceed 10% | Complies | Yes |
| Limit of Detection and Limit of Quantitation | Replicates of low-level concentration CRM matrix used to calculate SD (σ). Calculate S/N ratio | Limit of detection (3σ), limit of quantitation (10σ). S/N between 2.5 to 10 | Complies | Yes |
| Linearity: | Independent calibration curves signal used to calculate (FTab) and (FCal). | Lack of fit test (Linear if FCal < FTab) | Complies | Yes |
| Range | The concentration interval over which linearity and accuracy are obtained and yields a precision of ≤3% RSD. | N/A | Complies | N/A |
| Robustness | Various conditions tested using Placket-Burman test for experimental design ruggedness. One-way ANOVA | One-way ANOVA was used as statistical acceptance criteria of robustness at 95% confidence interval | Complies | Yes |
| Uncertainty of measurement | Expanded Uncertainties were considered for in-house Calibration curve (UCal) and sample measurement (Umeasu) to estimate the uncertainty from the main resources affecting the method. | U = k*u% | N/A | - |
© 2018 by the authors. Licensee MDPI, Basel, Switzerland. This article is an open access article distributed under the terms and conditions of the Creative Commons Attribution (CC BY) license (http://creativecommons.org/licenses/by/4.0/).
Share and Cite
Elezz, A.A.; Mustafa Hassan, H.; Abdulla Alsaadi, H.; Easa, A.; Al-Meer, S.; Elsaid, K.; Ghouri, Z.K.; Abdala, A. Validation of Total Mercury in Marine Sediment and Biological Samples, Using Cold Vapour Atomic Absorption Spectrometry. Methods Protoc. 2018, 1, 31. https://doi.org/10.3390/mps1030031
Elezz AA, Mustafa Hassan H, Abdulla Alsaadi H, Easa A, Al-Meer S, Elsaid K, Ghouri ZK, Abdala A. Validation of Total Mercury in Marine Sediment and Biological Samples, Using Cold Vapour Atomic Absorption Spectrometry. Methods and Protocols. 2018; 1(3):31. https://doi.org/10.3390/mps1030031
Chicago/Turabian StyleElezz, Ahmed Abou, Hassan Mustafa Hassan, Hamood Abdulla Alsaadi, Ahmed Easa, Saeed Al-Meer, Khaled Elsaid, Zafar Khan Ghouri, and Ahmed Abdala. 2018. "Validation of Total Mercury in Marine Sediment and Biological Samples, Using Cold Vapour Atomic Absorption Spectrometry" Methods and Protocols 1, no. 3: 31. https://doi.org/10.3390/mps1030031
APA StyleElezz, A. A., Mustafa Hassan, H., Abdulla Alsaadi, H., Easa, A., Al-Meer, S., Elsaid, K., Ghouri, Z. K., & Abdala, A. (2018). Validation of Total Mercury in Marine Sediment and Biological Samples, Using Cold Vapour Atomic Absorption Spectrometry. Methods and Protocols, 1(3), 31. https://doi.org/10.3390/mps1030031