
First Year of TREC-Based National SCID Screening in Sweden

 , , , , , and
Abstract
:1. Introduction
2. Materials and Methods
2.1. Samples
2.2. Screening Assay
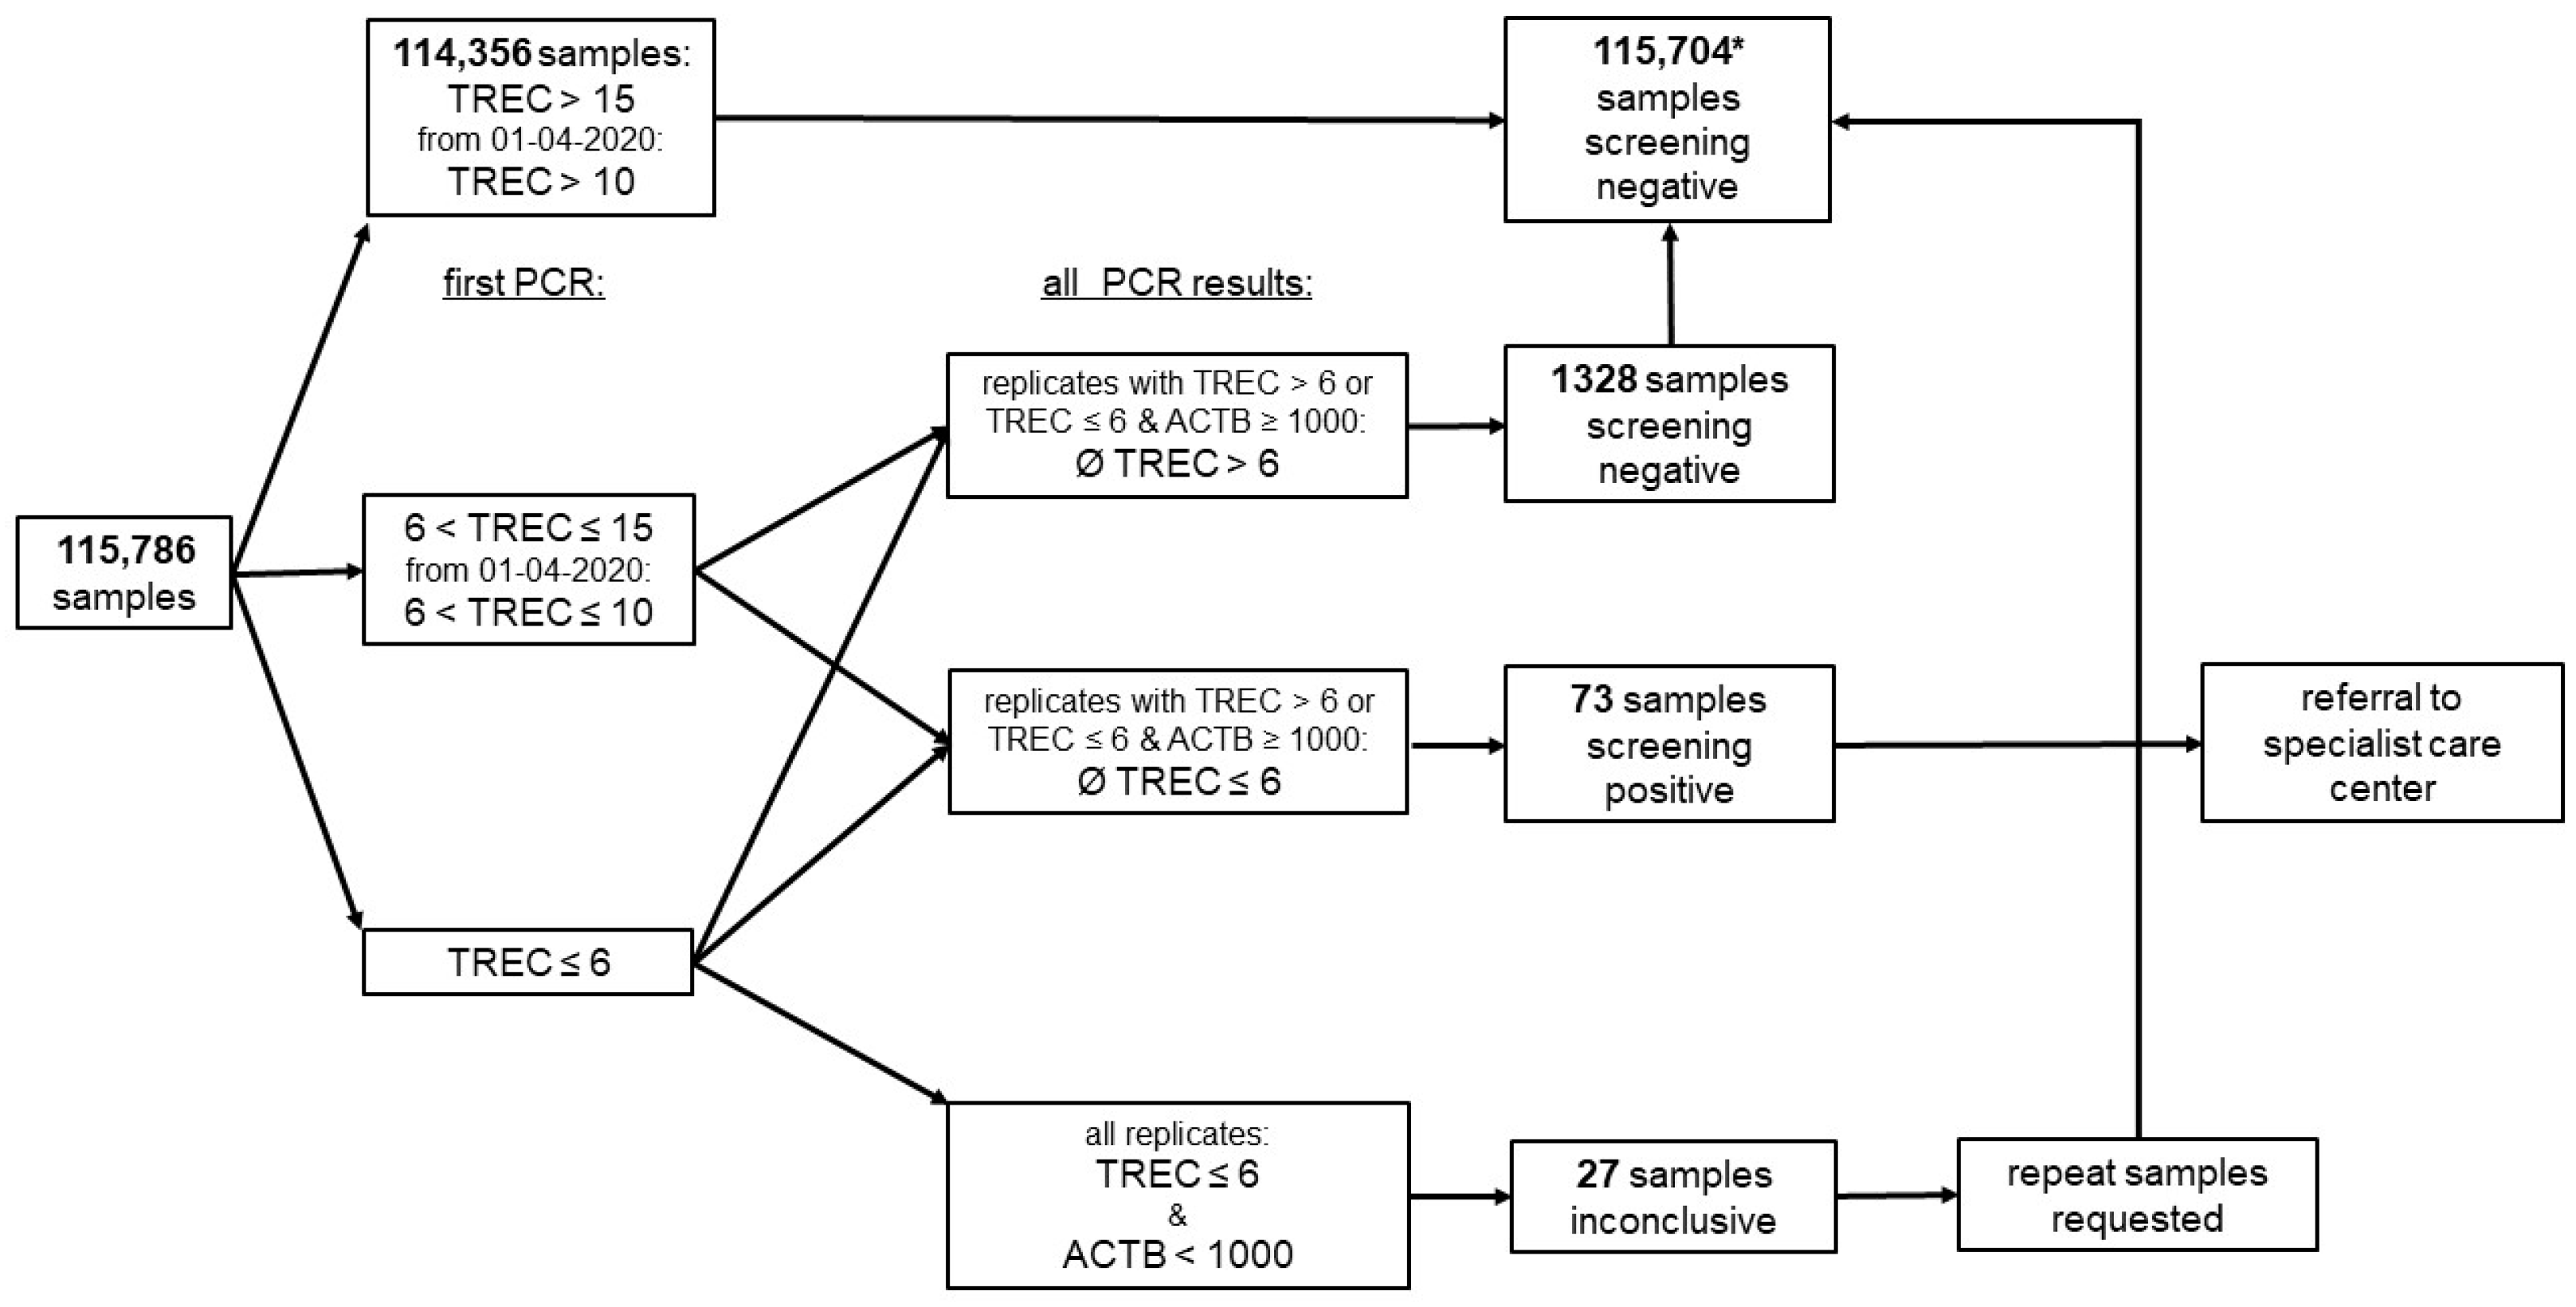
2.3. Screening Algorithm
2.4. Clinical Procedures
2.5. Quality Control
2.6. Data Curation, Analysis, and Statistics
3. Results
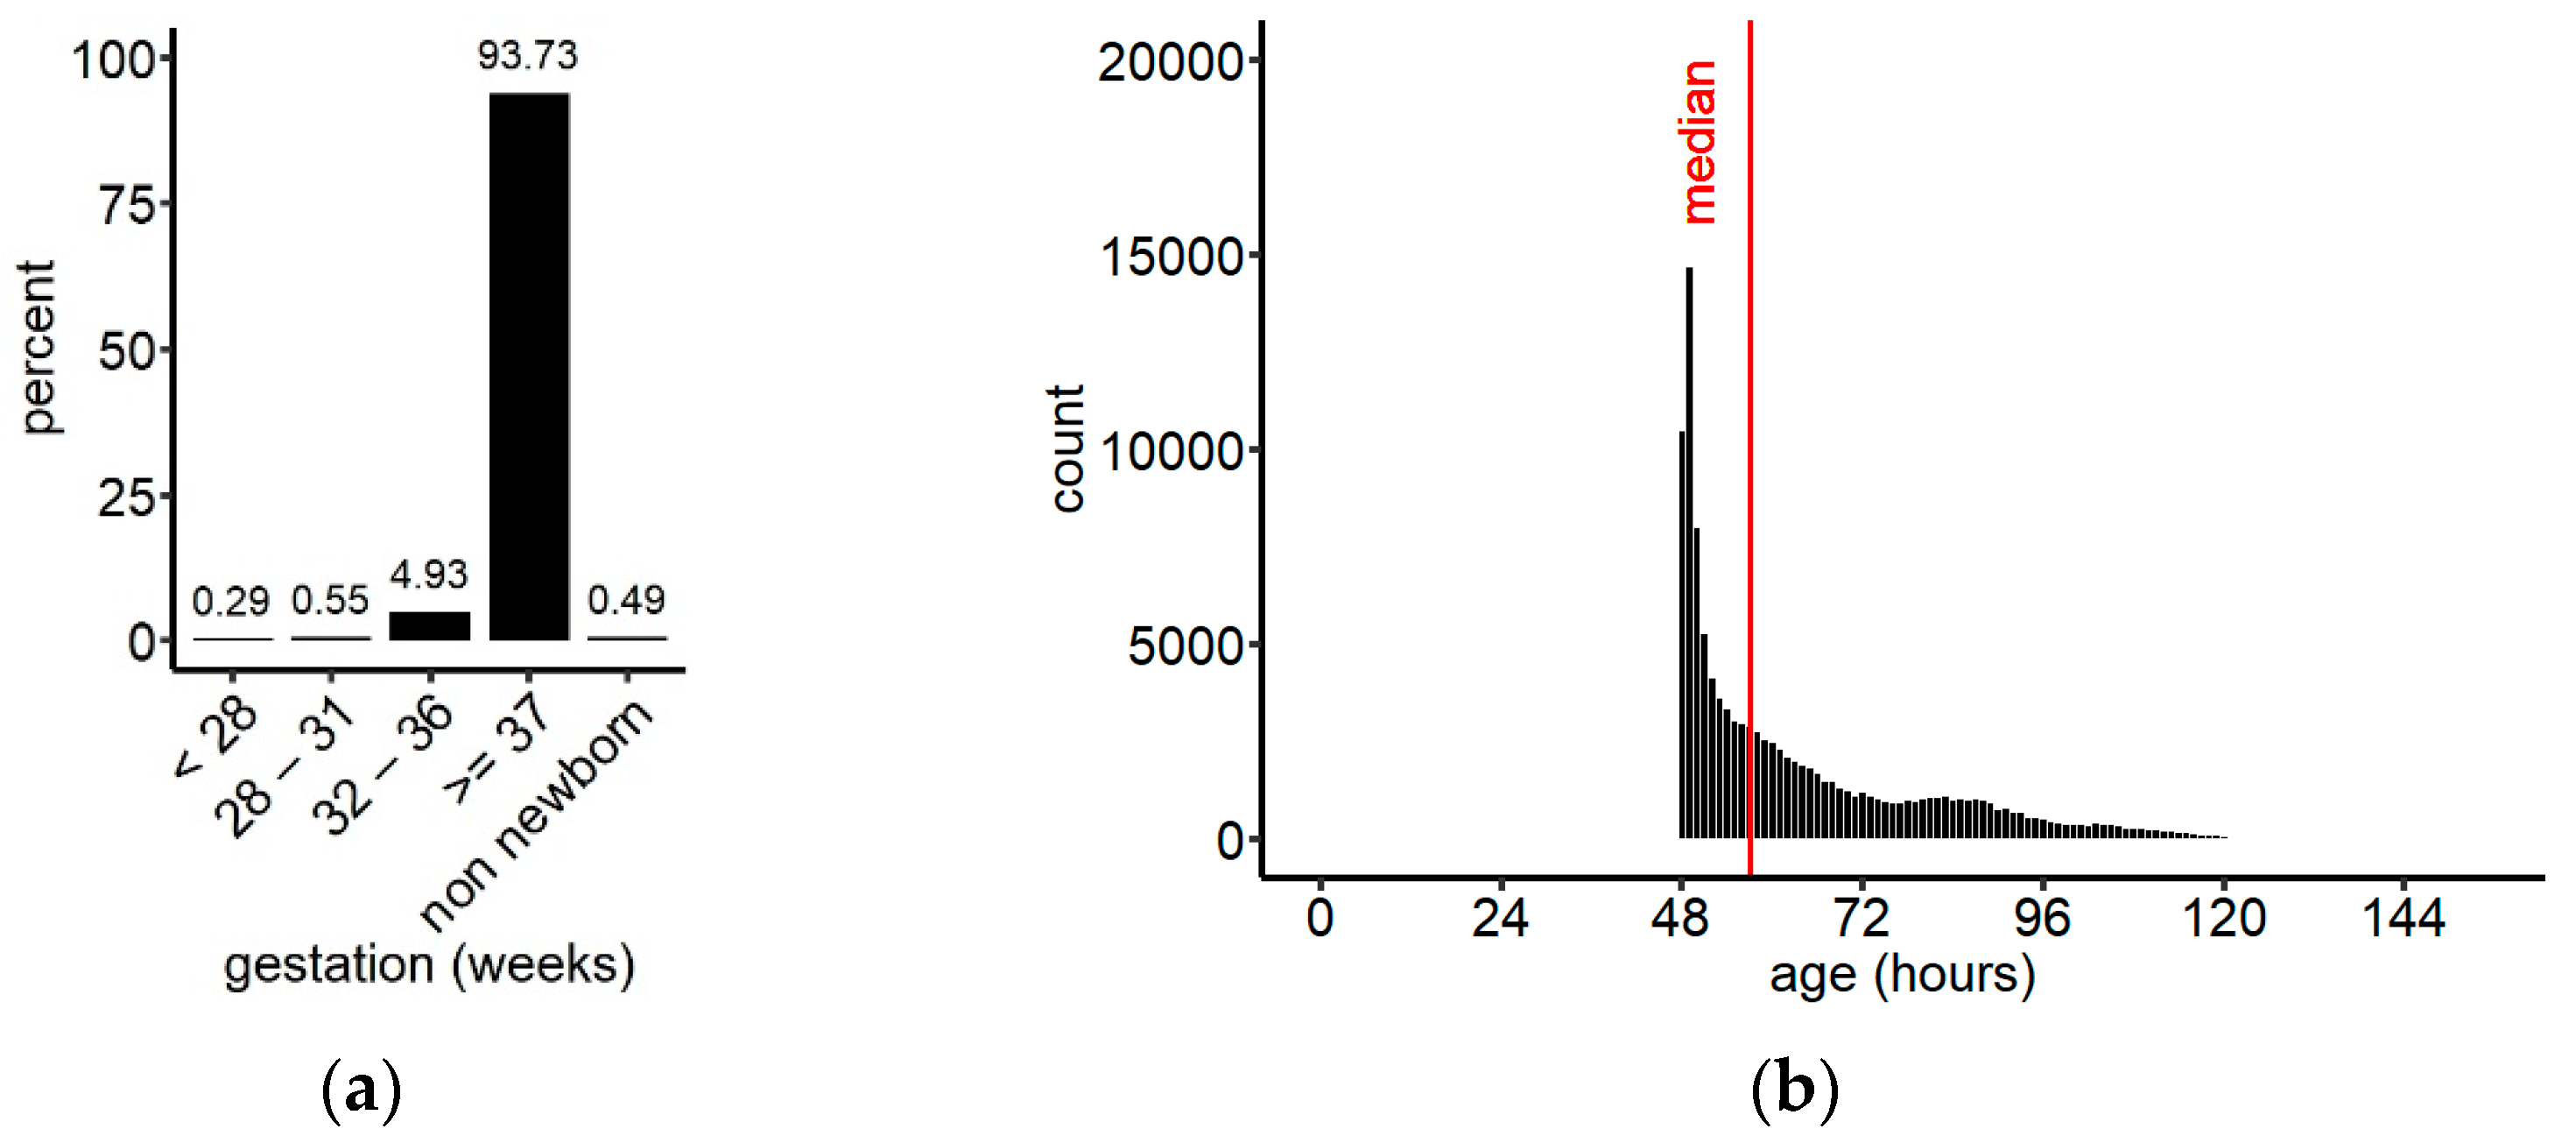
3.1. Demographics
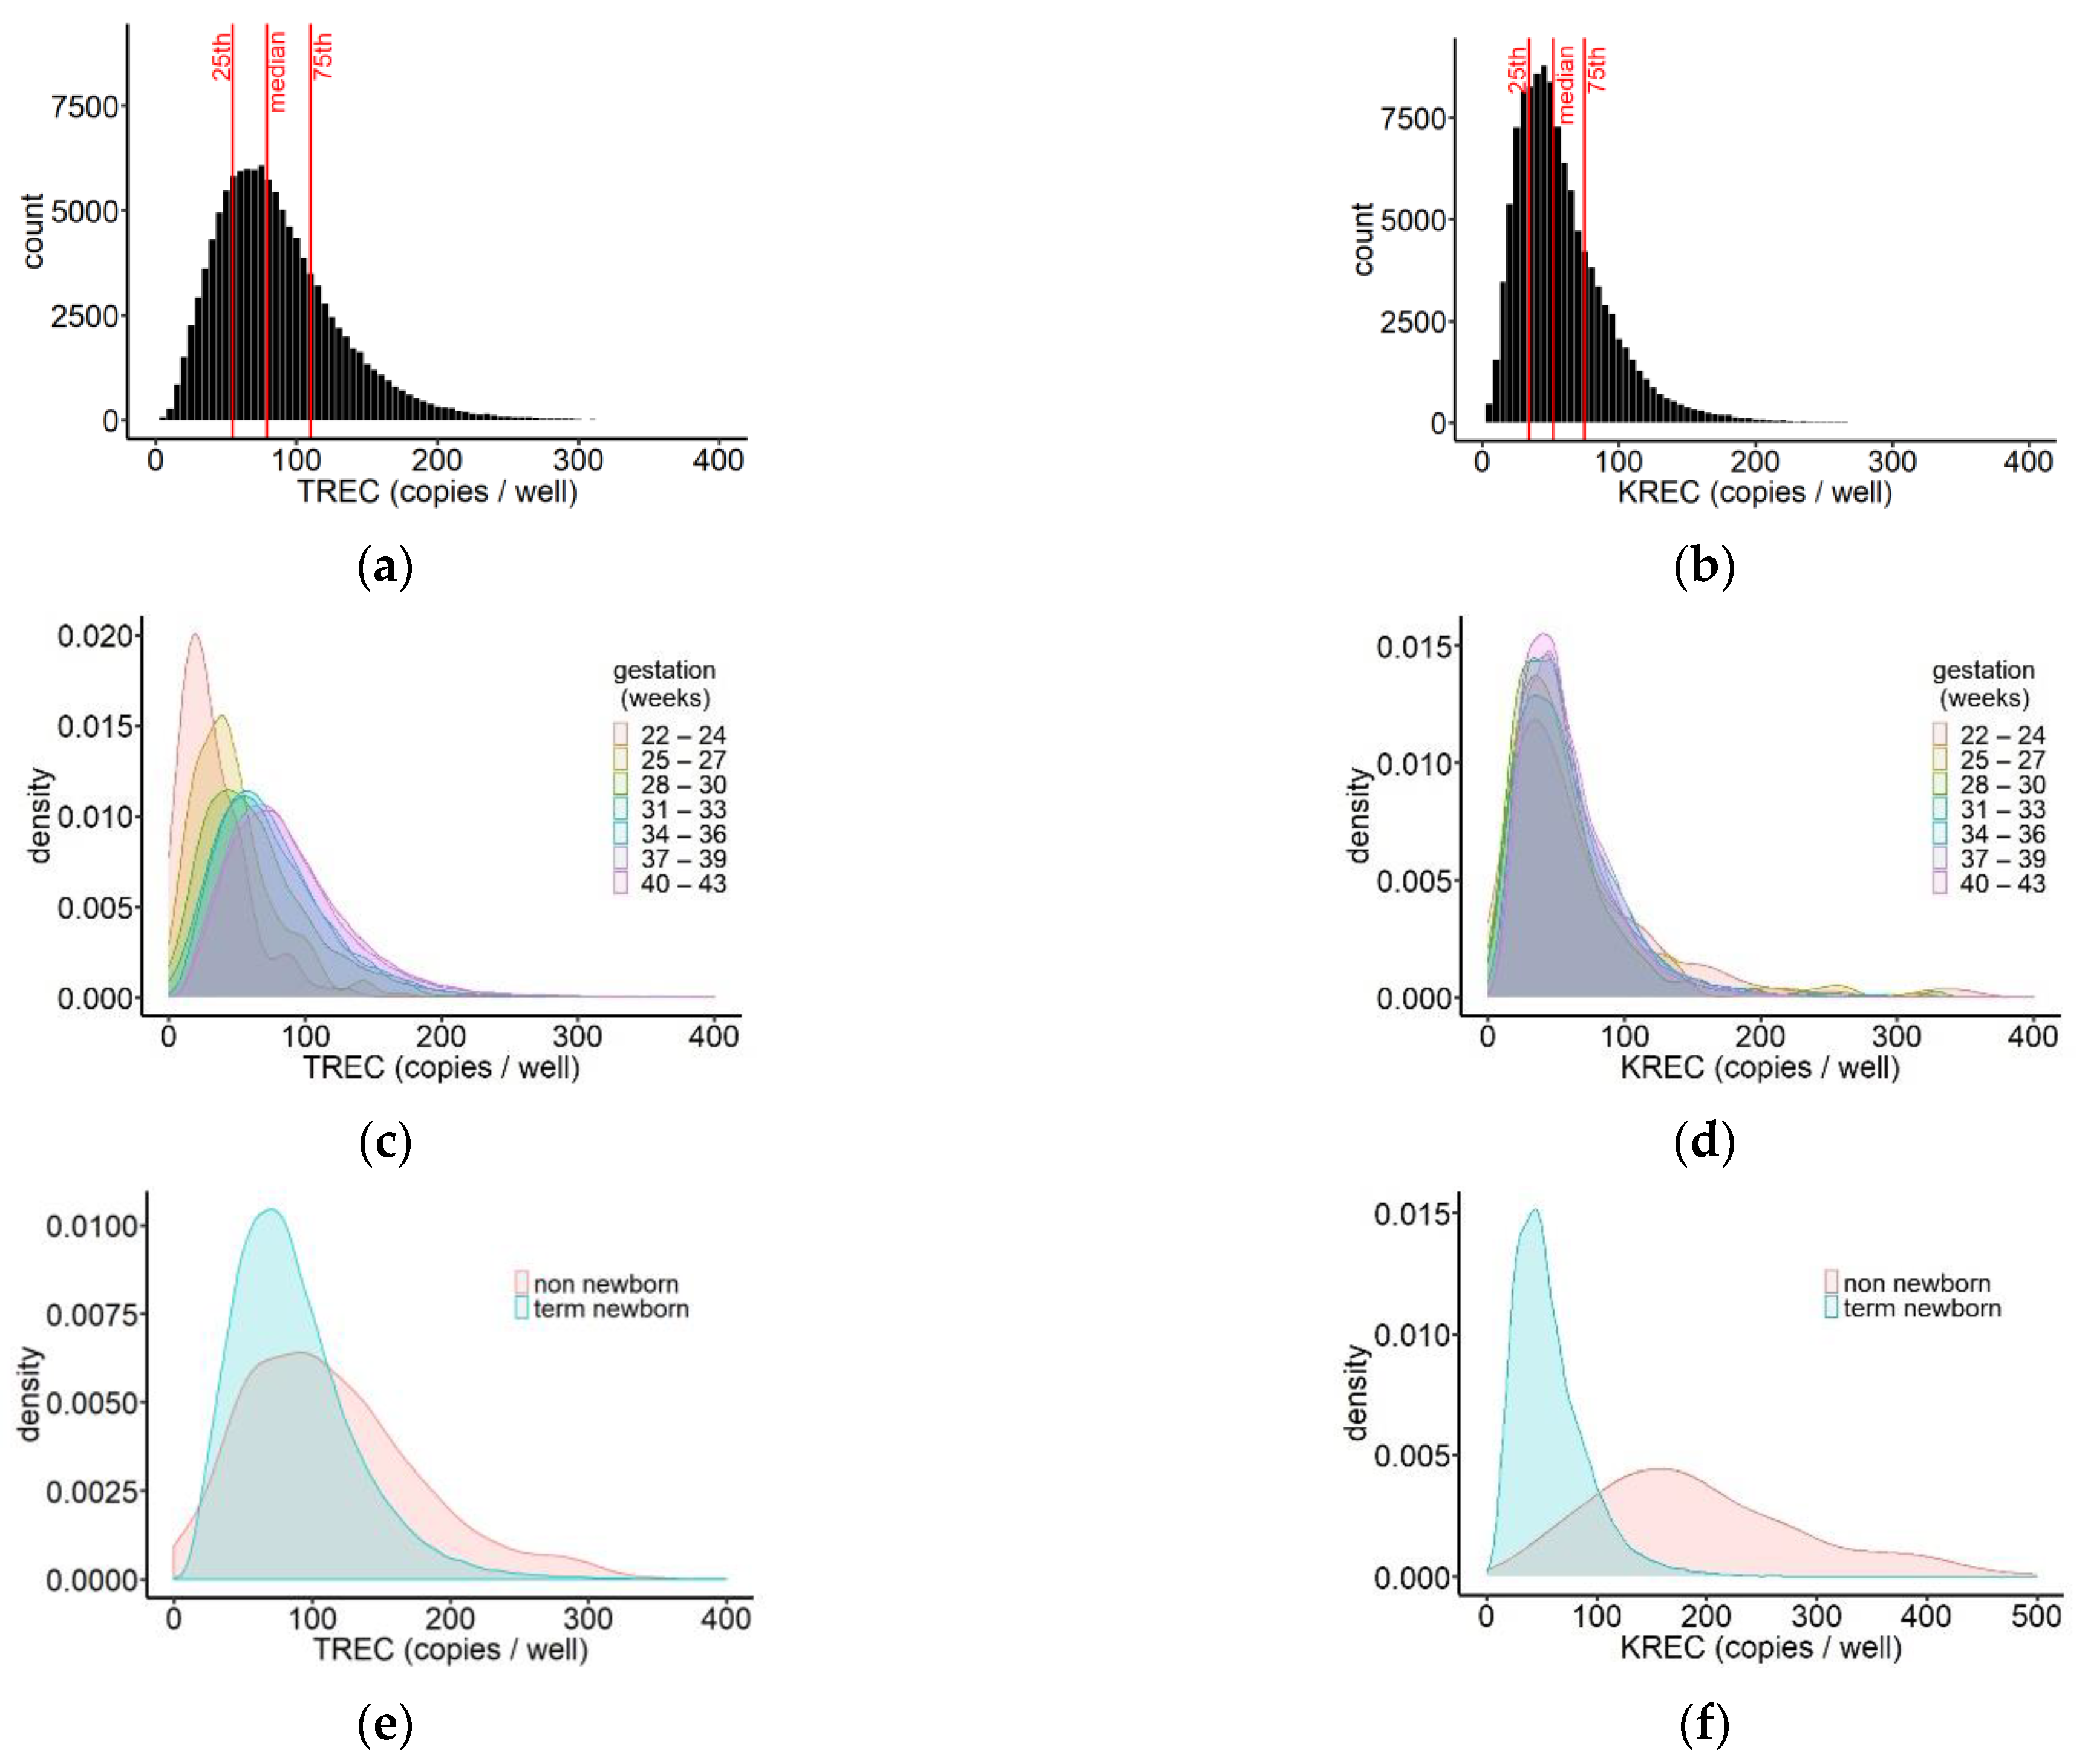
3.2. TREC and KREC Results
3.3. Referrals
3.4. Post Hoc Analysis of the Screening Algorithm
4. Discussion
Author Contributions
Funding
Institutional Review Board Statement
Informed Consent Statement
Data Availability Statement
Acknowledgments
Conflicts of Interest
References
- Fischer, A.; Notarangelo, L.D.; Neven, B.; Cavazzana, M.; Puck, J.M. Severe combined immunodeficiencies and related disorders. Nat. Rev. Dis. Primers 2015, 1, 15061. [Google Scholar] [CrossRef]
- Tangye, S.G.; Al-Herz, W.; Bousfiha, A.; Chatila, T.; Cunningham-Rundles, C.; Etzioni, A.; Franco, J.L.; Holland, S.M.; Klein, C.; Morio, T.; et al. Human inborn errors of immunity: 2019 update on the classification from the international union of immunoligical societies expert committee. J. Clin. Immunol. 2020, 40, 24–64. [Google Scholar] [CrossRef] [Green Version]
- Heimall, J.; Cowan, M.J. Long term outcomes of severe combined immunodeficiency: Therapy implications. Expert Rev. Clin. Immunol. 2017, 13, 1029–1040. [Google Scholar] [CrossRef]
- Patel, N.C.; Hertel, P.M.; Estes, M.K.; de la Morena, M.; Petru, A.M.; Noroski, L.M.; Revell, P.A.; Hanson, I.C.; Paul, M.E.; Rosenblatt, H.M.; et al. Vaccine-Acquired rotavirus in infants with severe combined immunodeficiency. N. Engl. J. Med. 2010, 362, 314–319. [Google Scholar] [CrossRef] [Green Version]
- Marciano, B.E.; Holland, S.M. Primary immunodeficiency diseases: Current and emerging therapeutics. Front. Immunol. 2017, 8, 937. [Google Scholar] [CrossRef]
- Heimall, J.; Logan, B.R.; Cowan, M.J.; Notarangelo, L.D.; Griffith, L.M.; Puck, J.M.; Kohn, D.B.; Pulsipher, M.A.; Parikh, S.; Maritinez, C.; et al. Immune reconstitution and survival of 100 SCID patients post-hematopoietic cell transplant: A PIDTC natural history study. Blood 2017, 130, 2718–2727. [Google Scholar] [CrossRef] [Green Version]
- Chan, K.; Puck, J.M. Development of population-based newborn screening for severe combined immunodeficiency. J. Allergy Clin. Immunol. 2005, 115, 391–398. [Google Scholar] [CrossRef] [PubMed] [Green Version]
- Verschuren, M.C.; Wolvers-Tettero, I.L.; Breit, T.M.; Noordzij, J.; van Wering, E.R.; van Dongen, J.J. preferential rearrangements of the T cell receptor-delta-deleting elements in human T cells. J. Immunol. 1997, 158, 1208–1216. [Google Scholar] [PubMed]
- Douek, D.C.; McFarland, R.D.; Keiser, P.H.; Gage, E.A.; Massey, J.M.; Haynes, B.F.; Polis, M.A.; Haase, A.T.; Feinberg, M.B.; Sullivan, J.L.; et al. Changes in thymic function with age and during the treatment of hiv infection. Nature 1998, 396, 690–695. [Google Scholar] [CrossRef] [PubMed]
- Hazenberg, M.D.; Verschuren, M.C.; Hamann, D.; Miedema, F.; van Dongen, J.J. T cell receptor excision circles as markers for recent thymic emigrants: Basic aspects, technical approach and guidelines for interpretation. J. Mol. Med. 2001, 79, 631–640. [Google Scholar] [CrossRef] [Green Version]
- Kwan, A.; Abraham, R.S.; Currier, R.; Brower, A.; Andruszewski, K.; Abbott, J.K.; Baker, M.; Ballow, M.; Bartoshesky, L.E.; Bonilla, F.A.; et al. Newborn screening for severe combined immunodeficiency in 11 screening programs in the United States. JAMA 2014, 312, 729–738. [Google Scholar] [CrossRef] [PubMed]
- Van der Spek, J.; Groenwold, R.H.; van der Burg, M.; van Montfrans, J.M. Trec based newborn screening for severe combined immunodeficiency disease: A systematic review. J. Clin. Immunol. 2015, 35, 416–430. [Google Scholar] [CrossRef] [PubMed] [Green Version]
- Baker, M.W.; Laessig, R.H.; Katcher, M.L.; Routes, J.M.; Grossman, W.J.; Verbsky, J.; Kurtycz, D.F.; Brokopp, C.D. Implementing routine testing for severe combined immunodeficiency within wisconsin’s newborn screening program. Public Health Rep. 2010, 125 (Suppl. 2), 88–95. [Google Scholar] [CrossRef] [PubMed] [Green Version]
- Buckley, R.H. The long quest for neonatal screening for severe combined immunodeficiency. J. Allergy Clin. Immunol. 2012, 129, 597–604. [Google Scholar] [CrossRef] [Green Version]
- Strand, J.; Gul, K.A.; Erichsen, H.C.; Lundman, E.; Berge, M.C.; Trømborg, A.K.; Sørgjerd, L.K.; Ytre-Arne, M.; Hogner, S.; Halsne, R.; et al. Second-Tier next generation sequencing integrated in nationwide newborn screening provides rapid molecular diagnostics of severe combined immunodeficiency. Front. Immunol. 2020, 11, 1417. [Google Scholar] [CrossRef] [PubMed]
- Loeber, J.G.; Platis, D.; Zetterström, R.H.; Almashanu, S.; Boemer, F.; Bonham, J.R.; Borde, P.; Brincat, I.; Cheillan, D.; Dekkers, E.; et al. Neonatal screening in europe revisited: An ISNS perspective on the current state and developments since 2010. Int. J. Neonatal Screen. 2021, 7, 15. [Google Scholar] [CrossRef]
- Barbaro, M.; Ohlsson, A.; Borte, S.; Jonsson, S.; Zetterström, R.H.; King, J.; Winiarski, J.; von Döbeln, U.; Hammarström, L. Newborn screening for severe primary immunodeficiency diseases in sweden-a 2-year pilot trec and krec screening study. J. Clin. Immunol. 2017, 37, 51–60. [Google Scholar] [CrossRef] [Green Version]
- Zetterström, R.; Barbaro, M.; Ohlsson, A.; Borte, S.; Jonsson, S.; Winiarski, J.; von Döbeln, U.; Hammarström, L. Newborn screening for primary immune deficiencies with a Trec/Krec/Actb Triplex assay—A three-year pilot study in Sweden. Int. J. Neonatal Screen. 2017, 3, 11. [Google Scholar] [CrossRef] [Green Version]
- Borte, S.; von Dobeln, U.; Fasth, A.; Wang, N.; Janzi, M.; Winiarski, J.; Sack, U.; Pan-Hammarstrom, Q.; Borte, M.; Hammarstrom, L. Neonatal screening for severe primary immunodeficiency diseases using high-throughput triplex real-time PCR. Blood 2012, 119, 2552–2555. [Google Scholar] [CrossRef]
- Maecker, H.T.; McCoy, J.P.; Nussenblatt, R. Standardizing immunophenotyping for the human immunology project. Nat. Rev. Immunol. 2012, 12, 191–200. [Google Scholar] [CrossRef] [Green Version]
- Stranneheim, H.; Lagerstedt-Robinson, K.; Magnusson, M.; Kvarnung, M.; Nilsson, D.; Lesko, N.; Engvall, M.; Anderlid, B.M.; Arnell, H.; Johansson, C.B.; et al. Integration of whole genome sequencing into a healthcare setting: High diagnostic rates across multiple clinical entities in 3219 rare disease patients. Genome Med. 2021, 13, 40. [Google Scholar] [CrossRef]
- Schatorje, E.J.; Gemen, E.F.; Driessen, G.J.; Leuvenink, J.; van Hout, R.W.; de Vries, E. Paediatric reference values for the peripheral T cell compartment. Scand. J. Immunol. 2012, 75, 436–444. [Google Scholar] [CrossRef]
- RStudioTeam. Rstudio: Integrated Development for R. Rstudio, Pbc; RStudio: Boston, MA, USA, 2018. [Google Scholar]
- Currier, R.; Puck, J.M. Scid newborn screening: What we’ve learned. J. Allergy Clin. Immunol. 2021, 147, 417–426. [Google Scholar] [CrossRef] [PubMed]
- Chawanpaiboon, S.; Vogel, J.P.; Moller, A.B.; Lumbiganon, P.; Petzold, M.; Hogan, D.; Landoulsi, S.; Jampathong, N.; Kongwattanakul, K.; Laopaiboon, M.; et al. Global, regional, and national estimates of levels of preterm birth in 2014: A systematic review and modelling analysis. Lancet Glob. Health 2019, 7, e37–e46. [Google Scholar] [CrossRef] [Green Version]
- Gizewska, M.; Durda, K.; Winter, T.; Ostrowska, I.; Oltarzewski, M.; Klein, J.; Blankenstein, O.; Romanowska, H.; Krzywinska-Zdeb, E.; Patalan, M.F.; et al. Newborn screening for scid and other severe primary immunodeficiency in the polish-german transborder area: Experience from the first 14 months of collaboration. Front. Immunol. 2020, 11, 1948. [Google Scholar] [CrossRef] [PubMed]
- Rechavi, E.; Lev, A.; Simon, A.J.; Stauber, T.; Daas, S.; Saraf-Levy, T.; Broides, A.; Nahum, A.; Marcus, N.; Hanna, S.; et al. First year of israeli newborn screening for severe combined immunodeficiency-clinical achievements and insights. Front. Immunol. 2017, 8, 1448. [Google Scholar] [CrossRef] [Green Version]
- Argudo-Ramírez, A.; Martín-Nalda, A.; Marín-Soria, J.L.; López-Galera, R.M.; Pajares-García, S.; González de Aledo-Castillo, J.M.; Martínez-Gallo, M.; García-Prat, M.; Colobran, R.; Riviere, J.G.; et al. First universal newborn screening program for severe combined immunodeficiency in europe. two-years’ experience in Catalonia (Spain). Front. Immunol. 2019, 10, 2406. [Google Scholar] [CrossRef]
- De Felipe, B.; Olbrich, P.; Lucenas, J.M.; Delgado-Pecellin, C.; Pavon-Delgado, A.; Marquez, J.; Salamanca, C.; Soler-Palacin, P.; Gonzalez-Granado, L.I.; Antolin, L.F.; et al. Prospective neonatal screening for severe t- and b-lymphocyte deficiencies in Seville. Pediatric Allergy Immunol. 2016, 27, 70–77. [Google Scholar] [CrossRef]
- Kanegae, M.P.P.; Barreiros, L.A.; Sousa, J.L.; Brito, M.A.S.; Oliveira, E.B.J.; Soares, L.P.; Mazzucchelli, J.T.L.; Fernandes, D.Q.; Hadachi, S.M.; Holanda, S.M.; et al. Newborn screening for severe combined immunodeficiencies using trecs and krecs: Second pilot study in Brazil. Rev. Paul Pediatric 2017, 35, 25–32. [Google Scholar] [CrossRef] [Green Version]
- Amatuni, G.S.; Sciortino, S.; Currier, R.J.; Naides, S.J.; Church, J.A.; Puck, J.M. Reference intervals for lymphocyte subsets in preterm and term neonates without immune defects. J. Allergy Clin. Immunol. 2019, 144, 1674–1683. [Google Scholar] [CrossRef] [Green Version]
- Berrington, J.E.; Barge, D.; Fenton, A.C.; Cant, A.J.; Spickett, G.P. Lymphocyte subsets in term and significantly preterm UK infants in the first year of life analysed by single platform flow cytometry. Clin. Exp. Immunol. 2005, 140, 289–292. [Google Scholar] [CrossRef]
- Chien, Y.-H.; Yu, H.-H.; Lee, N.-C.; Ho, H.-C.; Kao, S.-M.; Lu, M.-Y.; Jaing, T.-H.; Lee, W.-I.; Chang, K.-W.; Shieh, C.-C.; et al. Newborn screening for severe combined immunodeficiency in Taiwan. Int. J. Neonatal Screen. 2017, 3, 16. [Google Scholar] [CrossRef]
- Audrain, M.A.P.; Léger, A.J.C.; Hémont, C.A.F.; Mirallié, S.M.; Cheillan, D.; Rimbert, M.G.M.; Le Thuaut, A.M.; Sébille-Rivain, V.A.; Prat, A.; Pinel, E.M.Q.; et al. Newborn screening for severe combined immunodeficiency: Analytic and clinical performance of the T cell receptor excision circle assay in France (depistrec study). J. Clin. Immunol. 2018, 38, 778–786. [Google Scholar] [CrossRef] [PubMed]
- Hale, J.E.; Platt, C.D.; Bonilla, F.A.; Hay, B.N.; Sullivan, J.L.; Johnston, A.M.; Pasternack, M.S.; Hesterberg, P.E.; Meissner, H.C.; Cooper, E.R.; et al. Ten years of newborn screening for severe combined immunodeficiency (scid) in Massachusetts. J. Allergy Clin. Immunol. Pract. 2021, 9, 2060–2067. [Google Scholar] [CrossRef] [PubMed]
- Amatuni, G.S.; Currier, R.J.; Church, J.A.; Bishop, T.; Grimbacher, E.; Nguyen, A.A.; Agarwal-Hashmi, R.; Aznar, C.P.; Butte, M.J.; Cowan, M.J.; et al. Newborn screening for severe combined immunodeficiency and T-cell lymphopenia in California, 2010–2017. Pediatrics 2019, 143, e20182300. [Google Scholar] [CrossRef] [PubMed] [Green Version]
- Verbsky, J.W.; Baker, M.W.; Grossman, W.J.; Hintermeyer, M.; Dasu, T.; Bonacci, B.; Reddy, S.; Margolis, D.; Casper, J.; Gries, M.; et al. Newborn screening for severe combined immunodeficiency; the wisconsin experience (2008–2011). J. Clin. Immunol. 2012, 32, 82–88. [Google Scholar] [CrossRef] [PubMed]
- Vogel, B.H.; Bonagura, V.; Weinberg, G.A.; Ballow, M.; Isabelle, J.; DiAntonio, L.; Parker, A.; Young, A.; Cunningham-Rundles, C.; Fong, C.T.; et al. Newborn screening for scid in new york state: Experience from the first two years. J. Clin. Immunol. 2014, 34, 289–303. [Google Scholar] [CrossRef] [PubMed] [Green Version]
- Lev, A.; Simon, A.J.; Broides, A.; Levi, J.; Garty, B.Z.; Rosenthal, E.; Amariglio, N.; Rechavi, G.; Somech, R. Thymic function in mhc class ii-deficient patients. J. Allergy Clin. Immunol. 2013, 131, 831–839. [Google Scholar] [CrossRef] [PubMed]
- Kuo, C.Y.; Chase, J.; Garcia Lloret, M.; Stiehm, E.R.; Moore, T.; Aguilera, M.J.; Lopez Siles, J.; Church, J.A. Newborn screening for severe combined immunodeficiency does not identify bare lymphocyte syndrome. J. Allergy Clin. Immunol. 2013, 131, 1693–1695. [Google Scholar] [CrossRef] [PubMed]
- Shakerian, L.; Pourpak, Z.; Shamlou, S.; Domsgen, E.; Kazemnejad, A.; Dalili, H.; Nourizadeh, M. Determining laboratory reference values of trec and krec in different age groups of iranian healthy individuals. Iran. J. Allergy Asthma Immunol. 2019, 18, 143–152. [Google Scholar] [CrossRef]
- Blom, M.; Pico-Knijnenburg, I.; Imholz, S.; Vissers, L.; Schulze, J.; Werner, J.; Bredius, R.; van der Burg, M. Second tier testing to reduce the number of non-actionable secondary findings and false-positive referrals in newborn screening for severe combined immunodeficiency. J. Clin. Immunol. 2021. [CrossRef]
- Dvorak, C.C.; Haddad, E.; Buckley, R.H.; Cowan, M.J.; Logan, B.; Griffith, L.M.; Kohn, D.B.; Pai, S.Y.; Notarangelo, L.; Shearer, W.; et al. The genetic landscape of severe combined immunodeficiency in the United States and Canada in the current era (2010–2018). J. Allergy Clin. Immunol. 2019, 143, 405–407. [Google Scholar] [CrossRef] [PubMed] [Green Version]
- Thomas, C.; Durand-Zaleski, I.; Frenkiel, J.; Mirallie, S.; Leger, A.; Cheillan, D.; Picard, C.; Mahlaoui, N.; Riche, V.P.; Roussey, M.; et al. Clinical and economic aspects of newborn screening for severe combined immunodeficiency: Depistrec study results. Clin. Immunol. 2019, 202, 33–39. [Google Scholar] [CrossRef] [PubMed]


| Gestation (Weeks) | n | TREC (Copies/Well) Median (IQR) | KREC (Copies/Well) Median (IQR) |
|---|---|---|---|
| 22–24 | 109 | 25 (14, 47) | 49 (29, 85) |
| 25–27 | 232 | 41 (25, 60) | 47 (29, 74) |
| 28–30 | 430 | 56 (36, 86) | 46 (28, 66) |
| 31–33 | 1 088 | 67 (44, 96) | 50 (31, 77) |
| 34–36 | 4 819 | 69 (47, 98) | 50 (32, 73) |
| 37–39 | 52 839 | 78 (55, 108) | 53 (35, 78) |
| 40–43 | 55 672 | 81 (56, 112) | 49 (33, 72) |
| SCID | T Cell Lymphopenia | |
|---|---|---|
| Number of samples | 115,786 | |
| Number of screening negative samples | 115,704 | |
| Number of screening positive samples | 73 | |
| Number of true positives | 3 | 21 1 |
| Number of false positives | 70 | 52 |
| % Sensitivity (95% CI) | 100 (43.85–100) | - |
| % Specificity (95% CI) | 99.937 (99.92–99.95) | 99.953 (99.94–99.97) |
| % PPV | 4.11 (1.41–11.40) | 28.77 (19.65–40.01) |
| % NPV | 100 (100–100) | - |
| Case | 1st Guthrie Card | 2nd Guthrie Card | Total Lymphocyte Count (109/L) | CD3 Count (109/L) | Diagnosis |
|---|---|---|---|---|---|
| 1 | T 0; K 125 | T 0; K 120 | 0.85 | 0.14 | SCID, JAK3 deficiency |
| 2 | T 1; K 1 | T 1; K 0 | 0.07 | 0.04 | SCID, ADA deficiency |
| 3 | T 0; K 140 | T 0; K 210 | 1.0 | <0.01 | SCID, JAK3 deficiency |
| 4 | T 0; K 65 | not sampled | 1.63 | 0.63 | 22q11DS |
| 5 | T 4; K 44 | T 8; K 32 | 1.95 | 1.29 | 22q11DS |
| 6 | T 4; K 64 | T 5; K 150 | 2.8 | 1.2 | 22q11DS |
| 7 | T 1; K 65 | T 24; K 140 | 3.8 | 1.9 | 22q11DS, premature |
| 8 | T 1; K 52 | T 1; K 55 | 1.7 | 1.14 | CHARGE syndrome |
| 9 | T 4; K 8 | T 1; K 18 | 0.2 | 0.32 | chylothorax, premature |
| 10 | T 0; K 8 | T 3; K 39 | 0.84 | 0.29 | chylothorax, premature |
| 11 | T 0; K 54 | T 0; K 21 | 1.3 | 0.09 | hydrops, premature |
| 12 | T 4; K 110 | T 180; K 98 | 0.45 | 0.33 | idiopathic lymphopenia |
| 13 | T 1; K 260 1 | T 6; K 380 | 5.5 | 1.81 | idiopathic lymphopenia |
| 14 | T 0; K 150 | T 0; K 52 | 1.8 | 0.5 | idiopathic lymphopenia |
| 15 | T 1; K 88 | T 6; K 280 | 1.8 | 1.18 | idiopathic lymphopenia, premature |
| 16 | T 4; K 36 | T 7; K 70 | 1.84 | 1.2 | syndrome 2 |
| 17 | T 2; K 16 | T 2; K 23 | 3.0 | 0.62 | syndrome 2 |
| 18 | T 6; K 8 | T 2; K 95 | 1.4 | 0.3 | syndrome, chylothorax, premature 2 |
| 19 | T 2; K 15 | deceased | not tested | not tested | syndrome, premature 2 |
| 20 | T 2; K 27 | T 12; K 74 | 2.0 | 0.61 | other, sepsis |
| 21 | T 0; K 660 | T 0; K 1000 | 10.1 | 1.88 | other, juvenile myelomonocytic leukaemia |
Publisher’s Note: MDPI stays neutral with regard to jurisdictional claims in published maps and institutional affiliations. |
© 2021 by the authors. Licensee MDPI, Basel, Switzerland. This article is an open access article distributed under the terms and conditions of the Creative Commons Attribution (CC BY) license (https://creativecommons.org/licenses/by/4.0/).
Share and Cite
Göngrich, C.; Ekwall, O.; Sundin, M.; Brodszki, N.; Fasth, A.; Marits, P.; Dysting, S.; Jonsson, S.; Barbaro, M.; Wedell, A.; et al. First Year of TREC-Based National SCID Screening in Sweden. Int. J. Neonatal Screen. 2021, 7, 59. https://doi.org/10.3390/ijns7030059
Göngrich C, Ekwall O, Sundin M, Brodszki N, Fasth A, Marits P, Dysting S, Jonsson S, Barbaro M, Wedell A, et al. First Year of TREC-Based National SCID Screening in Sweden. International Journal of Neonatal Screening. 2021; 7(3):59. https://doi.org/10.3390/ijns7030059
Chicago/Turabian StyleGöngrich, Christina, Olov Ekwall, Mikael Sundin, Nicholas Brodszki, Anders Fasth, Per Marits, Sam Dysting, Susanne Jonsson, Michela Barbaro, Anna Wedell, and et al. 2021. "First Year of TREC-Based National SCID Screening in Sweden" International Journal of Neonatal Screening 7, no. 3: 59. https://doi.org/10.3390/ijns7030059
APA StyleGöngrich, C., Ekwall, O., Sundin, M., Brodszki, N., Fasth, A., Marits, P., Dysting, S., Jonsson, S., Barbaro, M., Wedell, A., von Döbeln, U., & Zetterström, R. H. (2021). First Year of TREC-Based National SCID Screening in Sweden. International Journal of Neonatal Screening, 7(3), 59. https://doi.org/10.3390/ijns7030059