A Novel Approach to Improve Newborn Screening for Congenital Hypothyroidism by Integrating Covariate-Adjusted Results of Different Tests into CLIR Customized Interpretive Tools
Abstract
1. Introduction
2. Materials and Methods
2.1. Analytical Methods
2.2. Reference Data
2.3. Automated Removal of Reference Outliers by the Data Validation Tool
2.4. Automated Removal of Reference Outliers by the Reference Data Review Tool
2.5. Minimum-Maximum Normalization of Moving Percentiles
2.6. Ratio Explorer
2.7. Adjustment Builder
2.8. Study Cohort
2.9. Covariate Distribution of True and False Positive Cases
2.10. Post Analytical Interpretive Tools: Single Condition Tools
2.11. Post Analytical Interpretive Tools: Dual Scatter Plots
2.12. Zoom Function of the Dual Scatter Plot
2.13. Dual Scatter Plot Runner
3. Results
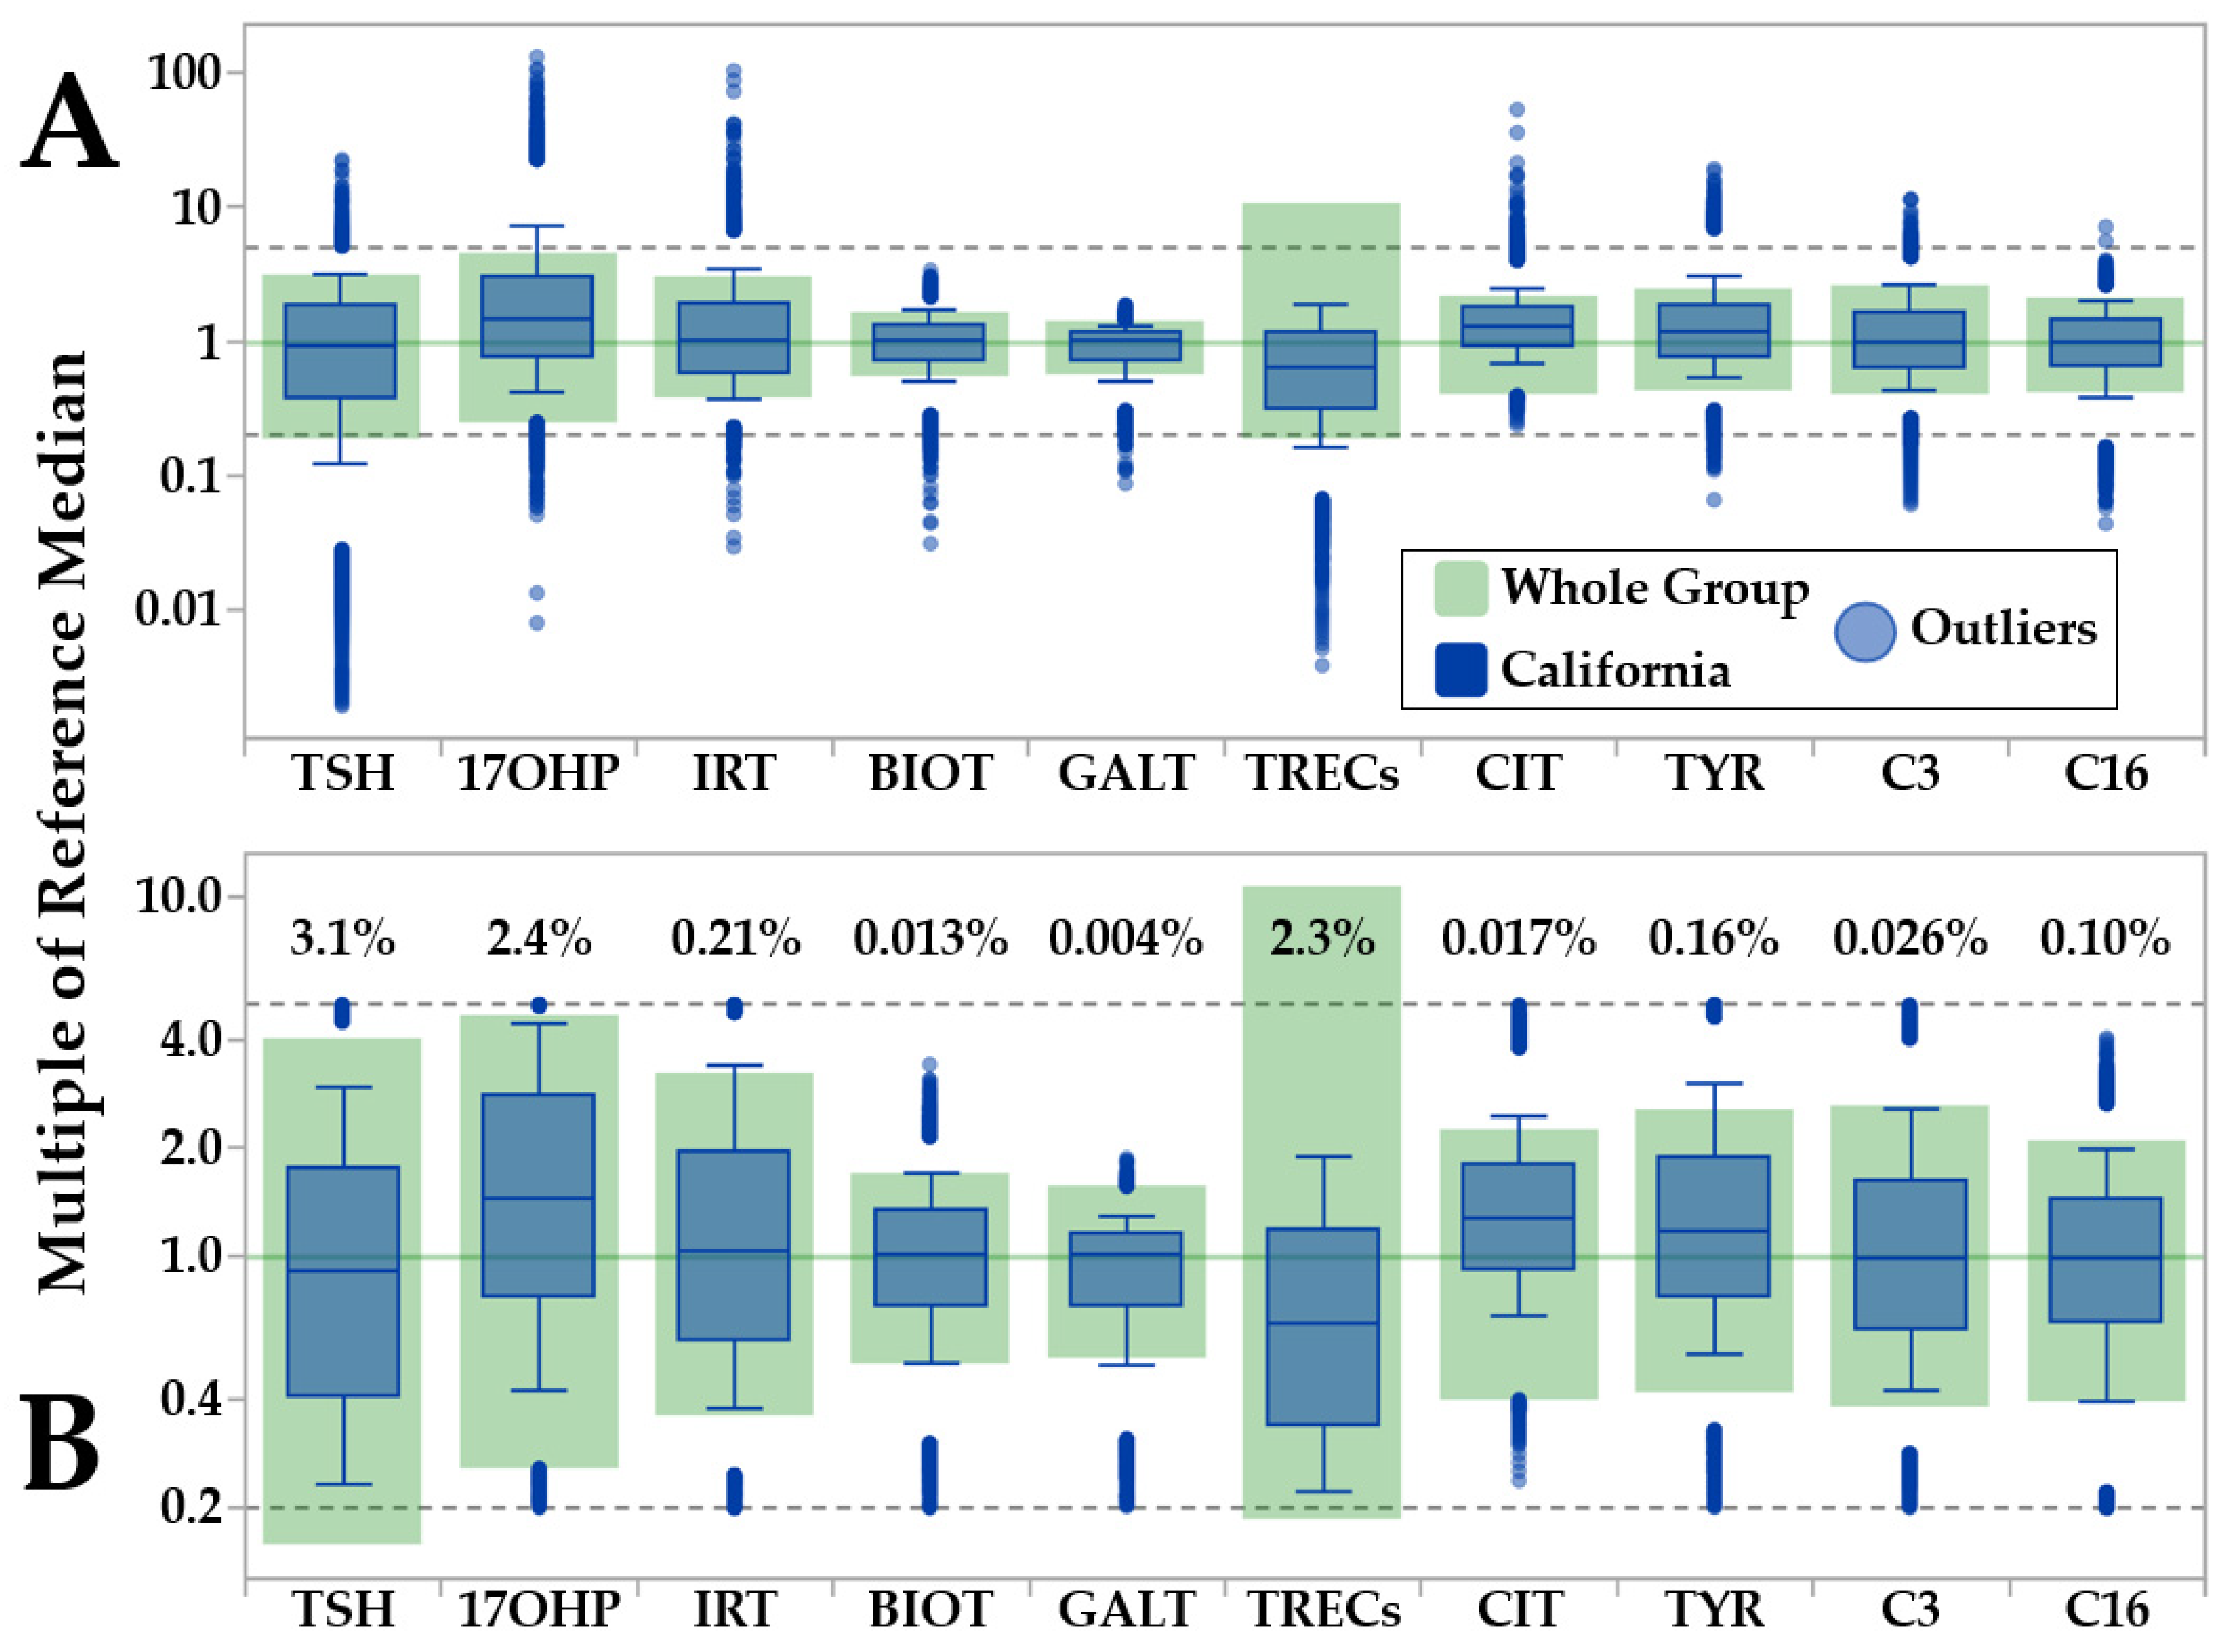
3.1. Minimum-Maximum Normalization of Moving Percentiles
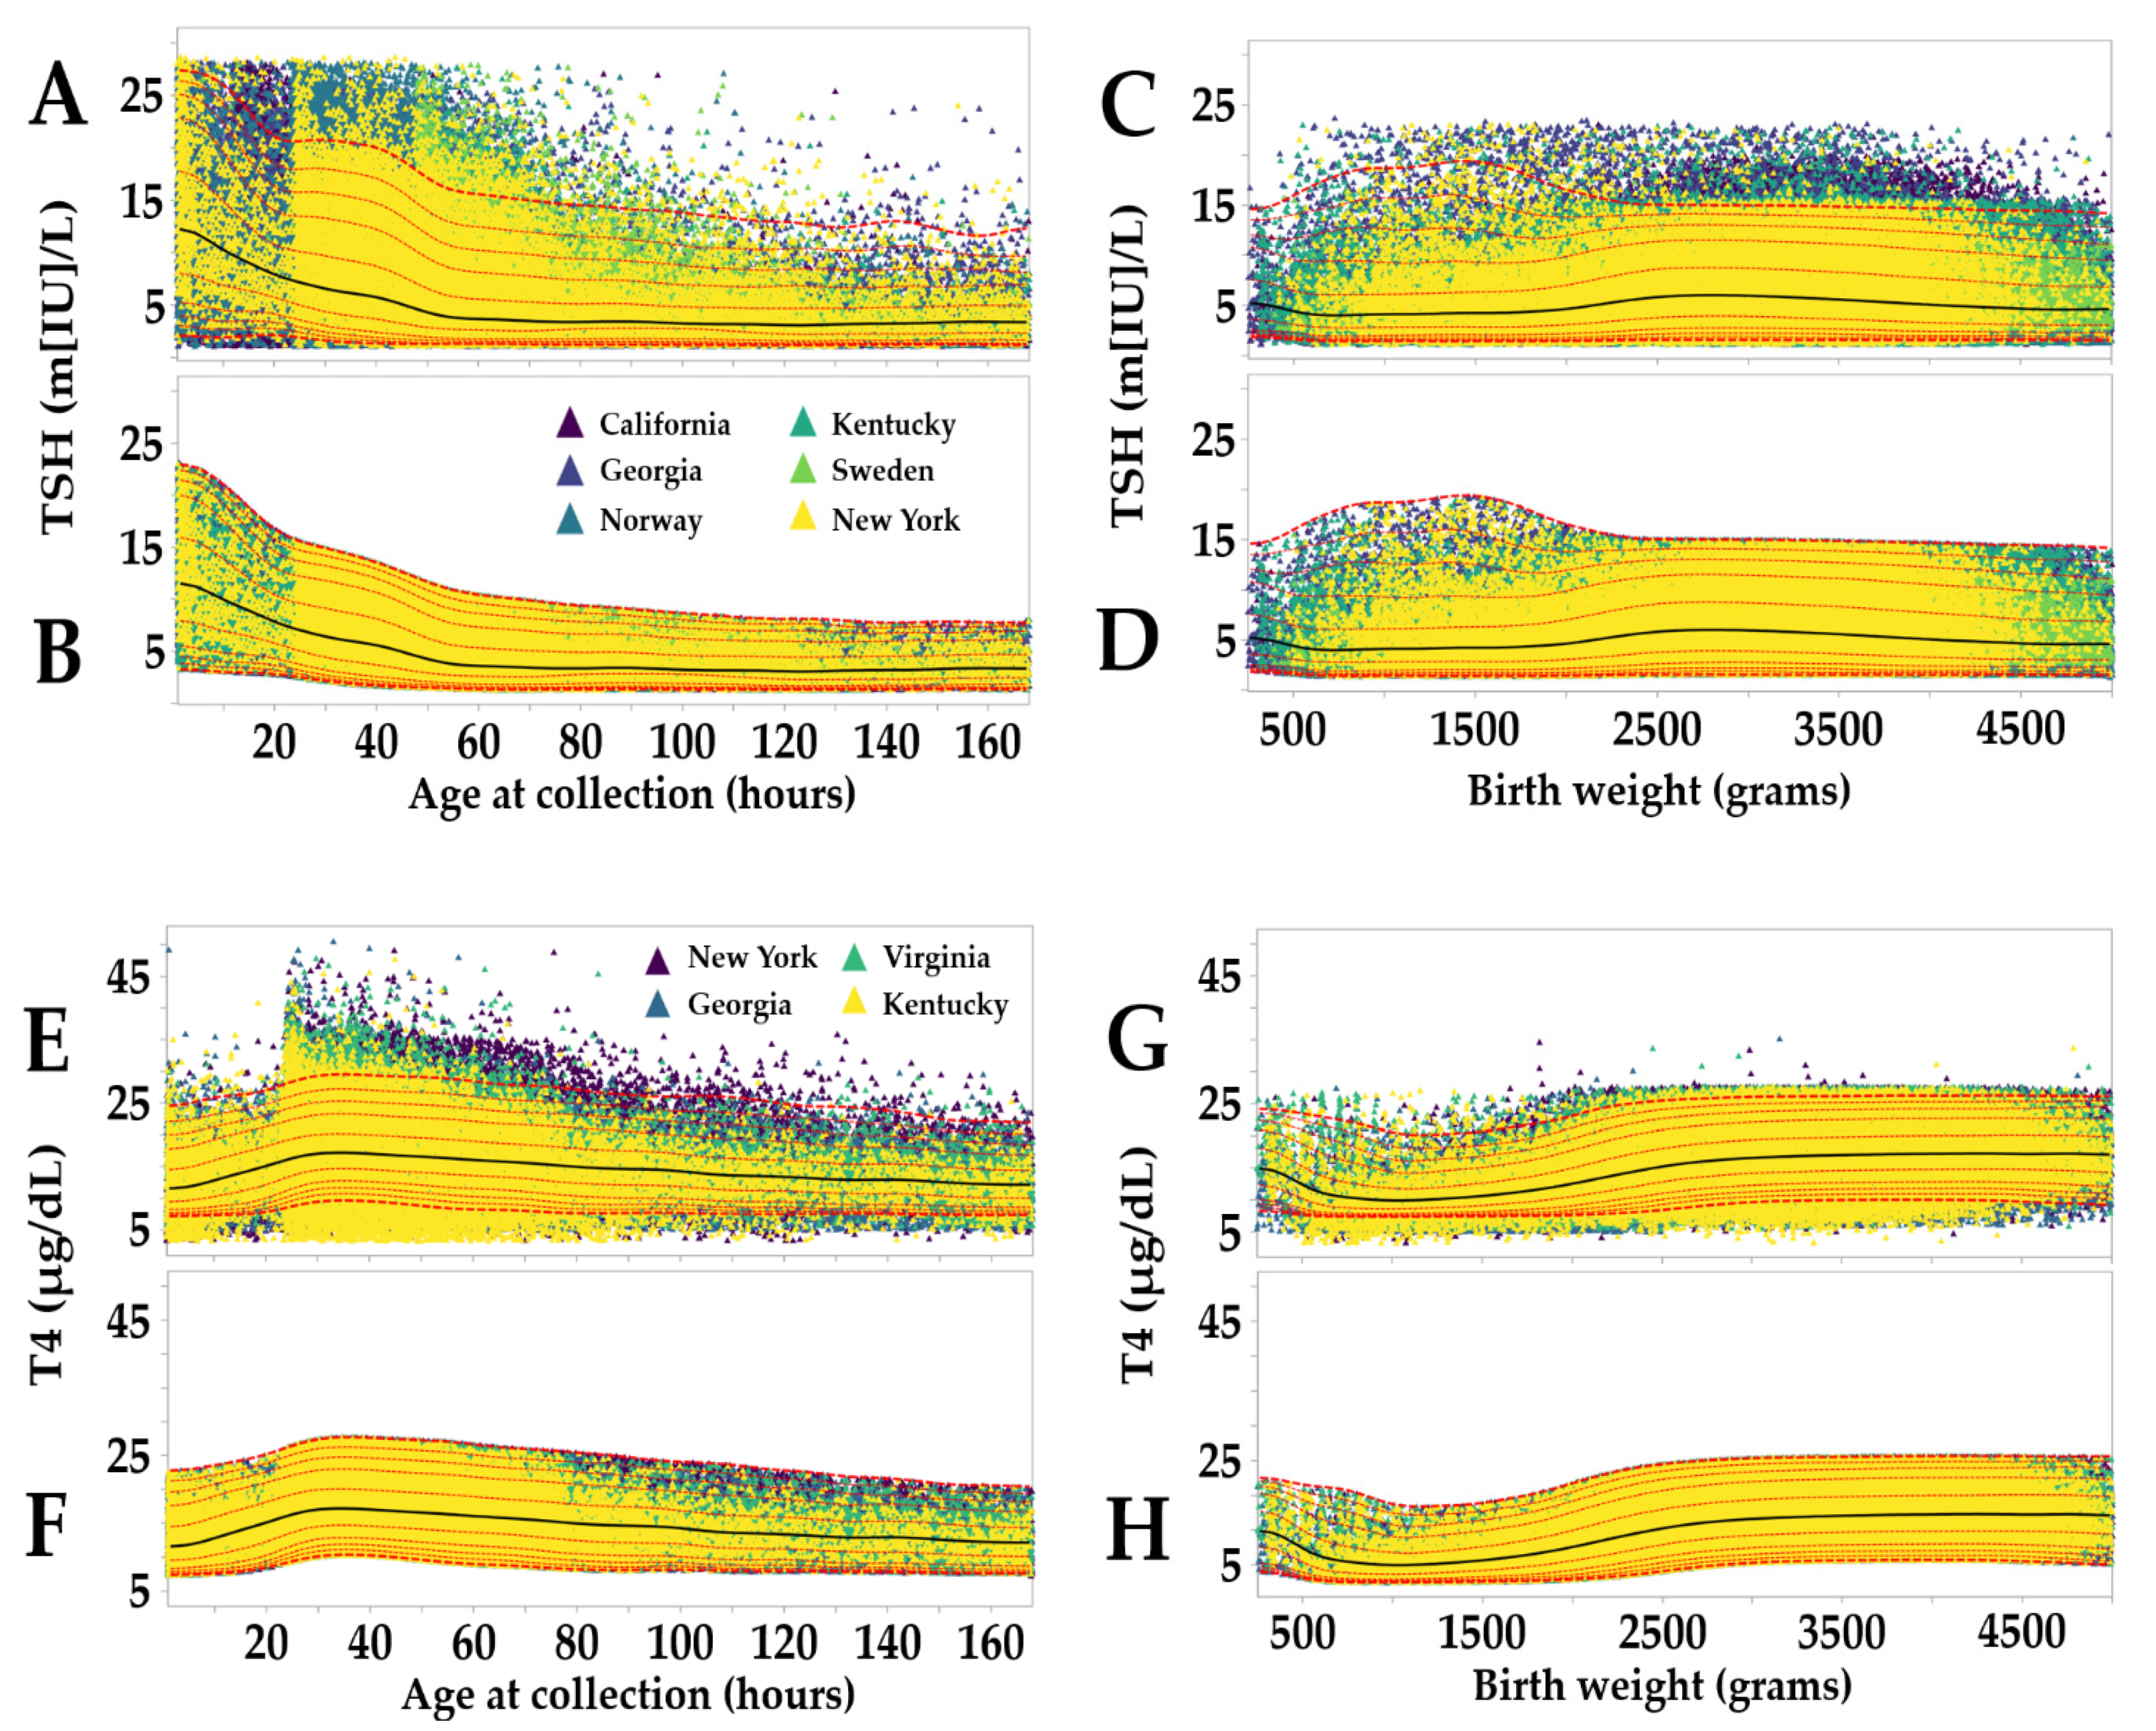
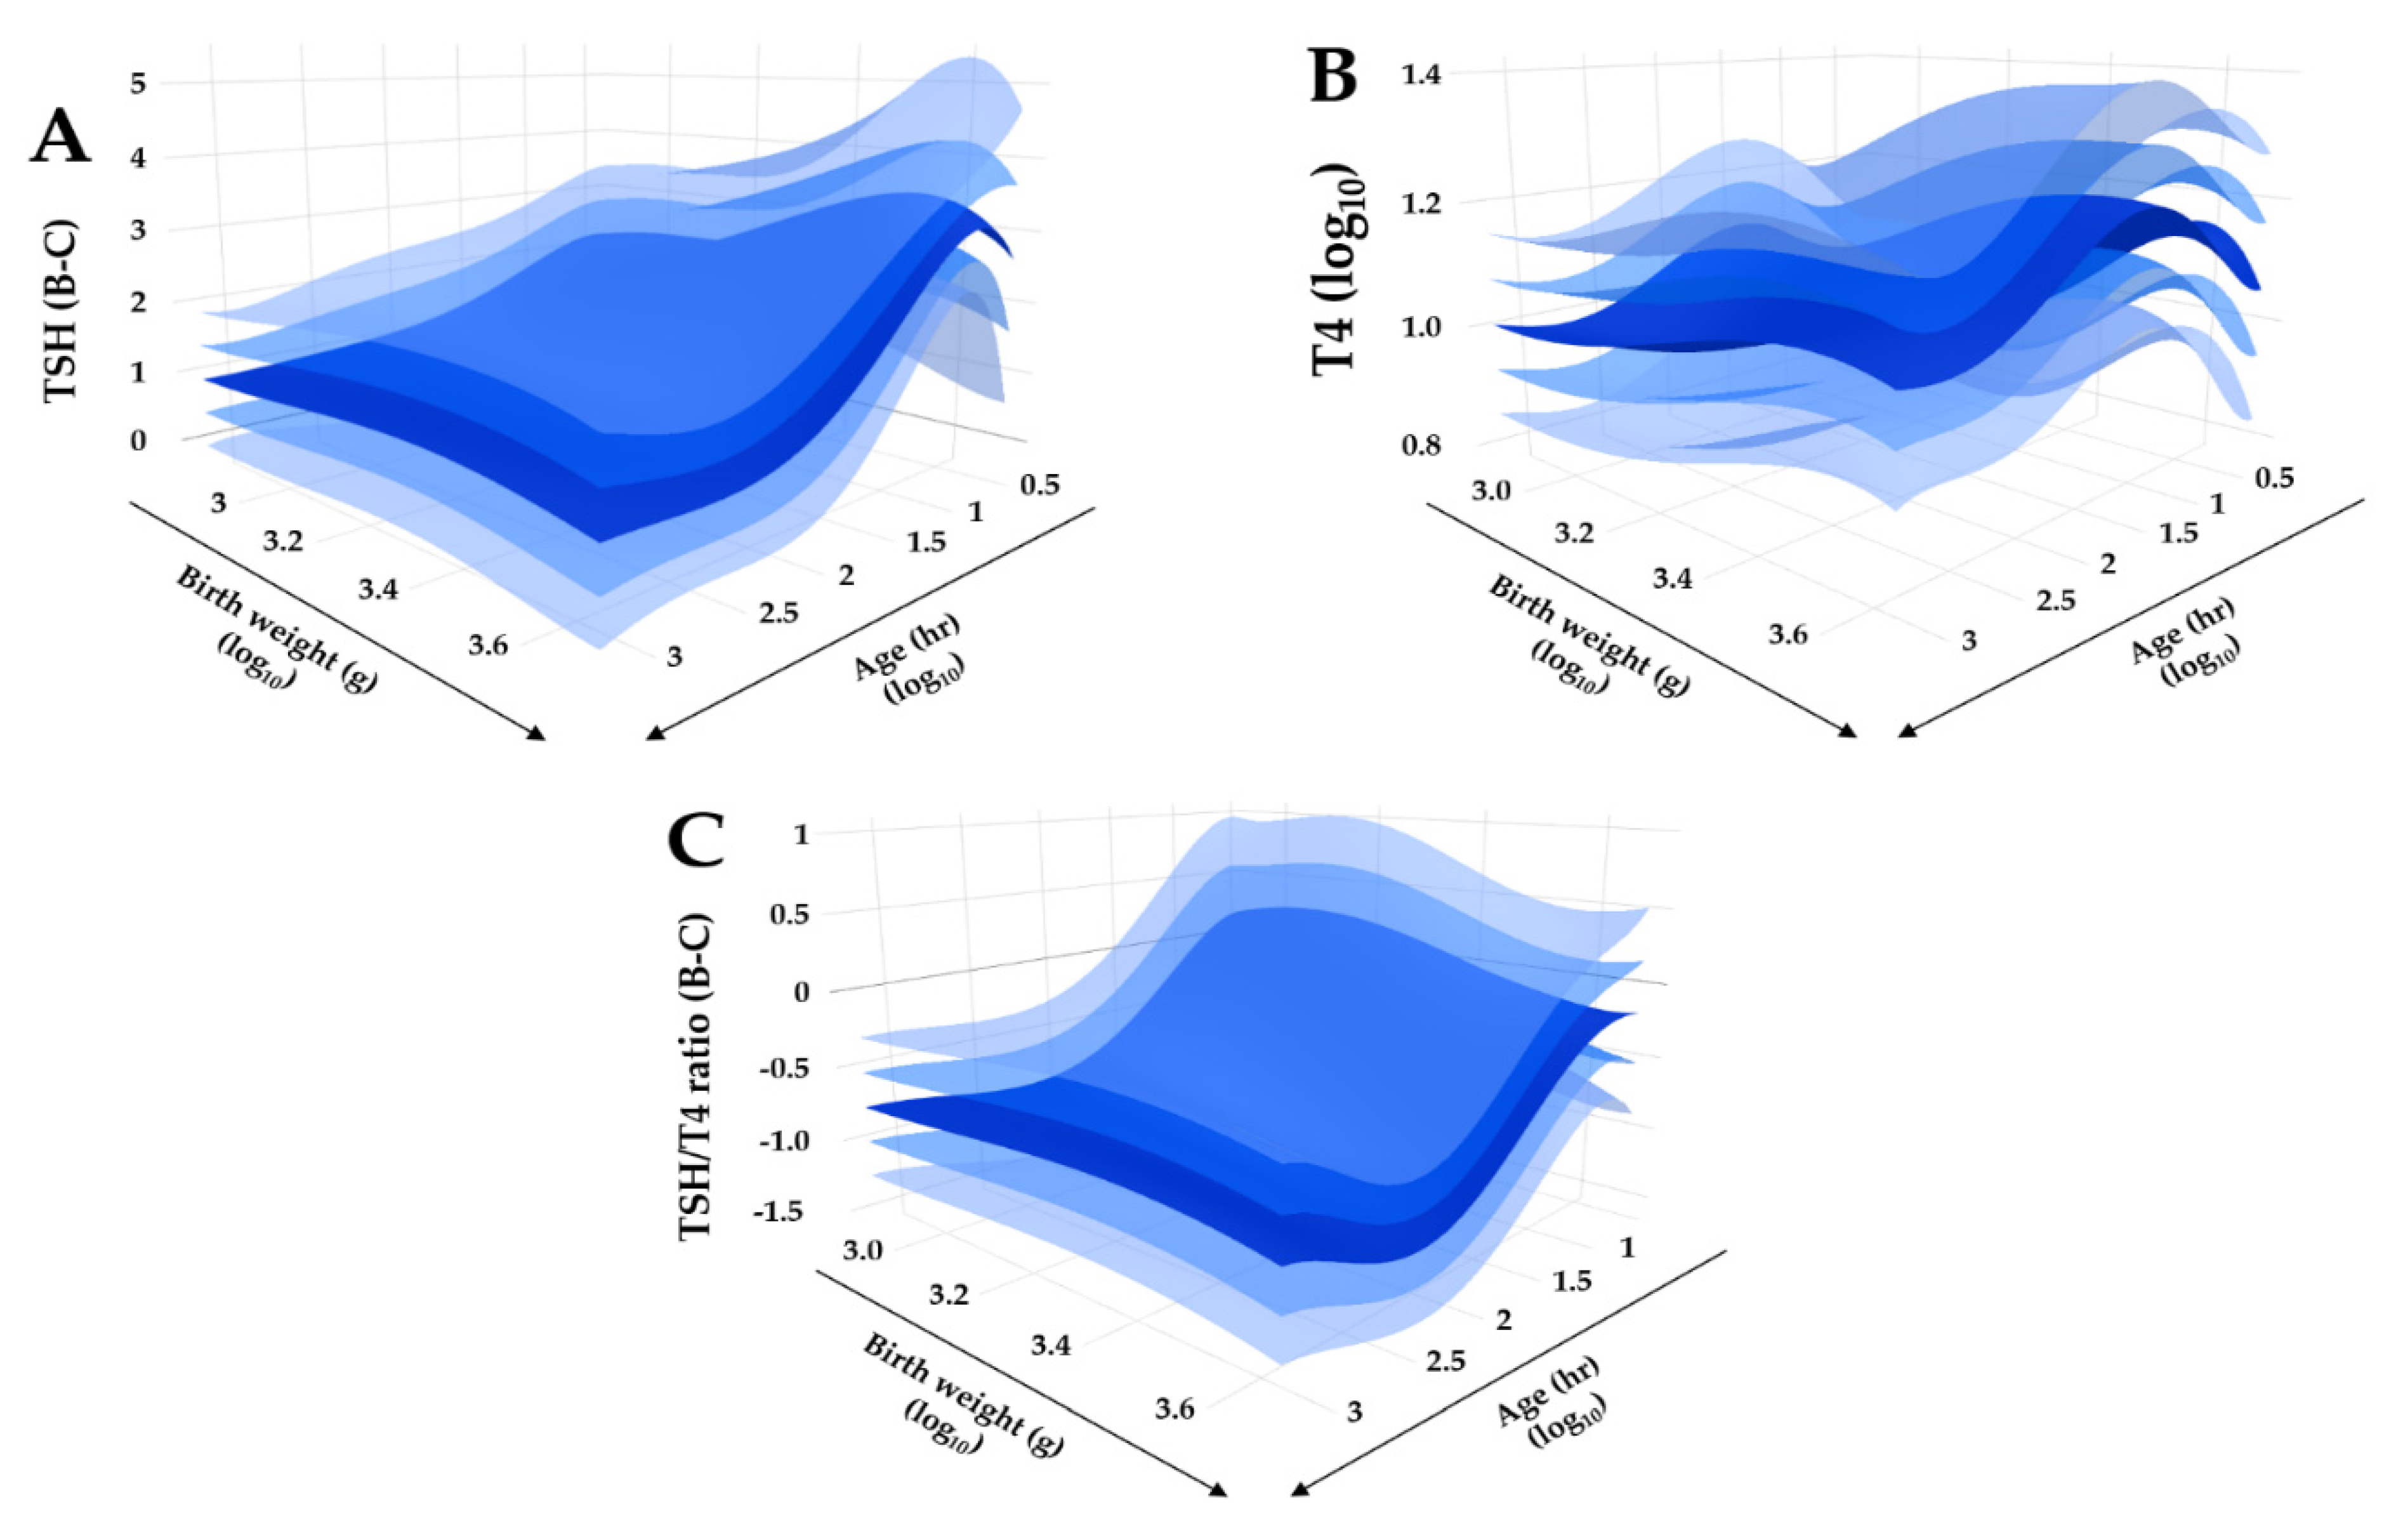
3.2. Reference Intervals Adjusted for Age, Birth, Weight and Location
3.3. Dual Scatter Plot Analysis
3.4. Cumulative Outcome of the Analysis of Verification Set
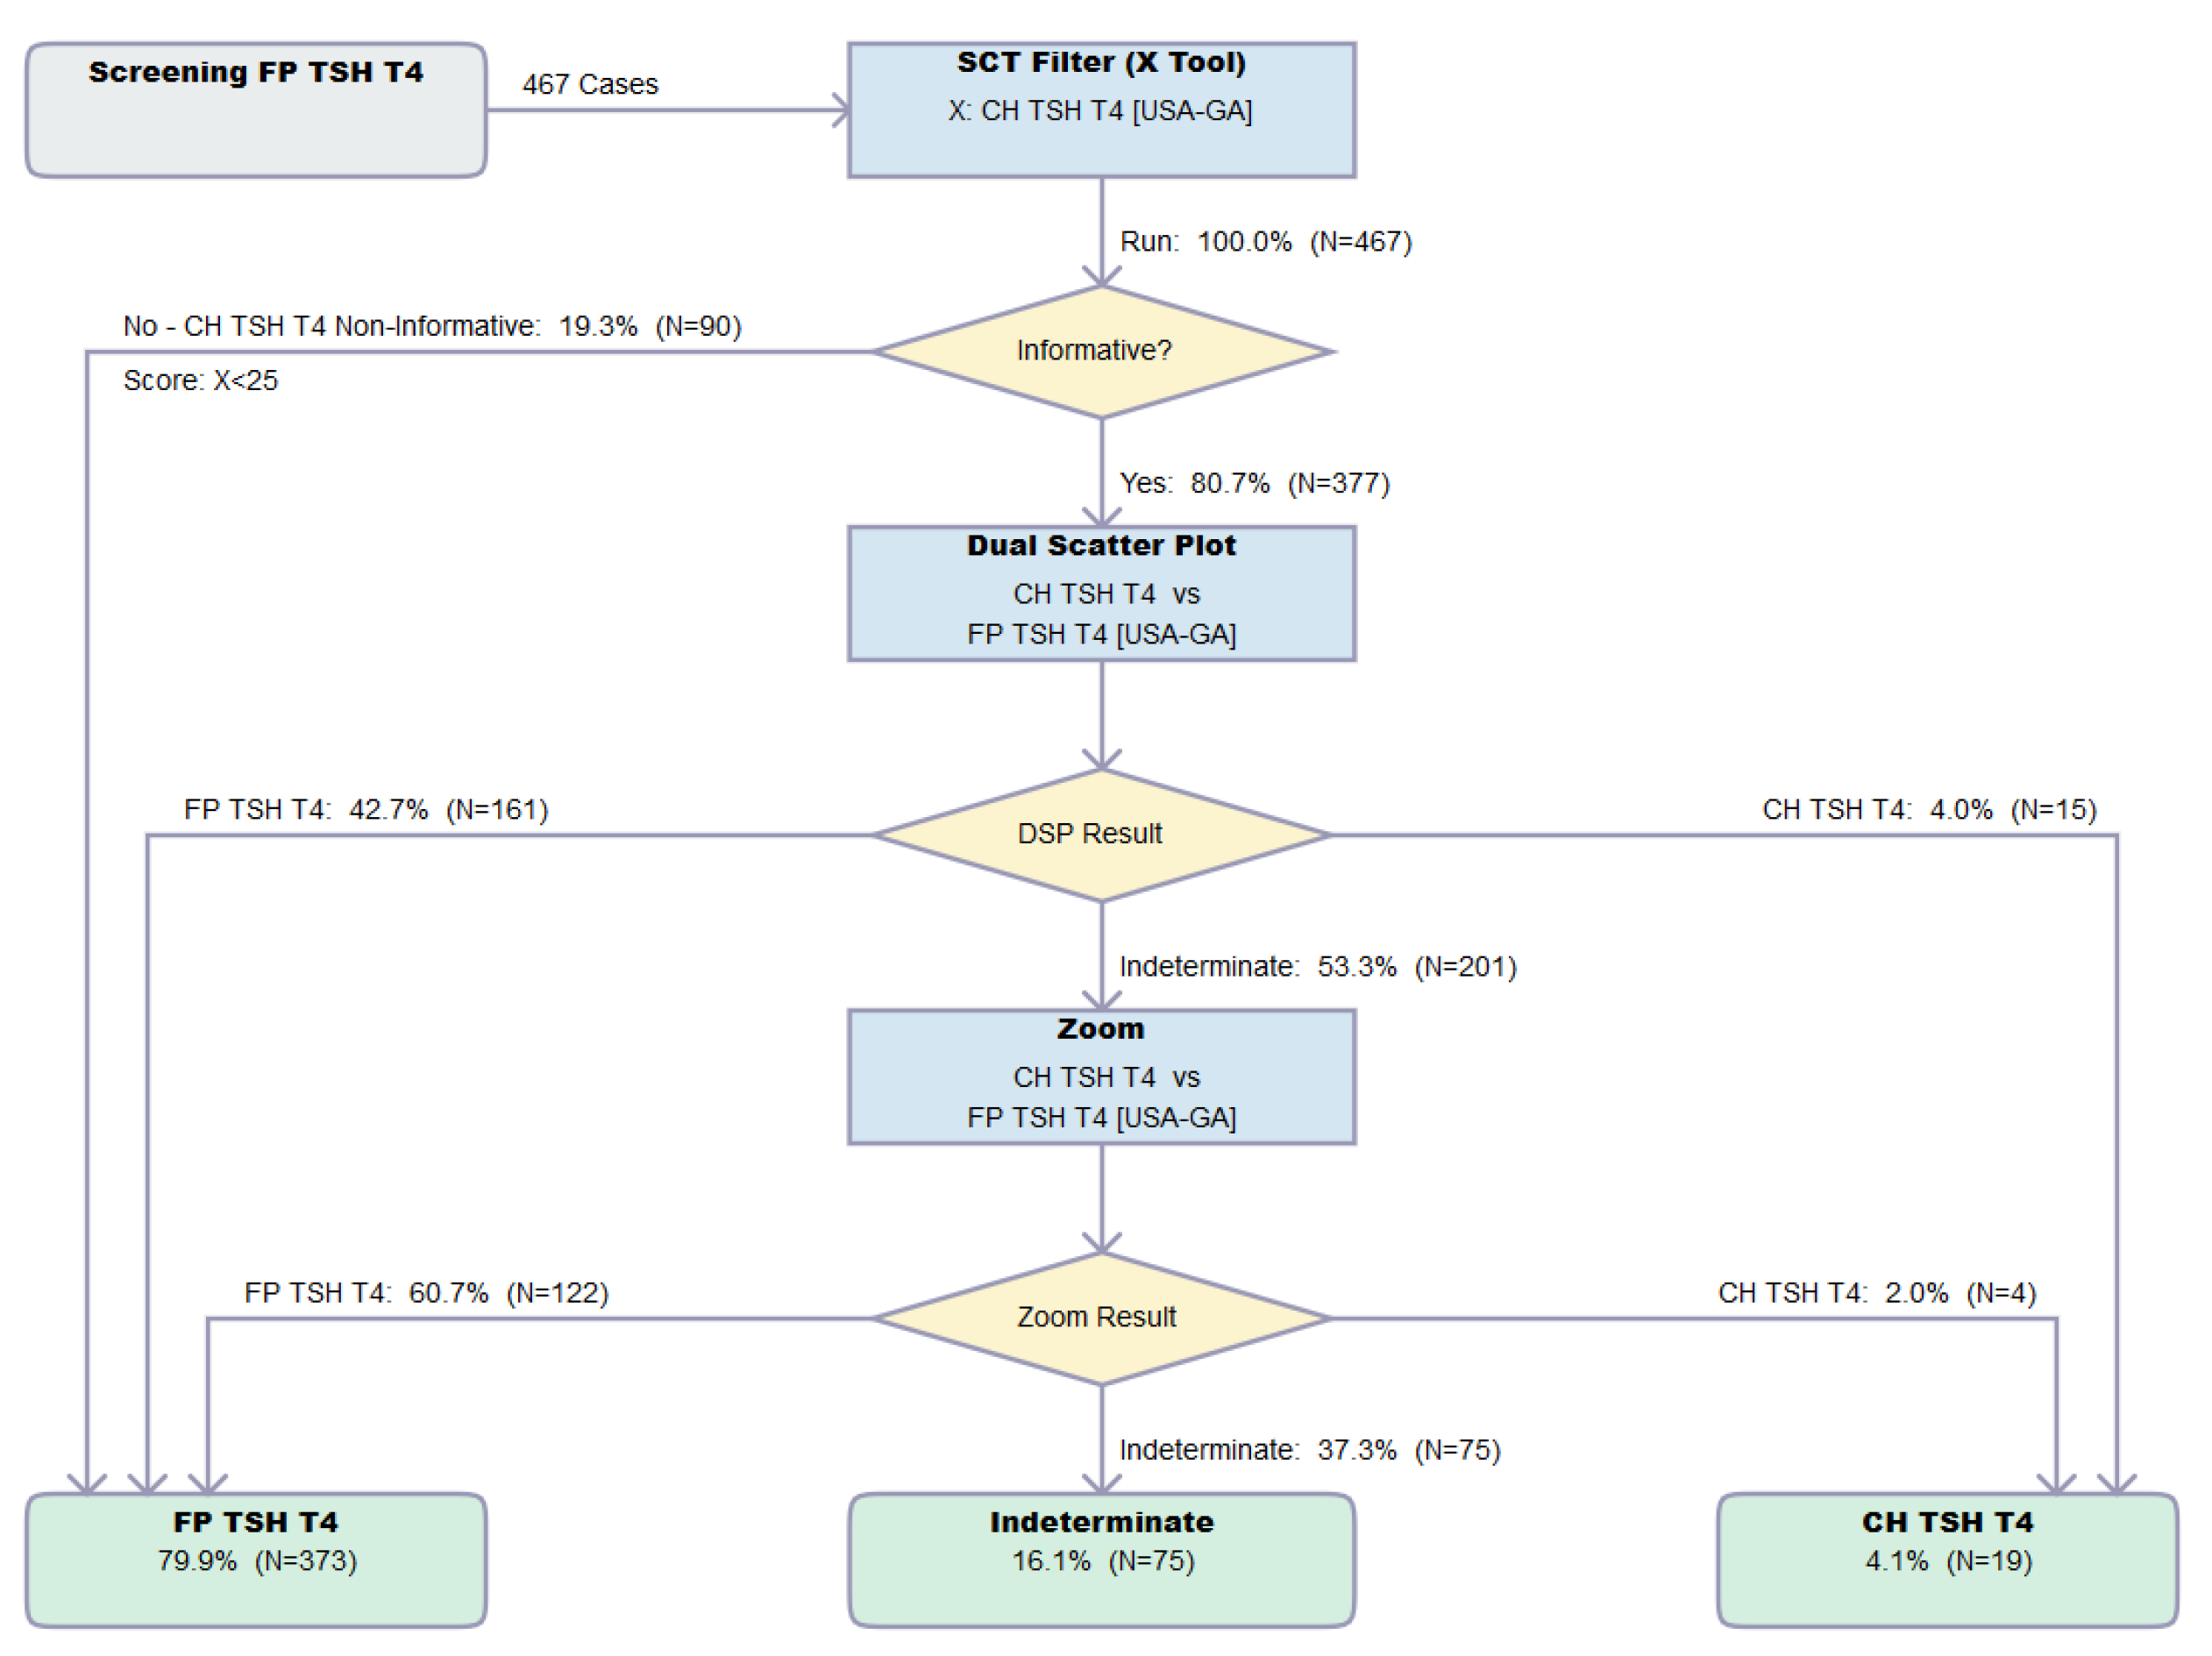
3.5. Impact of the Zoom Function toward the Resolution of FP Cases
4. Discussion
Supplementary Materials
Author Contributions
Funding
Institutional Review Board Statement
Informed Consent Statement
Acknowledgments
Conflicts of Interest
Abbreviations
References
- Grüters, A.; Krude, H. Detection and treatment of congenital hypothyroidism. Nat. Rev. Endocrinol. 2011, 8, 104–113. [Google Scholar] [CrossRef] [PubMed]
- LaFranchi, S.H. Newborn screening strategies for congenital hypothyroidism: An update. J. Inherit. Metab. Dis. 2010, 33 (Suppl. 2), S225–S233. [Google Scholar] [CrossRef]
- Lain, S.J.; Bentley, J.P.; Wiley, V.; Roberts, C.L.; Jack, M.; Wilcken, B.; Nassar, N. Association between borderline neonatal thyroid-stimulating hormone concentrations and educational and developmental outcomes: A population-based record-linkage study. Lancet Diabetes Endocrinol. 2016, 4, 756–765. [Google Scholar] [CrossRef]
- Salerno, M.C.; Improda, N.; Capalbo, D. Management of endocrine disease—Subclinical hypothyroidism in children. Eur. J. Endocrinol. 2020, 183, R13–R28. [Google Scholar] [CrossRef]
- Krude, H.; Blankenstein, O. Treating patients not numbers: The benefit and burden of lowering TSH newborn screening cut-offs. Arch. Dis Child. 2011, 96, 121–122. [Google Scholar] [CrossRef]
- Alm, J.; Hagenfeldt, L.; Larsson, A.; Lundberg, K. Incidence of congenital hypothyroidism: Retrospective study of neonatal laboratory screening versus clinical symptoms as indicators leading to diagnosis. Br. Med. J. 1984, 289, 1171–1175. [Google Scholar] [CrossRef]
- Van Trotsenburg, P.; Stoupa, A.; Léger, J.; Rohrer, T.; Peters, C.; Fugazzola, L.; Cassio, A.; Heinrichs, C.; Beauloye, V.; Pohlenz, J. Congenital Hypothyroidism: A 2020–2021 Consensus guidelines update—An ENDO-European reference network initiative endorsed by the European Society for Pediatric Endocrinology and the European Society for Endocrinology. Thyroid 2021, 31, 387–419. [Google Scholar] [CrossRef]
- Mehran, L.; Khalili, D.; Yarahmadi, S.; Amouzegar, A.; Mojarrad, M.; Ajang, N.; Azizi, F. Worldwide recall rate in newborn screening programs for congenital hypothyroidism. Int. J. Endocrinol. Metab. 2017, 15, e55451. [Google Scholar] [CrossRef]
- Rose, S.R.; Brown, R.S.; Foley, T.; Kaplowitz, P.B.; Kaye, C.I.; Sundararajan, S.; Varma, S.K. Update of newborn screening and therapy for congenital hypothyroidism. Pediatrics 2006, 117, 2290–2303. [Google Scholar]
- Counts, D.; Varma, S.K. Hypothyroidism in children. Pediatr. Rev. 2009, 30, 251–258. [Google Scholar] [CrossRef] [PubMed]
- Di Dalmazi, G.; Carlucci, M.A.; Semeraro, D.; Giuliani, C.; Napolitano, G.; Caturegli, P.; Bucci, I. A detailed analysis of the factors influencing neonatal TSH: Results From a 6-year congenital hypothyroidism screening program. Front. Endocrinol. 2020, 11, 456. [Google Scholar] [CrossRef]
- Korada, M.; Pearce, M.S.; Avis, E.; Turner, S.; Cheetham, T. TSH levels in relation to gestation, birth weight and sex. Horm. Res. 2009, 72, 120–123. [Google Scholar] [CrossRef] [PubMed]
- Moleti, M.C.; Di Mauro, M.; Sturniolo, G.; Russo, M.; Vermiglio, F. Hyperthyroidism in the pregnant woman: Maternal and fetal aspects. J. Clin. Transl. Endocrinol. 2019, 16, 100190. [Google Scholar] [CrossRef] [PubMed]
- Rastogi, M.V.; LaFranchi, S.H. Congenital hypothyroidism. Orphanet J. Rare Dis. 2010, 5, 17. [Google Scholar] [CrossRef]
- Wassner, A.J.; Brown, R.S. Congenital hypothyroidism: Recent advances. Curr. Opin. Endocrinol. Diabetes Obes. 2015, 22, 407–412. [Google Scholar] [CrossRef] [PubMed]
- Ford, G.; LaFranchi, S.H. Screening for congenital hypothyroidism: A worldwide view of strategies. Best Pract. Res. Clin. Endocrinol. Metab. 2014, 28, 175–187. [Google Scholar] [CrossRef]
- Knowles, R.L.; Oerton, J.; Cheetham, T.; Butler, G.; Cavanagh, C.; Tetlow, L.; Dezateux, C. Newborn screening for primary congenital hypothyroidism: Estimating test performance at different TSH thresholds. J. Clin. Endocrinol. Metab. 2018, 103, 3720–3728. [Google Scholar] [CrossRef]
- Lain, S.; Trumpff, C.; Grosse, S.D.; Olivieri, A.; Van Vliet, G. Are lower TSH cutoffs in neonatal screening for congenital hypothyroidism warranted? Eur. J. Endocrinol. 2017, 177, D1–D12. [Google Scholar] [CrossRef]
- McHugh, D.M.; Cameron, C.A.; Abdenur, J.E.; Abdulrahman, M.; Adair, O.; Al Nuaimi, S.A.; Ahlman, H.; Allen, J.J.; Antonozzi, I.; Archer, S.; et al. Clinical validation of cutoff target ranges in newborn screening of metabolic disorders by tandem mass spectrometry: A worldwide collaborative project. Genet. Med. 2011, 13, 230–254. [Google Scholar] [CrossRef]
- Marquardt, G.; Currier, R.; McHugh, D.M.; Gavrilov, D.; Magera, M.J.; Matern, D.; Oglesbee, D.; Raymond, K.; Rinaldo, P.; Smith, E.H.; et al. Enhanced interpretation of newborn screening results without analyte cutoff values. Genet. Med. 2012, 14, 648–655. [Google Scholar] [CrossRef]
- Hall, P.L.; Marquardt, G.; McHugh, D.M.; Currier, R.J.; Tang, H.; Stoway, S.D.; Rinaldo, P. Postanalytical tools improve performance of newborn screening by tandem mass spectrometry. Genet. Med. 2014, 16, 889–895. [Google Scholar] [CrossRef]
- Minter Baerg, M.M.; Stoway, S.D.; Hart, J.; Mott, L.; Peck, D.S.; Nett, S.L.; Eckerman, J.S.; Lacey, J.M.; Turgeon, C.T.; Gavrilov, D.; et al. Precision newborn screening for lysosomal disorders. Genet. Med. 2018, 20, 847–854. [Google Scholar] [CrossRef]
- Tortorelli, S.; Eckerman, J.S.; Orsini, J.J.; Stevens, C.; Hart, J.; Hall, P.L.; Alexander, J.J.; Gavrilov, D.; Oglesbee, D.; Raymond, K.; et al. Moonlighting newborn screening markers: The incidental discovery of a second tier test for Pompe disease. Genet. Med. 2018, 20, 840–846. [Google Scholar] [CrossRef]
- Watson, M.S.; Mann, M.Y.; Lloyd-Puryear, M.A.; Rinaldo, P.; Howell, R.R. (Eds.) Newborn screening: Toward a uniform screening panel and system [Executive summary]. Genet. Med. 2006, 8, 1S–11S. [Google Scholar] [CrossRef] [PubMed]
- Health Resources & Services Administration. Recommend Uniform Screening Panel (RUSP). Available online: https://www.hrsa.gov/advisory-committees/heritable-disorders/rusp/index.html (accessed on 21 December 2020).
- Clark, R.H.; Chace, D.H.; Spitzer, A.R. Effects of two different doses of amino acid supplementation on growth and blood amino acid levels in premature neonates admitted to the neonatal intensive care unit: A randomized, controlled trial. Pediatrics 2007, 120, 1286–1296. [Google Scholar] [CrossRef] [PubMed]
- De Jesús, V.R.; Adam, B.W.; Mandel, D.; Cuthbert, C.D.; Matern, D. Succinylacetone as primary marker to detect tyrosinemia type I in newborns and its measurement by newborn screening programs. Mol. Genet. Metab. 2014, 113, 67–75. [Google Scholar] [CrossRef] [PubMed]
- Gavrilov, D.K.; Piazza, A.L.; Pino, G.; Turgeon, C.; Matern, D.; Oglesbee, D.; Raymond, K.; Tortorelli, S.; Rinaldo, P. The combined impact of CLIR post-analytical tools and second tier testing on the performance of newborn screening for disorders of propionate, methionine, and cobalamin metabolism. Int. J. Neonatal Screen. 2020, 6, 33. [Google Scholar] [CrossRef]
- Congress.gov. H.R.1281—Newborn Screening Saves Lives Reauthorization Act of 2014. Available online: https://www.congress.gov/bill/113thcongress/house-bill/1281 (accessed on 21 December 2020).
- Mørkrid, L.; Rowe, A.D.; Elgstoen, K.B.P.; Olesen, J.H.; Ruijter, G.; Hall, P.L.; Tortorelli, S.; Schulze, A.; Kyriakopoulou, L.; Wamelink, M.M.C.; et al. Continuous age- and gender-adjusted reference intervals of urinary markers for cerebral creatine deficiency syndromes: A novel approach to the definition of reference intervals. Clin. Chem. 2015, 61, 760–768. [Google Scholar] [CrossRef]
- Sheather, S.J.; Jones, M.C. A reliable data-based bandwidth selection method for kernel density estimation. J. R. Stat. Soc. Ser. B 1991, 53, 683–690. [Google Scholar] [CrossRef]
- Rinaldo, P. R4S Collaborative Project: Post-Analytical Interpretive Tools. Mayo Clinic Laboratories Insights. Available online: https://news.mayocliniclabs.com/2013/06/18/new-hot-topic-the-region-4-stork-r4s-collaborative-project-part-3-post-analytical-interpretive-tools/ (accessed on 21 December 2020).
- Vogel, B.H.; Bonagura, V.; Weinberg, G.A.; Ballow, M.; Isabelle, J.; DiAntonio, L.; Parker, A.; Young, A.; Cunningham-Rundles, C.; Fong, C.T.; et al. Newborn screening for SCID in New York State: Experience from the first two years. J. Clin. Immunol. 2014, 34, 289–303. [Google Scholar] [CrossRef]
- Amatuni, G.S.; Currier, R.J.; Church, J.A.; Bishop, T.; Grimbacher, E.; Anh-Chuong Nguyen, A.; Agarwal-Hashmi, R.; Aznar, C.P.; Butte, M.J.; Cowan, M.J.; et al. Newborn Screening for Severe Combined Immunodeficiency and T-cell Lymphopenia in California, 2010–2017. Pediatrics 2019, 143, e20182300. [Google Scholar] [CrossRef] [PubMed]
- Lanting, C.I.; van Tijn, D.A.; Loeber, J.G.; Vulsma, T.; de Vijlder, J.J.M.; Verkerk, P.H. Clinical effectiveness and cost-effectiveness of the use of the thyroxine/thyroxine-binding globulin ratio to detect congenital hypothyroidism of thyroidal and central origin in a neonatal screening program. Pediatrics 2005, 116, 168–172. [Google Scholar] [CrossRef] [PubMed]
- Soneda, A.; Adachi, M.; Muroya, K.; Asakura, Y.; Yamagami, Y.; Hirahara, F. Overall usefulness of newborn screening for congenital hypothyroidism by using free thyroxine measurement. Endocr. J. 2014, 61, 1025–1030. [Google Scholar] [CrossRef]
- Matern, D.; Tortorelli, S.; Oglesbee, D.; Gavrilov, D.; Rinaldo, P. Reduction of the false positive rate in newborn screening by implementation of MS/MS-based second tier tests: The Mayo Clinic experience (2004–2007). J. Inherit. Metab. Dis. 2007, 30, 585–592. [Google Scholar] [CrossRef] [PubMed]
- CLSI. Newborn Screening for Preterm, Low Birth Weight, and Sick Newborns, 2nd ed.; Wayne, P.A., Ed.; CLSI Guideline NBS03; Clinical and Laboratory Standards Institute: Annapolis Junction, MD, USA, 2019. [Google Scholar]
- Tortorelli, S.; Turgeon, C.T.; Gavrilov, D.K.; Oglesbee, D.; Raymond, K.M.; Rinaldo, P.; Matern, D. Simultaneous testing for six lysosomal storage disorders and X-adrenoleukodystrophy in dried blood spots by tandem mass spectrometry. Clin. Chem. 2016, 62, 1248–1254. [Google Scholar] [CrossRef]
- NewSTEPs List of Time-critical Disorders. Available online: https://www.newsteps.org/sites/default/files/case-definitions/qi_source_document_time_critical_disorders_0.pdf (accessed on 4 February 2021).
- Fisher, D.A.; Odell, W.D. Acute release of thyrotropin in the newborn. J. Clin. Investig. 1969, 48, 1670–1677. [Google Scholar] [CrossRef]
- Rinaldo, P. Precision NBS Driven by Adjustment for Multiple Covariates. Available online: https://clir.mayo.edu/Resources/Document/LoginView/186/18-10-15%20ISNS%20Bratislava.pdf (accessed on 7 February 2021).


| Marker | Unit | California | Norway | Sweden | Georgia | Kentucky | New York | Virginia |
|---|---|---|---|---|---|---|---|---|
| TSH | M[UI]/L | + | + 1 | + | + | + | - 2 | - 2 |
| T4 | µg/dL | - | - | - | + | + | + | + |
| IRT | µg/dL | + | - | - | + | + | + | + |
| 17OHP | ng/mL | + | + 3 | + | + | + | + | + |
| C3 | nmol/mL | + 4 | + 4 | + 4 | + 4 | + 5 | + 5 | + 5 |
| C16 | nmol/ml | + 4 | + 4 | + 4 | + 4 | + 5 | + 5 | + 5 |
| CIT | nmol/mL | + 4 | + 4 | + 4 | + 4 | + 5 | + 5,6 | + 5 |
| TYR | nmol/mL | + 4 | + 4 | + 4 | + 4 | + 5 | + 5,6 | + 5 |
| BIOT | ERU | + | + 7 | + 8 | + | - 9 | - 9 | - 9 |
| GALT | U/g[Hb] | + | - | + | + | - 9 | - 9 | - 9 |
| TRECS | copies/µL | + | - | - | - | - | + | - |
| GALC | nmol/mL/hr | - | - | - | - | - | + | - |
| Measured in this study | 10 | 8 | 8 | 10 | 8 | 9 | 7 | |
| California | Norway | Sweden | Georgia | Kentucky | New York | Virginia | Total | |
|---|---|---|---|---|---|---|---|---|
| Samples submitted | 537,225 | 223,168 | 90,021 | 272,832 | 232,017 | 389,109 | 226,164 | 1,970,536 |
| Covariate errors | 4126 | 1093 | − | 6787 | 5164 | 7173 | 3150 | 27,493 |
| Marker errors | 45 | 259 | − | 78 | 7345 | 2508 | 35 | 10,270 |
| Samples excluded | 4171 | 1352 | − | 6865 | 12,509 | 9681 | 3185 | 37,763 |
| % excluded | 0.8% | 0.6% | 0.0% | 2.5% | 5.4% | 2.5% | 1.4% | 1.9% |
| Samples uploaded | 533,054 | 221,816 | 90,021 | 265,967 | 219,508 | 379,428 | 222,979 | 1,932,773 |
| Continuous Covariate | Unit of Measure | Covariate Interval | End of Interval | Proportion of Data (%) a | Unit of Increment |
|---|---|---|---|---|---|
| Age at collection | hours | 1–168 | 1 week | 97.70% | 1 |
| 169–552 | 1 month | 1.48% | 6 | ||
| 553–4380 | 6 months | 0.80% | 24 | ||
| 4381–8760 | 1 year | 0.01% | n/a | ||
| Birth weight | grams | 250–5000 | n/a | 99.86% | 25 |
| 5001–10,000 | n/a | 0.14% | n/a |
| Abnormal Markers | |||||||||||||
|---|---|---|---|---|---|---|---|---|---|---|---|---|---|
| TSH H + T4 L | TSH H | T4 L | Total Counts by Location | ||||||||||
| Validation | TP | FP | TP | FP | TP | FP | TP | % a | FP | % a | All | % a | T/F Ratio |
| California | − | − | 162 | 92 | − | − | 162 | 18% | 92 | 0.90% | 254 | 2% | 1.76 |
| Norway | − | − | 47 | 48 | − | − | 47 | 5% | 48 | 0.50% | 95 | 0.80% | 0.98 |
| Sweden | − | − | 65 | 31 | − | − | 65 | 7% | 31 | 0.30% | 96 | 0.80% | 2.1 |
| Georgia | 122 | 1549 | 98 | 2635 | 39 | 3676 | 259 | 28% | 7860 | 74% | 8119 | 71% | 0.03 |
| Kentucky | 72 | 49 | 47 | 668 | 9 | 232 | 128 | 14% | 949 | 9% | 1077 | 9% | 0.13 |
| New York | 113 | 119 | 43 | 162 | 31 | 747 | 187 | 20% | 1028 | 10% | 1215 | 11% | 0.18 |
| Virginia | 46 | 187 | 12 | 86 | 9 | 275 | 67 | 7% | 548 | 5% | 615 | 5% | 0.12 |
| Total | 353 | 1904 | 474 | 3722 | 88 | 4930 | 915 | 8% | 10,556 | 92% | 11,471 | ||
| Verification | |||||||||||||
| California | − | − | 143 | 82 | − | − | 143 | 31% | 82 | 1.80% | 225 | 4% | 1.74 |
| Norway | − | − | 18 | 31 | − | − | 18 | 4% | 31 | 0.70% | 49 | 1% | 0.58 |
| Sweden | − | − | 60 | 41 | − | − | 60 | 13% | 41 | 0.90% | 101 | 2% | 1.46 |
| Georgia | 30 | 467 | 34 | 996 | 24 | 803 | 88 | 19% | 2266 | 49% | 2354 | 46% | 0.04 |
| Kentucky | 10 | 4 | 8 | 52 | 2 | 71 | 20 | 4% | 127 | 3% | 147 | 3% | 0.16 |
| New York | 46 | 119 | 37 | 161 | 12 | 377 | 95 | 21% | 657 | 14% | 752 | 15% | 0.14 |
| Virginia | 25 | 179 | 3 | 122 | 2 | 1140 | 30 | 7% | 1441 | 31% | 1471 | 29% | 0.02 |
| Total | 111 | 769 | 303 | 1485 | 40 | 2391 | 454 | 9% | 4645 | 91% | 5099 | ||
| California | Norway | Sweden | Georgia | Kentucky | New York | Virginia | Totals | ||
|---|---|---|---|---|---|---|---|---|---|
| First tier screening | TSH | TSH | TSH | TSH + T4 | TSH + T4 | T4 | T4 | ||
| Second tier test | TSH | TSH | |||||||
| Other markers (ratios) | 9 | 7 | 8 | 8 | 6 | 8 | 6 | 52 | |
| Single condition tools (SCT) | 2 | 2 | 2 | 6 | 6 | 6 | 6 | 30 | |
| Dual scatter plots (DSP) | 1 | 1 | 1 | 3 | 3 | 3 | 3 | 15 | |
| True positive cases | 143 | 18 | 60 | 88 | 20 | 95 | 30 | 454 | |
| Cases resolved as FP by SCT | - | - | - | - | - | - | - | 0 | |
| Cases resolved as FP by DSP | - | - | - | 2 | - | 2 | - | 4 | |
| Cases resolved as FP by Zoom | - | - | - | 4 | - | - | - | 4 | |
| Screens resolved as FP by CLIR | 0 | 0 | 0 | 6 | 0 | 2 | 0 | 8 | |
| % | 0% | 0% | 0% | 7% | 0% | 2% | 0% | 2% | |
| False positive cases | 82 | 31 | 41 | 2732 | 127 | 657 | 1777 | 5447 | |
| Cases resolved as FP by SCT | 4 | 6 | - | 637 | 3 | 17 | 107 | 774 | (40%) |
| Cases resolved as FP by DSP | 3 | - | 5 | 489 | 2 | 133 | 180 | 812 | (42%) |
| Cases resolved as FP by Zoom | 33 | 3 | 8 | 229 | - | 55 | 17 | 345 | (18%) |
| Screens resolved as FP by CLIR | 40 | 9 | 13 | 1355 | 5 | 205 | 304 | 1931 | |
| % | 49% | 29% | 32% | 50% | 4% | 31% | 17% | 35% |
| Case | Site | Tool | Age (Hours) | Birth Weight (Grams) | Gest. Age (Weeks) | Sex | TSH (m[IU]/L | T4 (µg/dL) | Resolution by SCT | Resolution by DSP | Resolution by Zoom |
|---|---|---|---|---|---|---|---|---|---|---|---|
| Case 01 | GA | TSH T4 | 1 | 1474 | n/a | Male | 54 | 2.1 | Informative | Indeterminate | FP |
| Case 02 | GA | TSH T4 | 1 | 911 | n/a | Female | 53 | 4.1 | Informative | Indeterminate | FP |
| Case 03 | GA | TSH T4 | 1 | 2535 | n/a | Male | 51 | 6.0 | Informative | Indeterminate | FP |
| Case 04 | GA | TSH T4 | 715 | 540 | n/a | Male | 22 | 1.8 | Informative | Indeterminate | FP |
| Case 05 | GA | T4 | 659 | 669 | n/a | Male | 8 | 4.8 | Informative | FP | - |
| Case 06 | GA | T4 | 1 | 437 | n/a | Female | 13 | 4.6 | NI | - | - |
| Case 07 | NY | TSH T4 | 1 | 3010 | 39 | Male | 23 | 4.6 | Informative | FP | - |
| Case 08 | NY | TSH T4 | 1 | 515 | 30.1 | Male | 34 | 5.3 | Informative | FP | - |
Publisher’s Note: MDPI stays neutral with regard to jurisdictional claims in published maps and institutional affiliations. |
© 2021 by the authors. Licensee MDPI, Basel, Switzerland. This article is an open access article distributed under the terms and conditions of the Creative Commons Attribution (CC BY) license (https://creativecommons.org/licenses/by/4.0/).
Share and Cite
Rowe, A.D.; Stoway, S.D.; Åhlman, H.; Arora, V.; Caggana, M.; Fornari, A.; Hagar, A.; Hall, P.L.; Marquardt, G.C.; Miller, B.J.; et al. A Novel Approach to Improve Newborn Screening for Congenital Hypothyroidism by Integrating Covariate-Adjusted Results of Different Tests into CLIR Customized Interpretive Tools. Int. J. Neonatal Screen. 2021, 7, 23. https://doi.org/10.3390/ijns7020023
Rowe AD, Stoway SD, Åhlman H, Arora V, Caggana M, Fornari A, Hagar A, Hall PL, Marquardt GC, Miller BJ, et al. A Novel Approach to Improve Newborn Screening for Congenital Hypothyroidism by Integrating Covariate-Adjusted Results of Different Tests into CLIR Customized Interpretive Tools. International Journal of Neonatal Screening. 2021; 7(2):23. https://doi.org/10.3390/ijns7020023
Chicago/Turabian StyleRowe, Alexander D., Stephanie D. Stoway, Henrik Åhlman, Vaneet Arora, Michele Caggana, Anna Fornari, Arthur Hagar, Patricia L. Hall, Gregg C. Marquardt, Bobby J. Miller, and et al. 2021. "A Novel Approach to Improve Newborn Screening for Congenital Hypothyroidism by Integrating Covariate-Adjusted Results of Different Tests into CLIR Customized Interpretive Tools" International Journal of Neonatal Screening 7, no. 2: 23. https://doi.org/10.3390/ijns7020023
APA StyleRowe, A. D., Stoway, S. D., Åhlman, H., Arora, V., Caggana, M., Fornari, A., Hagar, A., Hall, P. L., Marquardt, G. C., Miller, B. J., Nixon, C., Norgan, A. P., Orsini, J. J., Pettersen, R. D., Piazza, A. L., Schubauer, N. R., Smith, A. C., Tang, H., Tavakoli, N. P., ... Rinaldo, P. (2021). A Novel Approach to Improve Newborn Screening for Congenital Hypothyroidism by Integrating Covariate-Adjusted Results of Different Tests into CLIR Customized Interpretive Tools. International Journal of Neonatal Screening, 7(2), 23. https://doi.org/10.3390/ijns7020023


