The Methodological Quality and Challenges in Conducting Economic Evaluations of Newborn Screening: A Scoping Review

 ,
,  ,
,
Abstract
1. Introduction
2. Materials and Methods
3. Results
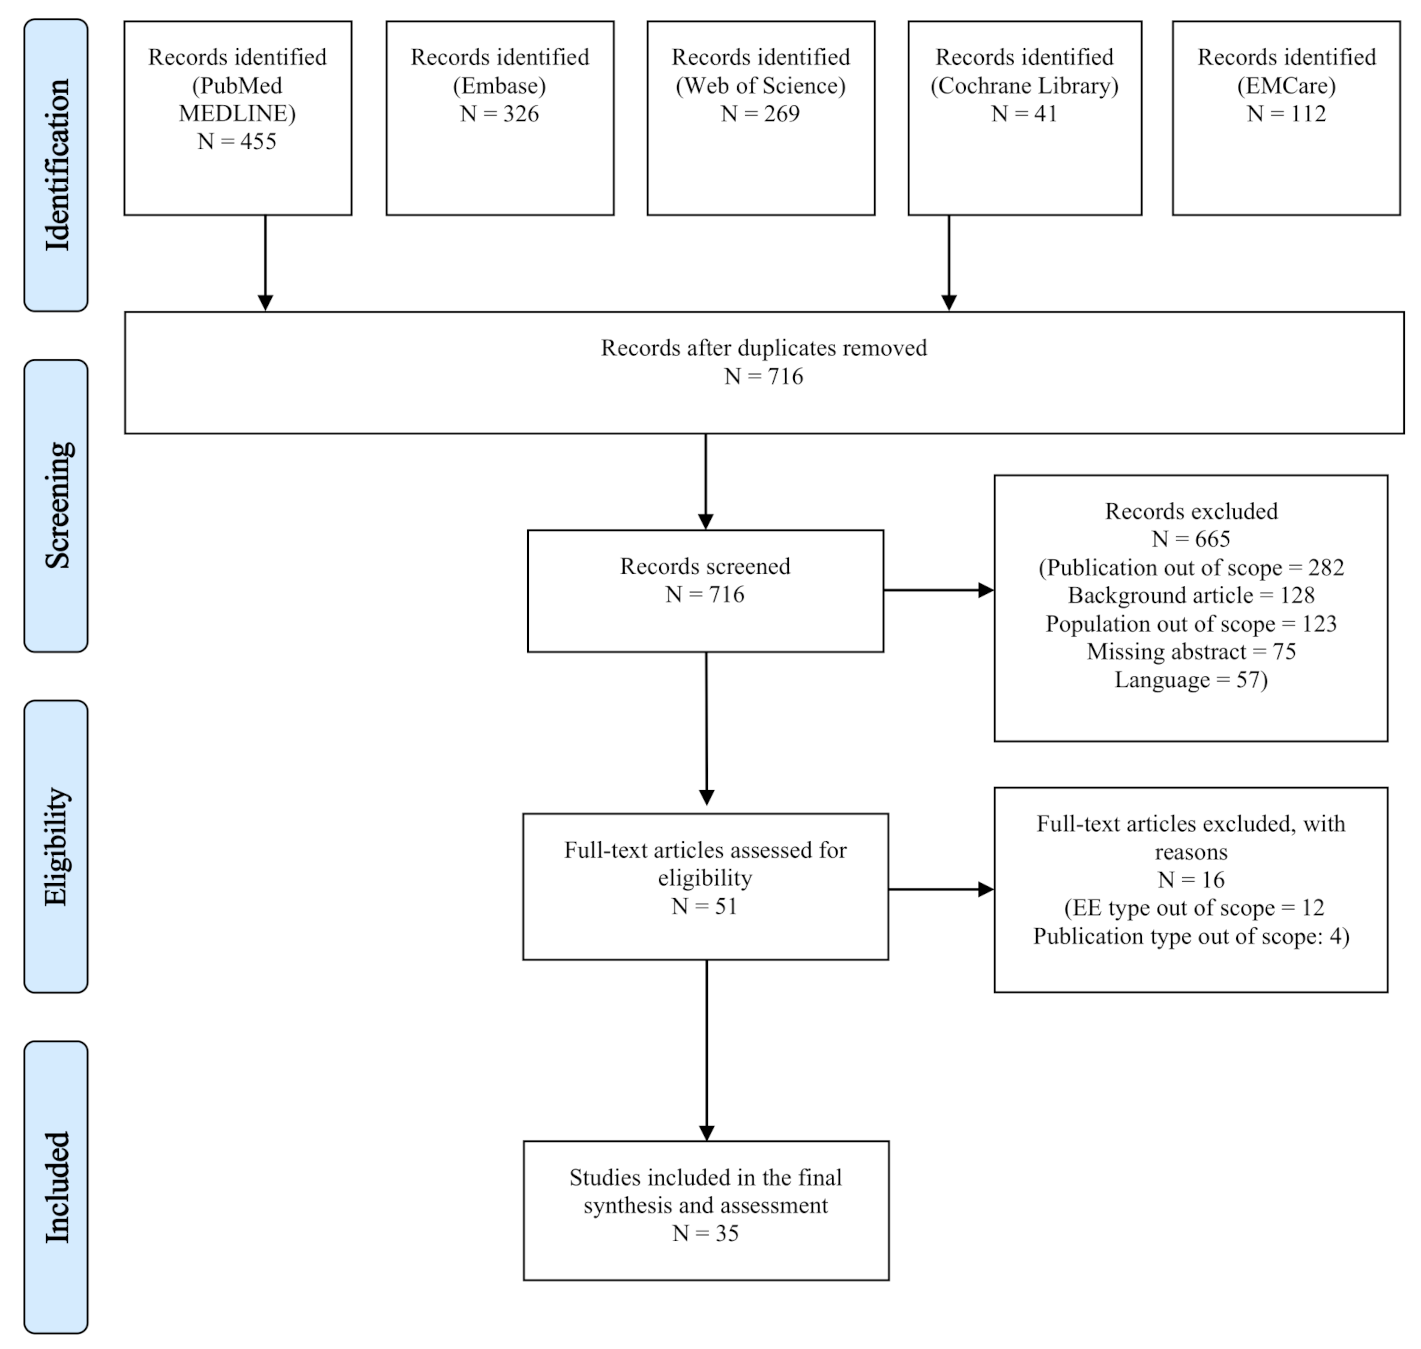
3.1. Search Outcomes
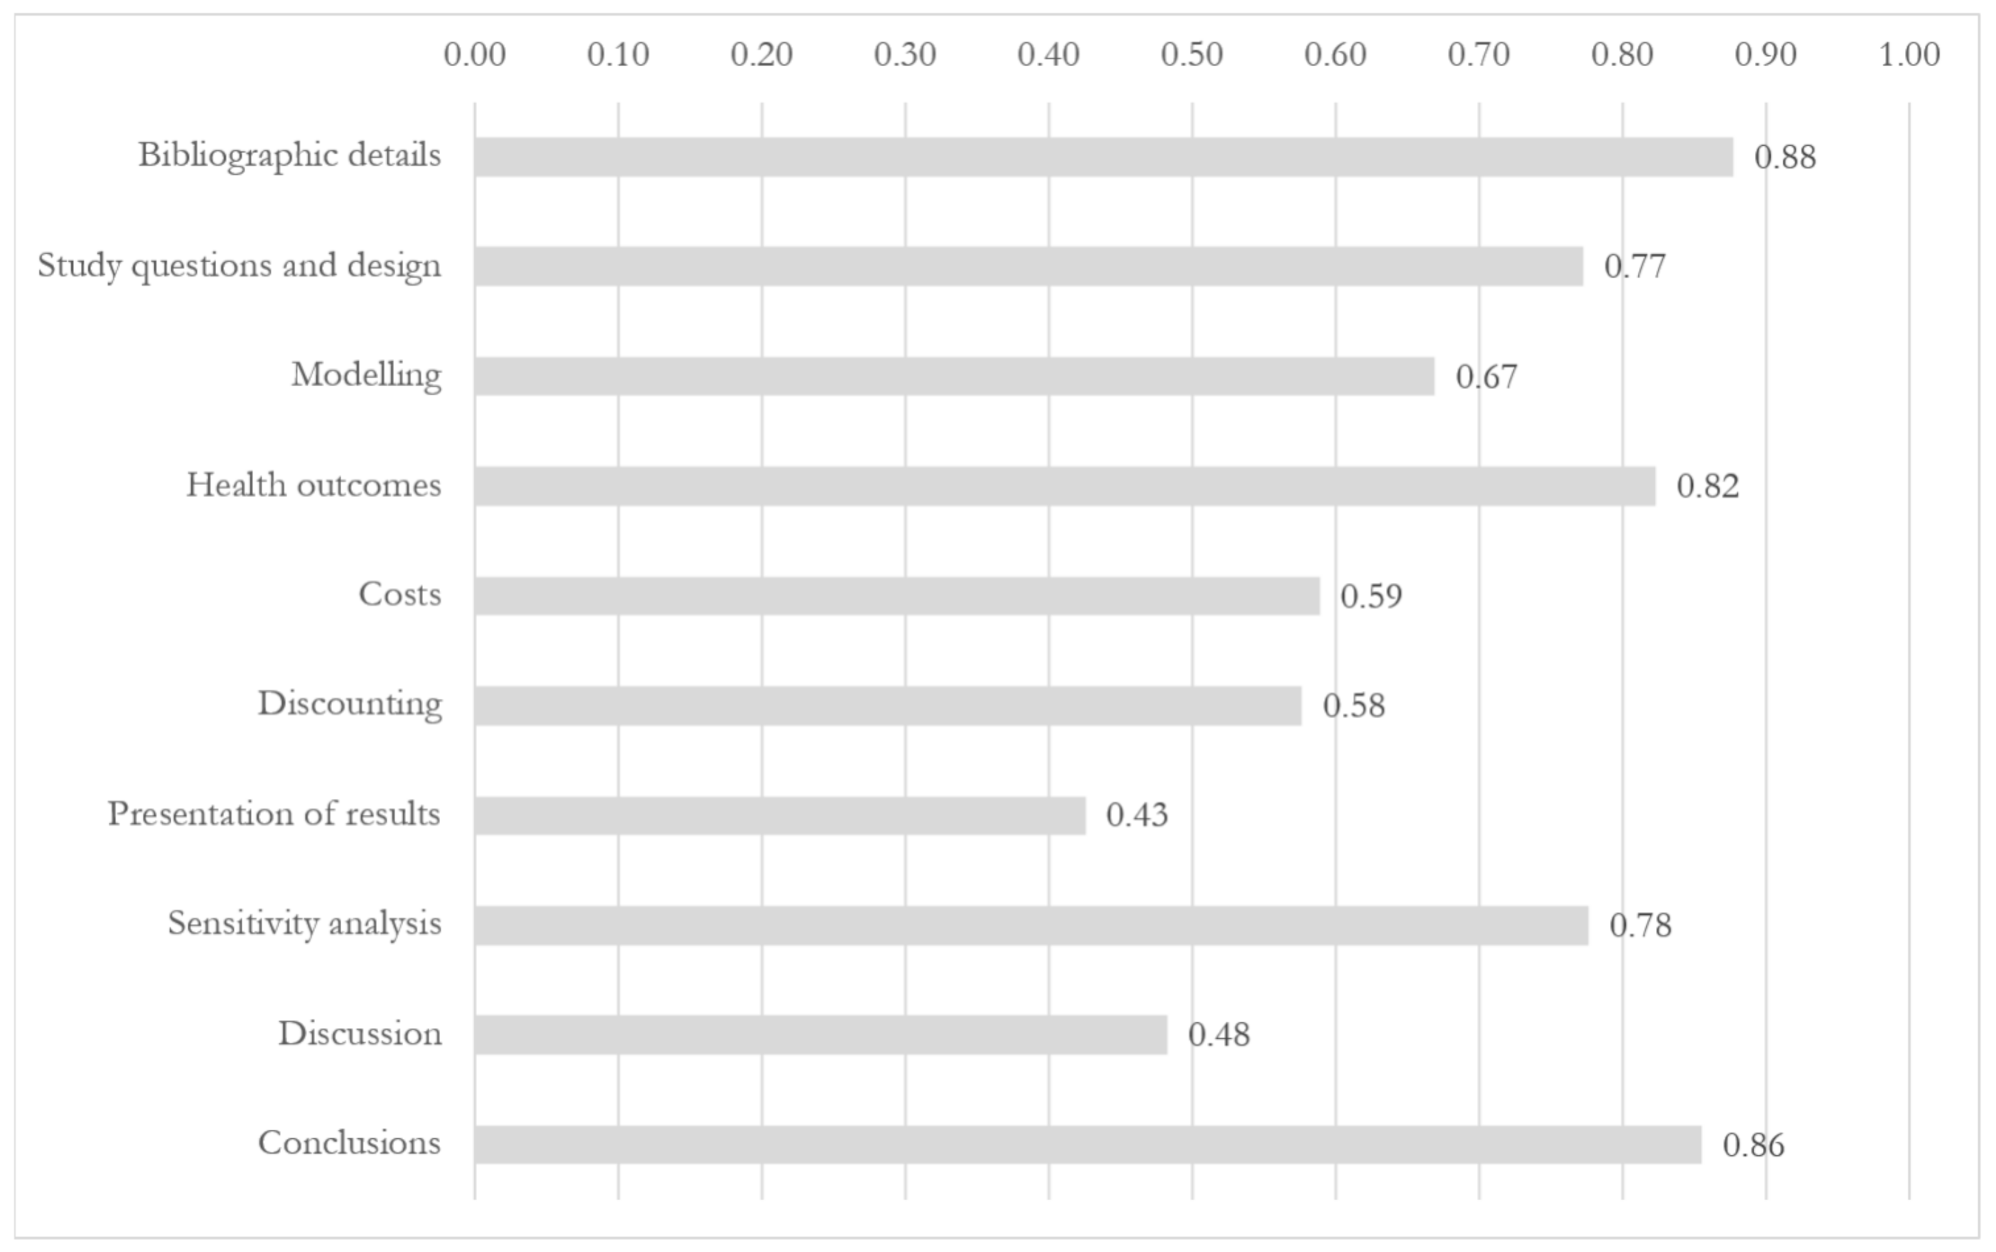
3.2. Assessment Results
3.2.1. Study Questions and Design
3.2.2. Modeling
3.2.3. Health Outcomes
3.2.4. Costs
3.2.5. Discounting
3.2.6. Presentation of Results
3.2.7. Sensitivity Analysis
3.2.8. Discussion
3.2.9. Conclusions
3.3. Qualitative Assessment
3.3.1. Study Questions and Design
3.3.2. Modeling
3.3.3. Health Outcomes
3.3.4. Costs
3.3.5. Discounting
3.3.6. Sensitivity Analysis
3.3.7. Discussion
4. Discussion
5. Conclusions
Author Contributions
Funding
Acknowledgments
Conflicts of Interest
Abbreviations
| ACER | Average Cost-Effectiveness Ratio |
| CBA | Cost–Benefit Analysis |
| CEA | Cost-Effectiveness Analysis |
| CUA | Cost–Utility Analysis |
| DALY | Daily-Adjusted Life Year |
| EE | Economic Evaluation |
| HRQoL | Health-Related Quality of Life |
| HTA | Health Technology Assessment |
| ICER | Incremental Cost-Effectiveness Ratio |
| INAHTA | International Network of Agencies of Health Technology Assessment |
| LY | Life Year |
| NBS | Newborn screening |
| PRISMA | Preferred Reporting Items for Systematic Reviews and Meta-Analyses |
| QALD | Quality-Adjusted Life Day |
| QALM | Quality-Adjusted Life Months |
| QALY | Quality-Adjusted Life Year |
Appendix A. Search Filters
Appendix A.1. PubMed
(((("economic evaluations"[tw] OR "economic evaluation"[tw] OR "Cost-Benefit Analysis"[Mesh] OR "Cost-Benefit Analysis"[tw] OR "Benefits and Costs"[tw] OR "Cost Benefit"[tw] OR "Cost Benefit Analysis"[tw] OR "Cost Benefit Data"[tw] OR "Cost Effectiveness"[tw] OR "Cost Effectiveness Analysis"[tw] OR "Cost Effective"[tw] OR "Cost Utility"[tw] OR "Cost Utility Analysis"[tw] OR "Costs and Benefits"[tw] OR "Marginal Analysis"[tw]) AND ("Neonatal Screening"[majr] OR "Neonatal Screening"[ti] OR "Neonatal Screenings"[ti] OR "newborn screening"[ti] OR "newborn screenings"[ti] OR "Newborn Infant Screening"[ti] OR (("screening"[ti] OR "screenings"[ti] OR "screen"[ti] OR "screened"[ti] OR screen*[ti]) AND ("Infant, Newborn"[majr] OR newborn*[ti] OR neonat*[ti])))) OR (("economic evaluations"[ti] OR "economic evaluation"[ti] OR "Cost-Benefit Analysis"[majr] OR "Cost-Benefit Analysis"[ti] OR "Benefits and Costs"[ti] OR "Cost Benefit"[ti] OR "Cost Benefit Analysis"[ti] OR "Cost Benefit Data"[ti] OR "Cost Effectiveness"[ti] OR "Cost Effectiveness Analysis"[ti] OR "Cost Effective"[ti] OR "Cost Utility"[ti] OR "Cost Utility Analysis"[ti] OR "Costs and Benefits"[ti] OR "Marginal Analysis"[ti]) AND ("Neonatal Screening"[Mesh] OR "Neonatal Screening"[tw] OR "Neonatal Screenings"[tw] OR "newborn screening"[tw] OR "newborn screenings"[tw] OR "Newborn Infant Screening"[tw] OR (("screening"[tw] OR "screenings"[tw] OR "screen"[tw] OR "screened"[tw] OR screen*[tw]) AND ("Infant, Newborn"[Mesh] OR newborn*[tw] OR neonat*[tw])))) OR "Neonatal Screening/economics"[majr]) AND ("1 January 2010"[PDAT] : "31 December 2020"[PDAT]))
Appendix A.2. Embase
((((exp *”economic evaluation"/OR "economic evaluations".ti,ab OR "economic evaluation".ti,ab OR "Cost-Benefit Analysis".ti,ab OR "Benefits and Costs".ti,ab OR "Cost Benefit".ti,ab OR "Cost Benefit Analysis".ti,ab OR "Cost Benefit Data".ti,ab OR "Cost Effectiveness".ti,ab OR "Cost Effectiveness Analysis".ti,ab OR "Cost Effective".ti,ab OR "Cost Utility".ti,ab OR "Cost Utility Analysis".ti,ab OR "Costs and Benefits".ti,ab OR "Marginal Analysis".ti,ab) AND (*"Newborn Screening"/OR "Neonatal Screening".ti OR "Neonatal Screenings".ti OR "newborn screening".ti OR "newborn screenings".ti OR "Newborn Infant Screening".ti OR (("screening".ti OR "screenings".ti OR "screen".ti OR "screened".ti OR screen*.ti) AND (*"Newborn"/OR newborn*.ti OR neonat*.ti)))) OR ((exp *"economic evaluation"/OR "economic evaluations".ti OR "economic evaluation".ti OR "Cost-Benefit Analysis".ti OR "Benefits and Costs".ti OR "Cost Benefit".ti OR "Cost Benefit Analysis".ti OR "Cost Benefit Data".ti OR "Cost Effectiveness".ti OR "Cost Effectiveness Analysis".ti OR "Cost Effective".ti OR "Cost Utility".ti OR "Cost Utility Analysis".ti OR "Costs and Benefits".ti OR "Marginal Analysis".ti) AND (*"Neonatal Screening"/OR "Neonatal Screening".ti,ab OR "Neonatal Screenings".ti,ab OR "newborn screening".ti,ab OR "newborn screenings".ti,ab OR "Newborn Infant Screening".ti,ab OR (("screening".ti,ab OR "screenings".ti,ab OR "screen".ti,ab OR "screened".ti,ab OR screen*.ti,ab) AND (*"Newborn"/OR newborn*.ti,ab OR neonat*.ti,ab))))) AND (2010 OR 2011 OR 2012 OR 2013 OR 2014 OR 2015 OR 2016 OR 2017 OR 2018 OR 2019 OR 2020).yr) NOT (conference review or conference abstract).pt
Appendix A.3. Web of Science
((ts = ("economic evaluation" OR "economic evaluations" OR "economic evaluation" OR "Cost-Benefit Analysis" OR "Benefits and Costs" OR "Cost Benefit" OR "Cost Benefit Analysis" OR "Cost Benefit Data" OR "Cost Effectiveness" OR "Cost Effectiveness Analysis" OR "Cost Effective" OR "Cost Utility" OR "Cost Utility Analysis" OR "Costs and Benefits" OR "Marginal Analysis") AND ti = (*"Newborn Screening" OR "Neonatal Screening" OR "Neonatal Screenings" OR "newborn screening" OR "newborn screenings" OR "Newborn Infant Screening" OR (("screening" OR "screenings" OR "screen" OR "screened" OR screen*) AND ("Newborn" OR newborn* OR neonat*)))) OR (ti = ("economic evaluation" OR "economic evaluations" OR "economic evaluation" OR "Cost-Benefit Analysis" OR "Benefits and Costs" OR "Cost Benefit" OR "Cost Benefit Analysis" OR "Cost Benefit Data" OR "Cost Effectiveness" OR "Cost Effectiveness Analysis" OR "Cost Effective" OR "Cost Utility" OR "Cost Utility Analysis" OR "Costs and Benefits" OR "Marginal Analysis") AND ts = ("Neonatal Screening" OR "Neonatal Screening" OR "Neonatal Screenings" OR "newborn screening" OR "newborn screenings" OR "Newborn Infant Screening" OR (("screening" OR "screenings" OR "screen" OR "screened" OR screen*) AND ("Newborn" OR newborn* OR neonat*))))) AND py = (2010 OR 2011 OR 2012 OR 2013 OR 2014 OR 2015 OR 2016 OR 2017 OR 2018 OR 2019 OR 2020) NOT dt = (meeting abstract)
Appendix A.4. Cochrane
(("economic evaluation" OR "economic evaluations" OR "economic evaluation" OR "Cost-Benefit Analysis" OR "Benefits and Costs" OR "Cost Benefit" OR "Cost Benefit Analysis" OR "Cost Benefit Data" OR "Cost Effectiveness" OR "Cost Effectiveness Analysis" OR "Cost Effective" OR "Cost Utility" OR "Cost Utility Analysis" OR "Costs and Benefits" OR "Marginal Analysis") AND (*"Newborn Screening" OR "Neonatal Screening" OR "Neonatal Screenings" OR "newborn screening" OR "newborn screenings" OR "Newborn Infant Screening" OR (("screening" OR "screenings" OR "screen" OR "screened" OR screen*) AND ("Newborn" OR newborn* OR neonat*)))):ti,ab,kw NOT (conference abstract):pt AND py = (2010 OR 2011 OR 2012 OR 2013 OR 2014 OR 2015 OR 2016 OR 2017 OR 2018 OR 2019 OR 2020) NOT dt = (meeting abstract)
Appendix A.5. EMCare
((((exp *"economic evaluation"/OR "economic evaluations".ti,ab OR "economic evaluation".ti,ab OR "Cost-Benefit Analysis".ti,ab OR "Benefits and Costs".ti,ab OR "Cost Benefit".ti,ab OR "Cost Benefit Analysis".ti,ab OR "Cost Benefit Data".ti,ab OR "Cost Effectiveness".ti,ab OR "Cost Effectiveness Analysis".ti,ab OR "Cost Effective".ti,ab OR "Cost Utility".ti,ab OR "Cost Utility Analysis".ti,ab OR "Costs and Benefits".ti,ab OR "Marginal Analysis".ti,ab) AND (*"Newborn Screening"/OR "Neonatal Screening".ti OR "Neonatal Screenings".ti OR "newborn screening".ti OR "newborn screenings".ti OR "Newborn Infant Screening".ti OR (("screening".ti OR "screenings".ti OR "screen".ti OR "screened".ti OR screen*.ti) AND (*"Newborn"/OR newborn*.ti OR neonat*.ti)))) OR ((exp *"economic evaluation"/OR "economic evaluations".ti OR "economic evaluation".ti OR "Cost-Benefit Analysis".ti OR "Benefits and Costs".ti OR "Cost Benefit".ti OR "Cost Benefit Analysis".ti OR "Cost Benefit Data".ti OR "Cost Effectiveness".ti OR "Cost Effectiveness Analysis".ti OR "Cost Effective".ti OR "Cost Utility".ti OR "Cost Utility Analysis".ti OR "Costs and Benefits".ti OR "Marginal Analysis".ti) AND (*"Neonatal Screening"/OR "Neonatal Screening".ti,ab OR "Neonatal Screenings".ti,ab OR "newborn screening".ti,ab OR "newborn screenings".ti,ab OR "Newborn Infant Screening".ti,ab OR (("screening".ti,ab OR "screenings".ti,ab OR "screen".ti,ab OR "screened".ti,ab OR screen*.ti,ab) AND (*"Newborn"/OR newborn*.ti,ab OR neonat*.ti,ab))))) AND (2010 OR 2011 OR 2012 OR 2013 OR 2014 OR 2015 OR 2016 OR 2017 OR 2018 OR 2019 OR 2020).yr)
Appendix B. Eligibility Criteria
Appendix B.1. Inclusion Criteria
- Full economic evaluations (CEAs, CUAs) of NBS programs and technologies
- Studies focusing on newborns (up to one-month-old)
- English, Italian, Dutch language
- Publication date: from 1 January 2010
Appendix B.2. Exclusion Criteria
- Partial economic evaluations of NBS or cost–benefit/cost-minimization analyses
- Not economic evaluation studies
- Reviews/qualitative studies
- Studies without available full-text
Appendix C.

Appendix D. Overall Results

| N. | First Author | Year | Country | Topic of the Screening Intervention | Primary Outcome Measure | Type of Economic Evaluation | Perspective | Study Design | Time Horizon | Study Population | Control | Model Structure | Cycle Length (Markov Model) | Health Outcomes in Natural Units | Health Outcomes Adjusted in Utility Weights | Discount Rates | Sensitivity Analysis | Overall Score |
|---|---|---|---|---|---|---|---|---|---|---|---|---|---|---|---|---|---|---|
| 22 | Sicuri | 2012 | Spain | Chagas disease | ICER | CUA | Healthcare | Not clear/Not described | Not defined/Not clear | All newborns | No screening | Decision tree | QALYs gained | 3% (costs) | Probabilistic | 0.71 | ||
| 23 | Tobe | 2013 | China | Hearing impairment | ACER | CEA | Healthcare | Cohort-based study | Not defined/Not clear | All newborns | No screening | Decision tree | DALYs averted | No discount rate | Deterministic | 0.82 | ||
| 24 | Malec | 2014 | US | Intracranial hemorrhage | ICER | CUA | Societal | Cohort-based study | 1 month | Targeted-screening newborns | Not clear/Not described | Decision tree | QALDs gained | No discount rate | Deterministic | 0.63 | ||
| 25 | Nshimyumukiza | 2014 | Canada | Cystic fibrosis | Cost per case detected | CEA | Healthcare | Cohort-based study | 5 years | All newborns | No screening | Markov model | 1 year | Case detected | 3% (costs) | Deterministic | 0.76 | |
| 26 | Schreiber | 2014 | Canada | Biliary atresia | ICER | CEA | Healthcare | Cohort-based study | 10 years | All newborns | No screening | Decision tree, Markov model | 1 year | Life-years gained | 5% (costs) | Not clear/Not described | 0.68 | |
| 27 | McGann | 2015 | Angola | Sicke cell anemia | Cost per healthy life year gained | CEA | Not clear/Not described | Individual patient study | Not defined/Not clear | All newborns | Not clear/Not described | Not clear/Not relevant | Life-years gained | 3% (costs), 3% (health outcomes) | Not clear/Not described | 0.64 | ||
| 28 | Mogul | 2015 | US | Biliary atresia | ICER | CEA | Societal | Cohort-based study | 20 years | Not clear/Not described | No screening | Markov model | 1 year | Life-years gained | 3% (costs) | Deterministic, Probabilistic | 0.66 | |
| 29 | Thiboonboon | 2015 | Thailand | Metabolic disorders | ICER | CUA | Societal | Cohort-based study | 100 years | Targeted-screening newborns | Current practice | Decision tree, Markov model | 1 year | Life-years gained | QALYs gained | 3% (costs), 3% (health outcomes) | Deterministic, Probabilistic | 0.9 |
| 30 | Vallejo-Torres | 2015 | Spain | Biotinidase deficiency | ICER | CEA * | Healthcare | Cohort-based study | Lifetime | All newborns | No screening | Decision tree | QALYs gained | 3% (costs), 3% (health outcomes) | None | 0.86 | ||
| 31 | van der Ploeg | 2015 | The Netherlands | Cystic fibrosis | CER | CEA | Societal | Cohort-based study | Lifetime | All newborns | No screening | Not clear/Not relevant | Case detected | 3% (costs), 3% (health outcomes) | Deterministic | 0.85 | ||
| 32 | Ewer | 2012 | UK | Congenital heart defects | Not defined/Not clear | CEA | Healthcare | Cohort-based study | Not defined/Not clear | All newborns | Clinical detection | Decision tree | 3.5% (costs), 3.5% (health outcomes) | Deterministic, Probabilistic | 0.84 | |||
| 33 | Castilla-Rodríguez | 2016 | Spain | Sicke-cell disease | ICER | CEA | Healthcare | Cohort-based study | 10 years | All newborns | Clinical detection | Not clear/Not relevant | Life-years gained | QALYs gained | 3% (costs), 3% (health outcomes) | Deterministic | 0.84 | |
| 34 | Ding | 2016 | US | Sever combined immunodeficiency syndrome | ICER | CEA, CBA | Not clear/Not described | Not clear/Not described | 5 years for outcome, lifetime for survival | All newborns | No screening | Not clear/Not relevant | Life-years gained | 3% (costs), 3% (health outcomes) | Deterministic, Probabilistic | 0.66 | ||
| 35 | Gantt | 2016 | US | Congential cytomegalovirus infection | Not defined/Not clear | CEA | Not clear/Not described | Not clear/Not described | Not defined/Not clear | Targeted-screening newborns | No screening | Not clear/Not relevant | Deaths averted | 1% (costs) | Not clear/Not described | 0.6 | ||
| 36 | Hatam | 2016 | Iran | Metabolic disorders | ICER | CUA | Societal | Cohort-based study | Not defined/Not clear | All newborns | No screening | Decision tree | QALYs gained | 3% (costs), 3% (health outcomes) | Deterministic | 0.73 | ||
| 37 | Kuznik | 2016 | Sub-Saharan Africa (47 countries) | Sicke cell disease | ICER | CEA(*) | Healthcare | Cohort-based study | Lifetime | All newborns | No screening | Markov model | 1 year | DALYs averted | No discount rate | Deterministic, Probabilistic | 0.78 | |
| 38 | Seror | 2016 | France | Cystic fibrosis | Not defined/Not clear | CEA | Healthcare | Cohort-based study | Not defined/Not clear | All newborns | Current practice | Not clear/Not relevant | Case detected | 3% (costs) | None | 0.58 | ||
| 39 | Chiou | 2017 | Taiwan | Hearing impariment | ICER | CUA | Not clear/Not described | Cohort-based study | Not defined/Not clear | All newborns | No screening | Decision tree, Markov model | 1 year | QALYs gained | 3% (costs), 3% (health outcomes) | Deterministic, Probabilistic | 0.73 | |
| 40 | Heidari | 2017 | Iran | Hearing impairment | Not clear | CEA | Healthcare | Cohort-based study | 1 year | All newborns | Current practice | Decision tree | Case detected | No discount rate | Deterministic | 0.65 | ||
| 41 | Tobe | 2017 | China | Congenital heart defects | Not defined/Not clear | CEA | Societal | Cohort-based study | Lifetime | All newborns | Current practice | Decision tree | Case detected | DALYs averted | 3% (costs) | Deterministic | 0.84 | |
| 42 | Hamers | 2012 | France | acyl-CoA dehydrogenase deficiency | ICER | CEA * | Societal | Cohort-based study | Lifetime | All newborns | No screening | Decision tree | Life-years gained, deatsh averted | QALYs gained | 4% (costs), 4% (health outcomes) | Deterministic, Scenario Analysis | 0.68 | |
| 43 | Bessey | 2018 | UK | Adrenoleuco- dystrophy | ICER | CEA | Healthcare | Cohort-based study | Lifetime | All newborns | No screening | Decision tree | Case detected | QALYs gained | 3.5% (costs), 3.5% (health outcomes) | Deterministic, Probabilistic | 0.78 | |
| 44 | Bessey | 2019 | UK | Severe combined immunodeficiency | ICER | CEA | Healthcare | Cohort-based study | Not defined/Not clear | All newborns | No screening | Decision tree | QALYs gained | 3.5% (costs), 1.5% (health outcomes) | Deterministic, EVPI | 0.81 | ||
| 45 | Binquet | 2019 | France | Congenital toxoplasmosis | Cost per outcome avoided | CEA | Healthcare | Cohort-based study | 1/15 years | All newborns | Current practice | Decision tree | Case detected | 3% (costs), 3% (health outcomes) | Deterministic | 0.78 | ||
| 46 | Trujillo | 2019 | Colombia | Congenital heart defects | ICER | CEA | Societal | Cohort-based study | Not defined/Not clear | Not clear/Not described | Clinical detection | Decision tree | Case detected | No discount rate | Deterministic, Probabilistic | 0.82 | ||
| 47 | Narayen | 2019 | The Netherlands | Congenital heart defects | Cost per case detected | CEA | Healthcare | Cohort-based study | Not defined/Not clear | All newborns | No screening | Decision tree | Case detected | No discount rate | Deterministic | 0.78 | ||
| 48 | van der Ploeg | 2019 | The Netherlands | Severe combined immunodeficiency syndrome | ICER | CEA | Healthcare | Cohort-based study | Lifetime | All newborns | No screening | Not clear/Not relevant | Deaths averted | QALYs gained | 4% (costs), 1.5% (health outcomes) | Deterministic | 0.74 | |
| 49 | Fox | 2020 | Canada | Congenital adrenal hyperplasia | ICER | CEA * | 3rd payer | Cohort-based study | Not defined/Not clear | All newborns | No screening | Decision tree | No discount rate | Deterministic, Probabilistic | 0.71 | |||
| 50 | Mukerji | 2020 | Canada | Congenital heart defects | ICER | CEA | 3rd payer | Cohort-based study | Lifetime | All newborns | No screening | Markov model | 1 month | QALMs gained | 1.5% (costs), 1.5% (health outcomes) | Deterministic, Probabilistic | 0.72 | |
| 51 | Langer | 2012 | Germany | Hearing impairment | ICER | CEA | Healthcare | Cohort-based study | Lifetime | All newborns | No screening | Decision tree | Case detected | No discount rate | Deterministic, Probabilistic | 0.79 | ||
| 52 | Roberts | 2012 | UK | Congenital heart defects | ICER | CEA | Healthcare | Cohort-based study | 1 year | All newborns | Clinical detection | Decision tree | Case detected | No discount rate | Deterministic | 0.74 | ||
| 53 | Tiwana | 2012 | US | Metabolic disorders | ICER | CEA | 3d payer | Cohort-based study | Lifetime | All newborns | Current practice | Markov model | 1 year | QALYs gained | 3% (costs), 3% (health outcomes) | Deterministic | 0.78 | |
| 54 | Hatam | 2013 | Iran | Glutaric aciduria Type 1 | ICER | CEA | Societal | Cohort-based study | Not defined/Not clear | All newborns | No screening | Decision tree | QALYs gained | 3% (costs), 3% (health outcomes) | Deterministic | 0.71 | ||
| 55 | Peterson | 2013 | US | (Critical) congenital heart disease | Not defined/Not clear | CEA | Healthcare | Cohort-based study | 1 year | All newborns | No screening | Decision tree | Case detected | 3% (health outcomes) | Deterministic, Probabilistic | 0.75 | ||
| 56 | Pfeil | 2013 | Germany | Glutaric aciduria type 1 | ICER | CEA * | Healthcare | Cohort-based study | 20/70 years | Not clear/Not described | No screening | Decision tree | Life-years gained | DALYs averted | No discount rate | Deterministic, Probabilistic | 0.7 |
References
- Grob, R. Parenting in the genomic age: The ‘cursed blessing’of newborn screening. New Genet. Soc. 2006, 25, 159–170. [Google Scholar] [CrossRef]
- James, P.M.; Levy, H.L. The clinical aspects of newborn screening: Importance of newborn screening follow-up. Ment. Retard. Dev. Disabil. Res. Rev. 2006, 12, 246–254. [Google Scholar] [CrossRef] [PubMed]
- Therrell, B.L.; Padilla, C.D.; Loeber, J.G.; Kneisser, I.; Saadallah, A.; Borrajo, G.J.C.; Adams, J. Current status of newborn screening worldwide: 2015. Semin. Perinatol. 2015, 39, 171–187. [Google Scholar] [CrossRef] [PubMed]
- Rudmik, L.; Drummond, M. Health economic evaluation: Important principles and methodology. Laryngoscope 2013, 123, 1341–1347. [Google Scholar] [CrossRef] [PubMed]
- Drummond, M.F.; Sculpher, M.J.; Claxton, K.; Stoddart, G.L.; Torrance, G.W. Methods for the Economic Evaluation of Health Care Programmes; Oxford University Press: Oxford, UK, 2015. [Google Scholar]
- Cunningham, S.J. Economic evaluation of healthcare–is it important to us? Br. Dent. J. 2000, 188, 250–254. [Google Scholar] [CrossRef] [PubMed]
- Harris, A.; Buxton, M.; O’Brien, B.; Rutten, F.; Drummond, M. Using Economic Evidence in Reimbursement Decisions for Health Technologies: Experience of 4 Countries. Expert Rev. Pharmacoecon. Outcomes Res. 2001, 1, 7–12. [Google Scholar] [CrossRef] [PubMed]
- Fischer, K.E.; Grosse, S.D.; Rogowski, W.H. The role of health technology assessment in coverage decisions on newborn screening. Int. J. Technol. Assess. Health Care 2011, 27, 313. [Google Scholar] [CrossRef]
- Fischer, K.E.; Rogowski, W.H. Funding decisions for newborn screening: A comparative review of 22 decision processes in Europe. Int. J. Environ. Res. Public Health 2014, 11, 5403–5430. [Google Scholar] [CrossRef]
- Grosse, S.; Rogowski, W.; Ross, L.; Cornel, M.; Dondorp, W.; Khoury, M. Population screening for genetic disorders in the 21st century: Evidence, economics, and ethics. Public Health Genom. 2010, 13, 106–115. [Google Scholar] [CrossRef]
- Prosser, L.A.; Grosse, S.D.; Kemper, A.R.; Tarini, B.A.; Perrin, J.M. Decision analysis, economic evaluation, and newborn screening: Challenges and opportunities. Genet. Med. 2012, 14, 703–712. [Google Scholar] [CrossRef]
- Prosser, L.A.; Hammitt, J.K.; Keren, R. Measuring health preferences for use in cost-utility and cost-benefit analyses of interventions in children. Pharmacoeconomics 2007, 25, 713–726. [Google Scholar] [CrossRef] [PubMed]
- Grosse, S.D.; Prosser, L.A.; Asakawa, K.; Feeny, D. QALY weights for neurosensory impairments in pediatric economic evaluations: Case studies and a critique. Expert Rev. Pharmacoecon. Outcomes Res. 2010, 10, 293–308. [Google Scholar] [CrossRef] [PubMed]
- Colgan, S.; Gold, L.; Wirth, K.; Ching, T.; Poulakis, Z.; Rickards, F.; Wake, M. The cost-effectiveness of universal newborn screening for bilateral permanent congenital hearing impairment: Systematic review. Acad. Pediatr. 2012, 12, 171–180. [Google Scholar] [CrossRef] [PubMed]
- Schmidt, M.; Werbrouck, A.; Verhaeghe, N.; De Wachter, E.; Simoens, S.; Annemans, L.; Putman, K. Strategies for newborn screening for cystic fibrosis: A systematic review of health economic evaluations. J. Cyst. Fibros. 2018, 17, 306–315. [Google Scholar] [CrossRef]
- Wright, S.J.; Jones, C.; Payne, K.; Dharni, N.; Ulph, F. The role of information provision in economic evaluations of newborn bloodspot screening: A systematic review. Appl. Health Econ. Health Policy 2015, 13, 615–626. [Google Scholar] [CrossRef] [PubMed]
- Grosse, S.D. Showing Value in Newborn Screening: Challenges in Quantifying the Effectiveness and Cost-Effectiveness of Early Detection of Phenylketonuria and Cystic Fibrosis. Healthcare 2015, 3, 1133–1157. [Google Scholar] [CrossRef]
- Munn, Z.; Peters, M.D.; Stern, C.; Tufanaru, C.; McArthur, A.; Aromataris, E. Systematic review or scoping review? Guidance for authors when choosing between a systematic or scoping review approach. BMC Med. Res. Methodol. 2018, 18, 143. [Google Scholar] [CrossRef]
- Tricco, A.C.; Lillie, E.; Zarin, W.; O’Brien, K.K.; Colquhoun, H.; Levac, D.; Moher, D.; Peters, M.D.J.; Horsley, T.; Weeks, L. PRISMA extension for scoping reviews (PRISMA-ScR): Checklist and explanation. Ann. Intern. Med. 2018, 169, 467–473. [Google Scholar] [CrossRef]
- Angelis, A.; Lange, A.; Kanavos, P. Using health technology assessment to assess the value of new medicines: Results of a systematic review and expert consultation across eight European countries. Eur. J. Health Econ. 2018, 19, 123–152. [Google Scholar] [CrossRef]
- Langer, A.; Holle, R.; John, J. Specific guidelines for assessing and improving the methodological quality of economic evaluations of newborn screening. BMC Health Serv. Res. 2012, 12, 300. [Google Scholar] [CrossRef]
- Seers, K. What is a qualitative synthesis? Evid. Based Nurs. 2012, 15, 101. [Google Scholar] [CrossRef] [PubMed]
- Sicuri, E.; Mu noz, J.; Pinazo, M.J.; Posada, E.; Sanchez, J.; Alonso, P.L.; Gascon, J. Economic evaluation of Chagas disease screening of pregnant Latin American women and of their infants in a non endemic area. Acta Trop. 2011, 118, 110–117. [Google Scholar] [CrossRef] [PubMed]
- Tobe, R.G.; Mori, R.; Huang, L.; Xu, L.; Han, D.; Shibuya, K. Cost-effectiveness analysis of a national neonatal hearing screening program in China: Conditions for the scale-up. PLoS ONE 2013, 8, e51990. [Google Scholar] [CrossRef] [PubMed]
- Malec, L.M.; Sidonio, R.F., Jr.; Smith, K.J.; Cooper, J.D. Three cost-utility analyses of screening for intracranial hemorrhage in neonates with hemophilia. J. Pediatr. Hematol. 2014, 36, 474–479. [Google Scholar] [CrossRef]
- Nshimyumukiza, L.; Bois, A.; Daigneault, P.; Lands, L.; Laberge, A.M.; Fournier, D.; Duplantie, J.; Giguère, Y.; Gekas, J.; Gagné, C. Cost effectiveness of newborn screening for cystic fibrosis: A simulation study. J. Cyst. Fibros. 2014, 13, 267–274. [Google Scholar] [CrossRef]
- Schreiber, R.A.; Masucci, L.; Kaczorowski, J.; Collet, J.P.; Lutley, P.; Espinosa, V.; Bryan, S. Home-based screening for biliary atresia using infant stool colour cards: A large-scale prospective cohort study and cost-effectiveness analysis. J. Med. Screen. 2014, 21, 126–132. [Google Scholar] [CrossRef]
- McGann, P.T.; Grosse, S.D.; Santos, B.; de Oliveira, V.; Bernardino, L.; Kassebaum, N.J.; Ware, R.E.; Airewele, G.E. A cost-effectiveness analysis of a pilot neonatal screening program for sickle cell anemia in the Republic of Angola. J. Pediatr. 2015, 167, 1314–1319. [Google Scholar] [CrossRef]
- Mogul, D.; Zhou, M.; Intihar, P.; Schwarz, K.; Frick, K. Cost-effective analysis of screening for biliary atresia with the stool color card. J. Pediatr. Gastroenterol. Nutr. 2015, 60, 91–98. [Google Scholar] [CrossRef]
- Thiboonboon, K.; Leelahavarong, P.; Wattanasirichaigoon, D.; Vatanavicharn, N.; Wasant, P.; Shotelersuk, V.; Pangkanon, S.; Kuptanon, C.; Chaisomchit, S.; Teerawattananon, Y. An economic evaluation of neonatal screening for inborn errors of metabolism using tandem mass spectrometry in Thailand. PLoS ONE 2015, 10, e0134782. [Google Scholar] [CrossRef]
- Vallejo-Torres, L.; Castilla, I.; Couce, M.L.; Pérez-Cerdá, C.; Martín-Hernández, E.; Pineda, M.; Campistol, J.; Arrospide, A.; Morris, S.; Serrano-Aguilar, P. Cost-effectiveness analysis of a national newborn screening program for biotinidase deficiency. Pediatrics 2015, 136, e424–e432. [Google Scholar] [CrossRef]
- Van Der Ploeg, C.P.B.; van den Akker-van Marle, M.E.; Vernooij-van Langen, A.M.M.; Elvers, L.H.; Gille, J.J.P.; Verkerk, P.H.; Dankert-Roelse, J.E.; Group, C.S. Cost-effectiveness of newborn screening for cystic fibrosis determined with real-life data. J. Cyst. Fibros. 2015, 14, 194–202. [Google Scholar] [CrossRef] [PubMed]
- Ewer, A.K.; Furmston, A.T.; Middleton, L.J.; Deeks, J.J.; Daniels, J.P.; Pattison, H.M.; Powell, R.; Roberts, T.E.; Barton, P.; Auguste, P.; et al. Pulse oximetry as a screening test for congenital heart defects in newborn infants: A test accuracy study with evaluation of acceptability and cost-effectiveness. Health Technol. Assess. 2012, 16, 1–184. [Google Scholar] [CrossRef] [PubMed]
- Castilla-Rodríguez, I.; Cela, E.; Vallejo-Torres, L.; Valcárcel-Nazco, C.; Dulín, E.; Espada, M.; Rausell, D.; Mar, J.; Serrano-Aguilar, P. Cost-effectiveness analysis of newborn screening for sickle-cell disease in Spain. Expert Opin. Orphan Drugs 2016, 4, 567–575. [Google Scholar] [CrossRef]
- Ding, Y.; Thompson, J.D.; Kobrynski, L.; Ojodu, J.; Zarbalian, G.; Grosse, S.D. Cost-effectiveness/cost-benefit analysis of newborn screening for severe combined immune deficiency in Washington State. J. Pediatr. 2016, 172, 127–135. [Google Scholar] [CrossRef]
- Gantt, S.; Dionne, F.; Kozak, F.K.; Goshen, O.; Goldfarb, D.M.; Park, A.H.; Boppana, S.B.; Fowler, K. Cost-effectiveness of universal and targeted newborn screening for congenital cytomegalovirus infection. JAMA Pediatr. 2016, 170, 1173–1180. [Google Scholar] [CrossRef]
- Hatam, N.; Askarian, M.; Bastani, P.; Pourmohammadi, K.; Shirvani, S. Cost-Utility of Screening Program for Neonatal Hypothyroidism in Iran. Shiraz Med. J. 2016, 17, e33606. [Google Scholar] [CrossRef]
- Kuznik, A.; Habib, A.G.; Munube, D.; Lamorde, M. Newborn screening and prophylactic interventions for sickle cell disease in 47 countries in sub-Saharan Africa: A cost-effectiveness analysis. BMC Health Serv. Res. 2016, 16, 304. [Google Scholar] [CrossRef]
- Seror, V.; Cao, C.; Roussey, M.; Giorgi, R. PAP assays in newborn screening for cystic fibrosis: A population-based cost-effectiveness study. J. Med Screen. 2016, 23, 62–69. [Google Scholar] [CrossRef]
- Chiou, S.T.; Lung, H.L.; Chen, L.S.; Yen, A.M.F.; Fann, J.C.Y.; Chiu, S.Y.H.; Chen, H.H. Economic evaluation of long-term impacts of universal newborn hearing screening. Int. J. Audiol. 2017, 56, 46–52. [Google Scholar] [CrossRef]
- Heidari, S.; Manesh, A.O.; Rajabi, F.; Moradi-Joo, M. Cost-effectiveness analysis of automated auditory brainstem response and Otoacoustic emission in universal neonatal hearing screening. Iran. J. Pediatr. 2017, 27, e5229. [Google Scholar] [CrossRef]
- Tobe, R.G.; Martin, G.R.; Li, F.; Moriichi, A.; Wu, B.; Mori, R. Cost-effectiveness analysis of neonatal screening of critical congenital heart defects in China. Medicine 2017, 96, e8683. [Google Scholar] [CrossRef] [PubMed]
- Hamers, F.F.; Rumeau-Pichon, C. Cost-effectiveness analysis of universal newborn screening for medium chain acyl-CoA dehydrogenase deficiency in France. BMC Pediatr. 2012, 12, 60. [Google Scholar] [CrossRef] [PubMed]
- Bessey, A.; Chilcott, J.B.; Leaviss, J.; Sutton, A. Economic impact of screening for X-linked Adrenoleukodystrophy within a newborn blood spot screening programme. Orphanet J. Rare Dis. 2018, 13, 179. [Google Scholar] [CrossRef] [PubMed]
- Bessey, A.; Chilcott, J.; Leaviss, J.; de la Cruz, C.; Wong, R. A Cost-Effectiveness Analysis of Newborn Screening for Severe Combined Immunodeficiency in the UK. Int. J. Neonatal Screen. 2019, 5, 28. [Google Scholar] [CrossRef]
- Binquet, C.; Lejeune, C.; Seror, V.; Peyron, F.; Bertaux, A.C.; Scemama, O.; Quantin, C.; Béjean, S.; Stillwaggon, E.; Wallon, M. The cost-effectiveness of neonatal versus prenatal screening for congenital toxoplasmosis. PLoS ONE 2019, 14, e0221709. [Google Scholar] [CrossRef]
- Trujillo, D.L.; Reyes, N.F.S.; Restrepo, A.T.; Velasquez, C.L.C.; Torres, M.T.D.; Ducuara, S.V.R.; Moreno, G.A.T.; Bello, H.C.A.; Cuevas, A.F.; Hernandez, P.A.B. Cost-effectiveness analysis of newborn pulse oximetry screening to detect critical congenital heart disease in Colombia. Cost Eff. Resour. Alloc. 2019, 17, 11. [Google Scholar] [CrossRef]
- Narayen, I.C.; te Pas, A.B.; Blom, N.A.; van den Akker-van, M.E. Cost-effectiveness analysis of pulse oximetry screening for critical congenital heart defects following homebirth and early discharge. Eur. J. Pediatr. 2019, 178, 97–103. [Google Scholar] [CrossRef]
- Van der Ploeg, C.P.B.; Blom, M.; Bredius, R.G.M.; van der Burg, M.; Schielen, P.C.J.I.; Verkerk, P.H.; Van den Akker-van, M.E. Cost-effectiveness of newborn screening for severe combined immunodeficiency. Eur. J. Pediatr. 2019, 178, 721–729. [Google Scholar] [CrossRef]
- Fox, D.A.; Ronsley, R.; Khowaja, A.R.; Haim, A.; Vallance, H.; Sinclair, G.; Amed, S. Clinical Impact and Cost Efficacy of Newborn Screening for Congenital Adrenal Hyperplasia. J. Pediatr. 2020, 220, 101–108.E2. [Google Scholar] [CrossRef]
- Mukerji, A.; Shafey, A.; Jain, A.; Cohen, E.; Shah, P.S.; Sander, B.; Shah, V. Pulse oximetry screening for critical congenital heart defects in Ontario, Canada: A cost-effectiveness analysis. Can. J. Public Health 2020, 111, 804–811. [Google Scholar] [CrossRef]
- Langer, A.; Brockow, I.; Nennstiel-Ratzel, U.; Menn, P. The cost-effectiveness of tracking newborns with bilateral hearing impairment in Bavaria: A decision-analytic model. BMC Health Serv. Res. 2012, 12, 418. [Google Scholar] [CrossRef] [PubMed]
- Roberts, T.E.; Barton, P.M.; Auguste, P.E.; Middleton, L.J.; Furmston, A.T.; Ewer, A.K. Pulse oximetry as a screening test for congenital heart defects in newborn infants: A cost-effectiveness analysis. Arch. Dis. Child. 2012, 97, 221–226. [Google Scholar] [CrossRef] [PubMed]
- Tiwana, S.K.; Rascati, K.L.; Park, H. Cost-effectiveness of expanded newborn screening in Texas. Value Health 2012, 15, 613–621. [Google Scholar] [CrossRef] [PubMed]
- Hatam, N.; Shirvani, S.; Javanbakht, M.; Askarian, M.; Rastegar, M. Cost-Utility Analysis of Neonatal Screening Program, Shiraz University of Medical Sciences, Shiraz, Iran, 2010. Iran. J. Pediatr. 2013, 23, 493. [Google Scholar]
- Peterson, C.; Grosse, S.D.; Oster, M.E.; Olney, R.S.; Cassell, C.H. Cost-effectiveness of routine screening for critical congenital heart disease in US newborns. Pediatrics 2013, 132, e595–e603. [Google Scholar] [CrossRef]
- Pfeil, J.; Listl, S.; Hoffmann, G.F.; Kölker, S.; Lindner, M.; Burgard, P. Newborn screening by tandem mass spectrometry for glutaric aciduria type 1: A cost-effectiveness analysis. Orphanet J. Rare Dis. 2013, 8, 167. [Google Scholar] [CrossRef]
- Grosse, S.D.; Olney, R.S.; Baily, M.A. The cost effectiveness of universal versus selective newborn screening for sickle cell disease in the US and the UK. Appl. Health Econ. Health Policy 2005, 4, 239–247. [Google Scholar] [CrossRef]
- Heeg, B.M.S. Developing Health Economic Models of Chronic Diseases for Reimbursement Purposes; University of Groningen: Groningen, The Netherlands, 2015. [Google Scholar]
- Whitehead, S.J.; Ali, S. Health outcomes in economic evaluation: The QALY and utilities. Br. Med. Bull. 2010, 96, 5–21. [Google Scholar] [CrossRef]
- Wisløff, T.; Hagen, G.; Hamidi, V.; Movik, E.; Klemp, M.; Olsen, J.A. Estimating QALY gains in applied studies: A review of cost-utility analyses published in 2010. Pharmacoeconomics 2014, 32, 367–375. [Google Scholar] [CrossRef]
- Grange, A.; Bekker, H.; Noyes, J.; Langley, P. Adequacy of health-related quality of life measures in children under 5 years old: Systematic review. J. Adv. Nurs. 2007, 59, 197–220. [Google Scholar] [CrossRef]
- Otero, H.J.; Degnan, A.J.; Kadom, N.; Neumann, P.J.; Lavelle, T.A. Cost-Effectiveness Analysis in Pediatric Imaging: The Evidence (or Lack Thereof) Thus Far. J. Am. Coll. Radiol. 2019, 17, 452–461. [Google Scholar] [CrossRef] [PubMed]
- Kromm, S.K.; Bethell, J.; Kraglund, F.; Edwards, S.A.; Laporte, A.; Coyte, P.C.; Ungar, W.J. Characteristics and quality of pediatric cost-utility analyses. Qual. Life Res. 2012, 21, 1315–1325. [Google Scholar] [CrossRef] [PubMed]
- Bégo-Le Bagousse, G.; Jia, X.; Wolowacz, S.; Eckert, L.; Tavi, J.; Hudson, R. Health utility estimation in children and adolescents: A review of health technology assessments. Curr. Med. Res. Opin. 2020, 36, 1209–1224. [Google Scholar] [CrossRef] [PubMed]
- The University of Sheffield. Health Economics and Decision Science. Measuring and Valuing Health: A Brief Overview of the Child Health Utility. 9D (CHU9D). Available online: https://www.sheffield.ac.uk/scharr/research/themes (accessed on 16 June 2020).
- Griebsch, I.; Coast, J.; Brown, J. Quality-adjusted life-years lack quality in pediatric care: A critical review of published cost-utility studies in child health. Pediatrics 2005, 115, e600–e614. [Google Scholar] [CrossRef] [PubMed]
- Grosse, S.D. Does newborn screening save money? The difference between cost-effective and cost-saving interventions. J. Pediatr. 2005, 146, 168–170. [Google Scholar] [CrossRef] [PubMed]
- Norman, R.; Haas, M.; Wilcken, B. International perspectives on the cost-effectiveness of tandem mass spectrometry for rare metabolic conditions. Health Policy 2009, 89, 252–260. [Google Scholar] [CrossRef] [PubMed]
- Methods for Health Economic Evaluations. 2007. Available online: https://www.eunethta.eu/wp-content/uploads/2018/03/Methods_for_health_economic_evaluations.pdf (accessed on 16 June 2020).
- Kim, D.D.; Wilkinson, C.L.; Pope, E.F.; Chambers, J.D.; Cohen, J.T.; Neumann, P.J. The influence of time horizon on results of cost-effectiveness analyses. Expert Rev. Pharmacoecon. Outcomes Res. 2017, 17, 615–623. [Google Scholar] [CrossRef]
- EUnetHTA Joint Action; Heintz, E.; Gerber-Grote, A.; Ghabri, S.; Hamers, F.F.; Rupel, V.P.; Slabe-Erker, R.; Davidson, T. Is there a European view on health economic evaluations? Results from a synopsis of methodological guidelines used in the EUnetHTA partner countries. Pharmacoeconomics 2016, 34, 59–76. [Google Scholar] [CrossRef]
- Deborah, C. Decision Modelling for Health Economic Evaluation. A Briggs, M Sculpher, K Claxton. Int. J. Epidemiol. 2007, 36, 476–477. [Google Scholar] [CrossRef]
- Briggs, A.; Sculpher, M.; Buxton, M. Uncertainty in the economic evaluation of health care technologies: The role of sensitivity analysis. Health Econ. 1994, 3, 95–104. [Google Scholar] [CrossRef]
- Puig-Junoy, J.; Lopez-Valcarcel, B.G. Economic evaluations of massive HPV vaccination: Within-study and between study variations in incremental cost per QALY gained. Prev. Med. 2009, 48, 444–448. [Google Scholar] [CrossRef] [PubMed]
- Watts, R.D.; Li, I.W. Use of Checklists in Reviews of Health Economic Evaluations, 2010 to 2018. Value Health 2019, 22, 377–382. [Google Scholar] [CrossRef] [PubMed]

| Category | Items | Score (0/1) |
|---|---|---|
| Bibliographic details | Authors Institutional affiliation of authors Source of funding Title Source of publication Publication type | S1 S2 S3 S4 S5 S6 |
| Average score for “Bibliographic details” | Avg. S1–S6 | |
| Study question and design | Study question Intervention Control Target population Time horizon Setting Perspective Study design Type of economic evaluation Study population Primary outcome measure | S7 S8 S9 S10 S11 S12 S13 S14 S15 S16 S17 |
| Average score for “Study question and design” | Avg. S7–S17 | |
| Modeling | Model type Model structure Model assumptions Sources used to develop and/or populate the model Cycle length Health states and transitions Model validation | S18 S19 S20 S21 S22 S23 S24 |
| Average score for “Modeling” | Avg. S18–S24 | |
| Health outcomes | Health outcomes measured in natural units Health outcomes adjusted by utility weights or health state preference scores Health outcomes measured in monetary units Intermediate health outcomes Non-health outcomes | S25 S26 S27 S28 S29 |
| Average score for “Health outcomes” | Avg. S25–S29 | |
| Costs | Patient-related costs Programme-related costs | S30 S31 |
| Average score for “Costs” | Avg. S30–S31 | |
| Discounting | Discount rate for costs Discount rate for health outcomes Justification of discount rates | S32 S33 S34 |
| Average score for “Discounting” | Avg. S32–S34 | |
| Presentation of results | Absolute and incremental health outcomes per newborn Absolute and incremental costs per newborn ICER for the primary outcome measure Present values and trends of costs and health outcomes at the population level Present values and trends of costs at the population level differentiated by payer Coverage of screening | S35 S36 S37 S38 S39 S40 |
| Average score for “Presentation of results” | Avg. S35–S40 | |
| Sensitivity analysis | Parameter uncertainty Modeling uncertainty Methods of sensitivity analysis Results of sensitivity analysis | S41 S42 S43 S44 |
| Average score for “Sensitivity analysis” | Avg. S41–S44 | |
| Discussion | Limitations of the study Generalizability and transferability of the economic evaluation results | S45 S46 |
| Average score for “Discussion” | Avg. S45–S46 | |
| Conclusions | Validity of conclusions with regard to the results of the economic evaluation Validity of conclusions with regard to the objective of the economic evaluation | S47 S48 |
| Average score for “Conclusions” | Avg. S47–S48 |
Publisher’s Note: MDPI stays neutral with regard to jurisdictional claims in published maps and institutional affiliations. |
© 2020 by the authors. Licensee MDPI, Basel, Switzerland. This article is an open access article distributed under the terms and conditions of the Creative Commons Attribution (CC BY) license (http://creativecommons.org/licenses/by/4.0/).
Share and Cite
Cacciatore, P.; Visser, L.A.; Buyukkaramikli, N.; van der Ploeg, C.P.B.; van den Akker-van Marle, M.E. The Methodological Quality and Challenges in Conducting Economic Evaluations of Newborn Screening: A Scoping Review. Int. J. Neonatal Screen. 2020, 6, 94. https://doi.org/10.3390/ijns6040094
Cacciatore P, Visser LA, Buyukkaramikli N, van der Ploeg CPB, van den Akker-van Marle ME. The Methodological Quality and Challenges in Conducting Economic Evaluations of Newborn Screening: A Scoping Review. International Journal of Neonatal Screening. 2020; 6(4):94. https://doi.org/10.3390/ijns6040094
Chicago/Turabian StyleCacciatore, Pasquale, Laurenske A. Visser, Nasuh Buyukkaramikli, Catharina P. B. van der Ploeg, and M. Elske van den Akker-van Marle. 2020. "The Methodological Quality and Challenges in Conducting Economic Evaluations of Newborn Screening: A Scoping Review" International Journal of Neonatal Screening 6, no. 4: 94. https://doi.org/10.3390/ijns6040094
APA StyleCacciatore, P., Visser, L. A., Buyukkaramikli, N., van der Ploeg, C. P. B., & van den Akker-van Marle, M. E. (2020). The Methodological Quality and Challenges in Conducting Economic Evaluations of Newborn Screening: A Scoping Review. International Journal of Neonatal Screening, 6(4), 94. https://doi.org/10.3390/ijns6040094