Introduction
According to the recent literature, acute poisonings, mainly in infants and children, caused by nicotine products used as substitutes in the treatment of smoking (such as chewable gums, transdermal nicotine patch etc.) or other tobacco products, are commonly reported to poison control centers [
1,
2,
3].
The vast majority (90%) of these accidental intoxications involve children up to 6 years of age [
4,
5]. In the US, most such intoxications are reported with products that looks similar to Tic-Tac candy and contain appetizing flavors for young children. A total of 13,705 cases of ingestion of cigarettes and nicotine products were reported in 2010, of which 70% involved children under 1 year of age [
6,
7].
Cotinine is the main metabolite of nicotine, having a long half-life of elimination, and which can be determined in various biological fluids for up to a few days after exposure to tobacco smoke [
8]. Cotinine from serum, saliva, or urine has now been recognized as a specific, highly sensitive, and reliable general biomarker for human exposure to tobacco smoke or substitution products containing nicotine (gummy gums, transdermal patches, etc.) [
9,
10].
Considering the research literature on nicotine poisoning, we conducted a study by HPTLC on the identification and semi-quantitative determination of nicotine and cotinine from biological material (plasma and urine). In this study we evaluated the possibility of applying the methods developed in cases of acute nicotine intoxication.
Materials and Methods
Reactives: (-) Nicotine standard (Merck) min.99%, (S) (-) Cotinine standard (Sigma-Aldrich) min. 98%, Methanol Chromosolv for HPLC (Merck), Chloroform, Acetone, Dicloromethane, Ammonia (analytical grade). Apparatus: Cooling centrifuge 2-15 K (Sigma), solid phase extraction system (Visiprep Manifold model, Supelco), evaporator under nitrogen stream (Techne Dry-Block DB-3D model, Bibby Scientífic Inc.), Hamilton 100 µL micro-syringe, chromatographic development chambers, Camag Linomat 5 semi- automated spotting system, Camag TLC Scanner 3 system of processing the chromatoplates, fitted with a dark camera, UV lamps and connected to a computer (WinCATS software ver. 1.4.4.)
Biologic material used for the preparation of the spiked samples: human plasma obtained from peripheral venous blood and urine (from healthy volunteers).
Methodology
Preparation of the solution.
We prepared standard stock solutions of 0.1% nicotine and 0.15% cotinine, in methanol.
Procedures of extractions from plasma and urine
Liquid-liquid extraction: the spiked sample (1 mL) has been alkalized with KOH 1M, then extracted by vortex agitation with 5 mL of dichloromethane. After extraction, the samples were centrifuged at 4000 rpm, 24°C, for ten minutes; the organic solvent layer was separated and dry-evaporated, in nitrogen flow, at 40°C. The residue was taken with 1 mL methanol.
Solid phase extraction: the spiked sample (1 mL) was alkalized with KOH 1M. The cartridge was washed with a mixture of methanol / sodium hydroxide solution 20%, then the sample was slowly passed over the solid phase thus conditioned. Subsequently, the analytes were eluted with 1 mL of methanol, the solution was dry- evaporated in nitrogen flow, at 40°C and the residue was taken with 0.5 mL methanol.
Working procedure
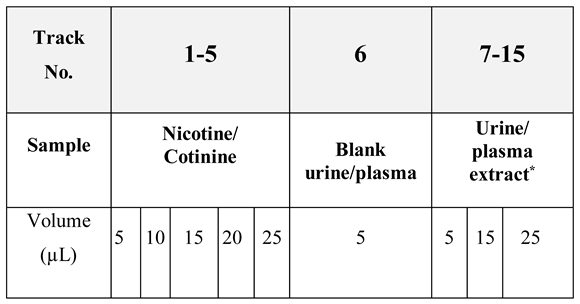
We have planned to spot the solutions to be analyzed, containing the order of setting the solutions on the plate and the volumes which are to be spotted for each migration track (
Table 1).
According to the plan of obtaining the chromate- plate, the solutions to be analysed were spotted in lines, using the semi-automatic system Linomat 5 (Camag), by means of the Hamilton micro syringe, in nitrogen flow.
The plates were developed in the vertical chamber (the technique has been the ascending one), previously saturated with the vapours of the mobile phase.
After the development, the plates were evaluated using the TLC scanner 3 (Camag), at 263 nm.
Results
HPTLC analysis of the nicotine and cotinine, after being extracted from urine.
We conducted a series of tests to select the optimal developing solvent system and to establish the standard curves, using standard solutions, as well as checking the extraction from biological material.
Thus, we performed the standard curve in the quantities range of 200 ng - 1000 ng/spot (200 ng - 400 ng - 600 ng - 800 ng - 1000 ng/spot); the extraction of urine samples was performed by the liquid–liquid procedure at pH alkaline, using dichloromethane as the extraction solvent. We verified the extraction of nicotine and cotinine from the urine at three levels of the calibration curve: 200 ng/spot, 800 ng/spot and 1000 ng/spot. We worked in triplicate for each level in the calibration curve.
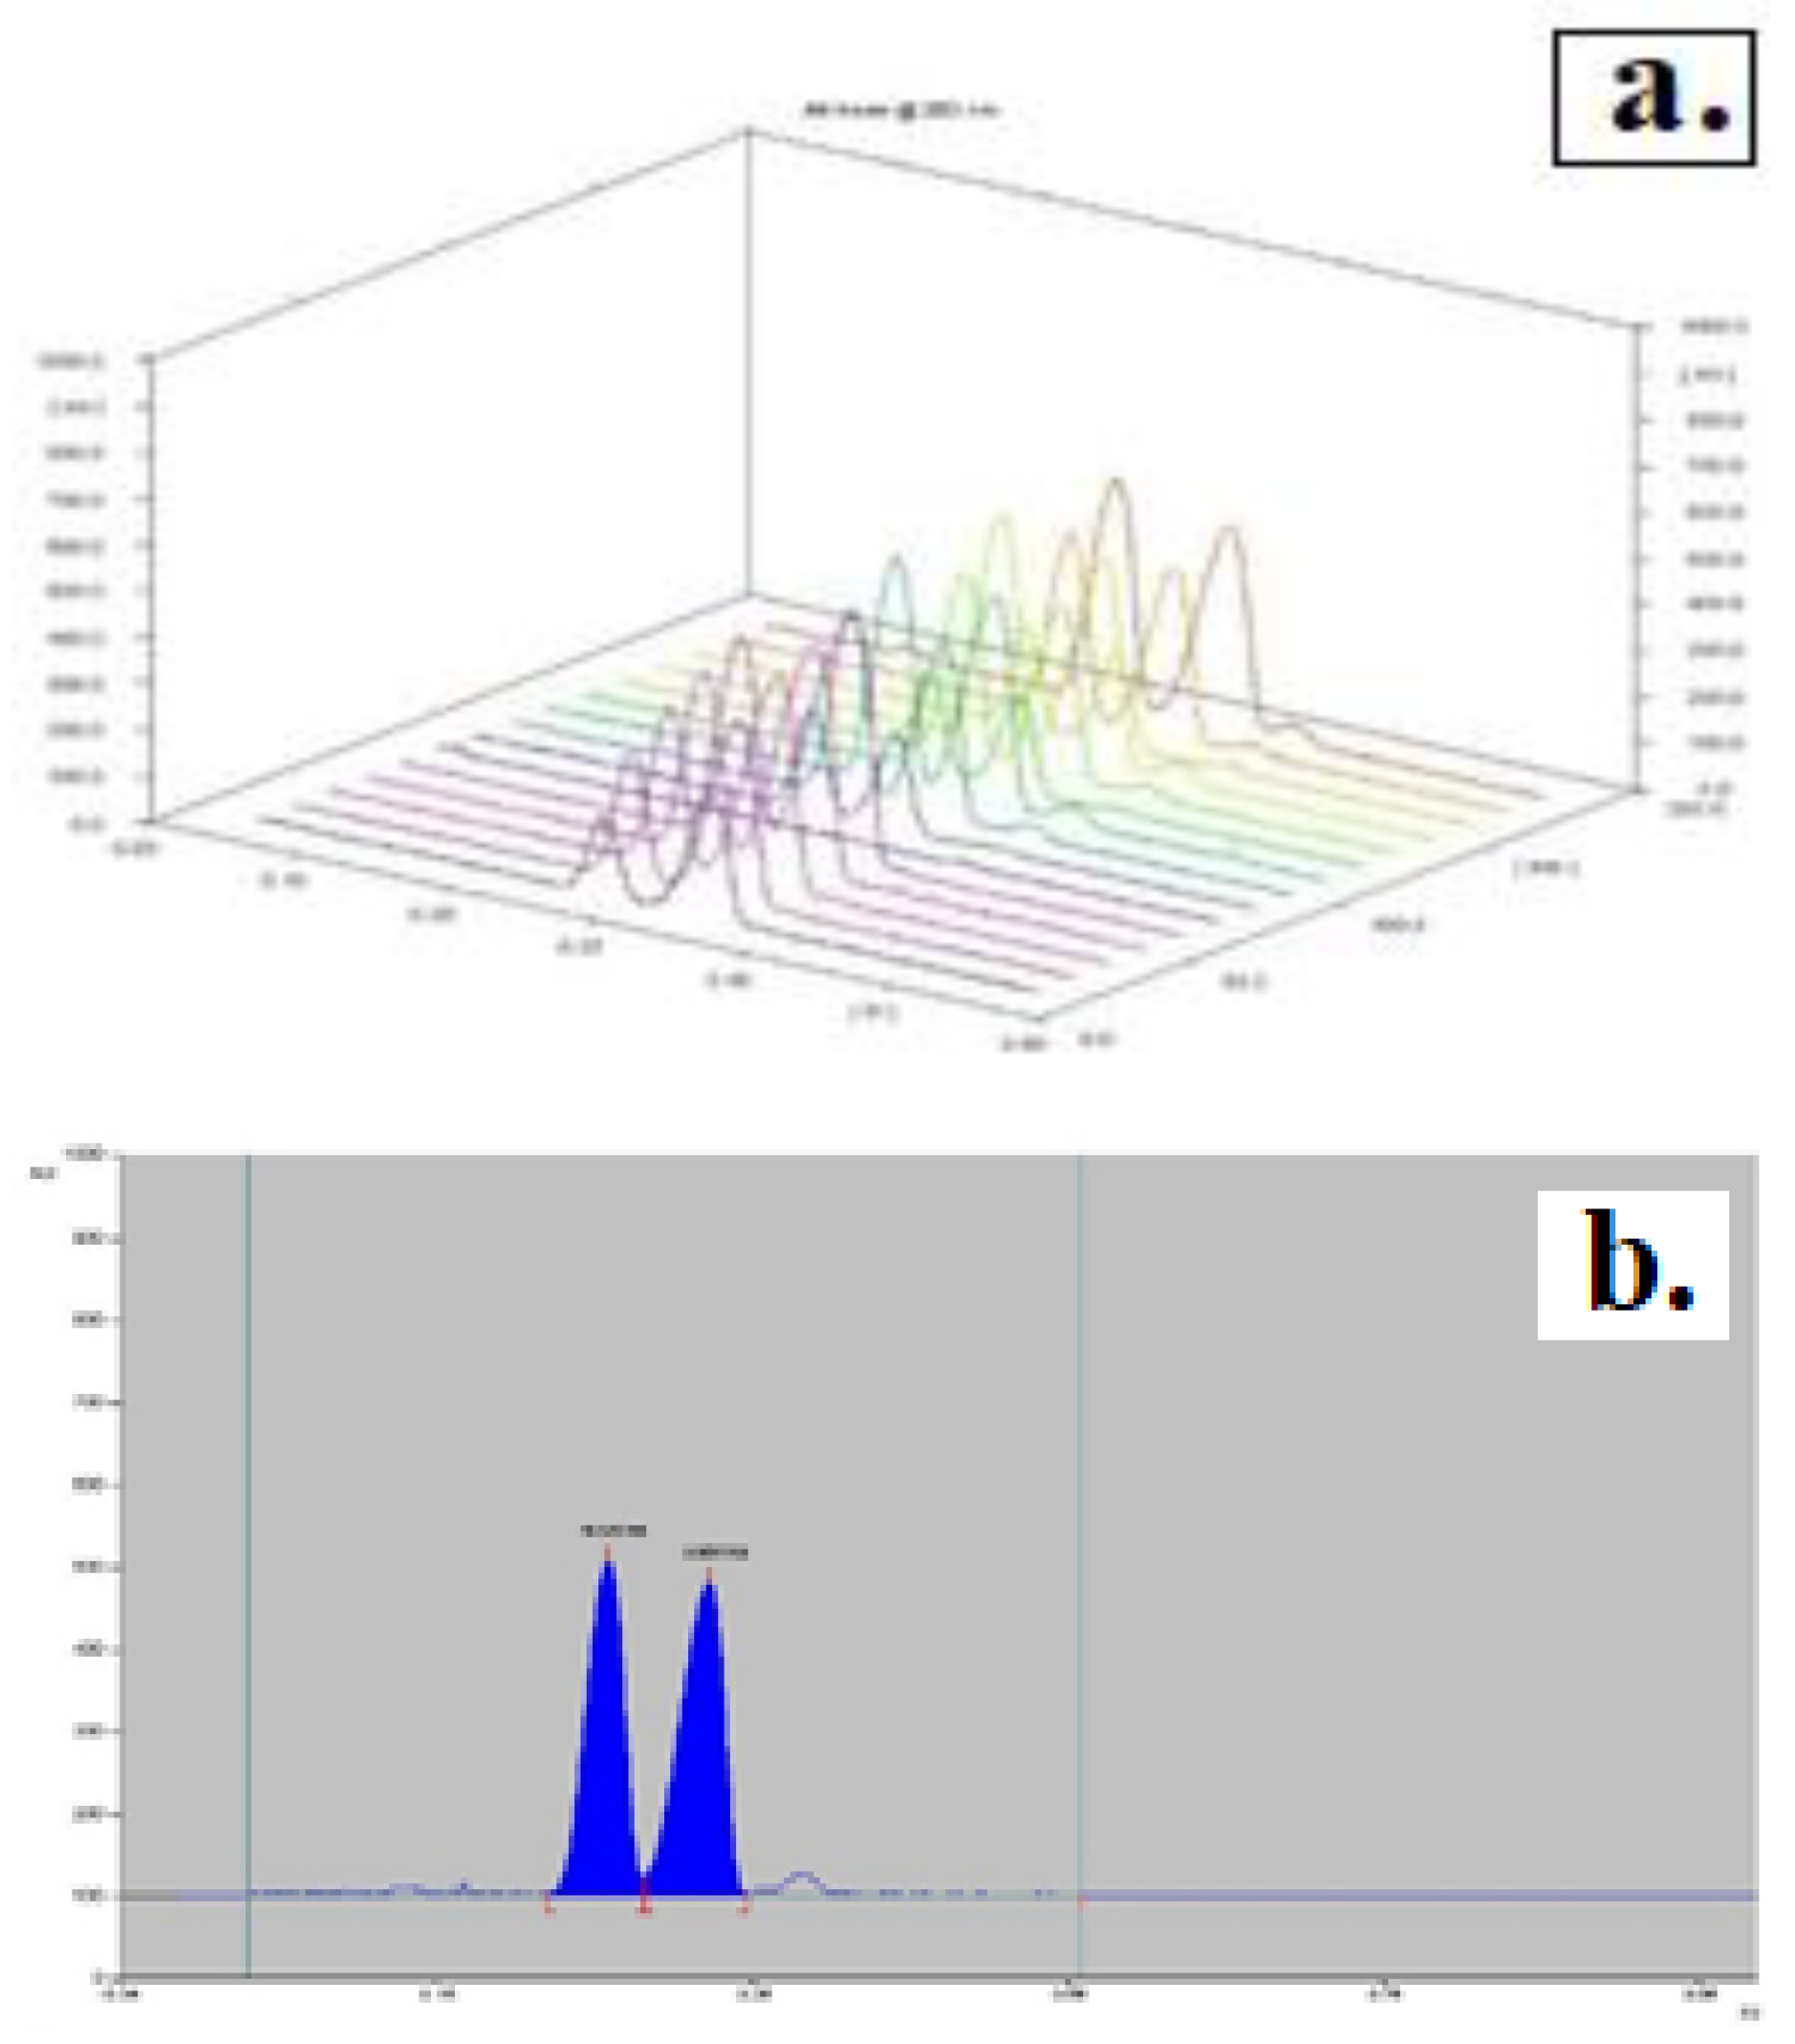
In the solvent system used as the developer, methanol: ammonia (100: 1.5), nicotine and cotinine were characterized by Rf values of 0.795 ± 0.00522 and 0.83 ± 0.0094, respectively, according to the data generated in the software report. Therefore, the developing system methanol: ammonia (100: 1.5) is not suitable for the separation of nicotine and its metabolite cotinine. By using the mobile phase chloroform: acetone: ammonia (48,75: 48,75: 2,5), the Rf values decrease significantly (Rf nicotine = 0.2740 ±0.00522, and Rfcotinine = 0.3430 ±0.00421), but no proper separation was obtained (
Figure 1).
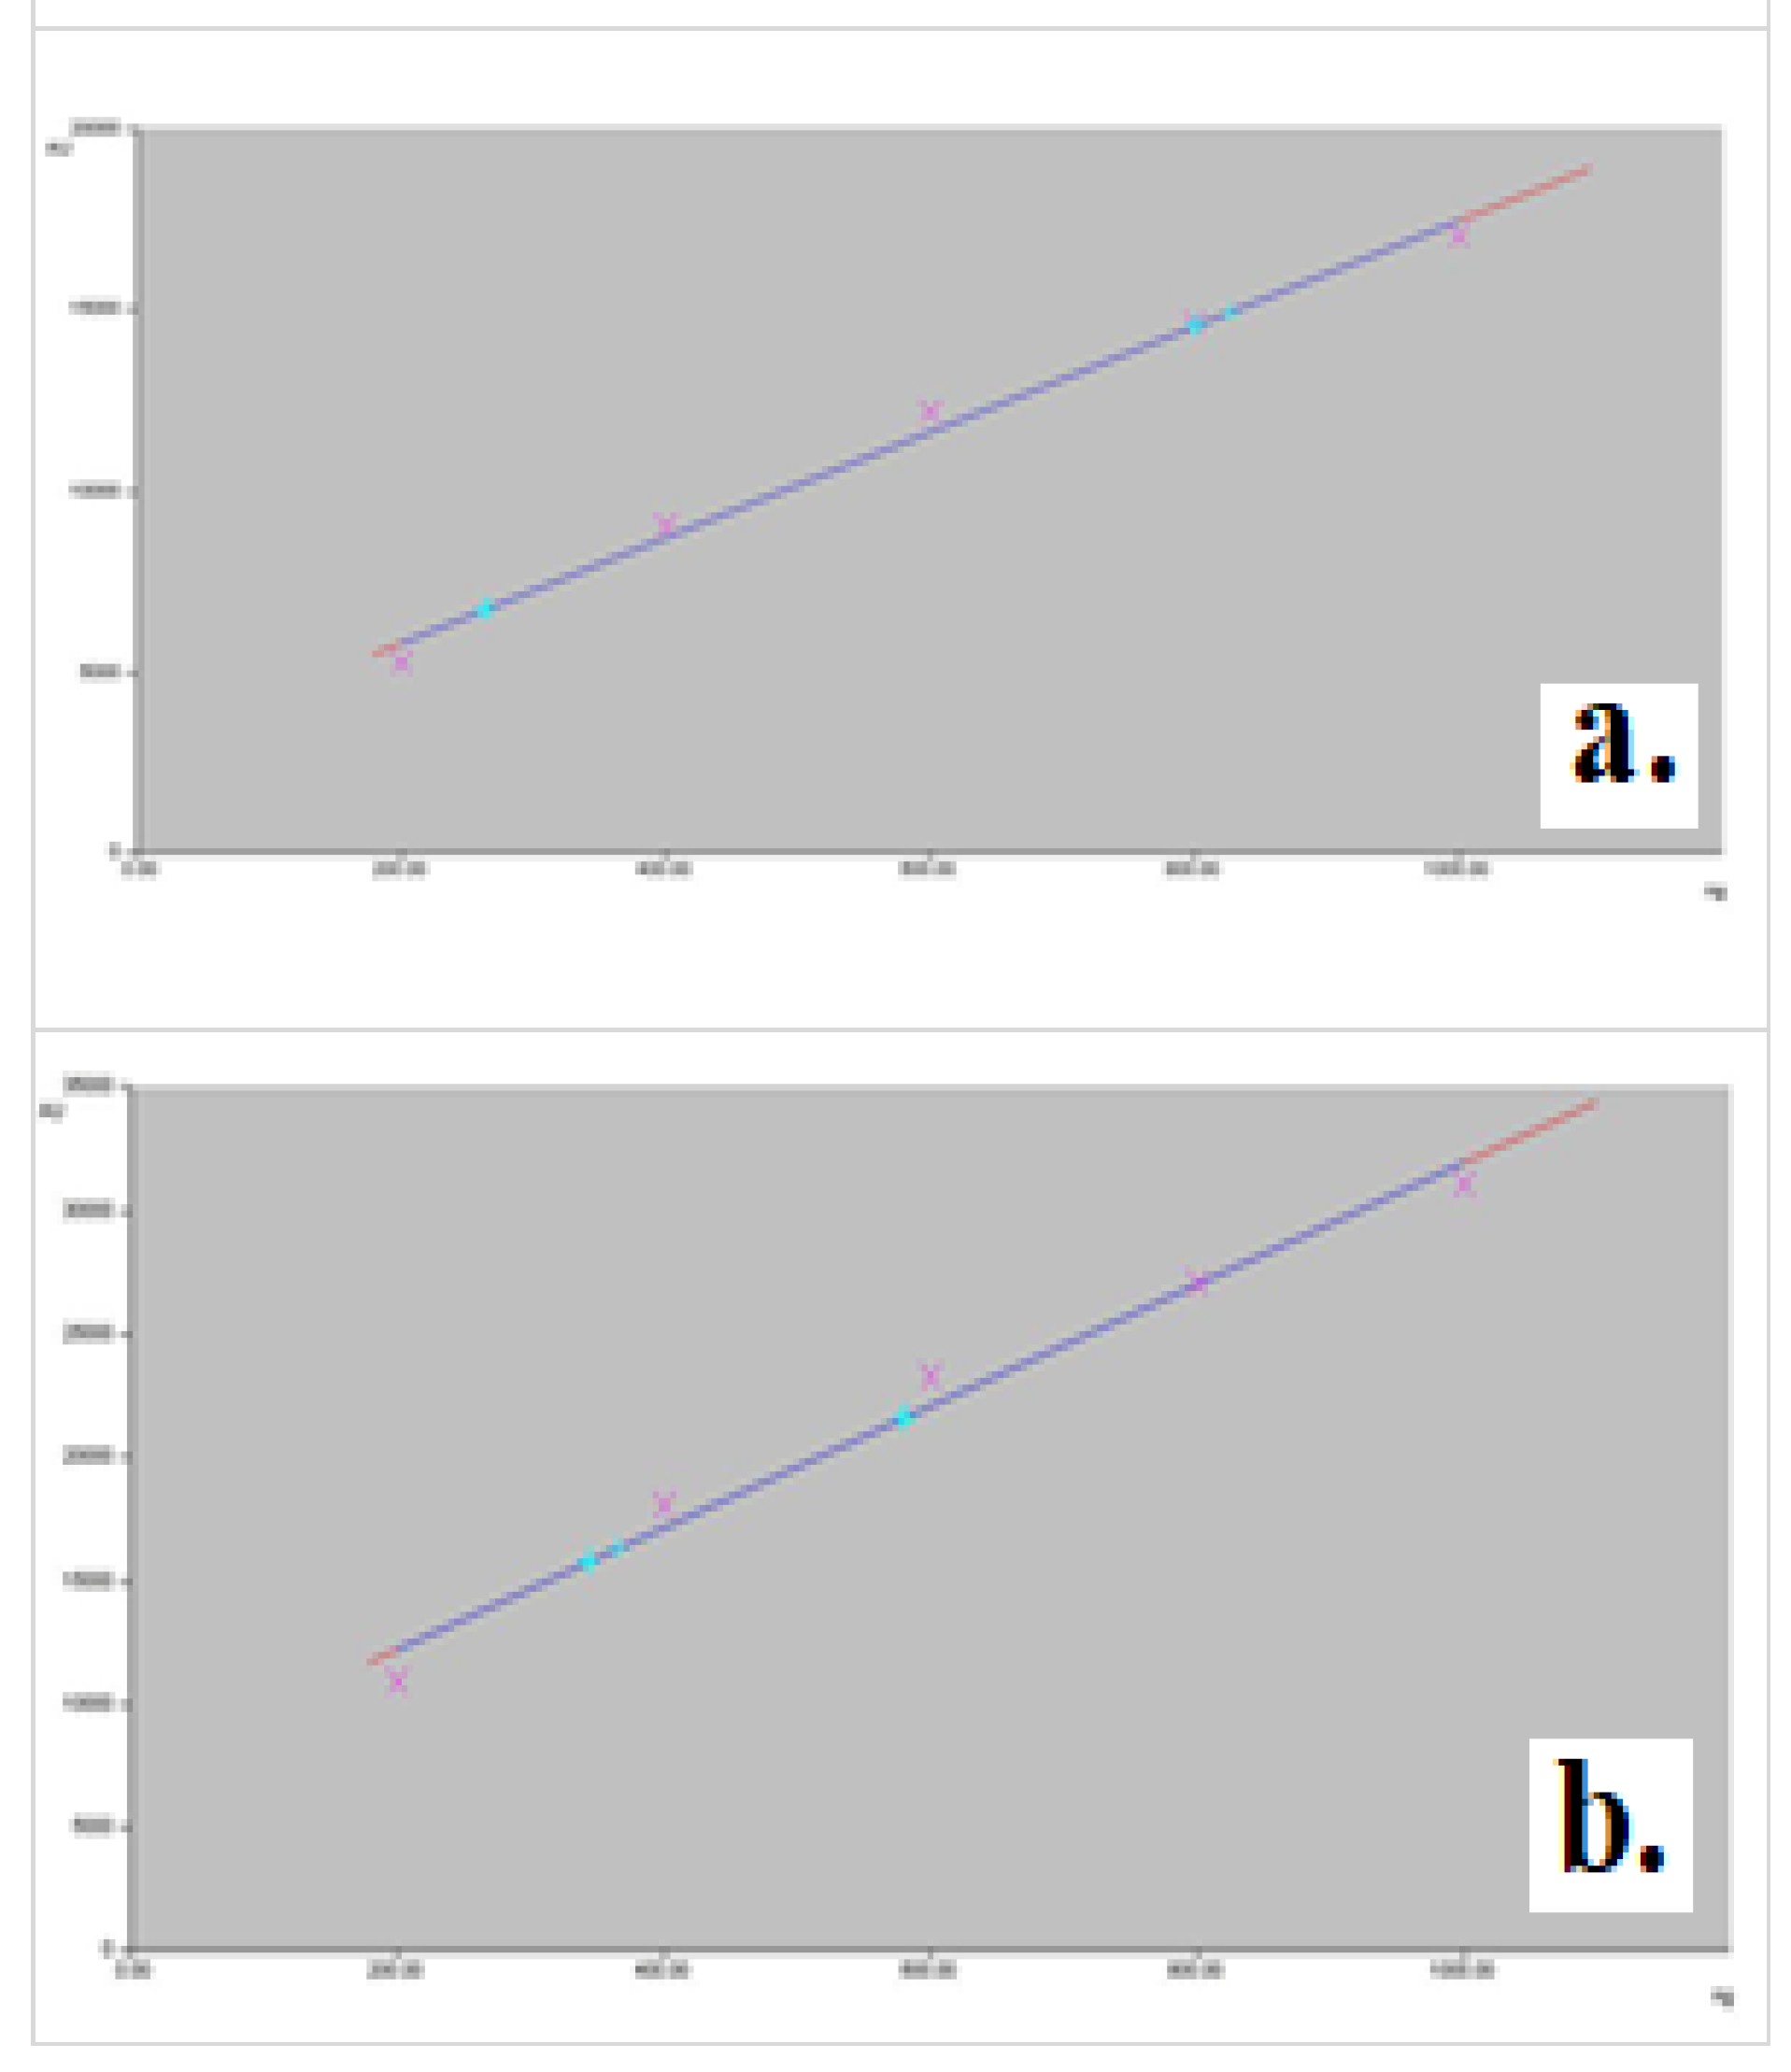
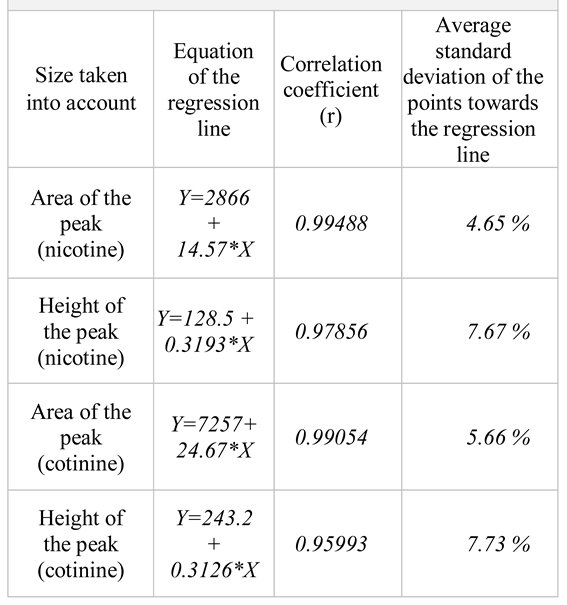
For the quantity range of 200 ng – 1000 ng/spot, the calibration curves with a corresponding correlation coefficient of over 0.99 were obtained. As seen in the regression curves, we have obtained linear regressions with correlation coefficients higher than 0.99 in the case of using the area, but not the height of the chromatogram peak (
Table 2). The calibration curves for nicotine and cotinine are presented in the
Figure 2.
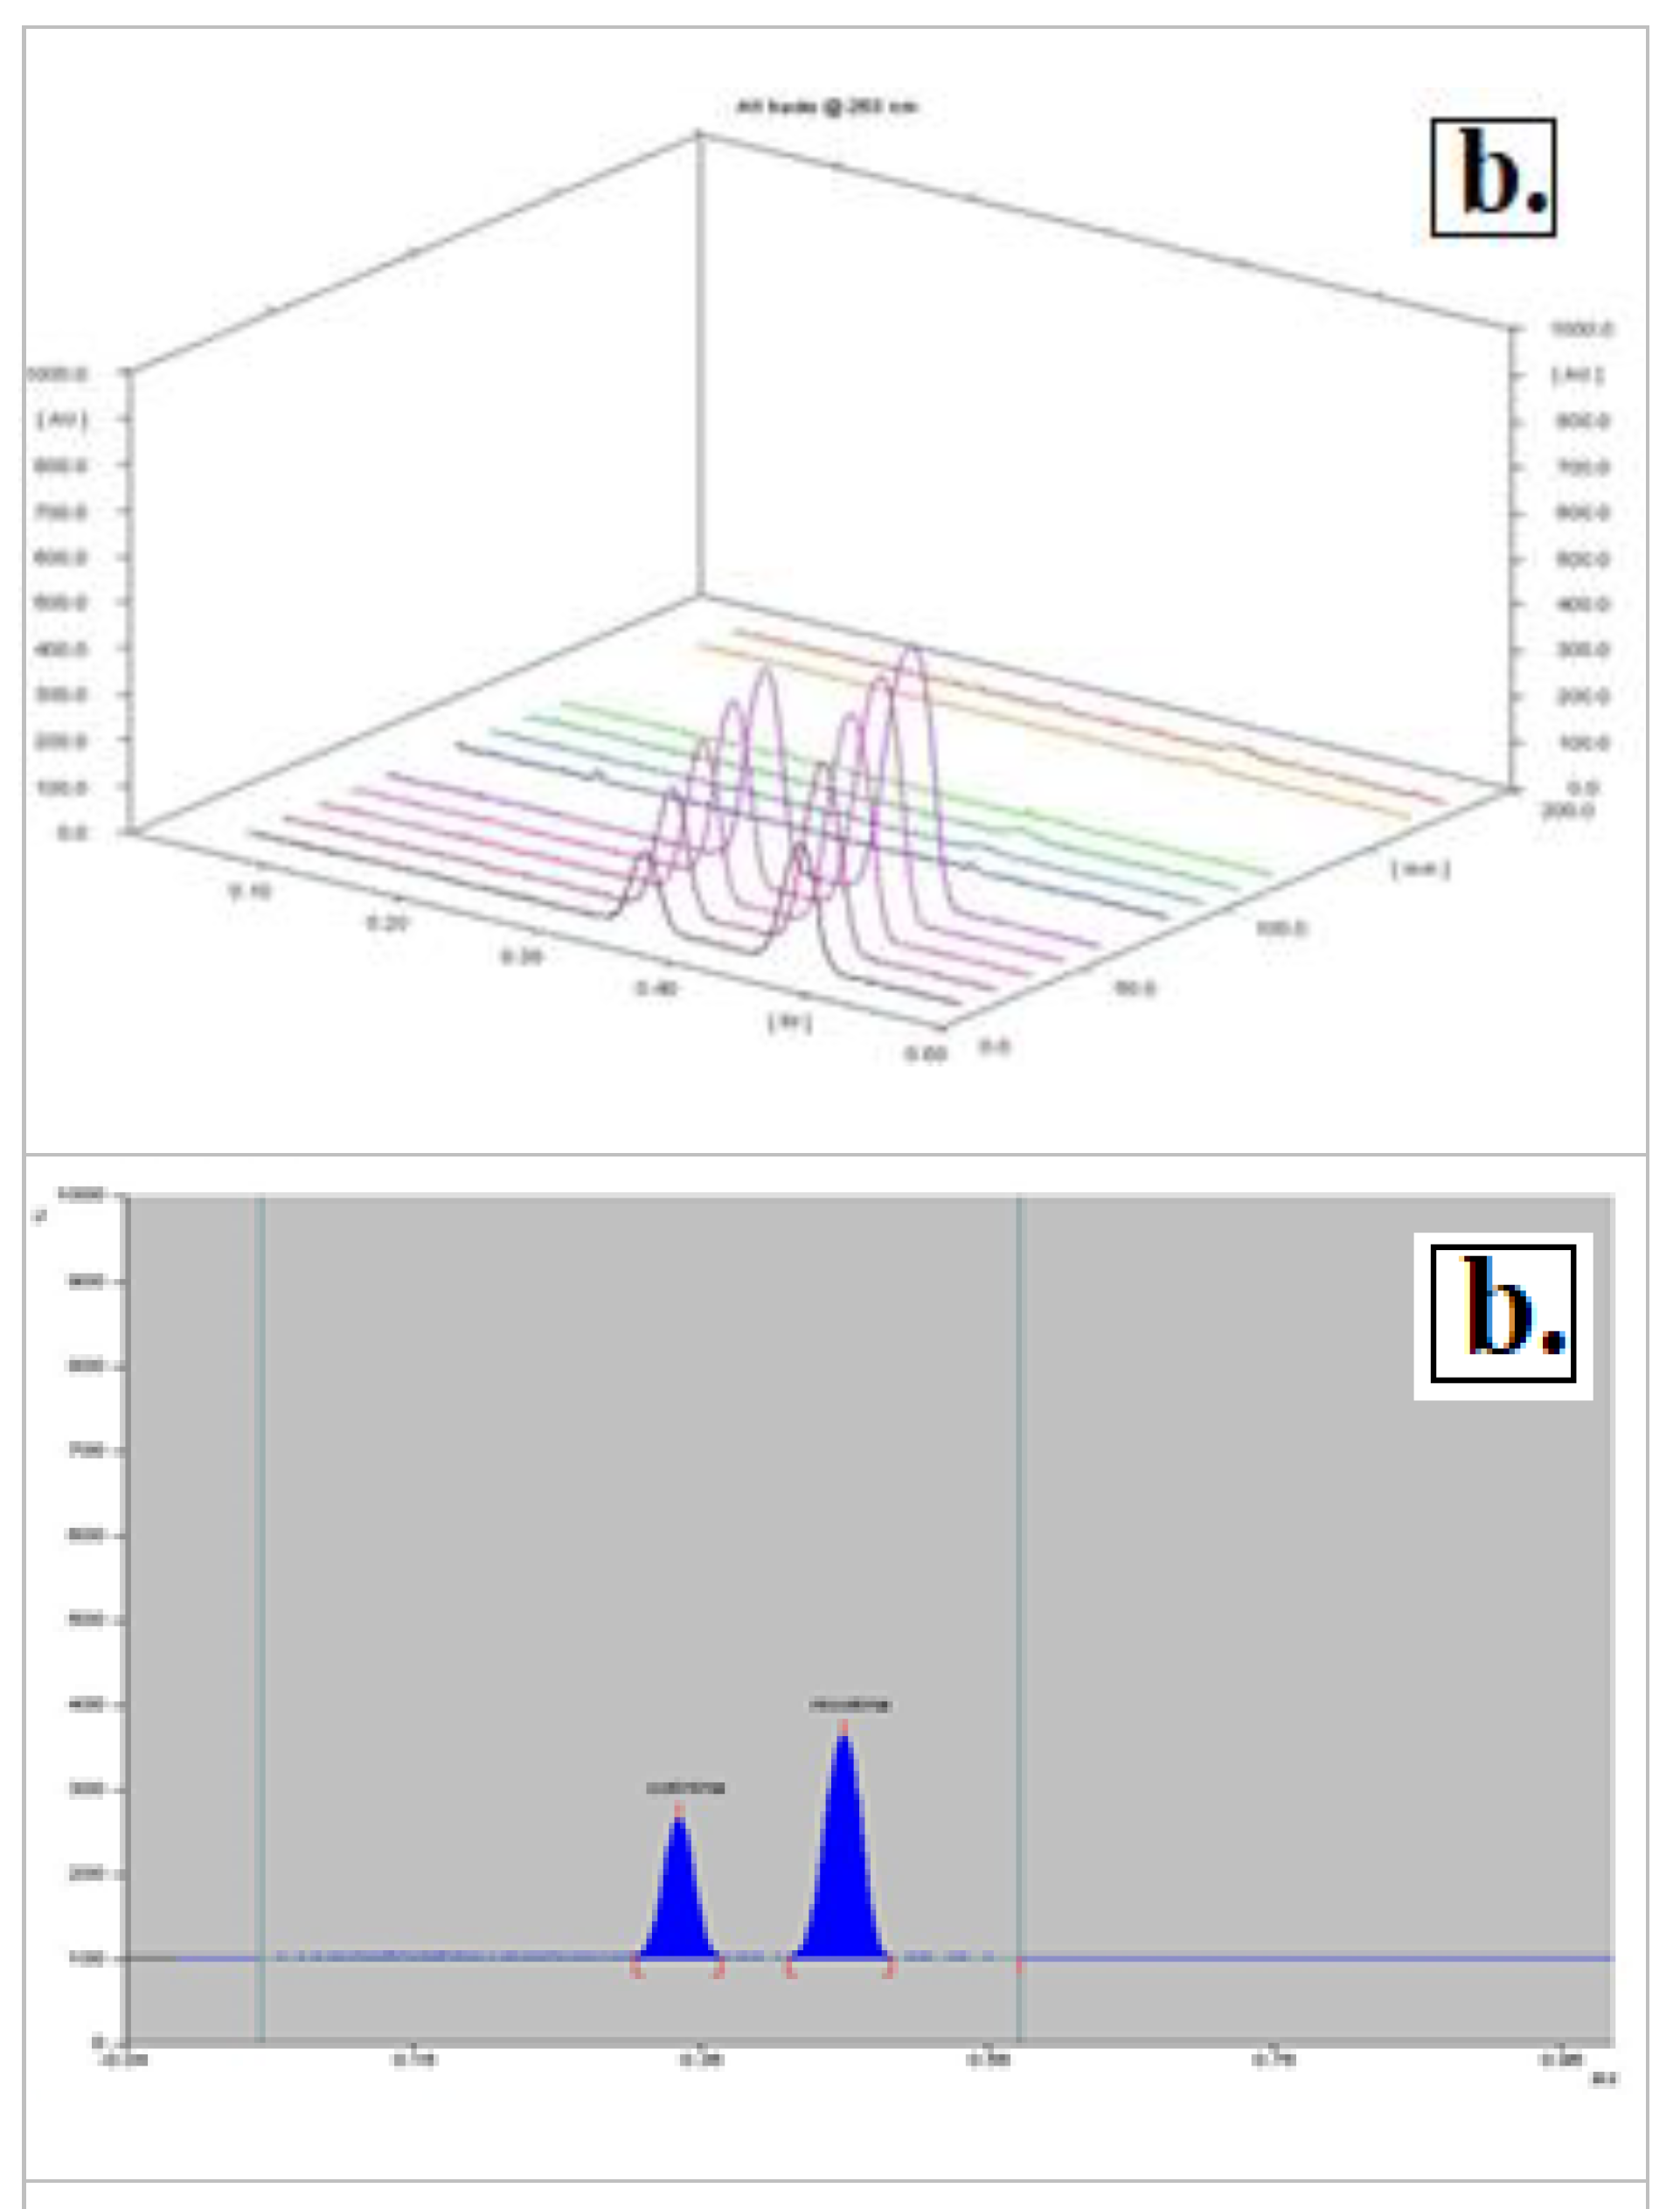
UV spectra corresponding to the peaks separated at Rf values approximately 0.27 and 0.34 confirm the presence of the nicotine (
Figure 3-a.) and cotinine (
Figure 3-b.) both in the standard solution and in the extracts.
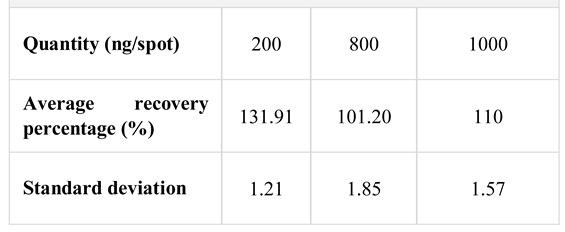
The accuracy of the method, evaluated as percentage of recovery after extraction was determined (
Table 3), with results indicating an overestimation of the percent of recovery, mainly at low quantities.
HPTLC analysis of the nicotine and cotinine, after being extracted from plasma
The best separation of nicotine and cotinine was achieved by using a mobile phase consisting of methanol: chloroform: ammonia (48.75: 48.75: 0.5). The Rf values for nicotine and cotinine were 0.45±0.01 and 0.34±0.01 respectively (
Figure 4).
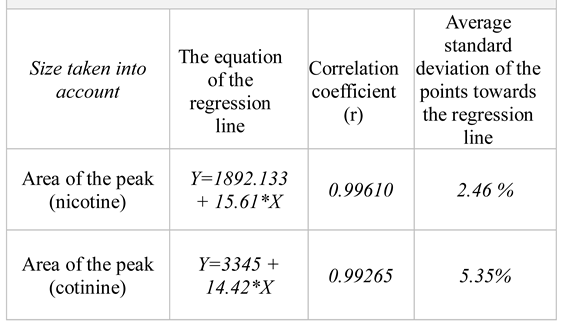
We also established the calibration curves using five quantity levels of nicotine and cotinine in the range of 200 – 1000 ng/mL. The experimental data fit the model of linear equations y = A + Bx well, by using only the area of the peak as a size of quantification (
Table 4).
In experiments on plasma samples, we applied the solid-phase extraction procedure. The results indicate that the solid-phase extraction procedure is not suitable for the extraction of nicotine and cotinine from the plasma (
Figure 4-a).
Discussions
This paper aimed to develop a simple, efficient, and inexpensive analytical method for evaluating nicotine and its metabolite cotinine in biological samples (plasma and urine). Thus, the analytical toxicology study on nicotine and cotinine proposed in this paper supports efforts to improve the methods of analysis for substances frequently reported in intoxications, having in view that toxicology laboratories require new, faster, more sensitive, and less costly methods.
Thin layer chromatography (TLC) draws the attention as a basic analytic method due to its simplicity, robustness, low cost, and selectivity of detection, by using various procedures of tracking. It is the most efficient method for low cost analyses of a large number of tests, especially for screening the abuse substances present in biological fluids and tissues [
11].
The research conducted herein has taken into consideration the fact that over time many methods have been developed for the determination of nicotine and its cotinine metabolite from biological fluids, but most involve either toxic solvents (such as benzene) or complex equipment such as HPLC, mass spectrometer, etc. The extraction methods reported in the literature imply either solid phase extraction on an octadecylsilane (C18) cartridge or different liquid-liquid extraction techniques [
12,
13]. Most TLC methods for nicotine determination have been developed for evaluation in tobacco extracts or tobacco products [
14,
15]. Generally, there are few TLC methods for evaluating nicotine along with its metabolite cotinine in biological samples.
Based on data in the literature regarding the analysis of nicotine by TLC, we have done a series of preliminary tests in order to establish the system of solvents for separating nicotine from its metabolite, as well as the range of linearity. As part of these tests, we checked the extraction from urine and plasma samples, by testing comparatively two extraction methods: a liquid-liquid method, using dichloromethane as solvent, and a solid- phase extraction method using C18 cartridge. These experimental explorations, correlated with the evaluation of the data reported in the literature, have shown that the liquid-liquid extraction is more advantageous. Spectra of the nicotine and cotinine peaks in standard solutions and urine extracts as well as peak purity of extracted substances show that the extraction procedure used is appropriate, as the peak is pure. However, at very low concentrations, there is a tendency to overestimate the yields of extraction. The solid-phase extraction method, although shorter regarding analysis time, is not appropriate, because neither nicotine nor its metabolite could be extracted from plasma [
16].
We have also assessed several systems of solvents as a mobile phase (methanol: ammonia 100:1.5; chloroform: acetone: ammonia 48.75:48.75:2.5; chloroform: methanol: ammonia 48.75:48.75:0.5), on the basis of which we have selected the system chloroform: methanol: ammonia 48.75:48.75:0.5, as the best for the separation of the nicotine from cotinine. By using the first solvent system (methanol: ammonia 100:1.5), the Rf values are high (around of 0.80) and the nicotine does not separate from cotinine. The reduction of the solvent polarity with the second solvent system chloroform: acetone: ammonia (48.75:48.75:2.5) resulted in decreased Rf values (0.27 for nicotine and 0.34 for cotinine), but good separation was not obtained. Changing the composition of the solvent system by replacing acetone with methanol, more polar solvent and reducing the amount of alkalizing agent provided the best separation of nicotine from cotinine (Rf values of 0.45 and 0.34, respectively). The Rf values fall within the acceptability condition on the deviation of ± 5% [
16,
17,
18].
WinCATS software carries out the quantitative analysis of the chromatograms obtained through TLC. This procedure provides calibration graphics which represent the height of the peak or its integrated area according to the quantity of spotted substance. The experimental results indicate that, for the quantity range of 200 ng – 1000 ng/spot, the calibration plots with a good linear relationship (correlation coefficient over 0.99) have been obtained both for nicotine and cotinine by using the area of the peak as a measure of quantification [
19].
Conclusions
We have established the experimental conditions for the identification through HPTLC of the nicotine in presence of its main metabolite, cotinine, in samples of plasma and urine. Thus, we have done the analysis of the nicotine and its metabolite cotinine, using pre-coated glass plates (silicagel 60 F 254), the mobile phase chloroform: methanol: ammonia 48.75:48.75:0.5, and detection at 263 nm. The positive identification has been confirmed by the similarity of the UV spectra of the extracted substances, with those of the standard solutions.
The method allowed the semi-quantitative evaluation of nicotine and cotinine in the range of quantities 200 – 1000 ng/spot, the calibration curves being linear.
The results indicated that the solid-phase extraction of nicotine and cotinine from the plasma was not efficient and either optimization of the technique or liquid-liquid extraction is required.
The elaborated method can be used for the simultaneous determination of nicotine and cotinine in biological samples at high (toxic or lethal) concentrations.
