Results
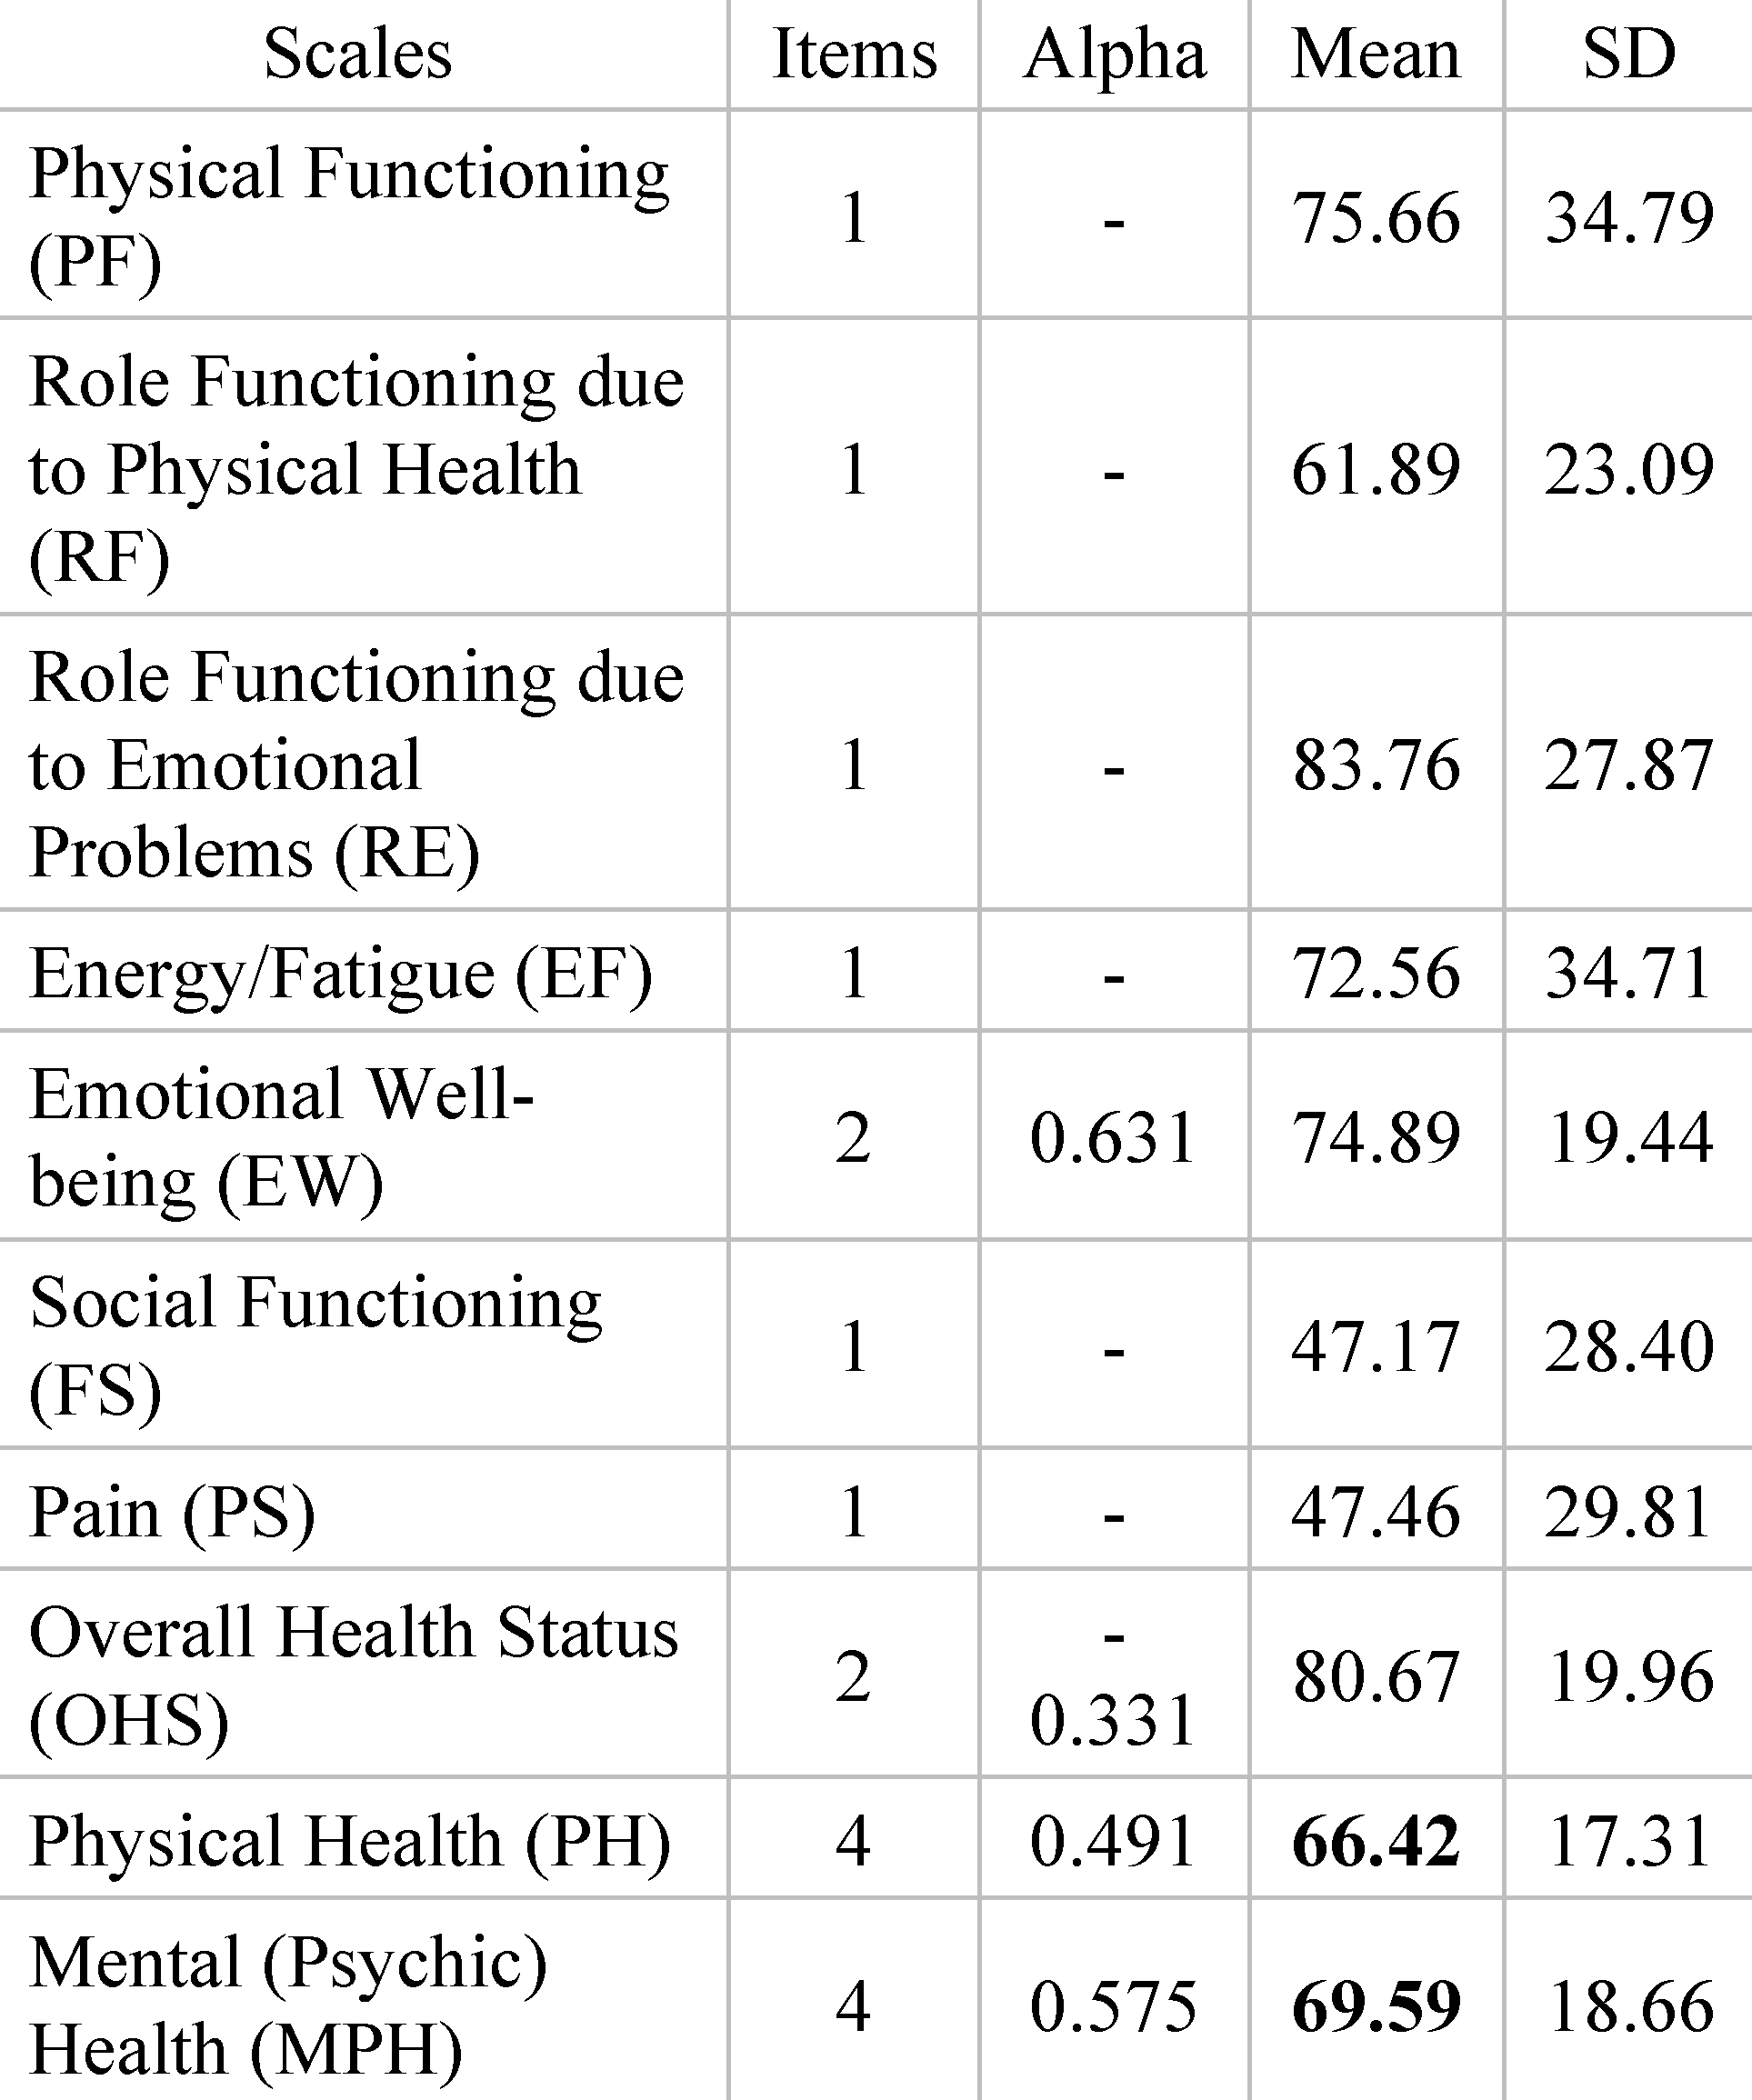
Table 1 presents the reliability (alpha), mean, and standard deviation (SD) obtained for scores.
Physical Functioning (PF). The mean score for physical functioning is approximately 75.66. The standard deviation (SD) is about 34.79. This score reflects the average assessment of the respondents’ ability to function physically. With a mean of 75.66, it can be interpreted that respondents have a moderate or average perception of their ability to perform physical activities. The large standard deviation (34.79) indicates a significant variation in individual responses, meaning that some respondents may have significant difficulties in physical functioning, while others manage better.
Role Functioning due to Physical Health (RF). The mean score for role functioning related to physical health is approximately 61.89. The standard deviation (SD) is about 23.09. This score reflects the average assessment of the ability to fulfil roles related to physical health. The mean of 61.89 suggests that respondents, on average, had a moderate to good perception regarding their ability to fulfil responsibilities related to physical health. The moderate standard deviation (23.09) indicates a significant variation between individual responses.
Role Functioning due to Emotional Problems (RE). The mean score for role functioning related to emotional problems is approximately 83.76. The standard deviation (SD) is about 27.87. This score reflects the average assessment of the ability to fulfil roles related to emotional problems. The high mean of 83.76 suggests that respondents, on average, feel quite capable of managing their responsibilities despite emotional problems. The significant standard deviation (27.87) indicates significant variations between individual responses.
Energy/Fatigue (EF). The mean score for perceived energy and fatigue is approximately 72.56. The standard deviation (SD) is about 34.71. This average reflects the respondents’ average level of energy and fatigue. With a mean of 72.56, it can be interpreted that respondents experienced, on average, a moderate level of energy and fatigue. The high standard deviation (34.71) indicates a significant variation in individual perceptions related to energy and fatigue.
Emotional Well-being (EW). The alpha coefficient (Alpha) for the scale is approximately 0.631, suggesting a weak reliability of this scale. The mean score for emotional well-being is about 74.89. The standard deviation (SD) is about 19.44. This indicates the average level of emotional well-being felt by respondents. The reasonable alpha coefficient suggests consistency in responses to questions in this scale. The moderate standard deviation (19.44) suggests some variation in individual perceptions of emotional well-being.
Social Functioning (FS). The mean score for social functioning is approximately 47.17. The standard deviation (SD) is about 28.40. This suggests that respondents on average rated their ability to function socially at 47.17, with significant variation between individual responses.
Pain (PS). The mean score for pain is approximately 47.46. The standard deviation (SD) is about 29.81. This score indicates the average level of pain felt by respondents, with a significant standard deviation suggesting variations in the perception of pain duration.
Overall Health Status (OHS). The alpha coefficient (Alpha) for the scale is approximately −0.331, which may indicate less satisfactory consistency of responses to questions in this scale. The mean score for overall health status is about 80.67. The standard deviation (SD) is about 19.96. This suggests that respondents on average rated their overall health status at 80.67, although the negative alpha coefficient might signal variation or inconsistency in responses.
Physical Health (PH). The alpha coefficient (Alpha) for the scale is approximately 0.491, indicating weak reliability of this composite scale. The mean score for physical health is about 66.42. The standard deviation (SD) is about 17.31. This score represents the average assessment of the respondents’ overall physical health status, and the moderate standard deviation indicates a moderate variation in individual perceptions.
Mental (Psychic) Health (MPH). The alpha coefficient (Alpha) for the scale is approximately 0.575, indicating weak reliability of this composite scale. The mean score for mental (psychic) health is about 69.59. The standard deviation (SD) is about 18.66. This score reflects the average assessment of the respondents’ mental health, and the standard deviation suggests some variation in individual perceptions related to mental health (
Table 2).
The item ‘How do you evaluate the patient’s state of well-being and psychological distress’: The mean score for this item is approximately 59.513. The standard deviation (Std. Deviation) is about 25.2926. This item aims to assess the patient’s state of well-being and psychological distress. The mean score of approximately 59.513 suggests a moderate or average perception regarding the state of well-being and psychological distress. In other words, respondents appear to have a balanced or mixed experience regarding their mental and emotional state. The relatively high standard deviation (25.2926) indicates significant variations in individual responses, meaning that some respondents might feel more pronounced psychological distress, while others feel more balanced or cheerful.
The item ’How do you evaluate the patient’s state of consciousness’: The mean score for this item is approximately 90.265. The standard deviation (Std. Deviation) is about 19.8863. This item aims to assess the patient’s state of consciousness, particularly regarding temporospatial orientation. The high mean score of approximately 90.265 indicates a positive assessment of the patient’s state of consciousness, suggestive of an adequate temporospatial orientation. The standard deviation (19.8863) indicates significant variations in individual responses, but nevertheless, the high mean suggests that most respondents evaluated the state of consciousness as good and oriented.
Table 3 presents the item statistics.
The item ‘How do you evaluate the patient’s mobility: independent/normal/dependent/limited’: The mean score for this item is approximately 70.182. The standard deviation (Std. Deviation) is about 34.3256. This item pertains to the assessment of the patient’s mobility, with response options being ‘independent’, ‘normal’, ‘dependent’, and ‘limited’. The mean score of approximately 70.182 suggests a moderate or average perception regarding the patient’s mobility. In this context, a higher score could indicate better or more independent mobility, while a lower score could suggest limited or less independent mobility. The relatively high standard deviation (34.3256) indicates significant variations in individual responses, meaning that the perception of mobility can vary considerably among different respondents.
The item ‘
The patient’s attitude towards therapeutic conduct and well as investigations: cooperative/partially cooperative/uncooperative’: The mean score for this item is approximately 91.150. The standard deviation (Std. Deviation) is about 26.0752. This item focuses on the patient’s attitude towards therapeutic conduct and medical investigations, offering the response options ‘cooperative’, ’partially cooperative’, and ‘uncooperative’. The high mean score of approximately 91.150 indicates a positive perception regarding the patient’s cooperation with treatment and medical investigations. A higher score suggests a more cooperative attitude of the patient, while a lower score could indicate partial or no cooperation. The standard deviation (26.0752) indicates significant variations in individual responses, showing that patients’ attitudes towards therapeutic conduct can vary significantly.
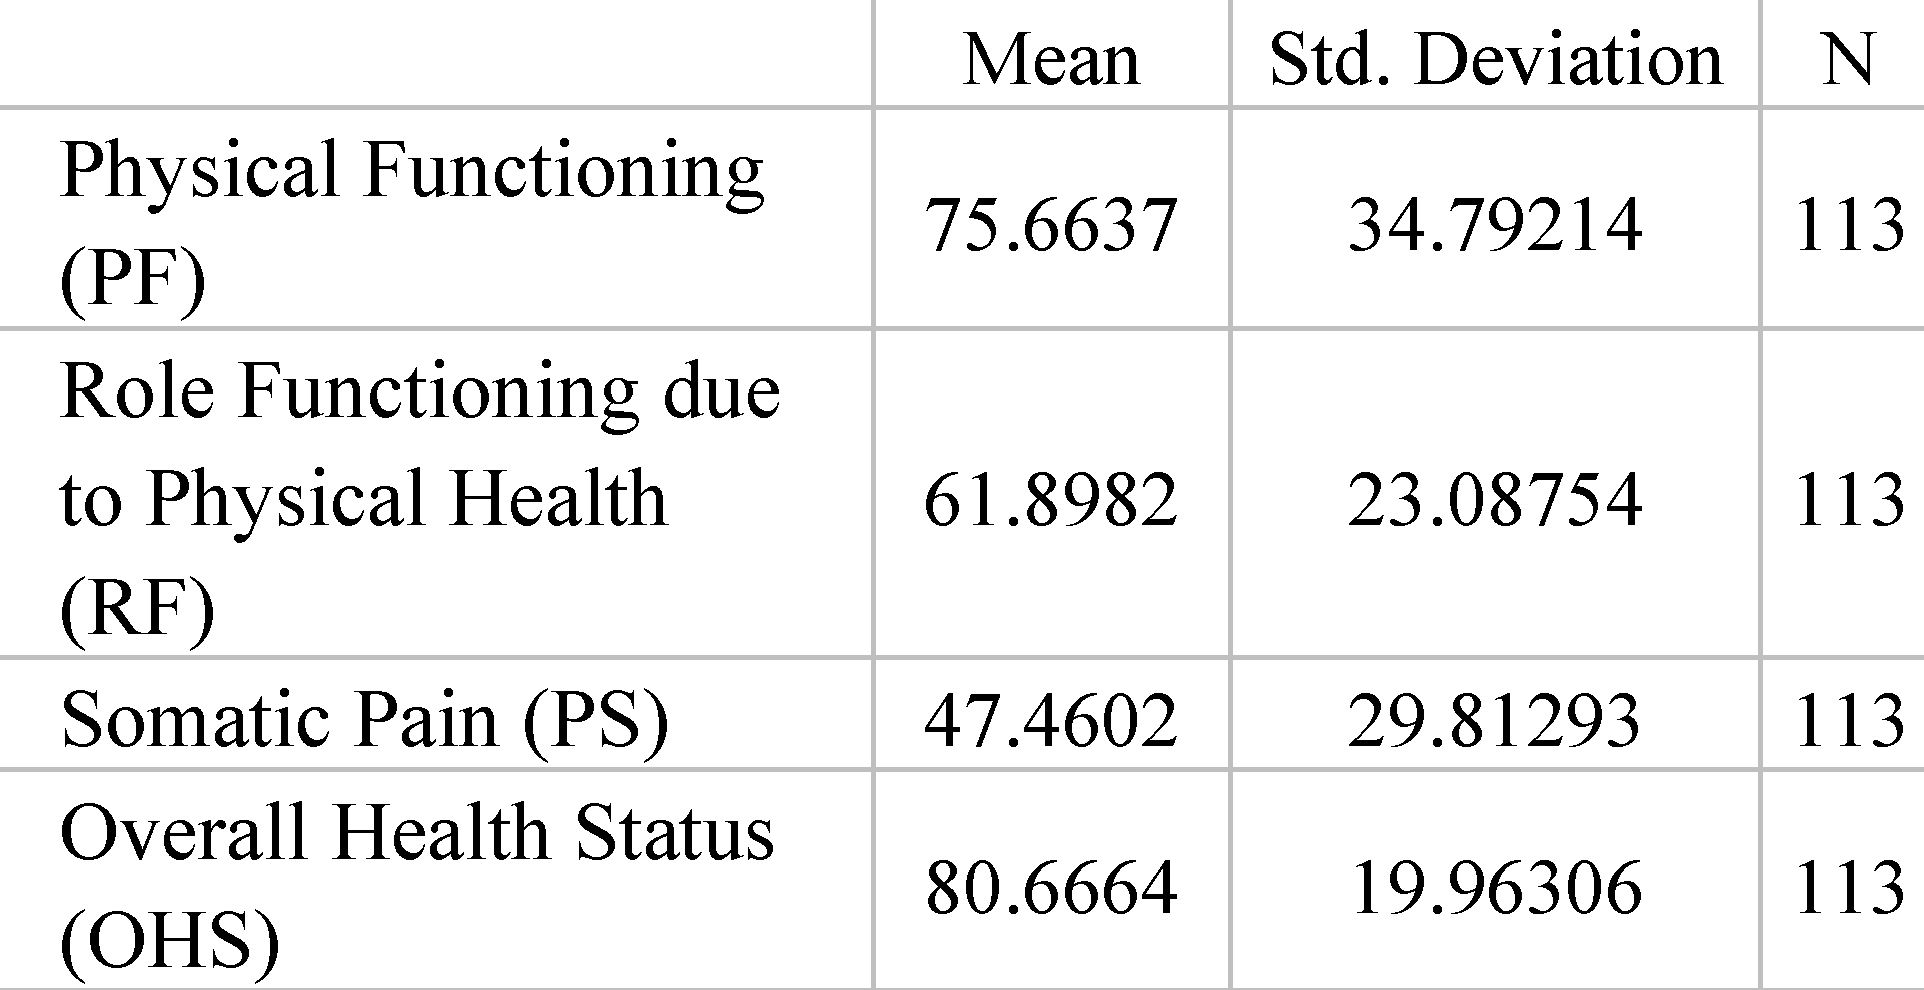
Table 4 presents the item statistics.
The item ‘Physical Function (PF)’: The mean score for this item is approximately 75.6637. The standard deviation (Std. Deviation) is about 34.79214. This item refers to the patients’ perception of their physical functioning. The mean score of approximately 75.6637 suggests an average perception regarding their ability to manage physical activities. A higher score indicates better physical functioning, while a lower score may suggest difficulties in performing physical activities. The relatively high standard deviation (34.79214) indicates that there is significant variation between individual responses, meaning some patients may have more positive perceptions of their physical functioning, while others may have weaker perceptions.
The item ‘Role Physical (RF)’: The mean score for this item is approximately 61.8982. The standard deviation (Std. Deviation) is about 23.08754. This item refers to the patients’ perception of their ability to fulfil physical roles. The mean score of approximately 61.8982 suggests a moderate perception regarding their functioning in physical roles. A higher score indicates better functioning in physical roles, while a lower score may suggest difficulties in fulfilling these roles. The relatively high standard deviation (23.08754) indicates significant variation between individual responses, suggesting that some patients perform better in physical roles than others.
The item ‘Somatic Pain (PS)’: The mean score for this item is approximately 47.4602. The standard deviation (Std. Deviation) is about 29.81293. This item refers to the patients’ perception of their level of somatic pain. The mean score of approximately 47.4602 suggests a moderate perception of the level of somatic pain. A higher score indicates a higher level of somatic pain, while a lower score may indicate a lower level of pain. The relatively high standard deviation (29.81293) shows that there is significant variation in individual perceptions of somatic pain.
The item ‘
Overall Health Status (OHS)’: The mean score for this item is approximately 80.6664. The standard deviation (Std. Deviation) is about 19.96306. This item refers to the patients’ perception of their overall health status. The mean score of approximately 80.6664 suggests a relatively good perception of their overall health status. A higher score indicates a more positive perception of overall health status, while a lower score may suggest a less positive perception. The relatively high standard deviation (19.96306) indicates significant variation in individual perceptions of overall health status.
Table 5. presents the item statistics.
The item ‘Vitality (VT)’: The mean score for this item is approximately 72.566. The standard deviation (Std. Deviation) is about 34.7126. This item relates to the patients’ perception of their level of vitality or energy. The mean score of approximately 72.566 suggests a moderate perception of their vitality level. A higher score indicates a higher level of vitality, while a lower score may suggest a lower level of energy. The relatively high standard deviation (34.7126) indicates significant variation in individual perceptions regarding vitality level.
The item ‘Social Functioning (FS)’: The mean score for this item is approximately 47.153. The standard deviation (Std. Deviation) is about 28.4028. This item relates to the patients’ perception of their social functioning. The mean score of approximately 47.153 suggests a moderate perception of their level of social functioning. A higher score indicates better social functioning, while a lower score may suggest difficulties in social interactions. The relatively high standard deviation (28.4028) indicates significant variation in individual perceptions regarding social functioning.
The item ‘Emotional Role (RE)’: The mean score for this item is approximately 83.759. The standard deviation (Std. Deviation) is about 27.8701. This item relates to the patients’ perception of their ability to fulfill emotional roles. The mean score of approximately 83.759 suggests a relatively good perception of their ability to cope in emotional roles. A higher score indicates a better ability to cope with emotional roles, while a lower score may suggest difficulties in this regard. The relatively high standard deviation (27.8701) indicates significant variation in individual perceptions regarding emotional roles.
The item ‘
Mental Health (MPH)’: The mean score for this item is approximately 74.889. The standard deviation (Std. Deviation) is about 19.4437. This item relates to the patients’ perception of their mental health status. The mean score of approximately 74.889 suggests an average perception of their mental health status. The relatively high standard deviation (19.4437) indicates significant variation in individual perceptions regarding mental health status,
Table 6.
Physical Functioning (PF): This scale refers to the ability to perform physical activities. The average patient score on the SF-36 Scale is significantly lower than the average doctors’ assessment. The moderate positive correlation (0.542) suggests that there is a significant link between patients’ perceptions and doctors’ evaluations regarding physical functioning. The very small p-value (0.000) indicates that this correlation is statistically significant.
Role Functioning due to Physical Health (RF): This scale refers to the ability to fulfil roles due to physical health. The average patient score is significantly lower than the average doctors’ assessment. The weaker positive correlation (0.214) suggests a lesser correlation between patients’ perceptions and doctors’ evaluations. The p-value of 0.023 indicates that this correlation is statistically significant.
Energy/Fatigue (EF): This scale refers to the level of energy and fatigue experienced. The average patient score is significantly lower than the average doctors’ assessment. The significant positive correlation (0.468) suggests a strong link between patients’ perceptions and doctors’ evaluations. The very small p-value (0.000) indicates that this correlation is statistically significant.
Emotional Well-being (EW): This scale refers to emotional well-being. The average patient score is significantly lower than the average doctors’ assessment. The significant positive correlation (0.423) suggests a strong link between patients’ perceptions and doctors’ evaluations. The very small p-value (0.000) indicates that this correlation is statistically significant.
Social Functioning (FS): The average patient score for social functioning is identical, with all patients giving the same scores. The correlation is not calculated, likely due to a lack of variability.
Pain (PS): This domain refers to the level of pain experienced. The average patient score is significantly higher than the average doctors’ assessment. The significant positive correlation (0.341) suggests a moderate link between patients’ perceptions and doctors’ evaluations. The very small p-value (0.000) indicates that this correlation is statistically significant.
Overall Health Status (OHS): The average patient score for overall health status is significantly lower than the average doctors’ assessment. The correlation is very weak and not statistically significant.
Physical Health (PH): This domain refers to the patients’ overall physical health status. The average patient score is significantly lower than the average doctors’ assessment. The significant positive correlation (0.560) suggests a strong link between patients’ perceptions and doctors’ evaluations. The very small p-value (0.000) indicates that this correlation is statistically significant.
Mental (Psychic) Health (MPH): This domain refers to the patients’ overall mental health status. The average patient score is significantly lower than the average doctors’ assessment. The significant positive correlation (0.625) suggests a strong link between patients’ perceptions and doctors’ evaluations. The very small p-value (0.000) indicates that this correlation is statistically significant.
The results indicate significant discrepancies between patients’ perceptions and doctors’ evaluations in most quality-of-life domains. Positive correlations suggest that there is a link between patients’ perceptions and doctors’ evaluations, but this may vary depending on the domain. Statistical significance is indicated by the small p-value values.
Discussions
This study brings into discussion important aspects related to the perception and evaluations of doctors regarding patients’ quality of life. By carefully analyzing these data, we can draw several conclusions and better understand the dynamics between patients’ subjective perceptions and doctors’ objective evaluations.
In
Table 1, the results related to the quality of life of patients are presented, expressed through various dimensions or subdomains of quality of life. Each subdomain is evaluated in terms of mean, standard deviation, and alpha coefficient (for measuring the reliability of the scale). Interpretations of the results for each subdomain are also presented.
An important aspect to note is the significant variability between individual patients’ perceptions regarding the different subdomains of quality of life. This is illustrated by the large standard deviation recorded in many of the subdomains. For example, in the subdomain ‘Physical Functioning (PF)’, where patients’ ability to perform physical activities is measured, we have a standard deviation of approximately 34.79. This means that there is significant variation in patients’ perceptions regarding their level of physical functioning. Some patients may report significant difficulties in physical functioning, while others manage better.
Also presented are the correlations between patients’ perceptions and doctors’ evaluations for each subdomain, as shown in
Table 6. These correlations are important because they show the extent to which patients’ subjective perceptions align with doctors’ objective evaluations. An interesting observation is that there are significant discrepancies between patients’ perceptions and doctors’ evaluations for most of the subdomains. For example, in the case of the subdomain ‘Energy/Fatigue (EF)’, patients reported a lower level of energy and fatigue than the doctors’ evaluations. This could suggest a possible discrepancy in communication between patients and doctors or may reflect patients’ subjective perception that is not always in line with doctors’ objective evaluations.
Another important point of discussion is related to the correlations between patients’ perceptions and doctors’ evaluations. For example, the subdomain ‘Physical bFunctioning (PF)’ shows a moderate positive correlation of approximately 0.542. This means that there is a significant link between how patients perceive their ability to function physically and how doctors evaluate this capability. On the other hand, the subdomain ’Overall Health Status (OHS)’ shows a very weak correlation (0.032) and is not statistically significant, indicating that there is little concordance between patients’ perceptions and doctors’ evaluations in this regard.
It is important to consider that the discrepancies between patients’ perceptions and doctors’ evaluations can have multiple explanations. Sometimes, patients may be more critical in evaluating their own health status, considering subjective aspects or feelings of anxiety or worry. Also, doctors may have a different medical and clinical perspective on the patient’s health status, considering information and factors that may not be immediately visible to the patient [
11,
12].
In terms of interpreting these results, it is important to recognize that patients’ subjective evaluations and doctors’ objective evaluations are two distinct perspectives, each with its own value and limitations. Patients can provide valuable insights into their personal experience, emotional comfort, and impact on their daily lives, aspects that the doctor might not directly observe. On the other hand, doctors’ evaluations are based on medical knowledge, clinical analysis, and professional experience, providing a more technical and objective perspective on the patient’s health status.
In decision-making and patient care, it is important to consider both the physician’s and the patient’s perspectives together. Open communication between doctor and patient can help in understanding the discrepancies between perceptions and assessments, and in addressing them collaboratively and informatively. These findings also indicate the need to develop better communication skills between patients and doctors, ensuring that relevant information is exchanged and correctly understood.
Thus, these research results highlight the complexity of assessing patients’ quality of life and emphasize the importance of a comprehensive approach, integrating both patients’ subjective perspectives and doctors’ clinical assessments. This can ensure more effective and personalized medical care, considering the needs, values, and aspirations of each patient [
13,
14].
Chronic Pancreatitis (CP) is a long-lasting, progressive, and often debilitating disease that significantly affects patients’ quality of life (QoL). Main symptoms include severe abdominal pain, which can occur suddenly or worsen gradually, leading to disability. Other common complications include diabetes, nutrient malabsorption, and weight loss. These symptoms and complications can create additional challenges in managing the disease. Due to its prolonged nature and debilitating symptoms, plus the risk of serious complications like cancer, chronic pancreatitis profoundly impacts patients’ health-related quality of life [
15,
16].
The moderate or average perception of the ability to perform physical activities expressed by respondents may be influenced by several factors reflecting their health status, level of physical activity, and personal or social factors.
Study participants are individuals with varied experiences, health levels, and physical abilities. Some may be very active and manage physical activities well, while others may have physical limitations or health issues affecting their ability to perform certain activities.
The level of physical activity regularly practiced can influence the perception of the ability to perform physical activities. People accustomed to exercise or physical activities may have more confidence in their physical abilities.
Health issues such as chronic conditions, pain, or other medical conditions can affect the ability to perform certain physical activities. Those with such issues may have a lower perception of their physical capabilities.
The European Organization for Research and Treatment of Cancer’s Quality of Life Questionnaire (QLQ) was re-evaluated for patients with chronic pancreatitis [
17]. 25 patients who underwent a pancreatic head resection with duodenum preservation participated. Assessments included the QLQ, Spitzer’s Quality of Life Index, and a pain score, measured twice before surgery, at discharge, and at 6- and 18-months post-surgery. Results showed high reliability and stability of the QLQ, closely correlating with the Spitzer Index and changes in body weight. Significant improvements were observed at 18 months post-surgery in physical condition, working capacity, emotional and social functioning, and overall quality of life. The pain score decreased by 95%. The study concludes that QLQ is a reliable and valid tool for assessing quality of life in patients with chronic pancreatitis. It also mentions that self-esteem, anxiety, and depression can influence the perception of physical abilities. People with a positive self-image and confidence in their abilities tend to have a more favorable perception of their physical capabilities [
18,
19,
20]. Assessing general health status can provide important information about respondents’ care and health needs. Individuals who rated themselves in poorer health may need closer monitoring and appropriate medical interventions.
The respondents’ assessment of their overall physical health reflects how they perceive their own physical health as a whole. Higher scores indicate a more positive perception of health status, while lower scores may indicate concerns or needs for additional health care.
The study conducted by Milde et al. (1992) evaluated and compared the quality of life in individuals who received pancreas/kidney transplants [
21]. The results showed no significant differences between the groups in terms of demographic characteristics and health status.
However, a significant difference was observed in the perception of quality of life and health between the two groups. Recipients with successful transplants perceived a significant improvement in their quality of life and health compared to the period before the transplant, with positive expectations for the future. In contrast, the group with failed transplants did not share this perception, although they were more satisfied with their social support. Their main concerns were related to diabetes, not immunosuppression.
Age may play a significant role in the perception of physical capacity. Older individuals may have some natural physical limitations due to the aging process, which could contribute to a more moderate perception of their physical abilities [
22].
Previous experiences related to physical activities, such as accidents or traumas, can influence how a person feels about their physical capabilities.
The respondents’ moderate to good perception of their ability to fulfil their physical health responsibilities may be influenced by several factors reflecting their attitudes and behaviour related to health, including the following.
Awareness that physical health plays an essential role in maintaining overall well-being and quality of life. This understanding motivates them to fulfil their physical health responsibilities [
23].
Being well-informed about the benefits of a healthy lifestyle and regular physical exercise can lead to a more positive perception of their ability to fulfil their physical health responsibilities. Health education can lead to more informed and responsible decision-making.
Previous positive experiences with adopting a healthy lifestyle can increase confidence in their ability to manage their physical health responsibilities.
Access to a social environment that encourages and supports healthy practices can make them feel they have the necessary resources to fulfil their physical health responsibilities [
24].
Some respondents might have a strong intrinsic motivation to maintain their physical health, finding personal satisfaction and fulfilment in taking care of their body and physical well-being.
Confidence in their abilities to adopt a healthy lifestyle and face challenges can lead to a more positive perception of their ability to fulfil their physical health responsibilities.
Being open and positive towards lifestyle changes can make them more likely to have a better perception of their ability to make these changes and fulfil their physical health responsibilities.
Chronic pancreatitis is an incurable condition that often requires multiple medical interventions and frequent hospital visits. Therefore, establishing a solid relationship between patient and doctor, as well as strict adherence to treatment, is essential for managing the disease. However, factors such as alcohol abuse and unemployment caused by the illness can negatively impact this cooperation, hindering patients from correctly following treatment and medical recommendations [
25,
26].
People are generally capable of managing their responsibilities, even in the face of emotional problems. This is due to the remarkable adaptability of humans in the face of stress, anxiety, and other negative emotions. Many manage to maintain daily functionality thanks to developed skills to cope with emotional challenges. They might use various emotional management strategies and adapt to stress, such as relaxation exercises, meditation, conversations with friends or therapists, or creative activities. Additionally, some can effectively manage priorities and focus on fulfilling responsibilities, even in difficult times. Social support also plays a crucial role, providing essential emotional support. Strong motivation and mental resilience also contribute to their ability to maintain functionality despite emotional challenges.
The study by Fitzsimmons et al. identified that the primary concern affecting the quality of life (QoL) of individuals with pancreatic cancer is the fear related to their future health status. This fear is closely linked to the emotional issues associated with pancreatic cancer and the overall pain, ranking at the top of the list of most impactful aspects on QoL [
25]. The research found that respondents experienced an average level of moderate energy and fatigue.
The daily life of individuals influences their level of energy and fatigue. A balanced lifestyle, with healthy eating, regular physical exercise, and adequate sleep, can lead to higher energy levels and reduced fatigue. On the other hand, chronic stress or stressful events can cause physical and mental exhaustion, increasing the level of fatigue. Poor quality or lack of sleep can also lead to daytime fatigue, and certain conditions or sleep disorders can affect rest [
23,
24].
Both lack of physical activity and overtraining can contribute to fatigue. The general health status, including certain medical conditions, can influence energy and fatigue levels. Mental well-being, including anxiety, depression, or other psychological disorders, can affect energy and lead to fatigue.
Individual tolerance to effort and circadian rhythm varies from person to person, influencing energy and fatigue levels. The work environment and daily routine, such as long working hours or demanding tasks, can increase fatigue. Respondents’ emotional well-being is reflected in their mood, emotions, level of happiness, and overall satisfaction with life, which are important aspects in researching emotional well-being [
14,
17].
The average level of emotional well-being is influenced by a variety of factors, including the environment we live in, personal circumstances, recent events, and individual characteristics. Higher scores in emotional well-being assessments suggest better emotional health, characterized by positive emotions, and increased overall life satisfaction. Conversely, lower scores may signal emotional difficulties or a generally lower level of well-being [
27].
The assessment of the ability to function socially refers to an individual’s ability to interact and engage in social activities with other people. This assessment can provide important information about respondents’ level of social involvement, their ability to develop and maintain relationships, and the degree to which they feel comfortable in social interactions.
The average score obtained in the assessment of social functioning indicates the general ability of respondents to interact with others and participate in social activities. This score can range from significant difficulties in social interactions to highly developed social skills [
19].
A significant variation in scores indicates that respondents have different experiences regarding social functioning. Some might have remarkable social abilities and feel comfortable in various social situations, while others might struggle to connect with others or integrate into social groups.
The ability to function socially is influenced by several factors, including personality, self-confidence level, communication skills, past experiences in social interactions, social anxiety, or other mental health issues, as well as the cultural context and environment in which individuals live. Social connections and satisfying relationships play an important role in the emotional and mental well-being of individuals. Feelings of isolation or difficulties in social interactions can negatively impact a person’s overall well-being [
15,
16,
17].
For those who struggle with social functioning, support and involvement in activities that can improve social skills can be beneficial. Therapy or counselling can assist in developing self-confidence and communication skills, thus contributing to improved social interaction capabilities.
The assessment of the average level of pain experienced by respondents can provide essential information about their physical condition and overall comfort.
The average pain score obtained in the assessment reflects the general level of discomfort or pain experienced by respondents. This score can range from no pain to severe pain.
If there is significant variation in the scores among individual responses, this may indicate that respondents have different experiences with pain. Some might experience little to no pain, while others might suffer from more intense or chronic pain [
6,
7,
8].
The level of pain experienced by an individual can be influenced by various factors, including existing medical conditions (both chronic and acute), physical activity level, type of work performed, stress factors, emotional state, and other personal factors. Chronic or intense pain can have a profound effect on quality of life, impacting the ability to work, enjoy daily activities, sleep properly, and maintain healthy social relationships. Higher pain scores may correspond to lower levels of overall well-being.
For individuals reporting high levels of pain, medical or therapeutic interventions may be necessary to manage and reduce this pain. It is important for these individuals to receive adequate support to improve their physical condition and, consequently, their overall quality of life.
The study conducted by Mokrowiecka et al. found that pain is a major issue for the evaluated patients. A significant negative correlation was identified between the average quality of life level and pain scores in almost all examined areas. The intensity of pain had a greater impact on various aspects of quality of life compared to its frequency [
28]. Overall health status is a subjective assessment people make about their own health. It reflects how they feel physically, mentally, and emotionally at a given time. When respondents are asked to evaluate their overall health status, they may consider a range of factors, such as energy levels, presence or absence of pain and discomfort, emotional state, ability to function in daily activities, and many others.
The average score obtained in the assessment of overall health status reflects the respondents’ general perception of their own health. This can range from excellent health to poor health, or a state affected by various health issues. Significant differences between individual responses may reflect the diversity of health experiences among respondents. Some might feel in very good health, while others might be dealing with various conditions or feel less healthy for different reasons.
The assessment of overall health status can be influenced by a multitude of factors, such as current physical condition, mental and emotional state, lifestyle, dietary habits, physical activity level, personal and family medical history, and other external factors.
It is important to emphasize that the assessment of overall health status is subjective and reflects the individual’s perception. Two people with the same medical diagnosis can have different perceptions of their health status depending on how they feel and how they manage their condition.
Overall health status can influence a person’s overall well-being. Those who generally feel healthy may have more energy, function better in their daily activities, and have a more positive outlook on life overall.
Factors such as physical activity level, dietary habits, presence of medical conditions, family history, and other environmental factors can influence a person’s perception of their overall physical health state.
Evaluating the mental health of respondents can provide essential information about their psychological, emotional, and social state. Measuring stress levels can help understand the challenges respondents face in their daily lives and how this stress might affect mental health [
29,
30]. Assessing anxiety can reveal whether respondents are dealing with anxiety disorders and the intensity of these disorders. The obtained information can guide the direction of therapeutic interventions [
31].
Identifying the level of depression is important to understand if respondents may suffer from depressive disorders. Depression can have a significant impact on quality of life and requires appropriate attention and treatment [
32].
Studies have shown that mortality rates are higher in men than in women for the conditions studied, mainly attributed to the higher incidence of disease in men, as survival rates between sexes are similar [
33]. Most studies used mortality rates standardized to the European Standard Population (ESP), but this led to lower mortality rates compared to adjusted and crude age ESP estimates, raising questions about the adequacy of this standardization method for the European population. Mortality rates in different European regions and countries were comparable to the European level, except for one study that indicated higher mortality rates in the Eastern European accession countries compared to the European Union [
34].
On the other hand, patients with pancreatic cancer recorded significantly lower quality of life (QoL) scores and higher levels of depression and anxiety compared to population norms. This indicates the need for improved supportive care for patients, from enhanced screening or early diagnosis to the availability of treatments that offer clear survival benefits [
35,
36].
Analyzing the results of the study presented in the tables, the following findings were observed:
For H1: Respondents reported a relatively good perception of their overall health state—accepted. The average score for general health state (GHS) was approximately 80.6664, indicating a relatively good perception of overall health state by respondents.
For H2: Respondents reported a moderate perception of their level of social functioning—accepted. The average score for social functioning (SF) was approximately 47.153, suggesting a moderate perception of the level of social functioning by respondents.
For H3: There is a strong link between patients’ perceptions and medical evaluations regarding the mental health of patients—partially accepted. The correlation between patients’ perceptions and medical evaluations of mental health (MH) was 0.423, indicating a moderate link, not necessarily “strong.” However, considering it is statistically significant, we can consider there is a relevant correlation, but not necessarily at the “strong” level suggested by the hypothesis. Therefore, H1 and H2 are accepted, while H3 is partially accepted, with a nuance regarding the intensity of the correlation between patients’ perceptions and medical evaluations.
Conclusions
The overall objective of this study was to analyze doctors’ experiences regarding the health status of patients with benign pancreatic pathology who underwent surgery at CF2 Clinical Hospital in Bucharest.
Doctors perceive a generally good health status in patients. The average scores are relatively high, indicating a positive perception of patients’ overall health.
Physicians assessed patients’ physical functioning as moderate to good. The scores suggest that most patients can perform physical activities, although there are significant variations among patients.
Doctors consider that patients have a moderate ability to fulfil their physical roles. This suggests that while some patients manage well, others may face difficulties.
There is a moderate perception of the level of somatic pain in patients. Doctors acknowledge that pain is an issue, but the perceived severity varies among patients.
Physicians perceive moderate levels of vitality or energy in patients, indicating that some patients might feel tired or have low energy. Doctors perceive moderate social functioning, suggesting that patients may have difficulties in maintaining social relationships or participating in social activities.
The physicians’ perception is that patients manage emotional roles relatively well, indicating decent adaptation to emotional stresses.
Scores for physical and mental health indicate a moderate perception of health status, with moderate variation in perceptions and poor reliability of the scales.
The average scores suggest a moderate perception of wellbeing and psychological distress, with significant variations among responses. High scores indicate a positive evaluation of the patient’s state of consciousness, with significant variations among responses.
The scores suggest a moderate perception of patient mobility and a positive attitude towards therapeutic conduct, with significant variations among responses.
Regarding the study, we find questionable reliability for MH, poor for MPH, and unacceptable for OHS, PH, in terms of applying the questionnaire for doctors.
Also, we obtained a moderate positive correlation for PF, PH, MPH, a weak positive correlation for VT, MH, SF, and a negligible correlation for RP, RE, OHS by correlating the scores of the two questionnaires.
Therefore, doctors’ perceptions of the health status of patients with surgically treated pancreatic diseases indicate recognition of the diverse challenges and needs of these patients, both physically and emotionally and socially. These perceptions underscore the importance of a holistic approach in patient care, covering all aspects of their wellbeing.