Article

Economic Impacts of Curtailing Wind Turbine Operations for the Protection of Bat Populations in Ontario

1
Canadian Wildlife Service, Environment and Climate Change Canada, 867 Lakeshore Road, Burlington, ON L7S 1A1, Canada
2
CanmetENERGY-Ottawa, Natural Resources Canada, 1 Haanel Drive, Ottawa, ON K1A 1M1, Canada
3
NextEra Energy Resources, NextEra Analytics, 700 Universe Boulevard, North Palm Beach, FL 33408, USA
4
Science Policy Integration Branch, Natural Resources Canada, 580 Booth Street, Ottawa, ON K1A 0E4, Canada
*
Author to whom correspondence should be addressed.
Wind 2023, 3(3), 291-301; https://doi.org/10.3390/wind3030017
Submission received: 17 May 2023 / Revised: 19 June 2023 / Accepted: 28 June 2023 / Published: 13 July 2023

Abstract

:
Wind energy is a growing industry in Canada to meet the demand for a renewable supply of energy. However, wind turbine operation represents a high mortality risk for bat populations, and regulators often require that steps are taken to mitigate this risk. The result is concern among operators about lost revenue potential. This study was, therefore, designed to estimate the theoretical financial impact of curtailing turbine operations to mitigate for bat mortality for all wind farms that were constructed and operating in Ontario, Canada, as of 1 January 2020 (n = 87 wind farms). Empirical data from the Canadian Wind Farm SCADA and meteorological systems are not publicly available; thus, we were compelled to use data from the Canadian Wind Turbine database, the Environment and Climate Change Canada Wind Atlas, and the Independent Electricity System Operator to calculate the total theoretical energy production for all wind turbines in the province using manufacturer power curves and a measure–correlate–predict linear regression method. We estimated the financial impacts for all wind farms on the assumption that operations were curtailed when the Wind Atlas modelled local wind speed was <5.5 m/s between 6 pm of one day and 6 am the following day, between 15 July and 30 September, using the lower and upper limits of power-purchase agreement rates for Ontario wind farms: 115 and 150 CAD/MWh. We used generalized linear modelling to test whether the variability in production loss was predicted based on factors related to turbine design and site wind speeds. We estimated that total annual wind energy production would be reduced from 12.09 to 12.04 TWh if all Ontario wind farms implemented operational curtailment, which is equivalent to a difference of 51.2 GWh, or 0.42%. Production loss was related to turbine cut-in speeds and average site wind speeds recorded between 15 July and 30 September. The estimated profit losses were 6.79 ± 0.9 million CAD compared to estimated earnings of 1.6 ± 0.21 billion CAD, which suggests that mitigating bat mortality may represent a small cost to the industry relative to the conservation benefits for bat populations.

1. Introduction

Canada is a global leader in the development and use of energy from renewable resources [1]. To meet the target of net-zero greenhouse gas emissions by 2050, Canada is seeking to expand its reliance on renewable resources to supply the energy grid. Consistent across all net-zero electricity scenarios modelled by the Canada Energy Regulator are large increases in wind and solar capacity, ranging from 100 to 150 GW, by 2050 [2]. As of December 2021, 14.3 GW of wind energy capacity was distributed throughout all provinces and territories, except for Nunavut [3], and Canada was ranked eighth in the world for installed capacity at the end of 2022 [4]. In 2021, 36.19 GWh of electricity was generated from wind, which represented 6.2% of Canada’s national energy demand [5].
While the infrastructure required to support wind energy production is the lowest cost source of new electricity generation in Canada [3], there are concerns about the mortality risks that colliding with operating wind turbines pose to bats. In fact, wind turbines represent the largest source of anthropogenic mortality for bats [6,7], and mortality levels may be sufficiently high to cause population declines in some species [6,8,9,10,11,12,13,14]. Considering all species together, there is an estimated total mortality rate of 166,000 individual bats per year at Canadian wind farms [10]. Migratory tree bat species, such as the hoary bat (Lasiurus cinereus), the eastern red bat (Lasiurus borealis), and the silver-haired bat (Lasionycteris noctivagans), account for >75% of wind farm mortalities, and they were recently assessed as Endangered due to, in part, the substantial threat of collisions with operating wind turbines [15]. We also note that little brown myotis bats (Myotis lucifugus), an endangered species, have been killed in significant numbers [10,16,17]. Given the severity of the impact of white-nose syndrome on little brown myotis populations, even relatively low levels of mortality at wind turbines pose a significant threat to the survival and recovery of this species in Canada without appropriate mitigations [18].
In response to the high levels of bat mortality observed at wind farms in the early 2000s, researchers and operators throughout North America began testing and implementing strategies to mitigate this problem (summarized in [19]). In Ontario, the Ontario Ministry of Natural Resources (OMNR) published guidelines for wind power projects [20], which include protocols for identifying and assessing bat habitats, post-construction bat mortality monitoring surveys, and bat mortality mitigation via operational curtailment. Briefly, all Ontario wind farms are required to conduct post-construction monitoring for bat mortality for three years after being commissioned. Wind farms with an estimated annual mortality that exceeds 10 bats/turbine/year during this period are required to mitigate via operational curtailment throughout the lifetime of the project. These operators must implement a turbine cut-in wind speed of 5.5 m/s between sunset and sunrise from 15 July to 30 September for all future years of operation, and for all turbines in the wind farm [20]. In general, increasing the cut-in wind speed is an effective strategy for reducing bat mortality [21,22,23,24,25]. Likewise, the OMNR [20] mitigation strategy was previously shown to reduce, though not eliminate, bat mortality [13].
Wind farm operators have long expressed concerns to regulators about the financial consequences of curtailing operations to mitigate wildlife mortality. The requirement to raise the turbine cut-in speed to 5.5 m/s, and, therefore, above the manufacturer’s cut-in speed, reduces renewable energy supply and revenue potential for wind farm operators. Additional concerns stem from factors related to turbine design, as turbines with lower cut-in speeds can generate power in a wider range of wind speed conditions than those with higher cut-in speeds. Accordingly, these turbines lose more opportunities to generate power when the wind speed is above the cut-in speed but below 5.5 m/s, and it follows that local wind resources will also affect revenue potential. Alternate mitigation strategies may reduce bat mortality risks with less financial impact, such as the use of ultrasonic deterrents [26], curtailing operations at times of day and year when bats are likely to be active in a given project area [27,28], or curtailing based on real-time bat detection information [29]; however, these strategies have not been widely endorsed by provincial energy regulators in Canada.
This study quantifies the theoretical financial impacts and losses related to energy production that result from implementing operational curtailment to reduce bat mortalities at wind farms in the province of Ontario, Canada. We calculated the theoretical lost revenue that would result from implementing the OMNR [20] mitigation strategy for all Ontario wind farms that were installed and operating by 1 January 2020. We tested whether turbine design and wind speed conditions predict variability in lost energy production to understand the differences between the financial impacts that wind farms experience in this province. This study is the first landscape-scale analysis of the economic implications of mitigating wildlife mortality in clean energy projects.

2. Materials and Methods

Geographic location and infrastructure data for wind farms that were installed and operating in Ontario by 1 January 2020 were retrieved from the Canadian Wind Turbine Database, which is an open-source database of commercial wind farms maintained by Natural Resources Canada [30]. For each wind farm, the database includes the project name, total nameplate capacity, number of installed turbines, rated capacity per turbine, turbine rotor diameter, turbine hub height, turbine manufacturer and model, turbine latitudes and longitudes, project commissioning date, and project latitude and longitude [30]. We compiled data on the International Electrotechnical Commission (IEC) turbine design class, cut-in wind speed, and theoretical power curves, as they were available from manufacturers’ websites.
Historical grid-modeled wind data were downloaded from the Environment and Climate Change Canada Wind Atlas, which is a geospatial representation of the average weather conditions that occur throughout Canada from the southern border to 70° North [31]. The Wind Atlas is a three-dimensional atmospheric model of weather patterns organized in 2-km grid cells over 10 min intervals, which were compiled using meteorological data collected between 2008 and 2010. Wind speed data were downloaded from the Wind Atlas from the closest grid cell for each wind turbine in our sample. The wind speed data were used to calculate the amount of power that would theoretically be produced on an annual basis by each wind turbine according to the manufacturer’s power curves. For each wind farm, the total theoretical power production was the sum of the power produced by the turbines.
Manufacturer power curves are theoretical representations of the potential power output of a turbine at different wind speeds. These curves assume 100% turbine availability and, therefore, do not account for expected losses in energy output. Expected losses occur due to turbine downtime for maintenance or scheduled curtailment, extreme weather events, erosion and blade icing, electrical losses [32], or curtailment to meet the demand for electricity [33]. Such losses vary based on geographic location, weather conditions, operation and maintenance schedules, and environmental and socioeconomic policies. Accordingly, calculations of power output based on the power curve alone will result in an overestimation of potential energy production.
To reduce the degree of overestimation and account for sources of expected loss, we adjusted the total calculated power production according to power production data published by the Independent Electricity System Operator (IESO) in 2020 [34] using a measure–correlate–predict linear regression method [35,36]. The measure–correlate–predict method is commonly used in renewable energy studies to estimate the wind resources that represent the long-term conditions at a target site. Using this method, the calculated total theoretical power production was plotted against the 2020 IESO reported production on a monthly basis for wind farms reported by the IESO, and a linear regression was applied to produce lines of best fit. The equations for the lines of best fit and the values for the total calculated power production were then used to calculate the monthly adjusted power production for all wind farms in our dataset. This approach ensured that we maximized the accuracy of the predictions for each wind farm.
In 2020, the IESO reported production data for 37 wind farms that were included in our study, which represented 4225 MW, or 80%, of the total installed capacity. For 7 of these wind farms (545 MW of installed capacity), the slope of the line of best fit was more than 1 standard deviation from the average slope of all lines of best fit, and the measure–correlate–predict linear regressions were, therefore, considered to be invalid in these cases. Accordingly, the slope and intercept for the average line of best fit calculated from wind farms with valid measure–correlate–predict comparisons were used to calculate adjusted power production for the wind farms for which there were no IESO reports (n = 50 wind farms, representing 1060 MW) or that produced invalid measure–correlate–predict linear regressions. We assumed that use of the average line of best fit was appropriate to calculate the adjusted power production of the remaining wind farms, given that the IESO report included the majority of the wind capacity for the province in 2020. By employing the measure–correlate–predict approach, we maximized the available sample of wind farms for our analysis: n = 87. Measure–correlate–predict regression statistics are available online in the Supporting Information.
To estimate the power that would have been produced if turbine operations were curtailed according to OMNR [20], i.e., regulated power production, we used the wind speed downloaded from the Wind Atlas [31]. The regulated power production for a given wind farm was 0 MW during the 10-minute intervals when the wind speed was <5.5 m/s in the closest 2-km grid cell between 15 July and 30 September. As sunset and sunrise times vary with geography, we simplified the calculation of regulated power production for each wind farm by imposing a time of day curtailment period beginning at 6 pm on one day and ending on 6 am on the following day based on Eastern Daylight Time.
To estimate the financial loss that would have resulted from implementing operational curtailment, the difference in power production between the total adjusted and regulated power productions for each wind farm was calculated on an annual basis. The difference was then multiplied by the lower and upper limits of power-purchase agreement rates for Ontario wind farms, i.e., 115 and 150 CAD/MWh, respectively [37]. Wind farm operators individually negotiate a power-purchase agreement with the Province of Ontario, though the details of these agreements are often not publicly available. Accordingly, we calculated the minimum and maximum financial losses that could be incurred by individual wind farms, as well as by the wind energy industry in Ontario as a whole. Currency is reported in Canadian dollars, unless otherwise specified.
We used a generalized linear model with a normally distributed error structure to test for variations in power production losses due to operational curtailment among wind farms. The model included terms to represent manufacturer cut-in speed (m/s), average annual site wind speed (m/s), and average site wind speed (m/s) between 15 July and 30 September as predictor variables. We used the logarithmic transformation of power production loss per turbine as the response variable to improve model fit. Model fit was visually assessed by plotting residuals versus fitted values of the best fitting model. The significance of terms in the best fitting model was determined using an F test. All statistical analyses were conducted via R 4.2.2 [38].

3. Results

Financial and power production losses were calculated for 87 Ontario wind farms with 2618 turbines and a combined nameplate capacity of 5285.25 MW. The majority of wind farms are located in the southeastern portion of the province, with many sites situated near the shores of Lake Huron and Lake Erie, and as far north as Thunder Bay (Figure 1). Wind farms ranged in size from a single turbine producing <1 MW to 300 MW produced by 140 turbines. The average wind farm produced 60 MW and had an average of 30 turbines. Sixty-four wind farms had IEC class 2 turbines, 8 sites had IEC class 3 turbines, and there were 15 sites for which this information was not available. Average annual site wind speeds varied between 5.7 and 8.1 m/s. The majority of wind farms (78%) were situated in areas in which the average wind speed was between and 8 m/s.
Expected sources of loss reduced theoretical power production for each wind farm by 30–85%, with a median loss of 54%. After accounting for these expected losses, we estimated that 12.09 TWh would be produced annually by wind farms constructed and operating in Ontario as of 2020 if all turbines were operated according to the manufacturers’ specifications. Annual adjusted production would be reduced to 12.04 TWh/year if all wind farms implemented operational curtailment to mitigate for bat mortality, as described in OMNR [20]. This province-wide reduction is equivalent to a difference of 51.2 GWh, or 0.43%. The estimated financial losses are 6.79 ± 0.9 million CAD, compared to estimated earnings of 1.6 ± 0.21 billion CAD, with these figures based on a range of power-purchase agreements worth between 115 and 150 CAD/MWh.
For individual wind farms, implementing operational curtailment would result in a 0.17–1.06% (median 0.40%) loss in produced power. Financially, this loss in production is equivalent to a minimum annual loss of 345 CAD for a wind farm with 1 turbine at the minimum power-purchase agreement of 115 CAD/MWh and a maximum annual loss of 573,900 CAD for a wind farm with 87 turbines at the maximum power-purchase agreement of 150 CAD/MWh. The calculated percentage loss in produced power and the estimated financial losses for each wind farm are available online in the Supporting Information.
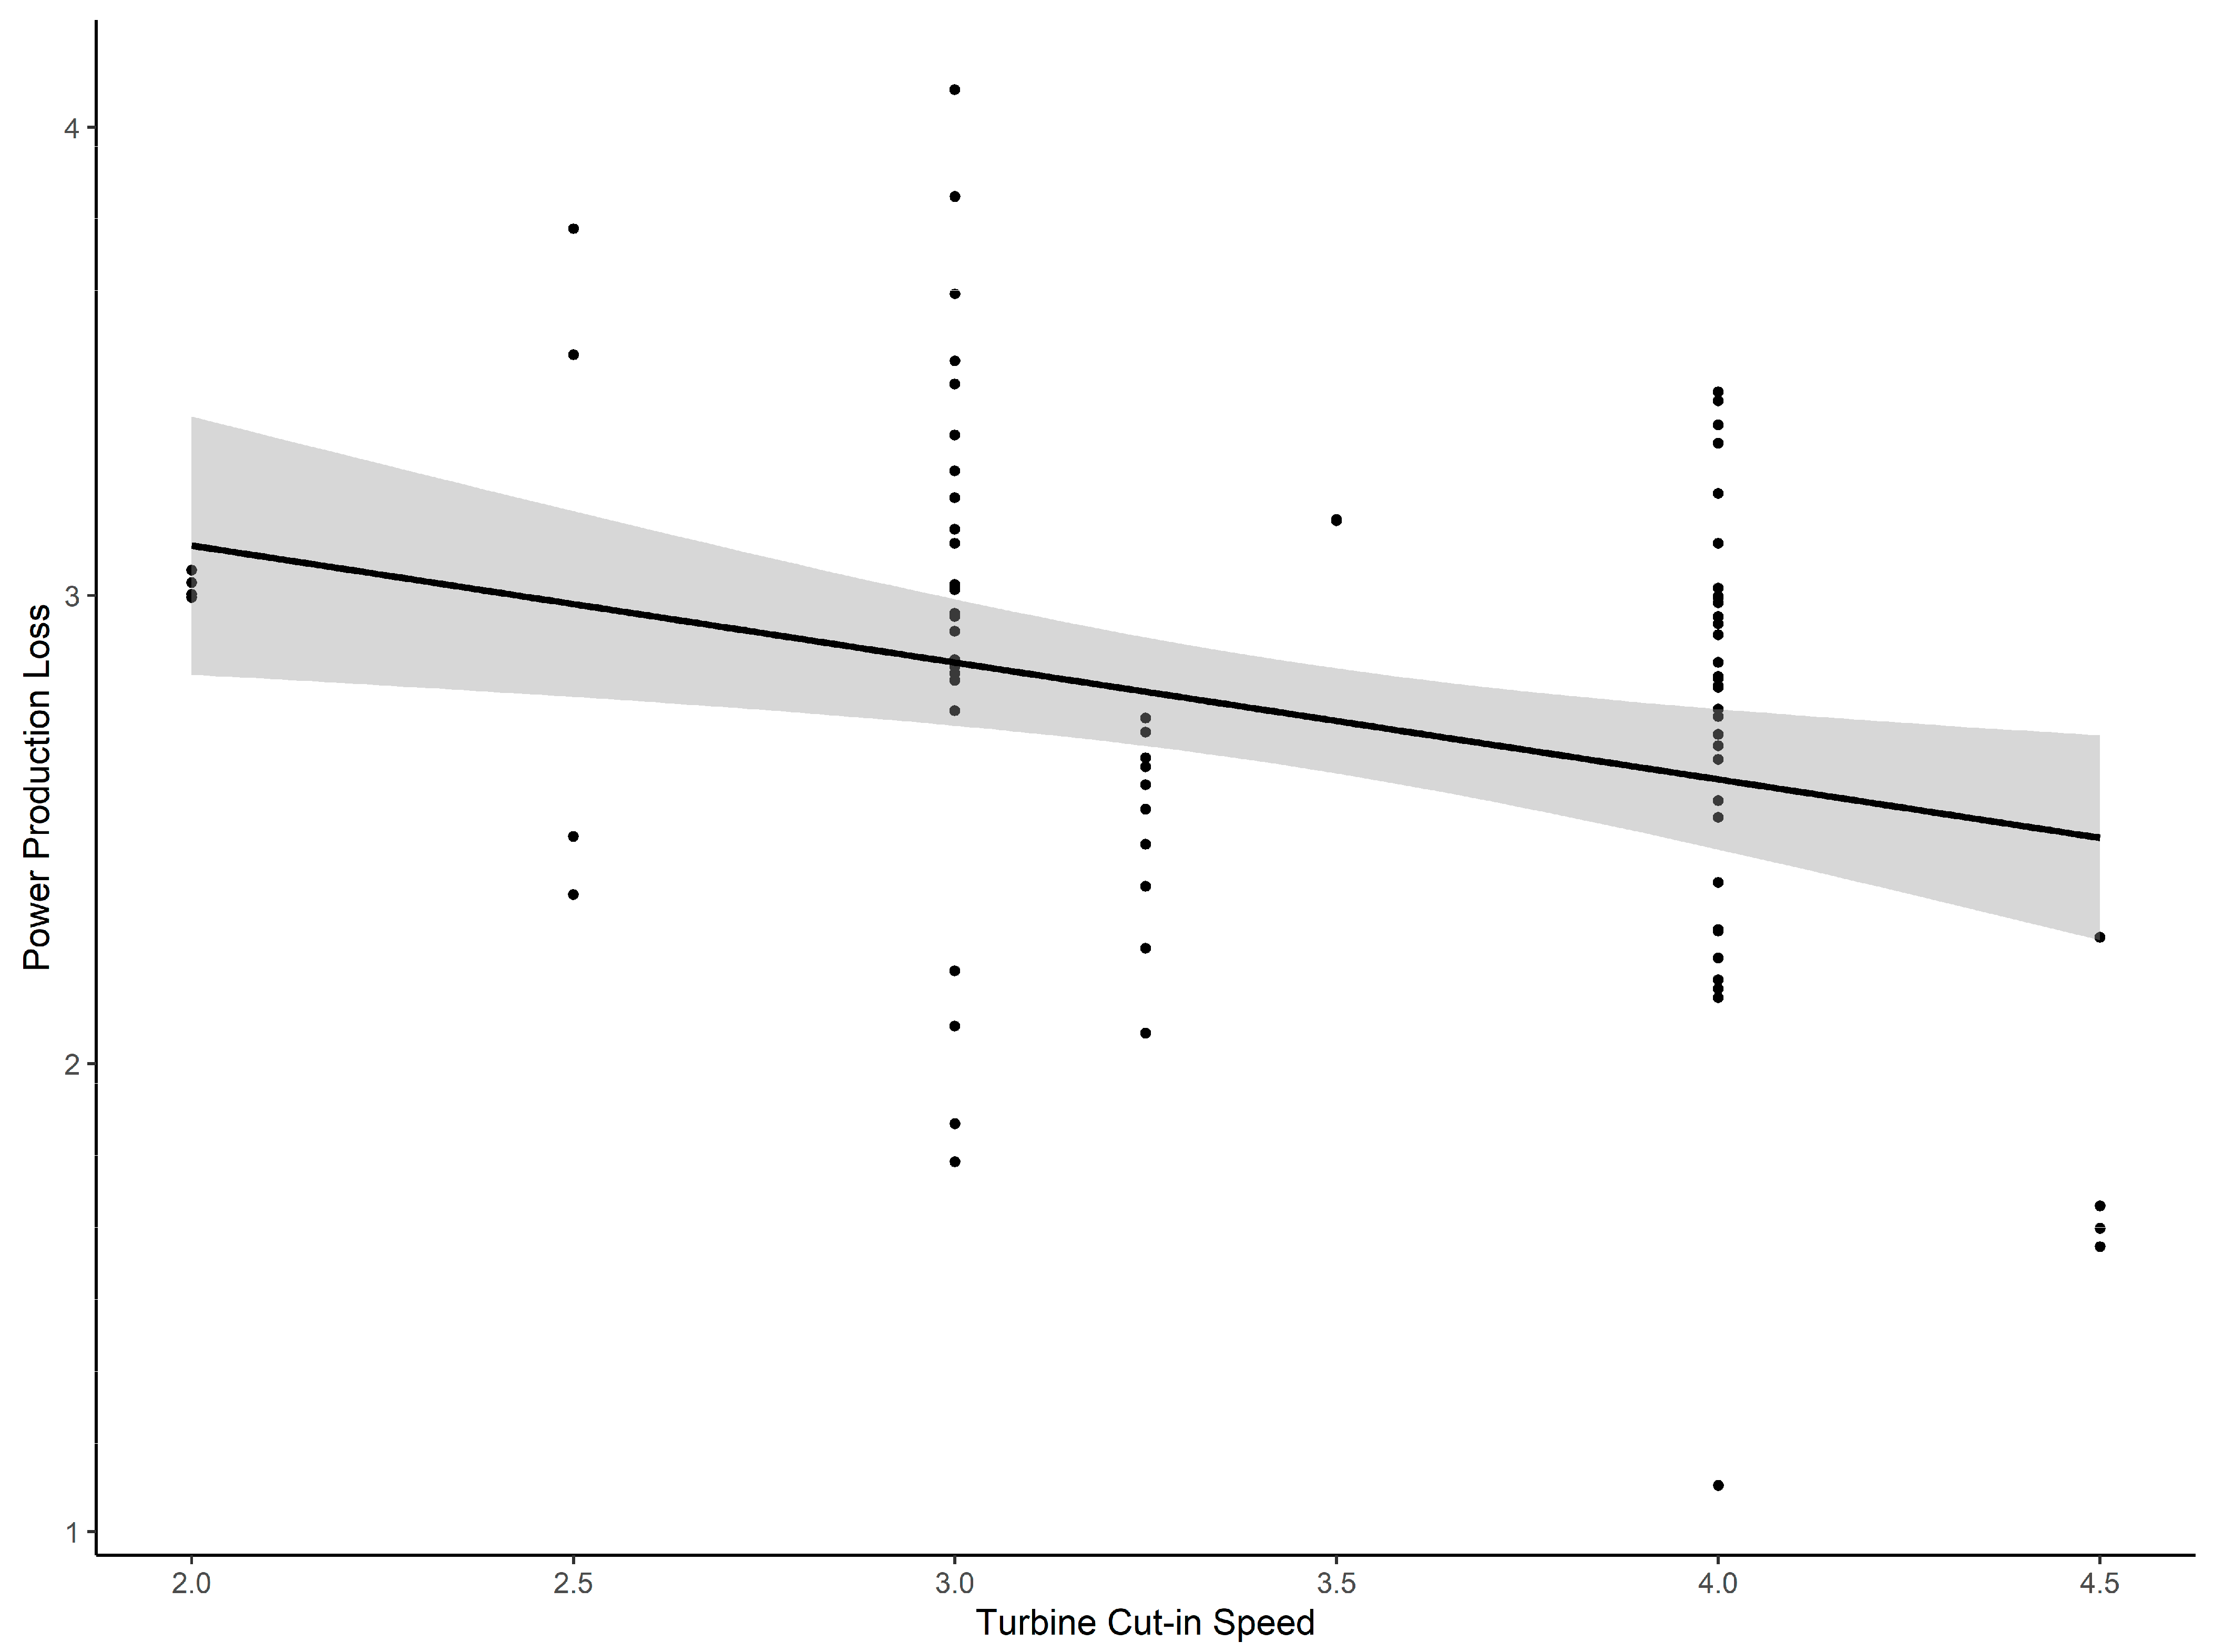
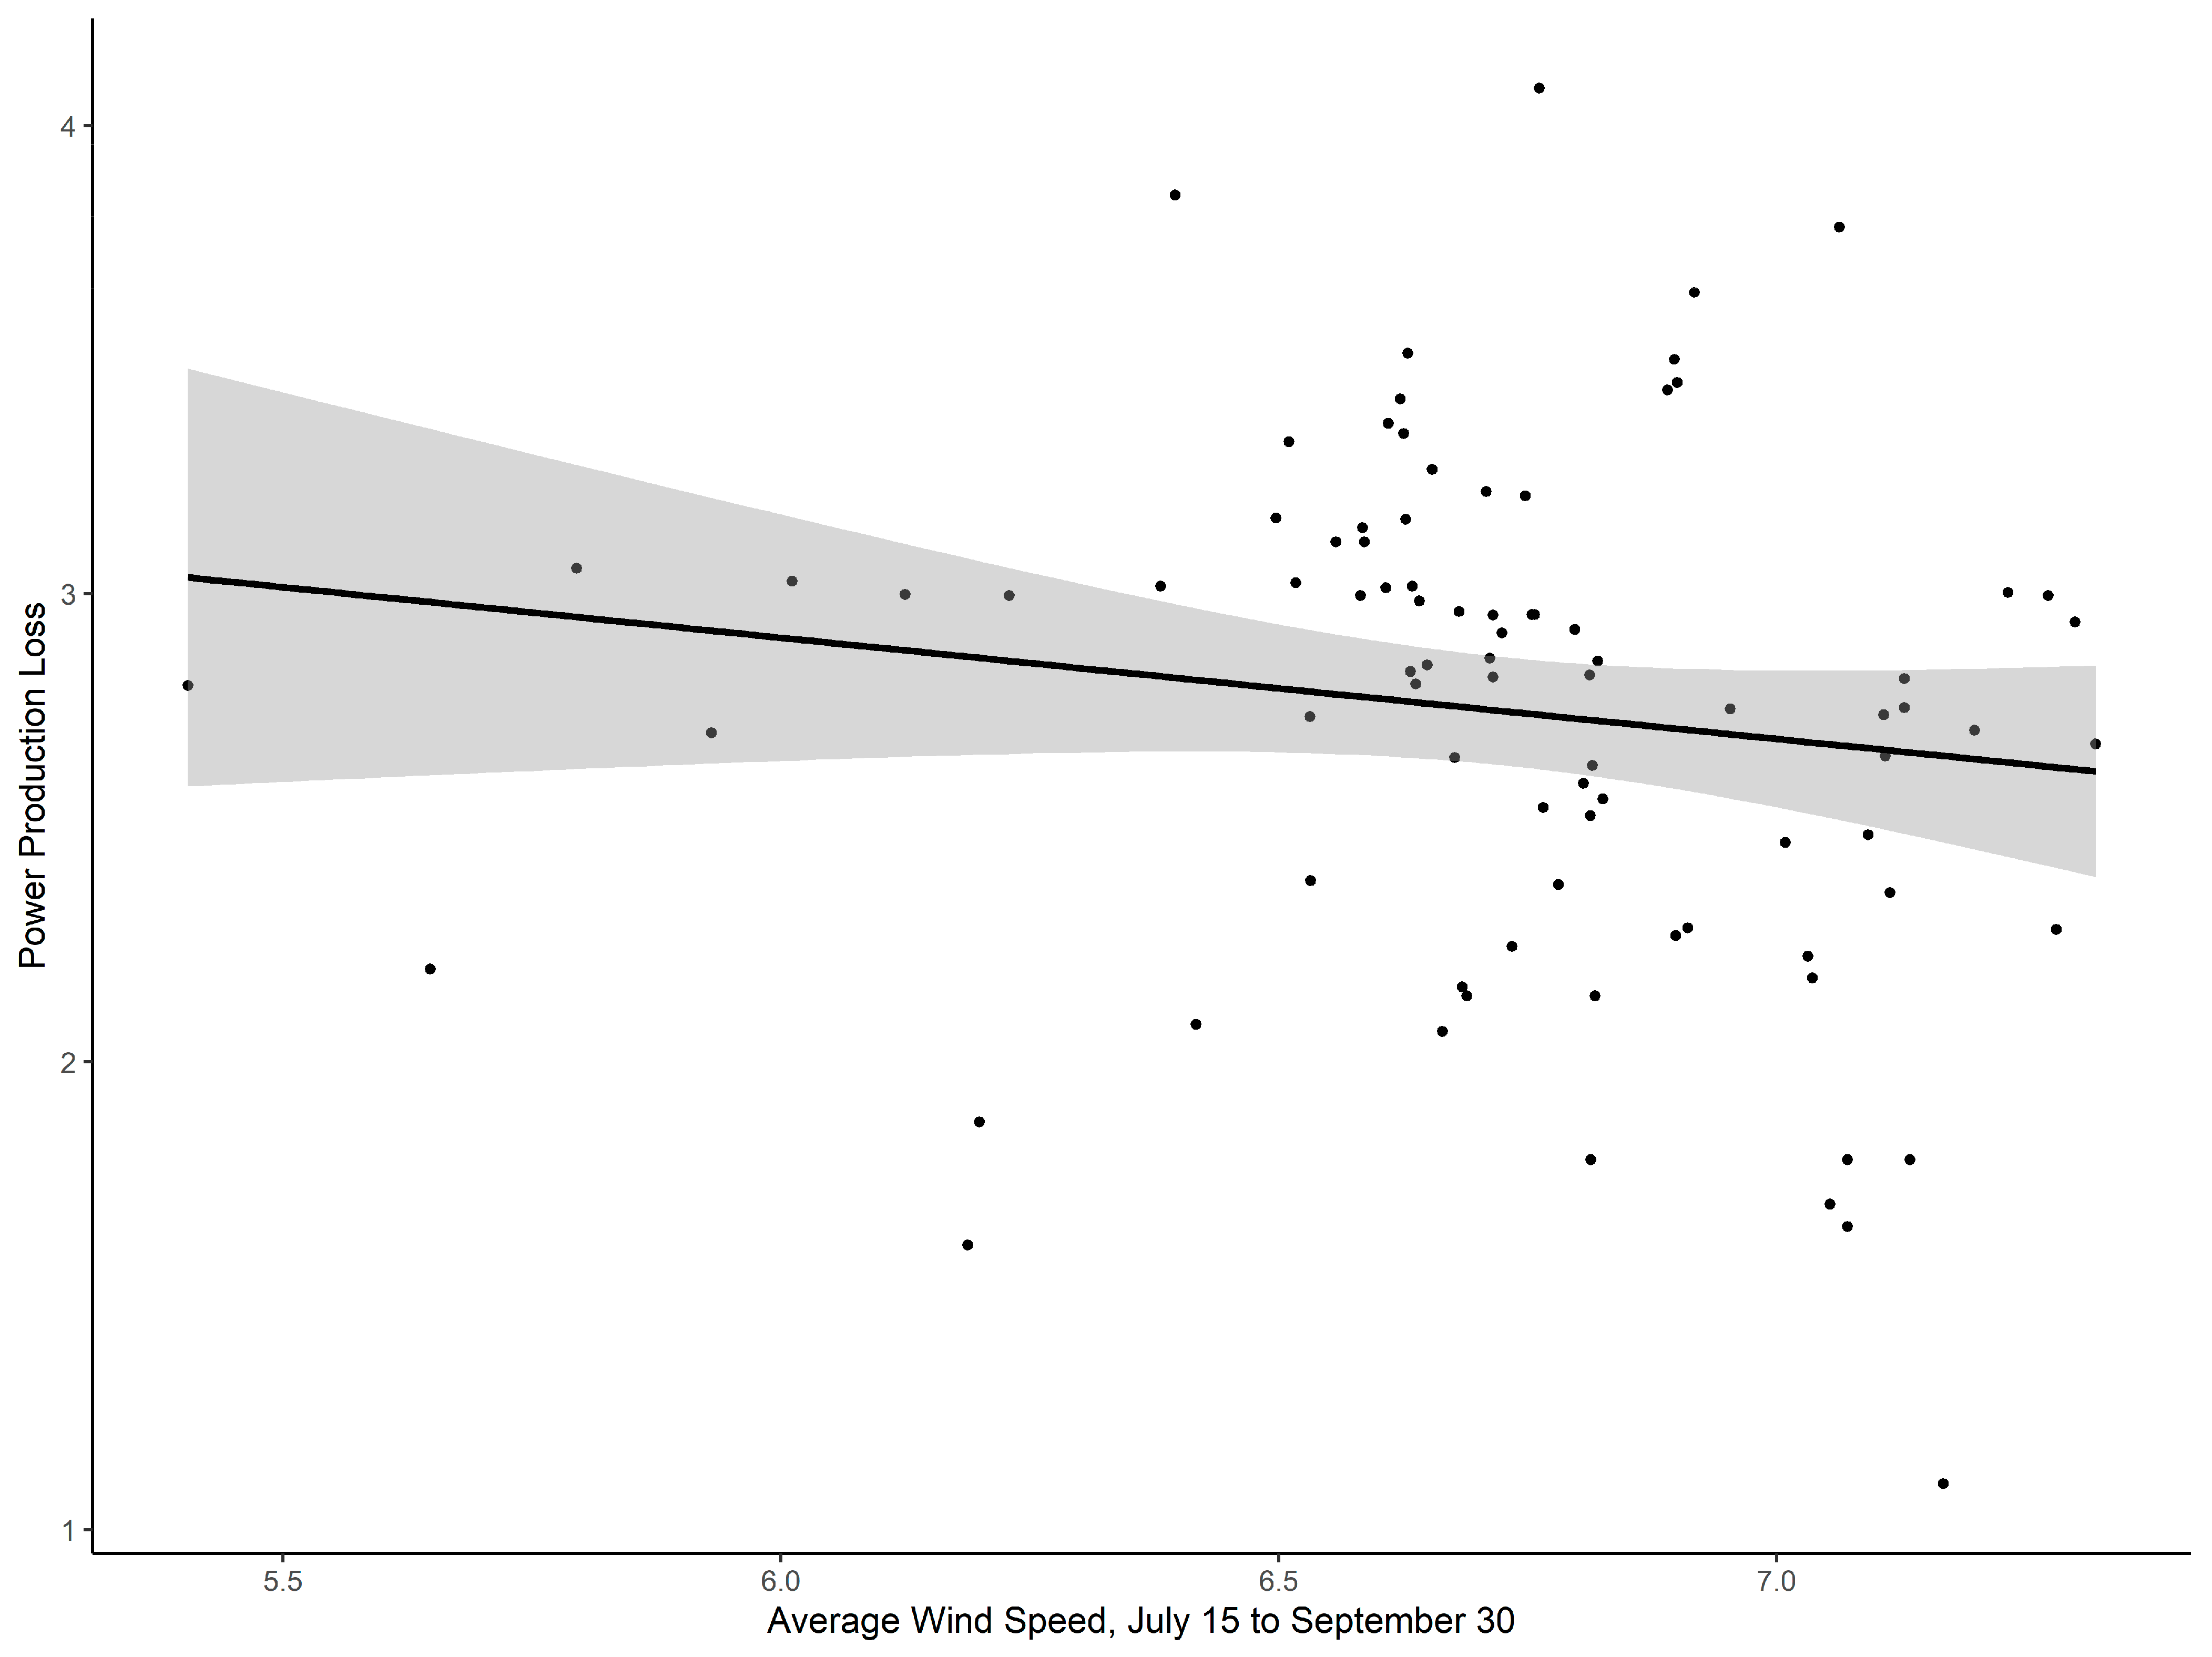
To explain the variation in the logarithmic transformation of lost power per turbine due to operational curtailment, there was a significant effect of cut-in wind speed (F = 8.39, p = <0.005) and average site wind speed between 15 July and 30 September (F = 6.44, p = 0.01), and no effect of average annual site wind speed (F = 0.34, p = 0.56). Loss tended to decrease as cut-in speed increased (Figure 2). Wind farms situated in areas with lower wind speeds between 15 July and 30 September were subjected to higher power production losses than those located in areas with higher wind speeds during the same period (Figure 3).

4. Discussion

To meet international commitments to achieve net-zero greenhouse gas emissions by 2050, Canada is continuing to expand its renewable energy resource sectors. Wind energy is cost effective to develop, and its production results in no greenhouse gas emissions once the supporting infrastructure is installed and the project is operational [4]. However, high mortality caused by rotating wind turbines poses a threat to the survival and recovery of endangered bat species [18] and may, likewise, threaten the viability of populations of migratory tree bat species [11,15]. Curtailing turbine operations is effective at reducing bat mortality risks [21,22,23,24,25], though the turbine down time required for mitigation results in profit losses for wind operators.
The financial impact of curtailing turbine operations to reduce bat mortality risks should be considered in the context of the value that bats provide to society as an ecosystem component. In the agricultural sector in North America, bats play an important role in the suppression of crop pests [39]. In fact, their contribution to pest insect management has an estimated value between 3.7 and 53 billion USD to the United States agriculture industry based on an assumed value of 74 USD/acre [40]. To illustrate this value, a single colony of 150 big brown bats (Eptesicus fuscus) in Indiana ate an estimated ~1.3 million pest insects per year [41], and similar pest insect consumption has been shown to alleviate the need to apply chemical pesticides at a cotton plantation in southwestern Texas [42,43]. As populations of some bat species have declined since the mid-2000s due to the effects of white-nose syndrome, wind energy, and other stressors, US agricultural producers’ yields were between 425 and 495 million USD per year less compared to the mid-2000s [44]. In comparison, our data suggest that profit losses for Ontario wind farms would be just 6.74 million CAD if all operators curtailed operations to benefit bat populations, while still producing 1.6 billion CAD in revenue.
Curtailing turbine operations to reduce bat mortality risk is one of several sources of production loss that also include turbine downtime for maintenance and environmental factors, such as icing, blade soiling, and lightning. Loss due to maintenance and environmental factors can reduce theoretical power output by at least 16% [42]. Wind farm operations are also curtailed by the IESO during periods of low demand, during which periods the generating capacity does not need to meet electricity demand beyond the baseload. Variable sources of energy in Ontario, such as wind and solar generators, were curtailed due to energy surplus by 17% in 2020 and 12% in 2021 [33]. Considering all sources of loss that contributed to the correction between theoretical power production and an adjusted power production, our results are in line with these reports. Furthermore, the estimated losses in power production due to bat mortality mitigation in our study were relatively low in comparison.
Newly developed technologies may reduce financial losses for wind operators while also reducing the observed bat mortality rate. For example, preliminary studies show that ultrasonic deterrents reduce mortality at wind farms for some migratory tree bat species [8,45,46,47]. However, the effectiveness varied widely among species [46,47] and even within species among years [45]. Deterrents have also been used to deter Natterer’s bat (Myotis nattereri) from roosting sites in historic churches in the United Kingdom [48] and tested in natural riparian habitats for Myotis spp. at short range with variable results [49,50]. If ultrasonic deterrents can be shown to produce a deterrence behavioral response for other species, such as the little brown myotis, in a wind farm setting, operators within the distribution of this species may be able to incorporate deterrents into their mitigation strategy to yield financial and conservation benefits.
An alternate approach to mitigation could rely on previously collected, site-specific ultrasonic acoustic or mortality data to illustrate the relationships between bat activity or mortality and weather variables, time of night, and time of year. This approach is similar in nature to the strategy described in OMNR (2011), in that a curtailment schedule would be defined and implemented for the duration of a wind project, which would be tailored to reflect the weather and bat activity or mortality patterns of the local site (e.g., [28]). The result should reduce bat mortality risks and increase power generation opportunities relative to a standard curtailment approach that does not consider site specific factors [27].
Other researchers proposed the use of ‘smart curtailment’, an approach for which near real-time curtailment decisions are made based on current data regarding bat presence and weather conditions in a project area [29]. When employing smart curtailment, wind operators install ultrasonic automatic recording devices to collect bat echolocation data from sunset to sunrise. When bats are detected and the wind speed is below a certain defined threshold, turbine operations are curtailed. Initial analyses show that this approach reduced mortality for all bat species by 84.5% and reduced curtailment time by 48%, compared to normal turbine operations, under a standard curtailment rule [29]. Curtailing turbine operations based on real-time bat activity requires specialized equipment, but limits project down time to only those periods in which bats are at a higher risk of mortality.
We found that Ontario wind farm operators may be subjected to lower levels of profit loss when curtailing turbine operations to minimize mortality risks for bats than are reported for other wind farms, although the curtailment regimes vary considerably among studies. In the smart curtailment approach described by Hayes et al. [29], the authors estimated that curtailing turbine operations when wind speeds were <8.0 m/s and bats were present would reduce annual revenue by ~3.2% when comparing the amount of power produced between treatment and control turbines. A study conducted in Germany modelled bat mortality risk and the subsequent costs of curtailing operations to maintain mortality levels to <2 bats/turbine/year [51]. This approach resulted in a 1.4% loss in annual revenue and was found to be less expensive than operational mitigation based solely on wind speed (1.8% loss; [51]). At a Swiss wind farm that implemented operational curtailment between mid-March and the end of October during night-time periods when wind speeds were <5.8 m/s to reduce collision risks by 95%, there was a 3.2% reduction in annual power production [52]. A key difference between the European studies and our study is that those operators were not only required to implement operational curtailment, but were required to do so in a way that achieved a specific conservation target.
Our results emphasize the importance of selecting locations for wind farm construction and installing turbines with design considerations that maximize opportunities for wind-power production. Our analyses suggest that wind developers should consider finer-scale, site-specific weather patterns, given that wind farms in areas with wind speeds below the 5.5 m/s threshold for operational curtailment between 15 July and 30 September were subjected to higher production losses than those in areas with higher wind speeds during the same period. Wind farms sited in locations with higher wind speed potential values would concurrently maximize wind energy production potential and be required to curtail production less often according to the OMNR [20] guidelines. In areas with lower average annual wind speeds, operators should install turbines designed to carry out cut-in at speeds appropriate to maximizing wind power generation opportunities. Such siting considerations would potentially result in a positive conservation outcome for bats, maximize earning potential for operators, and contribute more renewable energy to the grid for consumers.

5. Limitations

We acknowledge that our study had limitations. Firstly, we were compelled to calculate theoretical power production based on manufacturer power curves, which assume 100% availability and do not adjust for sources of expected loss. While the IESO annually reports the actual power production of wind farms in Canada, the 2020 IESO report included data for just 37 farms for which comparisons could be made to Ontario wind farms represented on the Canadian Wind Turbine database [30]. Since individual wind farms in Canada do not proactively publish these data in a public forum, we opted to increase our sample size and incorporate wind farms over a larger geographic range by calculating theoretical power production and adjusting for expected losses using the measure–correlate–predict linear regression method [35,36]. Secondly, power-purchase agreements are not often publicly available. Accordingly, we based our calculations of financial losses on a pricing range of 115–150 CAD/MWh, which represents the lower and upper limits for Ontario wind farms [37]. It is possible that individual wind farms may be subjected to revenue losses beyond our reported range based on their individual purchase agreements with the province of Ontario and the regulatory requirement to mitigate for bat mortality. Thirdly, we used wind speed data from the Wind Atlas database [31]. While these data are modelled based on real data collected between 2008 and 2010, they may not have accurately represented the 2020 wind conditions. The Environment and Climate Change Canada weather archive [53] includes wind speed data recorded at regular intervals for many locations in Ontario throughout 2020, though not with sufficient resolution to represent wind conditions at every wind farm location cited in our study. Conversely, weather data collected using meteorological stations situated at individual wind farms would provide accurate, site-specific weather conditions on which to base calculations of power production, though these data are not available to the public. Finally, our study assumed that turbine operations were curtailed directly according to the OMNR [20] guidance, and did not account for cases in which wind operators employ a minimum curtailment period (e.g., 30 min) to mitigate mechanical or electrical concerns related to rapid starting or stopping (as in [29]). Similar to other modelling efforts (e.g., [51]), our study determined whether a given wind farm would curtail in 10-minute intervals, which reflected the data available from the Wind Atlas.

6. Conclusions and Suggestion for Future Studies

Our results suggest that implementing operational curtailment to mitigate bat mortality at Ontario wind farms may represent a small cost to the industry relative to the conservation benefits. This result should be verified using data collected by wind industry developers, including site-specific meteorological data, negotiated power-purchase agreement pricing, and real power production data stored by site Supervisory Control and Data Acquisition (SCADA) systems. Additional studies should consider mechanical and electrical concerns associated with rapidly starting and stopping wind turbines, according to wind farm standard operating procedures and best practices from the appropriate turbine manufacturer.

Supplementary Materials

The following supporting information can be downloaded at: https://www.mdpi.com/article/10.3390/wind3030017/s1, Table S1: Measure-Correlate-Predict Stats; Table S2: Financial and power losses.

Author Contributions

J.R.Z. and R.J.K. conceived the project; G.H.T. and C.W. compiled the data sources; G.H.T. calculated measure–correlate–predict regressions, theoretical and regulated power production, and lost revenue due to mitigation; B.G.T. conducted the statistical data analysis, produced the figures, and wrote the manuscript. All authors provided editorial input. All authors have read and agreed to the published version of the manuscript.

Funding

This research received no external funding.

Institutional Review Board Statement

Not applicable.

Informed Consent Statement

Not applicable.

Data Availability Statement

Data sets utilized for this research include Environment and Climate Change Canada historical grid modeled Wind Atlas data (Environment and Climate Change Canada, 2016) available at http://www.windatlas.ca/series/index-en.php, accessed on 15 November 2021. Independent Electricity System Operator power production data (IESO, 2020) available at https://www.ieso.ca/en/Power-Data/Data-Directory, accessed on 15 November 2021 and Natural Resources Canada Canadian Wind Turbine Database data (Natural Resources Canada, 2021) available at: https://open.canada.ca/data/en/dataset/79fdad93-9025-49ad-ba16-c26d718cc070, accessed on 15 November 2021. Supporting Data reported results are available online in Supplementary Materials.

Acknowledgments

Kai Tang contributed to the compilation of meteorological data. This work was supported by Environment and Climate Change Canada and Natural Resources Canada.

Conflicts of Interest

The authors declare no conflict of interest.

References

  1. Natural Resources Canada. About Renewable Energy. 2017. Available online: https://www.nrcan.gc.ca/our-natural-resources/energy-sources-distribution/renewable-energy/about-renewable-energy/7295 (accessed on 1 December 2022).
  2. Canada Energy Regulator. Canada’s Energy Future: Key Findings. 2022. Available online: https://www.cer-rec.gc.ca/en/data-analysis/canada-energy-future/2021/key-findings.html (accessed on 1 December 2022).
  3. International Renewable Energy Agency. Renewable Capacity Statistics 2021; International Renewable Energy Agency: Abu Dhabi, United Arab Emirates, 2021. [Google Scholar]
  4. Canadian Renewable Energy Association. By the Numbers. Available online: https://renewablesassociation.ca/by-the-numbers/ (accessed on 1 June 2023).
  5. Statistics Canada. Electric Power Generation, Monthly Generation by Type of Electricity. 2022. Available online: https://www150.statcan.gc.ca/t1/tbl1/en/tv.action?pid=2510001501&pickMembers%5B0%5D=1.1&pickMembers%5B1%5D=2.1&cubeTimeFrame.startMonth=01&cubeTimeFrame.startYear=2021&cubeTimeFrame.endMonth=12&cubeTimeFrame.endYear=2021&referencePeriods=20210101%2C20211 (accessed on 14 December 2022).
  6. Cryan, P.M. Wind turbines as landscape impediments to the migratory connectivity of bats. Environ. Law 2011, 41, 355–370. [Google Scholar]
  7. O’Shea, T.J.; Cryan, P.M.; Hayman, D.T.S.; Plowright, R.K.; Streicker, D.G. Multiple mortality events in bats: A global review. Mammal Rev. 2016, 46, 175–190. [Google Scholar] [CrossRef] [PubMed] [Green Version]
  8. Arnett, E.B.; Baerwald, E.F. Impacts of wind energy development on bats: Implications for conservation. In Bat Evolution, Ecology, and Conservation; Adams, R.A., Peterson, S.C., Eds.; Springer Science Press: New York, NY, USA, 2013. [Google Scholar]
  9. Hayes, M.A. Bats killed in large numbers at United States wind energy facilities. BioScience 2013, 63, 975–979. [Google Scholar]
  10. Zimmerling, J.R.; Francis, C.M. Bat mortality due to wind turbines in Canada. J. Wildl. Manag. 2016, 80, 1360–1369. [Google Scholar] [CrossRef]
  11. Frick, W.F.; Baerwald, E.F.; Pollock, J.F.; Barclay, R.M.; Szymanski, J.A.; Weller, T.J.; Russell, A.L.; Loeb, S.C.; Medellin, R.A.; McGuire, L.P. Fatalities at wind turbines may threaten population viability of a migratory bat. Biol. Conserv. 2017, 209, 172–177. [Google Scholar] [CrossRef]
  12. Hammerson, G.A.; Kling, K.; Harkness, M.; Ormes, M.; Young, B.E. Strong geographic and temporal patterns in conservation status of North American bats. Biol. Conserv. 2017, 212, 144–152. [Google Scholar] [CrossRef]
  13. Davy, C.M.; Squires, K.; Zimmerling, J.R. Estimation of spatiotemporal trends in bats abundance from mortality data collected at wind turbines. Conserv. Biol. 2020, 35, 227–238. [Google Scholar] [CrossRef]
  14. Friedenberg, N.A.; Frick, W.F. Assessing fatality minimization for hoary bats amid continued wind energy development. Biol. Conserv. 2021, 262, 109309. [Google Scholar] [CrossRef]
  15. Committee on the Status of Endangered Wildlife in Canada. Seeing Conservation Solutions for Unseen Species. Available online: https://www.cosewic.ca/index.php/en-ca/news-and-events/press-release-may-2023.html (accessed on 1 June 2023).
  16. Johnson, G.D. A review of bat mortality at wind-energy developments in the United States. Bat Res. News 2005, 46, 45–49. [Google Scholar]
  17. Arnett, E.B.; Brown, K.; Erickson, W.P.; Fiedler, J.K.; Hamilton, B.L.; Henry, T.L.; Jain, A.; Johnson, G.D.; Kerns, J.; Koford, R.R.; et al. Patterns of fatality of bats at wind energy facilities in North America. J. Wildl. Manag. 2008, 72, 61–78. [Google Scholar] [CrossRef]
  18. Environment and Climate Change Canada. Recovery Strategy for the Little Brown Myotis (Myotis lucifugus), the Northern Myotis (Myotis septentrionalis), and the Tri-Colored Bat (Perimyotis subflavus) in Canada; Species at Risk Act Recovery Strategy Series; Environment and Climate Change Canada: Ottawa, ON, Canada, 2018.
  19. Arnett, E.B.; Johnson, G.D.; Erickson, W.P.; Hein, C.D. A Synthesis of Operational Mitigation Studies to Reduce Bat Fatalities at Wind Energy Facilities in North America; National Renewable Energy Laboratory: Golden, CO, USA, 2013.
  20. Ontario Ministry of Natural Resources [OMNR]. Bat and Bat Habitat Guidelines: Guidelines for Wind Power Projects, 2nd ed.; Ontario Ministry of Natural Resources and Forestry: Peterborough, ON, Canada, 2011.
  21. Baerwald, E.F.; Edworthy, J.; Holder, M.; Barclay, R.M.R. A large-scale mitigation experiment to reduce bat fatalities at wind energy facilities. J. Wildl. Manag. 2009, 73, 1077–1081. [Google Scholar] [CrossRef]
  22. Arnett, E.B.; Huso, M.M.P.; Schirmacher, M.R.; Hayes, J.P. Altering turbine speed reduces bat mortality at wind-energy facilities. Front. Ecol. Environ. 2011, 9, 209–214. [Google Scholar] [CrossRef] [Green Version]
  23. Arnett, E.B.; May, R.F. Mitigating wind energy impacts on wildlife: Approaches for multiple taxa. Hum.-Wildl. Interact. 2016, 10, 28–41. [Google Scholar]
  24. Martin, C.M.; Arnett, E.B.; Stevens, R.D.; Wallace, M.C. Reducing bat fatalities at wind facilities while improving the economic efficiency of operational mitigation. J. Mammal. 2017, 98, 378–385. [Google Scholar] [CrossRef]
  25. Adams, E.M.; Gulka, J.; Williams, K.A. A review of the effectiveness of operational curtailment for reducing bat fatalities at terrestrial wind farms in North America. PLoS ONE 2021, 16, e0256382. [Google Scholar] [CrossRef] [PubMed]
  26. Arnett, E.B.; Hein, C.D.; Schirmacher, M.R.; Huso, M.M.P.; Szewczak, J.M. Evaluating the effectiveness of an ultrasonic acoustic deterrent for reducing bat fatalities at wind turbines. PLoS ONE 2013, 8, e65794. [Google Scholar] [CrossRef]
  27. Squires, K.A.; Thurber, B.G.; Zimmerling, J.R.; Francis, C.M. Timing and weather offer alternative mitigation strategies for lowering bat mortality at wind energy facilities in Ontario. Animals 2021, 11, 3503. [Google Scholar] [CrossRef]
  28. Rnjak, D.; Janeš, M.; Križan, J.; Antonić, O. Reducing bat mortality at wind farms using site-specific mitigation measures: A case study in the Mediterranean region, Croatia. Mammalia 2022, 10, 1515. [Google Scholar] [CrossRef]
  29. Hayes, M.A.; Hooton, L.A.; Gilland, K.L.; Grandgent, C.; Smith, R.L.; Lindsay, S.R.; Collins, J.D.; Schumacher, S.M.; Rabie, P.A.; Gruver, J.C.; et al. A smart curtailment approach for reducing bat fatalities and curtailment time at wind energy facilities. Ecol. Appl. 2019, 29, e01881. [Google Scholar] [CrossRef]
  30. Natural Resources Canada. Canadian Wind Turbine Database. 2021. Available online: https://open.canada.ca/data/en/dataset/79fdad93-9025-49ad-ba16-c26d718cc070 (accessed on 1 December 2022).
  31. Environment and Climate Change Canada. Modelled Historical Data. 2016. Available online: http://www.windatlas.ca/series/index-en.php (accessed on 1 December 2022).
  32. Clifton, A.; Smith, A.; Fields, M. Wind Plant Preconstruction Energy Estimates: Current Practice and Opportunities; National Renewable Energy Laboratory: Golden, CO, USA, 2016.
  33. Independent Electricity System Operator [IESO]. Year-End Data 2021. 2023. Available online: https://www.ieso.ca/en/Corporate-IESO/Media/Year-End-Data/2021 (accessed on 19 June 2023).
  34. IESO. Feed-in Tariff Program. 2020. Available online: https://www.ieso.ca/en/Power-Data/Data-Directory (accessed on 1 December 2022).
  35. Rogers, A.L.; Rogers, J.W.; Manwell, J.F. Comparison of the performance of four measure–correlate–predict algorithms. J. Wind Eng. Ind. Aerodyn. 2005, 93, 243–264. [Google Scholar] [CrossRef]
  36. Carta, J.A.; Velázquez, S.; Cabrera, P. A review of measure-correlate-predict (MCP) methods used to estimate long-term wind characteristics at a target site. Renew. Sustain. Energy Rev. 2013, 27, 362–400. [Google Scholar] [CrossRef]
  37. IESO. Feed-in Tariff Program. 2022. Available online: https://www.ieso.ca/en/Sector-Participants/Feed-in-Tariff-Program/FIT-Archive (accessed on 1 December 2022).
  38. R Core Development Team. R: A Language and Environment for Statistical Computing; R Foundation for Statistical Computing: Vienna, Austria, 2022; Available online: https://www.R-project.org/ (accessed on 1 May 2023).
  39. Kunz, T.H.; Braun de Torrez, E.; Bauer, D.; Lobova, T.; Fleming, T.H. Ecosystem services provided by bats. Ann. N. Y. Acad. Sci. 2011, 1223, 1–38. [Google Scholar] [CrossRef] [PubMed]
  40. Boyles, J.G.; Cryan, P.M.; McCracken, G.F.; Kunz, T.H. Economic Importance of Bats in Agriculture. Science 2011, 332, 41–42. [Google Scholar] [CrossRef] [PubMed]
  41. Whitaker, J.O., Jr. Food of the Big Brown Bat Eptesicus fuscus from maternity colonies in Indiana and Illinois. Am. Midl. Nat. 1995, 134, 346–360. [Google Scholar] [CrossRef]
  42. Cleveland, C.J.; Betke, M.; Federico, P.; Frank, J.D.; Hallam, T.G.; Horn, J.; López, J.D., Jr.; McCracken, G.F.; Medellín, R.A.; Moreno-Valdez, A.; et al. Economic value of the pest control service provided by Brazilian free-tailed bats in south-central Texas. Front. Ecol. Environ. 2006, 4, 238–243. [Google Scholar] [CrossRef]
  43. Federico, P.; Hallam, T.G.; McCracken, G.F.; Purucker, S.T.; Grant, W.E.; Correa-Sandoval, A.N.; Westbrook, J.K.; Medellín, R.A.; Cleveland, C.J.; Sansone, C.G.; et al. Brazilian Free-tailed Bats as insect pest regulators in transgenic and conventional cotton crops. Ecol. Appl. 2008, 18, 826–837. [Google Scholar] [CrossRef]
  44. Manning, D.T.; Ando, A. Ecosystem services and land rental markets: Producer costs of bat population crashes. J. Assoc. Environ. Resour. Econ. 2022, 9, 1235–1277. [Google Scholar] [CrossRef]
  45. Romano, W.B.; Skalski, J.R.; Townsend, R.L.; Kinzie, K.W.; Coppinger, K.D.; Miller, M.F. Evaluation of an acoustic deterrent to reduce bat mortalities at an Illinois wind farm. Wildl. Soc. Bull. 2019, 43, 608–618. [Google Scholar] [CrossRef] [Green Version]
  46. Weaver, S.P.; Hein, C.D.; Simpson, T.R.; Evans, J.W.; Castro-Arellano, I. Ultrasonic acoustic deterrents significantly reduce bat fatalities at wind turbines. Glob. Ecol. Conserv. 2020, 24, e01099. [Google Scholar] [CrossRef]
  47. Good, R.E.; Iskali, G.; Lombardi, J.; McDonald, T.; Dubridge, K.; Azeka, M.; Tredennick, A. Curtailment and acoustic deterrents reduce bat mortality at wind farms. J. Wildl. Manag. 2022, 86, e22244. [Google Scholar] [CrossRef]
  48. Zeale, M.R.K.; Bennitt, E.; Newson, S.E.; Packman, C.; Browne, W.J.; Harris, S.; Jones, G.; Stone, E. Correction: Mitigating the impact of bats in historic churches: The response of Natterer’s Bats Myotis nattereri to artificial roosts and deterrence. PLoS ONE 2016, 11, e0152531. [Google Scholar] [CrossRef] [PubMed] [Green Version]
  49. Gilmour, L.R.V.; Holderied, M.W.; Pickering, S.P.C.; Jones, G. Comparing acoustic and radar deterrence methods as mitigation measures to reduce human-bat impacts and conservation conflicts. PLoS ONE 2020, 15, e0228668. [Google Scholar] [CrossRef] [PubMed] [Green Version]
  50. Gilmour, L.R.V.; Holderied, M.W.; Pickering, S.P.C.; Jones, G. Acoustic deterrents influence foraging activity, flight and echolocation behaviour of free-flying bats. J. Exp. Biol. 2021, 224, jeb242715. [Google Scholar] [CrossRef] [PubMed]
  51. Behr, O.; Brinkmann, R.; Hochradel, K.; Mages, J.; Korner-Nievergelt, F.; Niermann, I.; Reich, M.; Simon, R.; Weber, N.; Nagy, M. Mitigating Bat Mortality with Turbine-Specific Curtailment Algorithms: A Model Based Approach. In Wind Energy and Wildlife Interactions; Köppel, J., Ed.; Springer: Cham, Switzerland, 2017. [Google Scholar]
  52. Mehmet, H.; Aschwanden, J.; Bontadina, F.; de la Puente Nilsson, M. Investigation of the Effectiveness of Bat and Bird Detection of the DTBat and DTBird Systems at Calandawind Turbine; Swiss Federal Office of Energy SFOE: Muhlestrasse, Germany, 2015. [Google Scholar]
  53. Environment and Climate Change Canada. Historical Data. 2022. Available online: https://climate.weather.gc.ca/historical_data/search_historic_data_e.html (accessed on 1 December 2022).
Figure 1. Map of all wind farms that were constructed and operating in Ontario as of 1 January 2020. The wind farms are primarily distributed throughout the Great Lakes region. The size of the points indicates the percent loss in power production due to operational curtailment required to mitigate bat mortality.
Wind 03 00017 g001
Figure 2. Logarithmic transformed power production loss due to the implementation of operational curtailment to mitigate bat mortality, adjusted based on the number of turbines at n = 87 wind farms that were operational in Ontario, Canada in 2020 versus turbine manufacturer cut-in speeds (m/s), including a line of best fit. Power production loss for each wind farm is represented with a point and the shaded area represents a 95% standard error.
Wind 03 00017 g002
Figure 3. Logarithmic transformed power production loss due to the implementation of operational curtailment to mitigate bat mortality, adjusted based on the number of turbines at n = 87 wind farms that were operational in Ontario, Canada in 2020 versus the average wind speed (m/s) between 15 July and 30 September, including a line of best fit. Power production loss for each wind farm is represented with a point and the shaded area represents a 95% standard error.
Wind 03 00017 g003
Disclaimer/Publisher’s Note: The statements, opinions and data contained in all publications are solely those of the individual author(s) and contributor(s) and not of MDPI and/or the editor(s). MDPI and/or the editor(s) disclaim responsibility for any injury to people or property resulting from any ideas, methods, instructions or products referred to in the content.