

Clinical Applicability of Electrical Impedance Tomography in Patient-Tailored Ventilation: A Narrative Review

 ,
,  ,
,
Abstract
1. Introduction
2. Clinical Applications
2.1. Positive End-Expiratory Pressure and Tidal Volume Settings
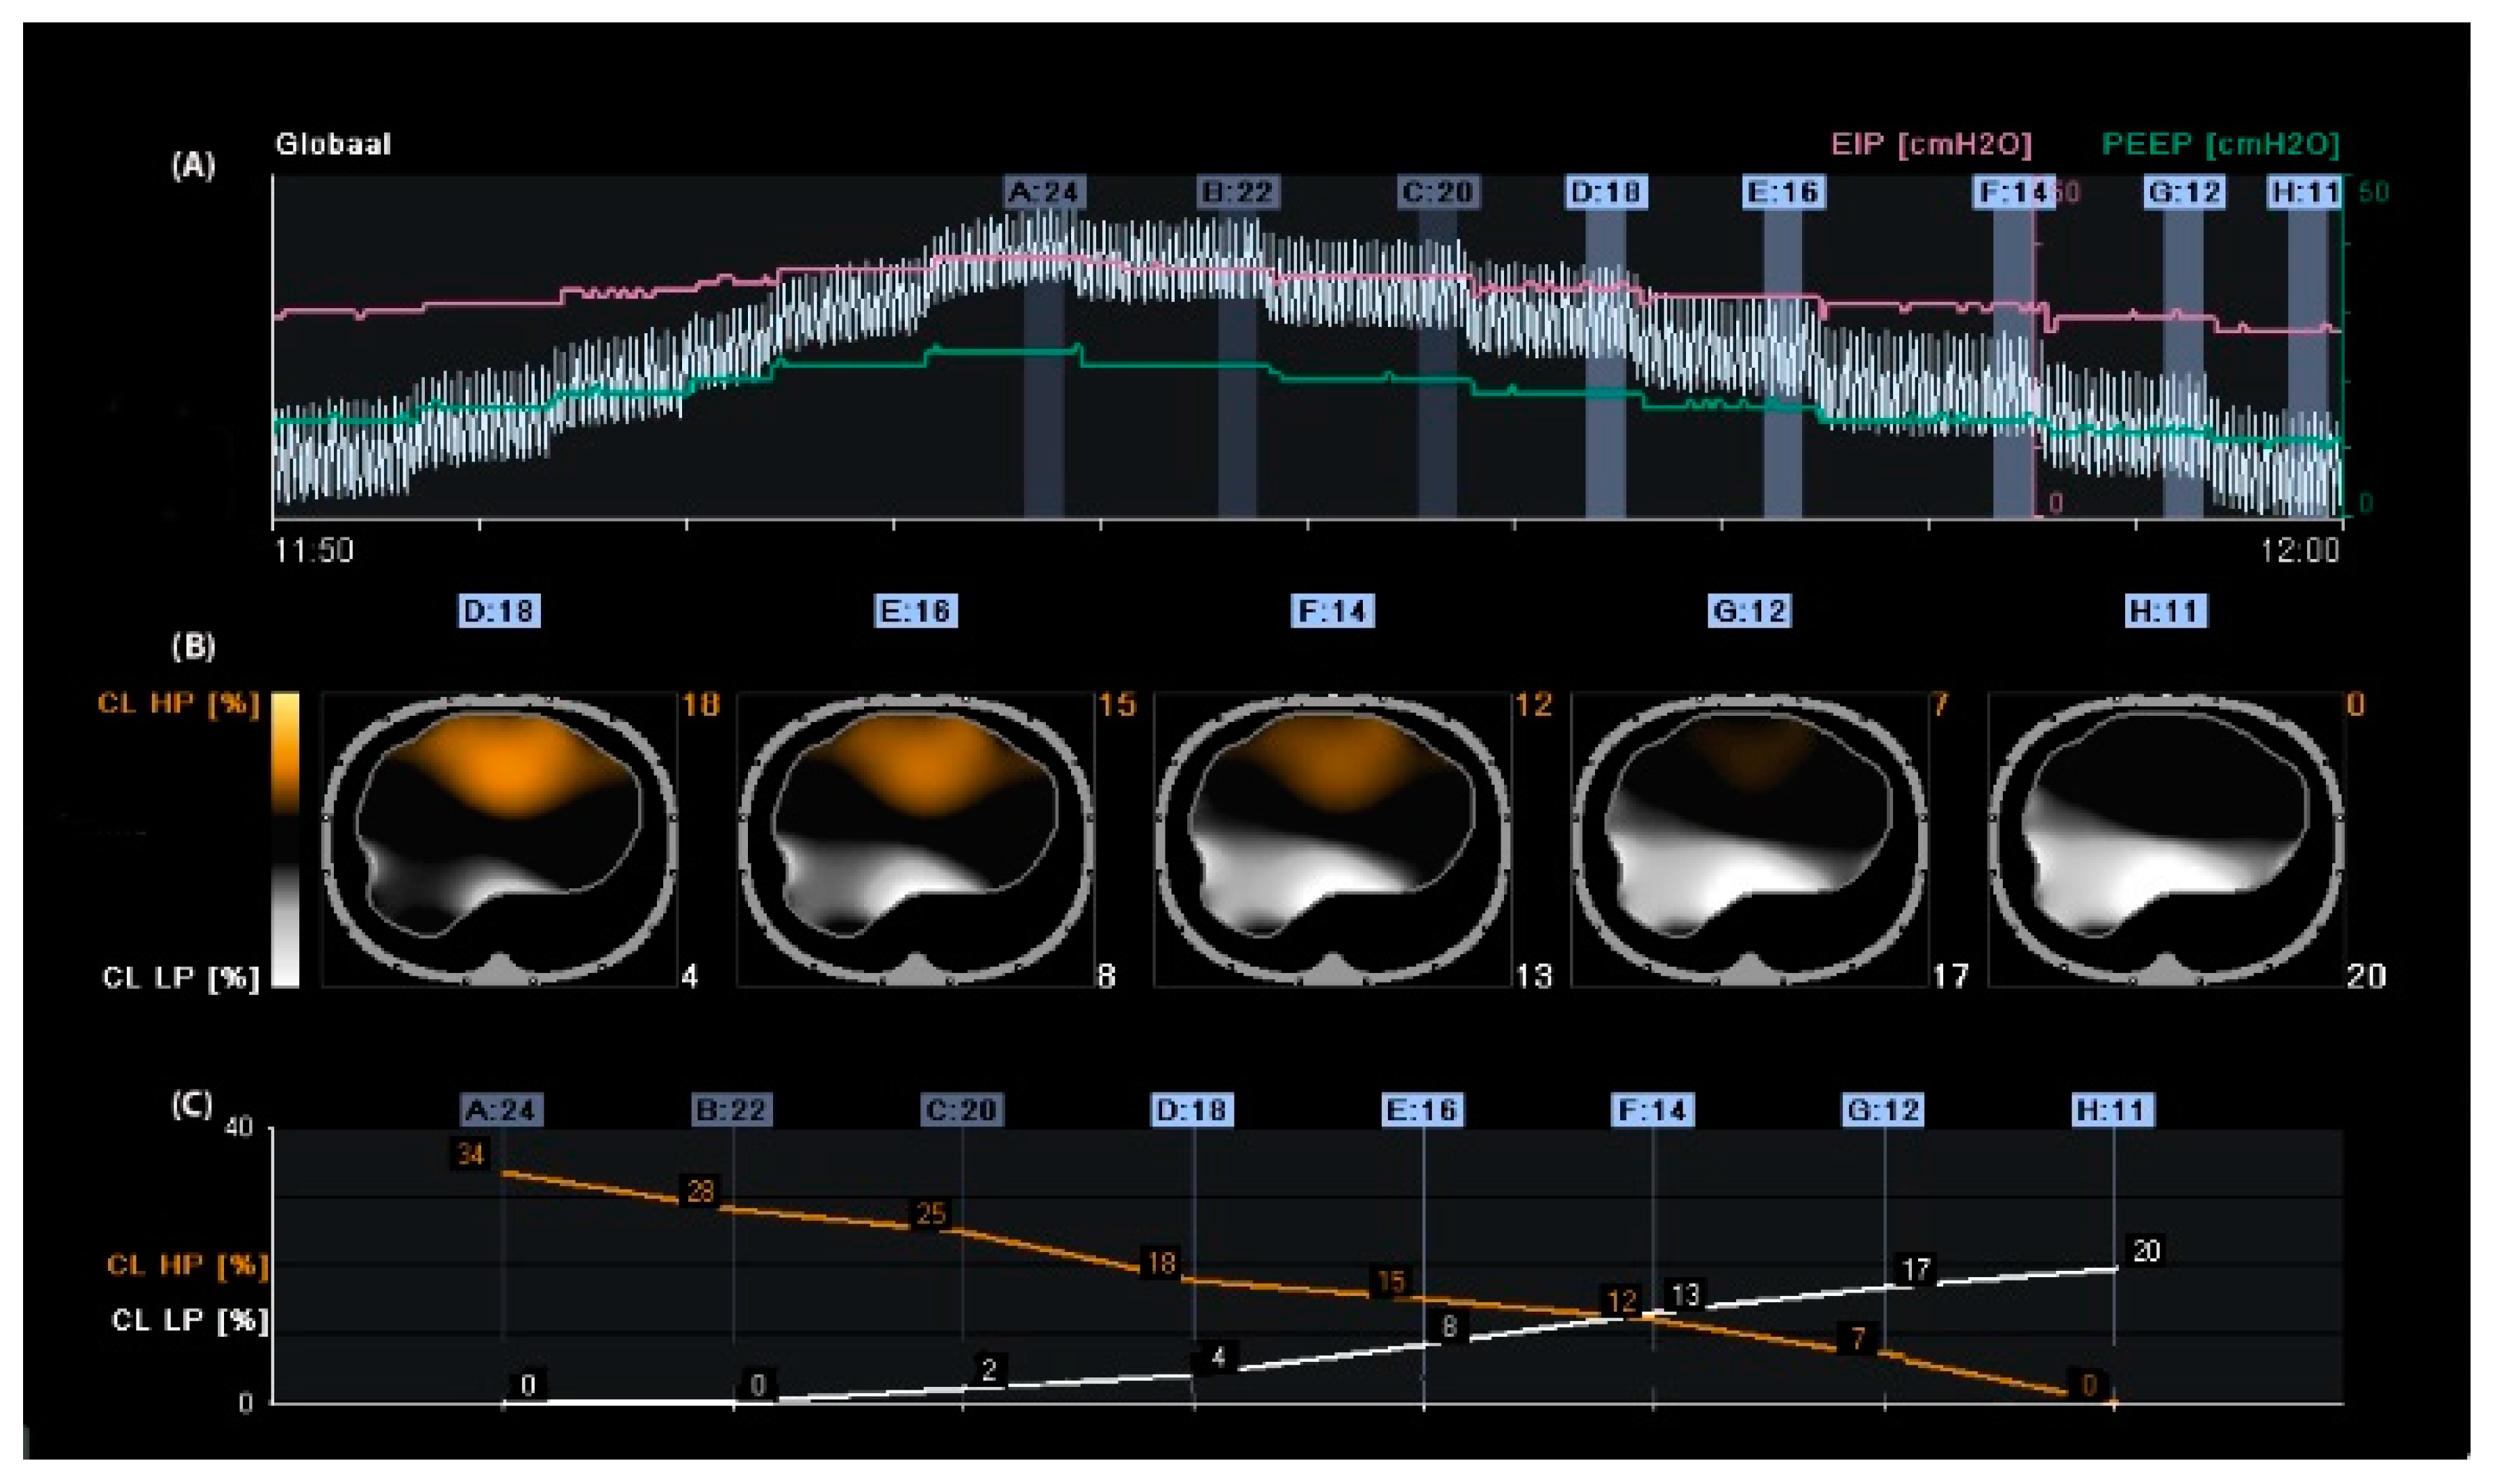
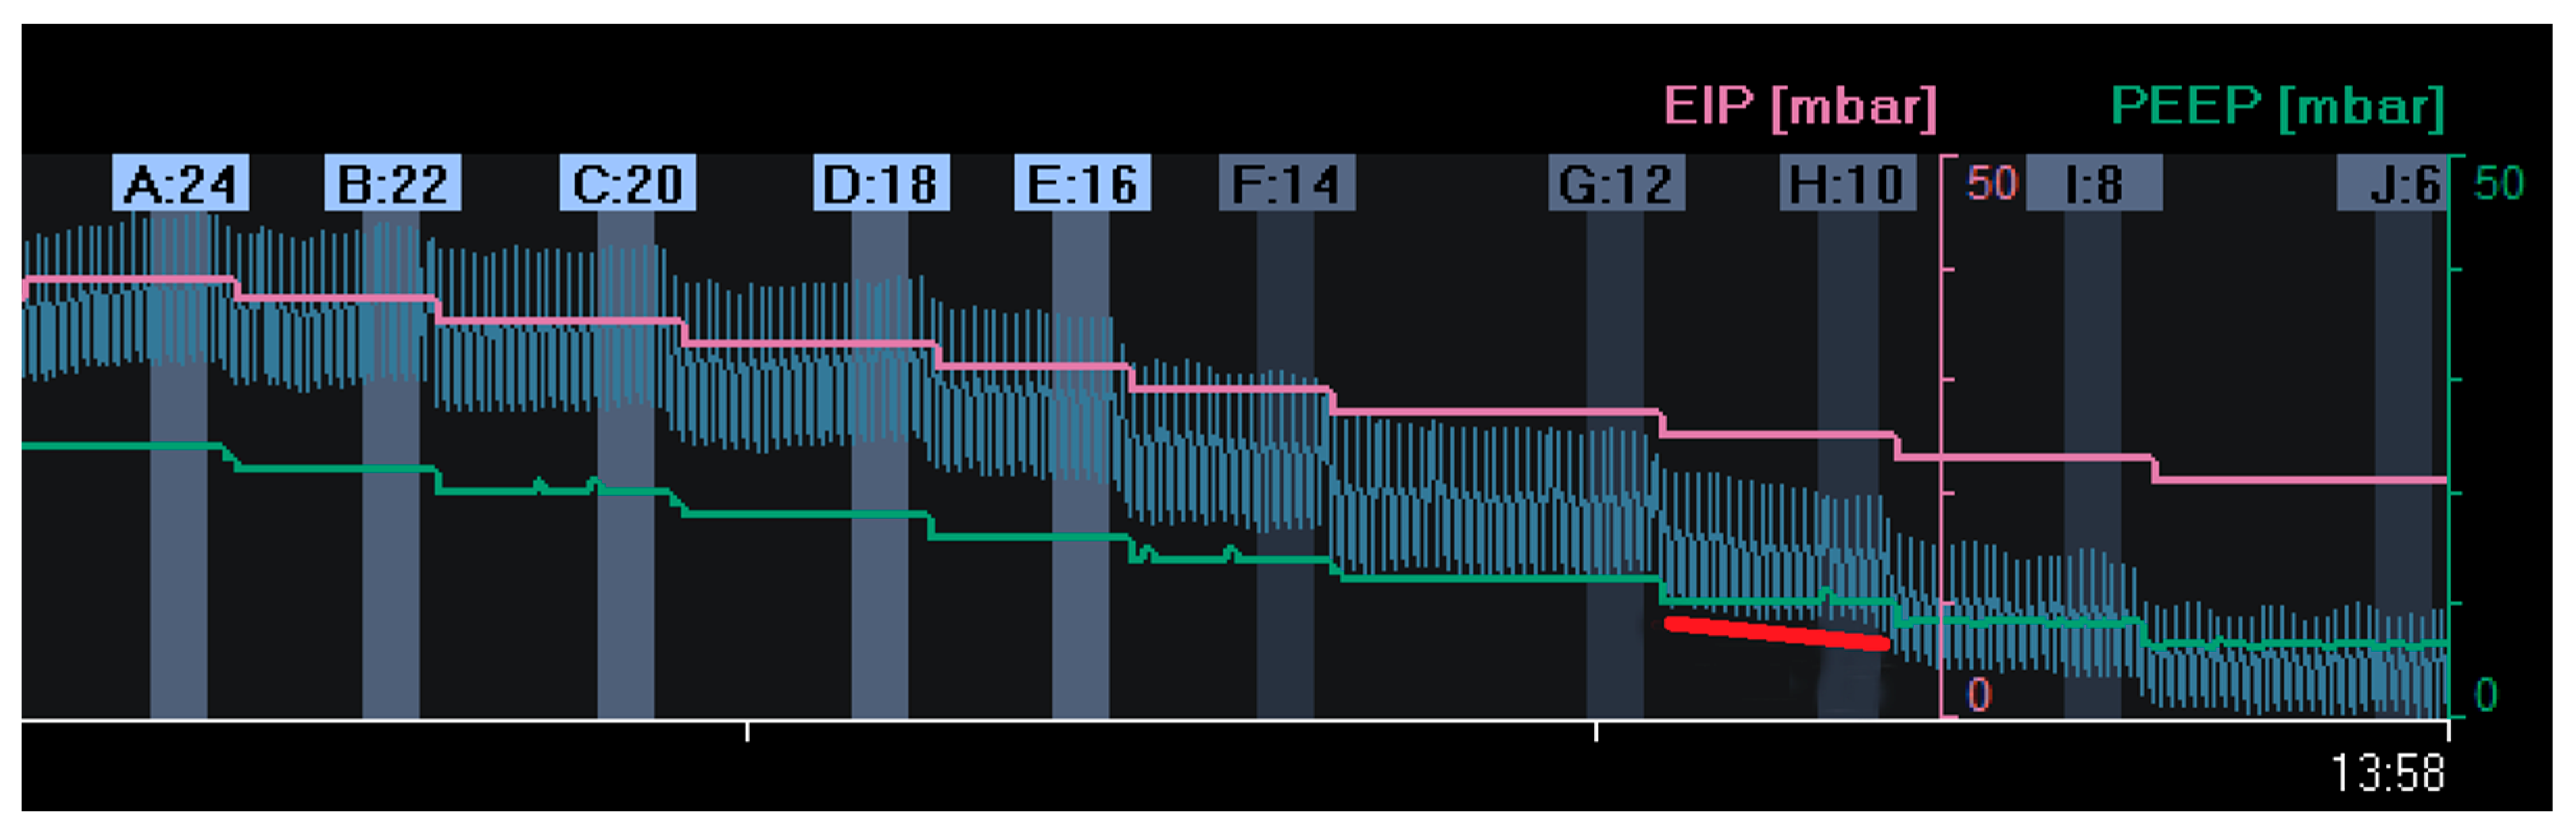
2.1.1. Calculation of Alveolar Overdistension and Collapse
2.1.2. Positive End-Expiratory Pressure Based on Changes in End-Expiratory Lung Impedance
2.1.3. Setting PEEP in Patients with Spontaneous Breathing Activity
3. Measures of Ventilation Distribution
3.1. Anterior-to-Posterior Ventilation Ratio (Impedance Ratio)
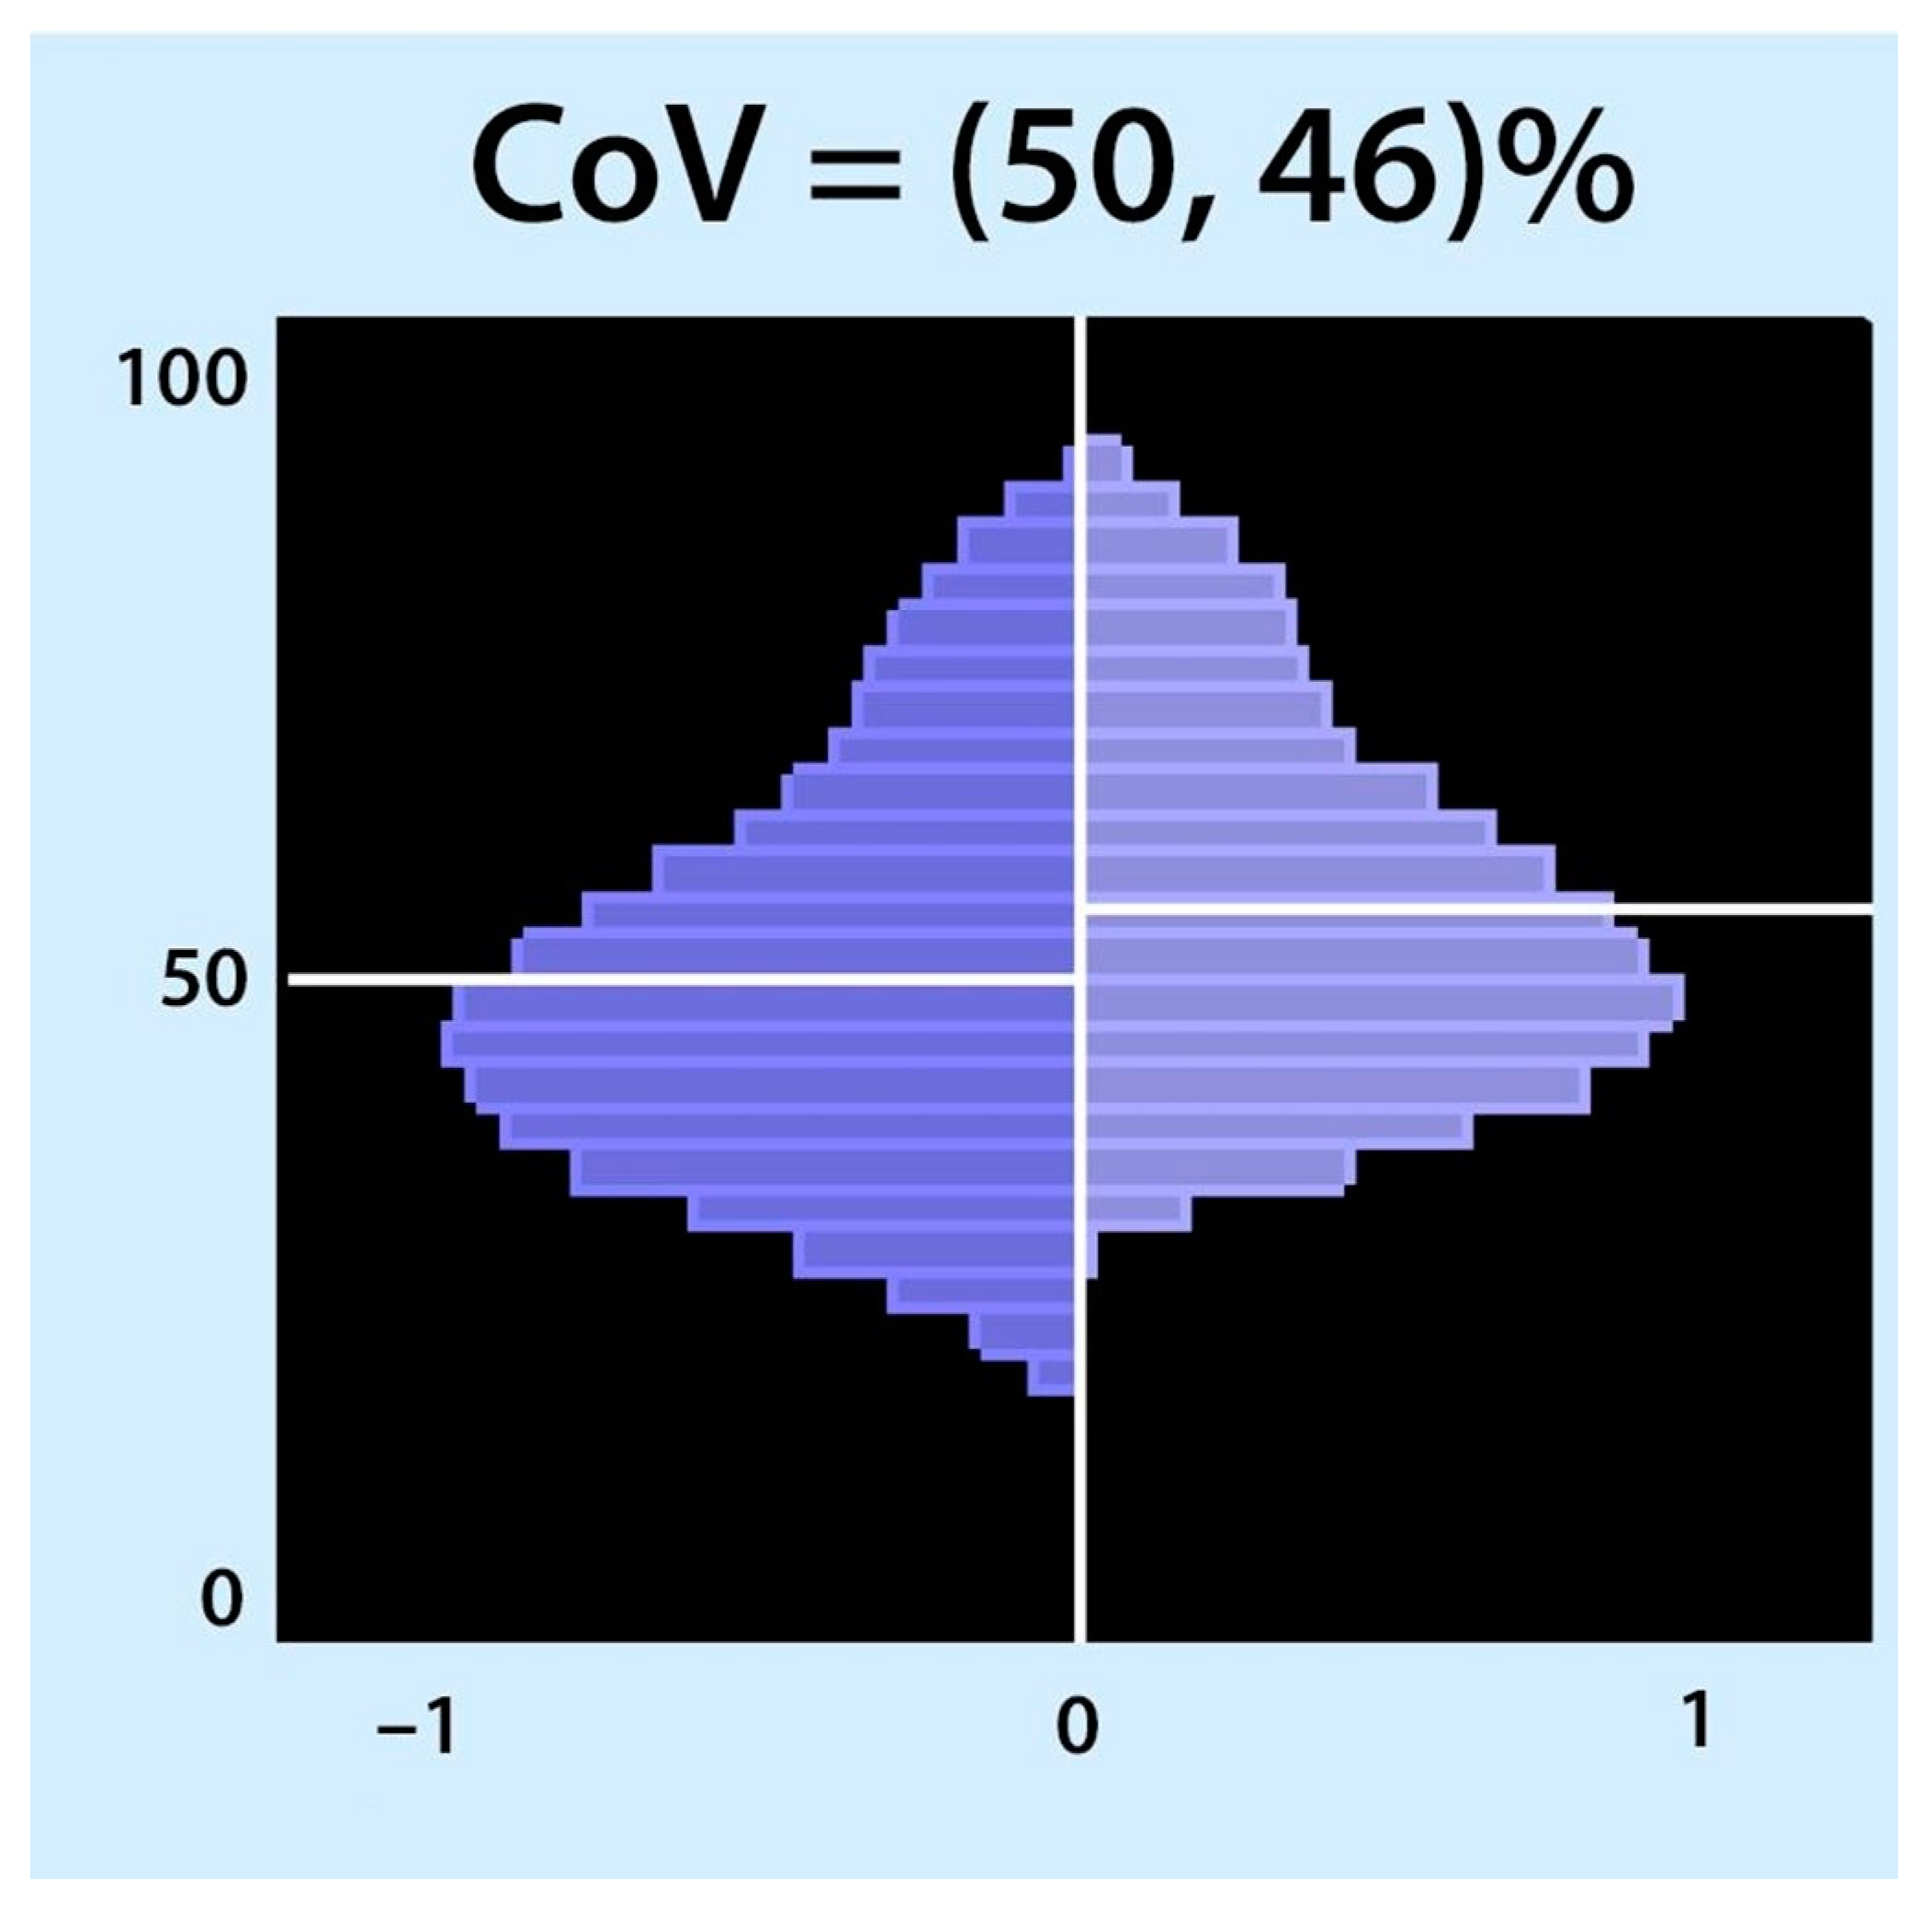
3.2. Centre of Ventilation
3.3. The Global Inhomogeneity Index
4. Regional Ventilation Delay
5. Posture
6. Belt Position
7. Diagnostic Applications
7.1. Airway Clearance Techniques
7.2. Tube Misplacement and One-Lung Ventilation
7.3. Detection of Pleural Effusion and Monitoring of Lung Re-Aeration after Aspiration of Pleural Effusion
7.4. Early Detection of Pneumothorax
7.5. Quantification of Pulmonary Oedema
7.6. Monitoring Chronic Lung Diseases
8. Limitations
9. Electrical Impedance Tomography during the COVID-19 Pandemic
10. Conclusions
11. Main Considerations
- Use EIT as a non-invasive imaging modality to monitor lung function in critically ill patients.
- EIT has shown promise in detecting changes in regional lung ventilation in response to interventions such as mechanical ventilation, prone positioning, and recruitment manoeuvres.
- EIT can provide clinicians with real-time information regarding the distribution of ventilation in the lungs, which may help guide interventions and improve patient outcomes.
- EIT has the potential to be used in clinical trials to evaluate the efficacy of interventions aimed at improving lung function in critically ill patients.
- Further research is needed to establish EIT’s accuracy, reliability, and clinical utility of the EIT in critically ill patients.
12. Recommendations for Future Studies
Author Contributions
Funding
Institutional Review Board Statement
Informed Consent Statement
Data Availability Statement
Conflicts of Interest
Abbreviations
| A/P ratio | anterior-to-posterior ventilation ratio |
| ARDS | acute respiratory distress syndrome |
| AU | arbitrary unit |
| Cdyn | dynamic respiratory system compliance |
| CL | alveolar collapse |
| CoV | centre of ventilation |
| CPAP | continuous positive airway pressure |
| CT | computed tomography |
| DLT | double-lumen tube |
| EELI | end-expiratory lung impedance |
| EIP | end-inspiratory pressure |
| EIT | electrical impedance tomography |
| GI | global inhomogeneity index |
| IR | impedance ratio |
| LL | lower limit |
| OD | alveolar overdistension |
| PEEP | positive end-expiratory pressure |
| P-SILI | patient self-inflicted lung injury |
| RPF | regional peak flow |
| RVD | regional ventilation delay |
| SARS-CoV-2 | severe acute respiratory syndrome coronavirus 2 |
| TID | tidal impedance difference |
| UL | upper limit |
| VALI | Ventilator-associated lung injury |
References
- Acute Respiratory Distress Syndrome Network. Ventilation with lower tidal volumes as compared with traditional tidal volumes for acute lung injury and the acute respiratory distress syndrome. N. Engl. J. Med. 2000, 342, 1301–1308. [Google Scholar] [CrossRef]
- The ARDS Clinical Trials Network; National Heart, Lung, and Blood Institute, National Institutes of Health. Effects of recruitment maneuvers in patients with acute lung injury and acute respiratory distress syndrome ventilated with high positive end-expiratory pressure. Crit. Care Med. 2003, 31, 2592–2597. [Google Scholar] [CrossRef]
- Meade, M.O.; Cook, D.J.; Guyatt, G.H.; Slutsky, A.S.; Arabi, Y.M.; Cooper, D.J.; Davies, A.R.; Hand, L.E.; Zhou, Q.; Thabane, L.; et al. Ventilation strategy using low tidal volumes, recruitment maneuvers, and high positive end-expiratory pressure for acute lung injury and acute respiratory distress syndrome: A randomized controlled trial. JAMA 2008, 299, 637–645. [Google Scholar] [CrossRef]
- Ranieri, V.I.T.O.; Rubenfeld, G.D.; Thompson, B.T.; Ferguson, N.D.; Caldwell, E.; Fan, E.; Camporota, L. Acute respiratory distress syndrome: The Berlin Definition. JAMA 2012, 307, 2526–2533. [Google Scholar]
- Ranieri, V.M.; Giuliani, R.; Fiore, T.; Dambrosio, M.; Milic-Emili, J. Volume-pressure curve of the respiratory system predicts effects of PEEP in ARDS: “Occlusion” versus “constant flow” technique. Am. J. Respir. Crit. Care Med. 1994, 149, 19–27. [Google Scholar] [CrossRef]
- Ranieri, V.M.; Zhang, H.; Mascia, L.; Aubin, M.; Lin, C.-Y.; Mullen, J.B.; Grasso, S.; Binnie, M.; Volgyesi, G.A.; Eng, P.; et al. Pressure-time curve predicts minimally injurious ventilatory strategy in an isolated rat lung model. Anesthesiology 2000, 93, 1320–1328. [Google Scholar] [CrossRef]
- Talmor, D.; Sarge, T.; Malhotra, A.; O’Donnell, C.R.; Ritz, R.; Lisbon, A.; Novack, V.; Loring, S.H. Mechanical ventilation guided by esophageal pressure in acute lung injury. N. Engl. J. Med. 2008, 359, 2095–2104. [Google Scholar] [CrossRef]
- Mauri, T.; Yoshida, T.; Bellani, G.; Goligher, E.C.; Carteaux, G.; Rittayamai, N.; Mojoli, F.; Chiumello, D.; Piquilloud, L.; Grasso, S.; et al. Esophageal and transpulmonary pressure in the clinical setting: Meaning, usefulness and perspectives. Intensive Care Med. 2016, 42, 1360–1373. [Google Scholar] [CrossRef]
- Demory, D.; Arnal, J.-M.; Wysocki, M.; Donati, S.; Granier, I.; Corno, G.; Durand-Gasselin, J. Recruitability of the lung estimated by the pressure volume curve hysteresis in ARDS patients. Intensive Care Med. 2008, 34, 2019–2025. [Google Scholar] [CrossRef]
- Hickling, K.G. The pressure-volume curve is greatly modified by recruitment. A mathematical model of ARDS lungs. Am. J. Respir. Crit. Care Med. 1998, 158, 194–202. [Google Scholar] [CrossRef]
- Suarez-Sipmann, F.; Böhm, S.H.; Tusman, G.; Pesch, T.; Thamm, O.; Reissmann, H.; Reske, A.; Magnusson, A.; Hedenstierna, G. Use of dynamic compliance for open lung positive end-expiratory pressure titration in an experimental study. Crit. Care Med. 2007, 35, 214–221. [Google Scholar] [CrossRef]
- Pintado, M.-C.; de Pablo, R.; Trascasa, M.; Milicua, J.-M.; Rogero, S.; Daguerre, M.; Cambronero, J.-A.; Arribas, I.; Sánchez-García, M. Individualized PEEP setting in subjects with ARDS: A randomized controlled pilot study. Respir. Care 2013, 58, 1416–1423. [Google Scholar] [CrossRef]
- The National Heart, Lung, and Blood Institute ARDS Clinical Trials Network. Higher versus lower positive end-expiratory pressures in patients with the acute respiratory distress syndrome. N. Engl. J. Med. 2004, 351, 327–336. [Google Scholar] [CrossRef]
- Rezaiguia-Delclaux, S.; Ren, L.; Gruner, A.; Roman, C.; Genty, T.; Stéphan, F. Oxygenation versus driving pressure for determining the best positive end-expiratory pressure in acute respiratory distress syndrome. Crit. Care 2022, 26, 214. [Google Scholar] [CrossRef] [PubMed]
- Chiumello, D.; Carlesso, E.; Cadringher, P.; Caironi, P.; Valenza, F.; Polli, F.; Tallarini, F.; Cozzi, P.; Cressoni, M.; Colombo, A.; et al. Lung stress and strain during mechanical ventilation for acute respiratory distress syndrome. Am. J. Respir. Crit. Care Med. 2008, 178, 346–355. [Google Scholar] [CrossRef] [PubMed]
- Brown, B.H.; Barber, D.C.; Seagar, A.D. Applied potential tomography: Possible clinical applications. Clin. Phys. Physiol. Meas. 1985, 6, 109–121. [Google Scholar] [CrossRef] [PubMed]
- Costa, E.L.; Borges, J.B.; Melo, A.; Suarez-Sipmann, F.; Toufen, C., Jr.; Bohm, S.H.; Amato, M.B. Bedside estimation of recruitable alveolar collapse and hyperdistension by electrical impedance tomography. Intensive Care Med. 2009, 35, 1132–1137. [Google Scholar] [CrossRef]
- Wrigge, H.; Zinserling, J.; Muders, T.; Varelmann, D.; Günther, U.; von der Groeben, C.; Magnusson, A.; Hedenstierna, G.; Putensen, C. Electrical impedance tomography compared with thoracic computed tomography during a slow inflation maneuver in experimental models of lung injury. Crit. Care Med. 2008, 36, 903–909. [Google Scholar] [CrossRef]
- de Jongh, S.A.M.; Heines, S.J.H.; de Jongh, F.H.C.; Segers, R.P.J.; van der Horst, I.C.C.; van Bussel, B.C.; Bergmans, D.C. Regional peak flow as a novel approach to assess regional pulmonary mechanics by electrical impedance tomography: An observational validation study. Ann. Transl. Med. 2023, 11, 253. [Google Scholar] [CrossRef]
- Bodenstein, M.; David, M.; Markstaller, K. Principles of electrical impedance tomography and its clinical application. Crit. Care Med. 2009, 37, 713–724. [Google Scholar] [CrossRef]
- Riera, J.; Riu, P.J.; Casan, P.; Masclans, J.R. Electrical impedance tomography in acute lung injury. Med. Intensiv. 2011, 35, 509–517. [Google Scholar] [CrossRef] [PubMed]
- Moerer, O.; Hahn, G.; Quintel, M. Lung impedance measurements to monitor alveolar ventilation. Curr. Opin. Crit. Care 2011, 17, 260–267. [Google Scholar] [CrossRef] [PubMed]
- Frerichs, I.; Amato, M.B.P.; van Kaam, A.H.; Tingay, D.G.; Zhao, Z.; Grychtol, B.; Bodenstein, M.; Gagnon, H.; Böhm, S.H.; Teschner, E.; et al. Chest electrical impedance tomography examination, data analysis, terminology, clinical use and recommendations: Consensus statement of the TRanslational EIT developmeNt stuDy group. Thorax 2017, 72, 83–93. [Google Scholar] [CrossRef] [PubMed]
- Gentile, M.A.; Cheifetz, I.M. Optimal positive end-expiratory pressure: The search for the Holy Grail continues. Crit. Care Med. 2004, 32, 2553–2554. [Google Scholar] [CrossRef]
- Markhorst, D.; Kneyber, M.; van Heerde, M. The quest for optimal positive end-expiratory pressure continues. Crit. Care 2008, 12, 408. [Google Scholar] [CrossRef][Green Version]
- Gattinoni, L.; Carlesso, E.; Cressoni, M. Selecting the ‘right’ positive end-expiratory pressure level. Curr. Opin. Crit. Care 2015, 21, 50–57. [Google Scholar] [CrossRef]
- Dargaville, P.A.; Rimensberger, P.C.; Frerichs, I. Regional tidal ventilation and compliance during a stepwise vital capacity manoeuvre. Intensive Care Med. 2010, 36, 1953–1961. [Google Scholar] [CrossRef]
- Spadaro, S.; Mauri, T.; Böhm, S.H.; Scaramuzzo, G.; Turrini, C.; Waldmann, A.D.; Ragazzi, R.; Pesenti, A.; Volta, C.A. Variation of poorly ventilated lung units (silent spaces) measured by electrical impedance tomography to dynamically assess recruitment. Crit. Care 2018, 22, 26. [Google Scholar] [CrossRef]
- Tas, J.; van Gassel, R.J.J.; Heines, S.J.H.; Mulder, M.M.G.; Heijnen, N.F.L.; Acampo-de Jong, M.J.; Bels, J.L.M.; Bennis, F.C.; Koelmann, M.; Groven, R.V.M.; et al. Serial measurements in COVID-19-induced acute respiratory disease to unravel heterogeneity of the disease course: Design of the Maastricht Intensive Care COVID cohort (MaastrICCht). BMJ Open 2020, 10, e040175. [Google Scholar] [CrossRef]
- Bikker, I.G.; Preis, C.; Egal, M.; Bakker, J.; Gommers, D. Electrical impedance tomography measured at two thoracic levels can visualize the ventilation distribution changes at the bedside during a decremental positive end-expiratory lung pressure trial. Crit. Care 2011, 15, R193. [Google Scholar] [CrossRef]
- Heines, S.J.H.; Strauch, U.; van de Poll, M.C.G.; Roekaerts, P.M.H.J.; Bergmans, D.C.J.J. Clinical implementation of electric impedance tomography in the treatment of ARDS: A single centre experience. J. Clin. Monit. Comput. 2019, 33, 291–300. [Google Scholar] [CrossRef] [PubMed]
- Heines, S.J.H.; van Bussel, B.C.T.; Jong, M.J.A.-D.; Bennis, F.C.; van Gassel, R.J.J.; Groven, R.V.M.; Heijnen, N.F.L.; Hermans, B.J.M.; Hounjet, R.; van Koll, J.; et al. Pulmonary pathophysiology development of COVID-19 assessed by serial Electrical Impedance Tomography in the MaastrICCht cohort. Sci. Rep. 2022, 12, 14517. [Google Scholar] [CrossRef] [PubMed]
- Franchineau, G.; Bréchot, N.; Lebreton, G.; Hekimian, G.; Nieszkowska, A.; Trouillet, J.-L.; Leprince, P.; Chastre, J.; Luyt, C.-E.; Combes, A.; et al. Bedside Contribution of Electrical Impedance Tomography to Setting Positive End-Expiratory Pressure for Extracorporeal Membrane Oxygenation-treated Patients with Severe Acute Respiratory Distress Syndrome. Am. J. Respir. Crit. Care Med. 2017, 196, 447–457. [Google Scholar] [CrossRef]
- Soulé, C.; Crognier, L.; Puel, F.; Ruiz, S.; Seguin, T.; Fourcade, O.; Georges, B.; Conil, J.-M.; Minville, V.; Vardon-Bounes, F. Assessment of Electrical Impedance Tomography to Set Optimal Positive End-Expiratory Pressure for Venoarterial Extracorporeal Membrane Oxygenation-Treated Patients. Crit. Care Med. 2021, 49, 923–933. [Google Scholar] [CrossRef] [PubMed]
- Puel, F.; Crognier, L.; Soulé, C.; Vardon-Bounes, F.; Ruiz, S.; Seguin, T.; Fourcade, O.; Minville, V.; Conil, J.-M.; Georges, B. Assessment of electrical impedance tomography to set optimal positive end-expiratory pressure for veno-venous ECMO-treated severe ARDS patients. J. Crit. Care 2020, 60, 38–44. [Google Scholar] [CrossRef] [PubMed]
- Ferrando, C.; Mugarra, A.; Gutierrez, A.; Carbonell, J.A.; García, M.; Soro, M.; Tusman, G.; Belda, F.J. Setting individualized positive end-expiratory pressure level with a positive end-expiratory pressure decrement trial after a recruitment maneuver improves oxygenation and lung mechanics during one-lung ventilation. Anesth. Analg. 2014, 118, 657–665. [Google Scholar] [CrossRef]
- Karsten, J.; Grusnick, C.; Paarmann, H.; Heringlake, M.; Heinze, H. Positive end-expiratory pressure titration at bedside using electrical impedance tomography in post-operative cardiac surgery patients. Acta Anaesthesiol. Scand. 2015, 59, 723–732. [Google Scholar] [CrossRef]
- Pereira, S.M.; Tucci, M.R.; Morais, C.C.A.; Simões, C.M.; Tonelotto, B.F.F.; Pompeo, M.S.; Kay, F.U.; Pelosi, P.; Vieira, J.E.; Amato, M.B.P. Individual Positive End-expiratory Pressure Settings Optimize Intraoperative Mechanical Ventilation and Reduce Postoperative Atelectasis. Anesthesiology 2018, 129, 1070–1081. [Google Scholar] [CrossRef]
- Liu, K.; Huang, C.; Xu, M.; Wu, J.; Frerichs, I.; Moeller, K.; Zhao, Z. PEEP guided by electrical impedance tomography during one-lung ventilation in elderly patients undergoing thoracoscopic surgery. Ann. Transl. Med. 2019, 7, 757. [Google Scholar] [CrossRef]
- He, H.; Chi, Y.; Yang, Y.; Yuan, S.; Long, Y.; Zhao, P.; Frerichs, I.; Fu, F.; Möller, K.; Zhao, Z. Early individualized positive end-expiratory pressure guided by electrical impedance tomography in acute respiratory distress syndrome: A randomized controlled clinical trial. Crit. Care 2021, 25, 230. [Google Scholar] [CrossRef]
- Somhorst, P.; van der Zee, P.; Endeman, H.; Gommers, D. PEEP-FiO2 table versus EIT to titrate PEEP in mechanically ventilated patients with COVID-19-related ARDS. Crit. Care 2022, 26, 272. [Google Scholar] [CrossRef]
- Hsu, H.-J.; Chang, H.-T.; Zhao, Z.; Wang, P.-H.; Zhang, J.-H.; Chen, Y.-S.; Frerichs, I.; Moeller, K.; Fu, F.; Hsu, H.-S.; et al. Positive end-expiratory pressure titration with electrical impedance tomography and pressure-volume curve: A randomized trial in moderate to severe ARDS. Physiol. Meas. 2021, 42, 014002. [Google Scholar] [CrossRef] [PubMed]
- Erlandsson, K.; Odenstedt, H.; Lundin, S.; Stenqvist, O. Positive end-expiratory pressure optimization using electric impedance tomography in morbidly obese patients during laparoscopic gastric bypass surgery. Acta Anaesthesiol. Scand. 2006, 50, 833–839. [Google Scholar] [CrossRef] [PubMed]
- Karsten, J.; Stueber, T.; Voigt, N.; Teschner, E.; Heinze, H. Influence of different electrode belt positions on electrical impedance tomography imaging of regional ventilation: A prospective observational study. Crit. Care 2016, 20, 3. [Google Scholar] [CrossRef] [PubMed]
- Frerichs, I.; Hinz, J.; Herrmann, P.; Weisser, G.; Hahn, G.; Dudykevych, T.; Quintel, M.; Hellige, G. Detection of local lung air content by electrical impedance tomography compared with electron beam CT. J. Appl. Physiol. 2002, 93, 660–666. [Google Scholar] [CrossRef]
- Mauri, T.; Eronia, N.; Turrini, C.; Battistini, M.; Grasselli, G.; Rona, R.; Volta, C.A.; Bellani, G.; Pesenti, A. Bedside assessment of the effects of positive end-expiratory pressure on lung inflation and recruitment by the helium dilution technique and electrical impedance tomography. Intensive Care Med. 2016, 42, 1576–1587. [Google Scholar] [CrossRef]
- Hinz, J.; Hahn, G.; Neumann, P.; Sydow, M.; Mohrenweiser, P.; Hellige, G.; Burchardi, H. End-expiratory lung impedance change enables bedside monitoring of end-expiratory lung volume change. Intensive Care Med. 2003, 29, 37–43. [Google Scholar] [CrossRef]
- Bikker, I.G.; Leonhardt, S.; Bakker, J.; Gommers, D. Lung volume calculated from electrical impedance tomography in ICU patients at different PEEP levels. Intensive Care Med. 2009, 35, 1362–1367. [Google Scholar] [CrossRef]
- Eronia, N.; Mauri, T.; Maffezzini, E.; Gatti, S.; Bronco, A.; Alban, L.; Binda, F.; Sasso, T.; Marenghi, C.; Grasselli, G.; et al. Bedside selection of positive end-expiratory pressure by electrical impedance tomography in hypoxemic patients: A feasibility study. Ann. Intensive Care 2017, 7, 76. [Google Scholar] [CrossRef]
- Long, Y.; Liu, D.-W.; He, H.-W.; Zhao, Z.-Q. Positive End-expiratory Pressure Titration after Alveolar Recruitment Directed by Electrical Impedance Tomography. Chin. Med. J. 2015, 128, 1421–1427. [Google Scholar] [CrossRef]
- Frerichs, I.; Pulletz, S.; Elke, G.; Gawelczyk, B.; Frerichs, A.; Weiler, N. Patient examinations using electrical impedance tomography—Sources of interference in the intensive care unit. Physiol Meas. 2011, 32, L1–L10. [Google Scholar] [CrossRef] [PubMed]
- Vogt, B.; Mendes, L.; Chouvarda, I.; Perantoni, E.; Kaimakamis, E.; Becher, T.; Weiler, N.; Tsara, V.; Paiva, R.P.; Maglaveras, N.; et al. Influence of torso and arm positions on chest examinations by electrical impedance tomography. Physiol. Meas. 2016, 37, 904–921. [Google Scholar] [CrossRef] [PubMed]
- Sobota, V.; Müller, M.; Roubík, K. Intravenous administration of normal saline may be misinterpreted as a change of end-expiratory lung volume when using electrical impedance tomography. Sci. Rep. 2019, 9, 5775. [Google Scholar] [CrossRef] [PubMed]
- Becher, T.; Wendler, A.; Eimer, C.; Weiler, N.; Frerichs, I. Changes in Electrical Impedance Tomography Findings of ICU Patients during Rapid Infusion of a Fluid Bolus: A Prospective Observational Study. Am. J. Respir. Crit. Care Med. 2019, 199, 1572–1575. [Google Scholar] [CrossRef] [PubMed]
- Zhao, Z.; Lee, L.-C.; Chang, M.-Y.; Frerichs, I.; Chang, H.-T.; Gow, C.-H.; Hsu, Y.-L.; Möller, K. The incidence and interpretation of large differences in EIT-based measures for PEEP titration in ARDS patients. J. Clin. Monit. Comput. 2020, 34, 1005–1013. [Google Scholar] [CrossRef] [PubMed]
- Ling, S.; Zhao, Z. End-Expiratory Lung Impedance Measured with Electrical Impedance Tomography at Different Days Are Not Comparable. Crit. Care Med. 2023, 51, e70–e72. [Google Scholar] [CrossRef]
- Carteaux, G.; Parfait, M.; Combet, M.; Haudebourg, A.-F.; Tuffet, S.; Dessap, A.M. Patient-Self Inflicted Lung Injury: A Practical Review. J. Clin. Med. 2021, 10, 2738. [Google Scholar] [CrossRef]
- Morais, C.C.A.; Koyama, Y.; Yoshida, T.; Plens, G.M.; Gomes, S.; Lima, C.A.S.; Ramos, O.P.S.; Pereira, S.M.; Kawaguchi, N.; Yamamoto, H.; et al. High Positive End-Expiratory Pressure Renders Spontaneous Effort Noninjurious. Am. J. Respir. Crit. Care Med. 2018, 197, 1285–1296. [Google Scholar] [CrossRef]
- Del Sorbo, L.; Tonetti, T.; Ranieri, V.M. Alveolar recruitment in acute respiratory distress syndrome: Should we open the lung (no matter what) or may accept (part of) the lung closed? Intensive Care Med. 2019, 45, 1436–1439. [Google Scholar] [CrossRef]
- Yoshida, T.; Grieco, D.L.; Brochard, L.; Fujino, Y. Patient self-inflicted lung injury and positive end-expiratory pressure for safe spontaneous breathing. Curr. Opin. Crit. Care 2020, 26, 59–65. [Google Scholar] [CrossRef]
- Tomicic, V.; Cornejo, R. Lung monitoring with electrical impedance tomography: Technical considerations and clinical applications. J. Thorac. Dis. 2019, 11, 3122–3135. [Google Scholar] [CrossRef] [PubMed]
- Becher, T.; Schädler, D.; Rostalski, P.; Zick, G.; Frerichs, I.; Weiler, N. Determination of respiratory system compliance during pressure support ventilation by small variations of pressure support. J. Clin. Monit. Comput. 2018, 32, 741–751. [Google Scholar] [CrossRef] [PubMed]
- Rossi, F.d.S.; Yagui, A.C.Z.; Haddad, L.B.; Deutsch, A.D.; Rebello, C.M. Electrical impedance tomography to evaluate air distribution prior to extubation in very-low-birth-weight infants: A feasibility study. Clinics 2013, 68, 345–350. [Google Scholar] [CrossRef] [PubMed]
- Schramel, J.; Nagel, C.; Auer, U.; Palm, F.; Aurich, C.; Moens, Y. Distribution of ventilation in pregnant Shetland ponies measured by Electrical Impedance Tomography. Respir. Physiol. Neurobiol. 2012, 180, 258–262. [Google Scholar] [CrossRef] [PubMed]
- Kunst, P.W.A.; de Anda, G.V.; Böhm, S.H.; Faes, T.J.C.; Lachmann, B.; Postmus, P.E.; de Vries, P.M.J.M. Monitoring of recruitment and derecruitment by electrical impedance tomography in a model of acute lung injury. Crit. Care Med. 2000, 28, 3891–3895. [Google Scholar] [CrossRef]
- Kunst, P.W.; de Vries, P.M.; Postmus, P.E.; Bakker, J. Evaluation of electrical impedance tomography in the measurement of PEEP-induced changes in lung volume. Chest 1999, 115, 1102–1106. [Google Scholar] [CrossRef]
- Mauri, T.; Bellani, G.; Confalonieri, A.; Tagliabue, P.; Turella, M.; Coppadoro, A.; Citerio, G.; Pesenti, A. Topographic distribution of tidal ventilation in acute respiratory distress syndrome: Effects of positive end-expiratory pressure and pressure support. Crit. Care Med. 2013, 41, 1664–1673. [Google Scholar] [CrossRef]
- Cinnella, G.; Grasso, S.; Raimondo, P.; D’Antini, D.; Mirabella, L.; Rauseo, M.; Dambrosio, M. Physiological Effects of the Open Lung Approach in Patients with Early, Mild, Diffuse Acute Respiratory Distress Syndrome: An Electrical Impedance Tomography Study. Anesthesiology 2015, 123, 1113–1121. [Google Scholar] [CrossRef]
- Frerichs, I.; Hahn, G.; Golisch, W.; Kurpitz, M.; Burchardi, H.; Hellige, G. Monitoring perioperative changes in distribution of pulmonary ventilation by functional electrical impedance tomography. Acta Anaesthesiol. Scand. 1998, 42, 721–726. [Google Scholar] [CrossRef]
- Radke, O.C.; Schneider, T.; Heller, A.R.; Koch, T. Spontaneous breathing during general anesthesia prevents the ventral redistribution of ventilation as detected by electrical impedance tomography: A randomized trial. Anesthesiology 2012, 116, 1227–1234. [Google Scholar] [CrossRef]
- Luepschen, H.; Meier, T.; Grossherr, M.; Leibecke, T.; Karsten, J.; Leonhardt, S. Protective ventilation using electrical impedance tomography. Physiol. Meas. 2007, 28, S247–S260. [Google Scholar] [CrossRef] [PubMed]
- Frerichs, I.; Dargaville, P.A.; van Genderingen, H.; Morel, D.R.; Rimensberger, P.C. Lung volume recruitment after surfactant administration modifies spatial distribution of ventilation. Am. J. Respir. Crit. Care Med. 2006, 174, 772–779. [Google Scholar] [CrossRef] [PubMed]
- Schibler, A.; Yuill, M.; Parsley, C.; Pham, T.; Gilshenan, K.; Dakin, C. Regional Ventilation Distribution in Non-Sedated Spontaneously Breathing Newborns and Adults Is Not Different. Pediatr. Pulmonol. 2009, 44, 851–858. [Google Scholar] [CrossRef] [PubMed]
- Miedema, M.; de Jongh, F.H.; Frerichs, I.; van Veenendaal, M.B.; van Kaam, A.H. Changes in Lung Volume and Ventilation during Surfactant Treatment in Ventilated Preterm Infants. Am. J. Respir. Crit. Care Med. 2011, 184, 100–105. [Google Scholar] [CrossRef]
- Karsten, J.; Luepschen, H.; Grossherr, M.; Bruch, H.-P.; Leonhardt, S.; Gehring, H.; Meier, T. Effect of PEEP on regional ventilation during laparoscopic surgery monitored by electrical impedance tomography. Acta Anaesthesiol. Scand. 2011, 55, 878–886. [Google Scholar] [CrossRef]
- Blankman, P.; Hasan, D.; Erik, G.J.; Gommers, D. Detection of ‘best’ positive end-expiratory pressure derived from electrical impedance tomography parameters during a decremental positive end-expiratory pressure trial. Crit. Care 2014, 18, R95. [Google Scholar] [CrossRef] [PubMed]
- Tingay, D.G.; Wallace, M.J.; Bhatia, R.; Schmölzer, G.M.; Zahra, V.A.; Dolan, M.J.; Hooper, S.B.; Davis, P.G. Surfactant before the first inflation at birth improves spatial distribution of ventilation and reduces lung injury in preterm lambs. J. Appl. Physiol. 2014, 116, 251–258. [Google Scholar] [CrossRef]
- Pham, T.M.T.; Yuill, M.; Dakin, C.; Schibler, A. Regional ventilation distribution in the first 6 months of life. Eur. Respir. J. 2011, 37, 919–924. [Google Scholar] [CrossRef]
- Rooney, D.; Friese, M.; Fraser, J.F.; Dunster, K.R.; Schibler, A. Gravity-dependent ventilation distribution in rats measured with electrical impedance tomography. Physiol. Meas. 2009, 30, 1075–1085. [Google Scholar] [CrossRef]
- Zhao, Z.; Möller, K.; Steinmann, D.; Frerichs, I.; Guttmann, J. Evaluation of an electrical impedance tomography-based Global Inhomogeneity Index for pulmonary ventilation distribution. Intensive Care Med. 2009, 35, 1900–1906. [Google Scholar] [CrossRef]
- Becher, T.; Vogt, B.; Kott, M.; Schädler, D.; Weiler, N.; Frerichs, I. Functional Regions of Interest in Electrical Impedance Tomography: A Secondary Analysis of Two Clinical Studies. PLoS ONE 2016, 11, e0152267. [Google Scholar] [CrossRef]
- Zhao, Z.; Steinmann, D.; Frerichs, I.; Guttmann, J.; Möller, K. PEEP titration guided by ventilation homogeneity: A feasibility study using electrical impedance tomography. Crit. Care 2010, 14, R8. [Google Scholar] [CrossRef] [PubMed]
- Yang, L.; Dai, M.; Möller, K.; Frerichs, I.; Adler, A.; Fu, F.; Zhao, Z. Lung regions identified with CT improve the value of global inhomogeneity index measured with electrical impedance tomography. Quant. Imaging Med. Surg. 2021, 11, 1209–1219. [Google Scholar] [CrossRef] [PubMed]
- Hochhausen, N.; Kapell, T.; Dürbaum, M.; Follmann, A.; Rossaint, R.; Czaplik, M. Monitoring postoperative lung recovery using electrical impedance tomography in post anesthesia care unit: An observational study. J. Clin. Monit. Comput. 2022, 36, 1205–1212. [Google Scholar] [CrossRef] [PubMed]
- Moon, D.S.; Huh, J.W.; Hong, S.-B.; Koh, Y.; Lim, C.-M. Dynamic inhomogeneity of aeration along the vertical axis of the lung may predict weaning failure regardless of diaphragm dysfunction. J. Crit. Care 2021, 65, 186–191. [Google Scholar] [CrossRef] [PubMed]
- Zhao, Z.; Pulletz, S.; Frerichs, I.; Müller-Lisse, U.; Möller, K. The EIT-based global inhomogeneity index is highly correlated with regional lung opening in patients with acute respiratory distress syndrome. BMC Res. Notes 2014, 7, 82. [Google Scholar] [CrossRef] [PubMed]
- Becher, T.; Kott, M.; Schädler, D.; Vogt, B.; Meinel, T.; Weiler, N.; Frerichs, I. Influence of tidal volume on ventilation inhomogeneity assessed by electrical impedance tomography during controlled mechanical ventilation. Physiol. Meas. 2015, 36, 1137–1146. [Google Scholar] [CrossRef]
- Costa, E.L.V.; Amato, M.B.P. Can heterogeneity in ventilation be good? Crit. Care 2010, 14, 134. [Google Scholar] [CrossRef]
- Heines, S.J.H.; de Jongh, S.A.M.; Strauch, U.; van der Horst, I.C.C.; van de Poll, M.C.G.; Bergmans, D.C. The global inhomogeneity index assessed by electrical impedance tomography overestimates PEEP requirement in patients with ARDS: An observational study. BMC Anesthesiol. 2022, 22, 258. [Google Scholar] [CrossRef]
- Lumb, A.B.; Savic, L.; Horsford, M.R.; Hodgson, S.R. Effects of tracheal intubation and tracheal tube position on regional lung ventilation: An observational study. Anaesthesia 2020, 75, 359–365. [Google Scholar] [CrossRef]
- Bickenbach, J.; Czaplik, M.; Polier, M.; Marx, G.; Marx, N.; Dreher, M. Electrical impedance tomography for predicting failure of spontaneous breathing trials in patients with prolonged weaning. Crit. Care 2017, 21, 177. [Google Scholar] [CrossRef] [PubMed]
- Hochhausen, N.; Orschulik, J.; Follmann, A.; Santos, S.A.; Dohmeier, H.; Leonhardt, S.; Rossaint, R.; Czaplik, M. Comparison of two experimental ARDS models in pigs using electrical impedance tomography. PLoS ONE 2019, 14, e0225218. [Google Scholar] [CrossRef] [PubMed]
- Muders, T.; Luepschen, H.M.; Zinserling, J.M.; Greschus, S.; Fimmers, R.M.; Guenther, U.; Buchwald, M.; Grigutsch, D.; Leonhardt, S.; Putensen, C.; et al. Tidal recruitment assessed by electrical impedance tomography and computed tomography in a porcine model of lung injury. Crit. Care Med. 2012, 40, 903–911. [Google Scholar] [CrossRef] [PubMed]
- Haase, J.; Buchloh, D.C.; Hammermüller, S.; Salz, P.; Mrongowius, J.; Carvalho, N.C.; Beda, A.; Rau, A.; Starke, H.; Spieth, P.M.; et al. Mechanical Ventilation Strategies Targeting Different Magnitudes of Collapse and Tidal Recruitment in Porcine Acid Aspiration-Induced Lung Injury. J. Clin. Med. 2019, 8, 1250. [Google Scholar] [CrossRef] [PubMed]
- Nestler, C.; Simon, P.; Petroff, D.; Hammermüller, S.; Kamrath, D.; Wolf, S.; Dietrich, A.; Camilo, L.M.; Beda, A.; Carvalho, A.R.; et al. Individualized positive end-expiratory pressure in obese patients during general anaesthesia: A randomized controlled clinical trial using electrical impedance tomography. Br. J. Anaesth. 2017, 119, 1194–1205. [Google Scholar] [CrossRef] [PubMed]
- Girrbach, F.; Zeutzschel, F.; Schulz, S.; Lange, M.; Beda, A.; Giannella-Neto, A.; Wrigge, H.; Simon, P. Methods for Determination of Individual PEEP for Intraoperative Mechanical Ventilation Using a Decremental PEEP Trial. J. Clin. Med. 2022, 11, 3707. [Google Scholar] [CrossRef]
- Decailliot, F.; Demoule, A.; Maggiore, S.M.; Jonson, B.; Duvaldestin, P.; Brochard, L. Pressure-volume curves with and without muscle paralysis in acute respiratory distress syndrome. Intensive Care Med. 2006, 32, 1322–1328. [Google Scholar] [CrossRef]
- Lu, Q.; Rouby, J.-J. Measurement of pressure-volume curves in patients on mechanical ventilation: Methods and significance. Crit. Care 2000, 4, 91–100. [Google Scholar] [CrossRef]
- Muders, T.; Hentze, B.; Simon, P.; Girrbach, F.; Doebler, M.R.; Leonhardt, S.; Wrigge, H.; Putensen, C. A Modified Method to Assess Tidal Recruitment by Electrical Impedance Tomography. J. Clin. Med. 2019, 8, 1161. [Google Scholar] [CrossRef]
- Barr, J.; Fraser, G.L.; Puntillo, K.; Ely, E.W.; Gélinas, C.; Dasta, J.F.; Davidson, J.E.; Devlin, J.W.; Kress, J.P.; Joffe, A.M.; et al. Clinical practice guidelines for the management of pain, agitation, and delirium in adult patients in the intensive care unit. Crit. Care Med. 2013, 41, 263–306. [Google Scholar] [CrossRef]
- Yuan, S.; Chi, Y.; Long, Y.; He, H.; Zhao, Z. Effect of Position Change From the Bed to a Wheelchair on the Regional Ventilation Distribution Assessed by Electrical Impedance Tomography in Patients with Respiratory Failure. Front. Med. 2021, 8, 744958. [Google Scholar] [CrossRef] [PubMed]
- Lehmann, S.; Leonhardt, S.; Ngo, C.; Bergmann, L.; Schrading, S.; Heimann, K.; Wagner, N.; Tenbrock, K. Electrical impedance tomography as possible guidance for individual positioning of patients with multiple lung injury. Clin. Respir. J. 2018, 12, 68–75. [Google Scholar] [CrossRef] [PubMed]
- Kotani, T.; Tanabe, H.; Yusa, H.; Saito, S.; Yamazaki, K.; Ozaki, M. Electrical impedance tomography-guided prone positioning in a patient with acute cor pulmonale associated with severe acute respiratory distress syndrome. J. Anesth. 2016, 30, 161–165. [Google Scholar] [CrossRef][Green Version]
- Spaeth, J.; Daume, K.; Goebel, U.; Wirth, S.; Schumann, S. Increasing positive end-expiratory pressure (re-)improves intraoperative respiratory mechanics and lung ventilation after prone positioning. Br. J. Anaesth. 2016, 116, 838–846. [Google Scholar] [CrossRef] [PubMed]
- Wang, Y.-X.; Zhong, M.; Dong, M.-H.; Song, J.-Q.; Zheng, Y.-J.; Wu, W.; Tao, J.-L.; Zhu, L.; Zheng, X. Prone positioning improves ventilation-perfusion matching assessed by electrical impedance tomography in patients with ARDS: A prospective physiological study. Crit. Care 2022, 26, 154. [Google Scholar] [CrossRef]
- Katira, B.H.; Osada, K.; Engelberts, D.; Bastia, L.; Damiani, L.F.; Li, X.; Chen, H.; Yoshida, T.; Amato, M.B.; Ferguson, N.D.; et al. Positive End-Expiratory Pressure, Pleural Pressure, and Regional Compliance during Pronation: An Experimental Study. Am. J. Respir. Crit. Care Med. 2021, 203, 1266–1274. [Google Scholar] [CrossRef]
- Martinsson, A.; Houltz, E.; Wallinder, A.; Lindgren, S.; Thorén, A. Lung recruitment in the prone position after cardiac surgery: A randomised controlled study. Br. J. Anaesth. 2021, 126, 1067–1074. [Google Scholar] [CrossRef]
- Riera, J.; Pérez, P.; Cortés, J.; Roca, O.; Masclans, J.R.; Rello, J. Effect of high-flow nasal cannula and body position on end-expiratory lung volume: A cohort study using electrical impedance tomography. Respir. Care 2013, 58, 589–596. [Google Scholar] [CrossRef]
- Reifferscheid, F.; Elke, G.; Pulletz, S.; Gawelczyk, B.; Lautenschläger, I.; Steinfath, M.; Weiler, N.; Frerichs, I. Regional ventilation distribution determined by electrical impedance tomography: Reproducibility and effects of posture and chest plane. Respirology 2011, 16, 523–531. [Google Scholar] [CrossRef]
- Caruana, L.R.; Paratz, J.D.; Chang, A.; Barnett, A.G.; Fraser, J.F. The time taken for the regional distribution of ventilation to stabilise: An investigation using electrical impedance tomography. Anaesth. Intensive Care 2015, 43, 88–91. [Google Scholar] [CrossRef]
- Frerichs, I.; Schiffmann, H.; Oehler, R.; Dudykevych, T.; Hahn, G.; Hinz, J.; Hellige, G. Distribution of lung ventilation in spontaneously breathing neonates lying in different body positions. Intensive Care Med. 2003, 29, 787–794. [Google Scholar] [CrossRef] [PubMed]
- Heinrich, S.; Schiffmann, H.; Frerichs, A.; Klockgether-Radke, A.; Frerichs, I. Body and head position effects on regional lung ventilation in infants: An electrical impedance tomography study. Intensive Care Med. 2006, 32, 1392–1398. [Google Scholar] [CrossRef] [PubMed]
- upton-Smith, A.R.; Argent, A.C.; Rimensberger, P.C.; Morrow, B.M. Challenging a paradigm: Positional changes in ventilation distribution are highly variable in healthy infants and children. Pediatr. Pulmonol. 2014, 49, 764–771. [Google Scholar] [CrossRef] [PubMed]
- Zhang, J.; Patterson, R. Variability in EIT Images of Lung Ventilation as a Function of Electrode Planes and Body Positions. Open Biomed. Eng. J. 2014, 8, 35–41. [Google Scholar] [CrossRef]
- Krueger-Ziolek, S.; Schullcke, B.; Kretschmer, J.; Müller-Lisse, U.; Möller, K.; Zhao, Z. Positioning of electrode plane systematically influences EIT imaging. Physiol. Meas. 2015, 36, 1109–1118. [Google Scholar] [CrossRef]
- Zhao, Z.; Peng, S.-Y.; Chang, M.-Y.; Hsu, Y.-L.; Frerichs, I.; Chang, H.-T.; Möller, K. Spontaneous breathing trials after prolonged mechanical ventilation monitored by electrical impedance tomography: An observational study. Acta Anaesthesiol. Scand. 2017, 61, 1166–1175. [Google Scholar] [CrossRef]
- Frerichs, I.; Hahn, G.; Hellige, G. Thoracic electrical impedance tomographic measurements during volume controlled ventilation-effects of tidal volume and positive end-expiratory pressure. IEEE Trans. Med. Imaging 1999, 18, 764–773. [Google Scholar] [CrossRef]
- Brabant, O.; Crivellari, B.; Hosgood, G.; Raisis, A.; Waldmann, A.D.; Auer, U.; Adler, A.; Smart, L.; Laurence, M.; Mosing, M. Effects of PEEP on the relationship between tidal volume and total impedance change measured via electrical impedance tomography (EIT). J. Clin. Monit. Comput. 2022, 36, 325–334. [Google Scholar] [CrossRef]
- Zhao, Z.; Chen, T.-F.; Teng, H.-C.; Wang, Y.-C.; Chang, M.-Y.; Chang, H.-T.; Frerichs, I.; Fu, F.; Möller, K. Is there a need for individualized adjustment of electrode belt position during EIT-guided titration of positive end-expiratory pressure? Physiol. Meas. 2022, 43, 064001. [Google Scholar] [CrossRef]
- Tingay, D.G.; Copnell, B.; Grant, C.A.; Dargaville, P.A.; Dunster, K.R.; Schibler, A. The effect of endotracheal suction on regional tidal ventilation and end-expiratory lung volume. Intensive Care Med. 2010, 36, 888–896. [Google Scholar] [CrossRef]
- Cereda, M.; Villa, F.; Colombo, E.; Greco, G.; Nacoti, M.; Pesenti, A. Closed system endotracheal suctioning maintains lung volume during volume-controlled mechanical ventilation. Intensive Care Med. 2001, 27, 648–654. [Google Scholar] [CrossRef] [PubMed]
- Garofalo, E.; Rovida, S.; Cammarota, G.; Biamonte, E.; Troisi, L.; Cosenza, L.; Pelaia, C.; Navalesi, P.; Longhini, F.; Bruni, A. Benefits of secretion clearance with high frequency percussive ventilation in tracheostomized critically ill patients: A pilot study. J. Clin. Monit. Comput. 2023, 37, 911–918. [Google Scholar] [CrossRef]
- Szekely, S.M.; Webb, R.K.; Williamson, J.A.; Russell, W.J.; The Australian Incident Monitoring Study. Problems related to the endotracheal tube: An analysis of 2000 incident reports. Anaesth. Intensive Care 1993, 21, 611–616. [Google Scholar] [CrossRef] [PubMed]
- Verghese, S.T.; Hannallah, R.S.; Slack, M.C.; Cross, R.R.; Patel, K.M. Auscultation of bilateral breath sounds does not rule out endobronchial intubation in children. Anesth. Analg. 2004, 99, 56–58. [Google Scholar] [CrossRef] [PubMed]
- Steinmann, D.; Stahl, C.A.; Minner, J.; Schumann, S.; Loop, T.; Kirschbaum, A.; Priebe, H.J.; Guttmann, J. Electrical impedance tomography to confirm correct placement of double-lumen tube: A feasibility study. Br. J. Anaesth. 2008, 101, 411–418. [Google Scholar] [CrossRef]
- Klein, U.; Karzai, W.; Bloos, F.; Wohlfarth, M.; Gottschall, R.; Fritz, H.; Gugel, M.; Seifert, A. Role of fiberoptic bronchoscopy in conjunction with the use of double-lumen tubes for thoracic anesthesia: A prospective study. Anesthesiology 1998, 88, 346–350. [Google Scholar] [CrossRef]
- Brodsky, J.B.; Lemmens, H.J. Left double-lumen tubes: Clinical experience with 1170 patients. J. Cardiothorac. Vasc. Anesth. 2003, 17, 289–298. [Google Scholar] [CrossRef]
- Bora, V.; Kritzmire, S.M.; Arthur, M.E. Double-Lumen Endobronchial Tubes; StatPearls: Treasure Island, FL, USA, 2023. [Google Scholar]
- Becher, T.; Bußmeyer, M.; Lautenschläger, I.; Schädler, D.; Weiler, N.; Frerichs, I. Characteristic pattern of pleural effusion in electrical impedance tomography images of critically ill patients. Br. J. Anaesth. 2018, 120, 1219–1228. [Google Scholar] [CrossRef]
- Alves, S.H.S.; Amato, M.B.P.; Terra, R.M.; Vargas, F.S.; Caruso, P. Lung reaeration and reventilation after aspiration of pleural effusions. A study using electrical impedance tomography. Ann. Am. Thorac. Soc. 2014, 11, 186–191. [Google Scholar] [CrossRef]
- Rara, A.; Roubik, K.; Tyll, T. Effects of pleural effusion drainage in the mechanically ventilated patient as monitored by electrical impedance tomography and end-expiratory lung volume: A pilot study. J. Crit. Care 2020, 59, 76–80. [Google Scholar] [CrossRef]
- Costa, E.L.V.; Chaves, C.N.; Gomes, S.; Beraldo, M.A.; Volpe, M.S.; Tucci, M.R.; Schettino, I.A.L.; Bohm, S.H.; Carvalho, C.R.R.; Tanaka, H.; et al. Real-time detection of pneumothorax using electrical impedance tomography. Crit. Care Med. 2008, 36, 1230–1238. [Google Scholar] [CrossRef] [PubMed]
- Preis, C.; Luepschen, H.; Leonhardt, S.; Gommers, D. Experimental case report: Development of a pneumothorax monitored by electrical impedance tomography. Clin. Physiol. Funct. Imaging 2009, 29, 159–162. [Google Scholar] [CrossRef]
- Leite, W.S.; Campos, S.L.; Brandão, D.C.; Morais, C.C.A.; de Andrade, A.D. Real-time distinct visualization of barotrauma risk monitored by electrical impedance tomography in a COVID-19 and latent tuberculosis case. Acute Crit. Care 2022, 37, 672–673. [Google Scholar] [CrossRef] [PubMed]
- Yang, Y.; He, H.; Long, Y.; Chi, Y.; Yuan, S.; Shen, Z.; Frerichs, I.; Zhao, Z. Bedside electrical impedance tomography in early diagnosis of pneumothorax in mechanically ventilated ICU patients—A single-center retrospective cohort study. J. Clin. Monit. Comput. 2023, 37, 629–637. [Google Scholar] [CrossRef] [PubMed]
- Trepte, C.J.C.; Phillips, C.R.; Solà, J.; Adler, A.; Haas, S.A.; Rapin, M.; Böhm, S.H.; Reuter, D.A. Electrical impedance tomography (EIT) for quantification of pulmonary edema in acute lung injury. Crit. Care 2016, 20, 18. [Google Scholar] [CrossRef]
- Zhao, Z.; He, H.; Luo, J.; Adler, A.; Zhang, X.; Liu, R.; Lan, Y.; Lu, S.; Luo, X.; Lei, Y.; et al. Detection of pulmonary oedema by electrical impedance tomography: Validation of previously proposed approaches in a clinical setting. Physiol. Meas. 2019, 40, 054008. [Google Scholar] [CrossRef]
- Zhang, C.; Dai, M.; Liu, W.; Bai, X.; Wu, J.; Xu, C.; Xia, J.; Fu, F.; Shi, X.; Dong, X.; et al. Global and regional degree of obstruction determined by electrical impedance tomography in patients with obstructive ventilatory defect. PLoS ONE 2018, 13, e0209473. [Google Scholar] [CrossRef]
- Vogt, B.; Zhao, Z.; Zabel, P.; Weiler, N.; Frerichs, I. Regional lung response to bronchodilator reversibility testing determined by electrical impedance tomography in chronic obstructive pulmonary disease. Am. J. Physiol. Lung Cell. Mol. Physiol. 2016, 311, L8–L19. [Google Scholar] [CrossRef]
- Zhao, Z.; Chang, M.-Y.; Frerichs, I.; Zhang, J.-H.; Chang, H.-T.; Gow, C.-H.; Möller, K. Regional air trapping in acute exacerbation of obstructive lung diseases measured with electrical impedance tomography: A feasibility study. Minerva Anestesiol. 2020, 86, 172–180. [Google Scholar] [CrossRef]
- Frerichs, I.; Zhao, Z.; Becher, T.; Zabel, P.; Weiler, N.; Vogt, B. Regional lung function determined by electrical impedance tomography during bronchodilator reversibility testing in patients with asthma. Physiol. Meas. 2016, 37, 698–712. [Google Scholar] [CrossRef]
- Zhao, Z.; Fischer, R.; Frerichs, I.; Müller-Lisse, U.; Möller, K. Regional ventilation in cystic fibrosis measured by electrical impedance tomography. J. Cyst. Fibros. 2012, 11, 412–418. [Google Scholar] [CrossRef] [PubMed][Green Version]
- Zhao, Z.; Müller-Lisse, U.; Frerichs, I.; Fischer, R.; Möller, K. Regional airway obstruction in cystic fibrosis determined by electrical impedance tomography in comparison with high resolution CT. Physiol. Meas. 2013, 34, N107–N114. [Google Scholar] [CrossRef]
- Karagiannidis, C.; Waldmann, A.D.; Róka, P.L.; Schreiber, T.; Strassmann, S.; Windisch, W.; Böhm, S.H. Regional expiratory time constants in severe respiratory failure estimated by electrical impedance tomography: A feasibility study. Crit. Care 2018, 22, 221. [Google Scholar] [CrossRef]
- Bläser, D.; Pulletz, S.; Becher, T.; Schädler, D.; Elke, G.; Weiler, N.; Frerichs, I. Unilateral empyema impacts the assessment of regional lung ventilation by electrical impedance tomography. Physiol. Meas. 2014, 35, 975–983. [Google Scholar] [CrossRef] [PubMed]
- Campbell, J.H.; Harris, N.D.; Zhang, F.; Morice, A.H.; Brown, B.H. Detection of changes in intrathoracic fluid in man using electrical impedance tomography. Clin. Sci. 1994, 87, 97–101. [Google Scholar] [CrossRef] [PubMed]
- Arad, M.; Zlochiver, S.; Davidson, T.; Shoenfeld, Y.; Adunsky, A.; Abboud, S. The detection of pleural effusion using a parametric EIT technique. Physiol. Meas. 2009, 30, 421–428. [Google Scholar] [CrossRef]
- Hahn, G.; Just, A.; Dudykevych, T.; Frerichs, I.; Hinz, J.; Quintel, M.; Hellige, G. Imaging pathologic pulmonary air and fluid accumulation by functional and absolute EIT. Physiol. Meas. 2006, 27, S187–S198. [Google Scholar] [CrossRef]
- Canet, J.; Gallart, L. The dark side of the lung: Unveiling regional lung ventilation with electrical impedance tomography. Anesthesiology 2012, 116, 1186–1188. [Google Scholar] [CrossRef]
- Coronaviridae Study Group of the International Committee on Taxonomy of V. The species Severe acute respiratory syndrome-related coronavirus: Classifying 2019-nCoV and naming it SARS-CoV-2. Nat. Microbiol. 2020, 5, 536–544. [Google Scholar] [CrossRef]
- Gattinoni, L.; Chiumello, D.; Caironi, P.; Busana, M.; Romitti, F.; Brazzi, L.; Camporota, L. COVID-19 pneumonia: Different respiratory treatments for different phenotypes? Intensive Care Med. 2020, 46, 1099–1102. [Google Scholar] [CrossRef]
- Bos, L.D.J.; Sinha, P.; Dickson, R.P. The perils of premature phenotyping in COVID-19: A call for caution. Eur. Respir. J. 2020, 56, 2001768. [Google Scholar] [CrossRef] [PubMed]
- Morais, C.C.A.; Safaee Fakhr, B.; De Santis Santiago, R.R.; Di Fenza, R.; Marutani, E.; Gianni, S.; Pinciroli, R.; Kacmarek, R.M.; Berra, L. Bedside Electrical Impedance Tomography Unveils Respiratory “Chimera” in COVID-19. Am. J. Respir. Crit. Care Med. 2021, 203, 120–121. [Google Scholar] [CrossRef] [PubMed]
- De Vries, H.J.; Endeman, H.; van der Hoeven, J.G.; Heunks, L.M.A. Lung-protective mechanical ventilation in patients with COVID-19. Neth. J. Crit. Care 2020, 28, 120–124. [Google Scholar]
- van der Zee, P.; Somhorst, P.; Endeman, H.; Gommers, D. Electrical Impedance Tomography for Positive End-Expiratory Pressure Titration in COVID-19-related Acute Respiratory Distress Syndrome. Am. J. Respir. Crit. Care Med. 2020, 202, 280–284. [Google Scholar] [CrossRef]
- Sella, N.; Zarantonello, F.; Andreatta, G.; Gagliardi, V.; Boscolo, A.; Navalesi, P. Positive end-expiratory pressure titration in COVID-19 acute respiratory failure: Electrical impedance tomography vs. PEEP/FiO2 tables. Crit. Care 2020, 24, 540. [Google Scholar] [CrossRef] [PubMed]
- Beitler, J.R.; Sarge, T.; Banner-Goodspeed, V.M.; Gong, M.N.; Cook, D.; Novack, V.; Loring, S.H.; Talmor, D.; EPVent-2 Study Group. Effect of Titrating Positive End-Expiratory Pressure (PEEP) with an Esophageal Pressure-Guided Strategy vs an Empirical High PEEP-Fio2 Strategy on Death and Days Free From Mechanical Ventilation among Patients with Acute Respiratory Distress Syndrome: A Randomized Clinical Trial. JAMA 2019, 321, 846–857. [Google Scholar] [PubMed]
- Gibot, S.; Conrad, M.; Courte, G.; Cravoisy, A. Positive End-Expiratory Pressure Setting in COVID-19-Related Acute Respiratory Distress Syndrome: Comparison Between Electrical Impedance Tomography, PEEP/FiO2 Tables, and Transpulmonary Pressure. Front. Med. 2021, 8, 720920. [Google Scholar] [CrossRef]
- Sella, N.; Pettenuzzo, T.; Della Paolera, M.; Andreatta, G.; Boscolo, A.; De Cassai, A.; Muraro, L.; Peralta, A.; Persona, P.; Petranzan, E.; et al. Two Consecutive Runs of Veno-Venous Extracorporeal Membrane Oxygenation in a Peripartum Patient with COVID-19 Acute Respiratory Distress Syndrome. Case Rep. Crit. Care 2021, 2021, 2032197. [Google Scholar] [CrossRef]
- Di Pierro, M.; Giani, M.; Bronco, A.; Lembo, F.M.; Rona, R.; Bellani, G.; Foti, G. Bedside Selection of Positive End Expiratory Pressure by Electrical Impedance Tomography in Patients Undergoing Veno-Venous Extracorporeal Membrane Oxygenation Support: A Comparison between COVID-19 ARDS and ARDS from Other Etiologies. J. Clin. Med. 2022, 11, 1639. [Google Scholar] [CrossRef]
- Guérin, C.; Reignier, J.; Richard, J.C.; Beuret, P.; Gacouin, A.; Boulain, T.; Mercier, E.; Badet, M.; Mercat, A.; Baudin, O.; et al. Prone positioning in severe acute respiratory distress syndrome. N. Engl. J. Med. 2013, 368, 2159–2168. [Google Scholar] [CrossRef]
- Sud, S.; Friedrich, J.O.; Adhikari, N.K.J.; Taccone, P.; Mancebo, J.; Polli, F.; Latini, R.; Pesenti, A.; Curley, M.A.; Fernandez, R.; et al. Effect of prone positioning during mechanical ventilation on mortality among patients with acute respiratory distress syndrome: A systematic review and meta-analysis. CMAJ 2014, 186, E381–E390. [Google Scholar] [CrossRef] [PubMed]
- Duggal, A.; Rezoagli, E.; Pham, T.; McNicholas, B.A.; Fan, E.; Bellani, G.; Rubenfeld, G.; Pesenti, A.M.; Laffey, J.G.; LUNG SAFE Investigators; et al. Patterns of Use of Adjunctive Therapies in Patients with Early Moderate to Severe ARDS: Insights From the LUNG SAFE Study. Chest 2020, 157, 1497–1505. [Google Scholar] [CrossRef] [PubMed]
- Guérin, C.; Beuret, P.; Constantin, J.M.; Bellani, G.; Garcia-Olivares, P.; Roca, O.; Meertens, J.H.; Maia, P.A.; Becher, T.; Peterson, J.; et al. A prospective international observational prevalence study on prone positioning of ARDS patients: The APRONET (ARDS Prone Position Network) study. Intensive Care Med. 2018, 44, 22–37. [Google Scholar] [CrossRef] [PubMed]
- Stilma, W.; Van Meenen, D.M.; Valk, C.M.; De Bruin, H.; Paulus, F.; Serpa Neto, A.; Schultz, M.J.; PRoVENT-COVID Collaborative Group. Incidence and Practice of Early Prone Positioning in Invasively Ventilated COVID-19 Patients-Insights from the PRoVENT-COVID Observational Study. J. Clin. Med. 2021, 10, 4783. [Google Scholar] [CrossRef]
- Perier, F.; Tuffet, S.; Maraffi, T.; Alcala, G.; Victor, M.; Haudebourg, A.-F.; Razazi, K.; De Prost, N.; Amato, M.; Carteaux, G.; et al. Electrical impedance tomography to titrate positive end-expiratory pressure in COVID-19 acute respiratory distress syndrome. Crit. Care 2020, 24, 678. [Google Scholar] [CrossRef]
- Elharrar, X.; Trigui, Y.; Dols, A.M.; Touchon, F.; Martinez, S.; Prud’homme, E.; Papazian, L. Use of Prone Positioning in Nonintubated Patients with COVID-19 and Hypoxemic Acute Respiratory Failure. JAMA 2020, 323, 2336–2338. [Google Scholar] [CrossRef]
- Hallifax, R.J.; Porter, B.M.; Elder, P.J.; Evans, S.B.; Turnbull, C.D.; Hynes, G.; Lardner, R.; Archer, K.; Bettinson, H.V.; Nickol, A.H.; et al. Successful awake proning is associated with improved clinical outcomes in patients with COVID-19: Single-centre high-dependency unit experience. BMJ Open Respir. Res. 2020, 7, e000678. [Google Scholar] [CrossRef]
- Fazzini, B.; Page, A.; Pearse, R.; Puthucheary, Z. Prone positioning for non-intubated spontaneously breathing patients with acute hypoxaemic respiratory failure: A systematic review and meta-analysis. Br. J. Anaesth. 2022, 128, 352–362. [Google Scholar] [CrossRef]
- Brunelle, T.; Prud’Homme, E.; Alphonsine, J.-E.; Baumstarck, K.; Sanz, C.; Salmi, S.; Peres, N.; Forel, J.-M.; Papazian, L.; Hraiech, S.; et al. Awake prone position in COVID-19 acute respiratory failure: A randomised crossover study using electrical impedance tomography. ERJ Open Res. 2023, 9. [Google Scholar] [CrossRef]
- Dos Santos Rocha, A.; Diaper, J.; Balogh, A.L.; Marti, C.; Grosgurin, O.; Habre, W.; Peták, F.; Südy, R. Effect of body position on the redistribution of regional lung aeration during invasive and non-invasive ventilation of COVID-19 patients. Sci. Rep. 2022, 12, 11085. [Google Scholar] [CrossRef]
- Brunin, Y.; Despres, C.; Pili-Floury, S.; Besch, G. Lung Recruiting Effect of Prone Positioning in Spontaneously Breathing Patients with COVID-19 Assessed by Electrical Impedance Tomography. Am. J. Respir. Crit. Care Med. 2021, 204, 476–477. [Google Scholar] [CrossRef] [PubMed]
- Brochard, L.; Slutsky, A.; Pesenti, A. Mechanical Ventilation to Minimize Progression of Lung Injury in Acute Respiratory Failure. Am. J. Respir. Crit. Care Med. 2017, 195, 438–442. [Google Scholar] [CrossRef]
- Pulletz, S.; Krukewitt, L.; Gonzales-Rios, P.; Teschendorf, P.; Kremeier, P.; Waldmann, A.; Zitzmann, A.; Müller-Graf, F.; Acosta, C.; Tusman, G.; et al. Dynamic relative regional strain visualized by electrical impedance tomography in patients suffering from COVID-19. J. Clin. Monit. Comput. 2022, 36, 975–985. [Google Scholar] [CrossRef] [PubMed]
- Myatra, S.N.; Alhazzani, W.; Belley-Cote, E.; Møller, M.H.; Arabi, Y.M.; Chawla, R.; Chew, M.S.; Einav, S.; Ergan, B.; Kjær, M.N.; et al. Awake Proning in Patients with COVID-19-related hypoxemic acute respiratory failure: A Rapid Practice Guideline. Acta Anaesthesiol. Scand. 2023, 67, 569–575. [Google Scholar] [CrossRef] [PubMed]
- Otáhal, M.; MlčEk, M.; Borges, J.B.; Alcala, G.C.; Hladík, D.; Kuriščák, E.; Tejkl, L.; Amato, M.; Kittnar, O. Prone positioning may increase lung overdistension in COVID-19-induced ARDS. Sci. Rep. 2022, 12, 16528. [Google Scholar] [CrossRef] [PubMed]
- Roldán, R.; Rodriguez, S.; Barriga, F.; Tucci, M.; Victor, M.; Alcala, G.; Villamonte, R.; Suárez-Sipmann, F.; Amato, M.; Brochard, L.; et al. Sequential lateral positioning as a new lung recruitment maneuver: An exploratory study in early mechanically ventilated COVID-19 ARDS patients. Ann. Intensive Care 2022, 12, 13. [Google Scholar] [CrossRef]
- Mlček, M.; Otáhal, M.; Borges, J.B.; Alcala, G.C.; Hladík, D.; Kuriščák, E.; Tejkl, L.; Amato, M.; Kittnar, O. Targeted lateral positioning decreases lung collapse and overdistension in COVID-19-associated ARDS. BMC Pulm. Med. 2021, 21, 133. [Google Scholar] [CrossRef]
- Zitzmann, A.; Pulletz, S.; Gonzales-Rios, P.; Frenkel, P.; Teschendorf, P.; Kremeier, P.; Löser, B.; Krukewitt, L.; Reuter, D.A.; Böhm, S.H.; et al. Regional ventilation in spontaneously breathing COVID-19 patients during postural maneuvers assessed by electrical impedance tomography. Acta Anaesthesiol. Scand. 2023, 67, 185–194. [Google Scholar] [CrossRef]
- Zhao, Z.; Zhang, J.-S.; Chen, Y.-T.; Chang, H.-T.; Hsu, Y.-L.; Frerichs, I.; Adler, A. The use of electrical impedance tomography for individualized ventilation strategy in COVID-19: A case report. BMC Pulm. Med. 2021, 21, 38. [Google Scholar] [CrossRef]
- Rauseo, M.; Mirabella, L.; Laforgia, D.; Lamanna, A.; Vetuschi, P.; Soriano, E.; Ugliola, D.; Casiello, E.; Tullo, L.; Cinnella, G. A Pilot Study on Electrical Impedance Tomography During CPAP Trial in Patients with Severe Acute Respiratory Syndrome Coronavirus 2 Pneumonia: The Bright Side of Non-invasive Ventilation. Front. Physiol. 2021, 12, 728243. [Google Scholar] [CrossRef]
- Fu, Y.; Zou, R.; Wang, S.; Wen, J.; Rong, L.; Tang, M.; Yu, B.; Cen, F.; Zhao, Z.; Frerichs, I.; et al. Monitoring bronchoalveolar lavage with electrical impedance tomography: First experience in a patient with COVID-19. Physiol. Meas. 2020, 41, 085008. [Google Scholar] [CrossRef] [PubMed]
- Scaramuzzo, G.; Ronzoni, L.; Campo, G.; Priani, P.; Arena, C.; La Rosa, R.; Turrini, C.; Volta, C.A.; Papi, A.; Spadaro, S.; et al. Long-term dyspnea, regional ventilation distribution and peripheral lung function in COVID-19 survivors: A 1 year follow up study. BMC Pulm. Med. 2022, 22, 408. [Google Scholar] [CrossRef] [PubMed]


| Aim | Method | Author, Year | Study Design | Sample Size | Population | Intervention | Main Findings | Limitations | Future Directions |
|---|---|---|---|---|---|---|---|---|---|
| Best PEEP | Compliance-based approach [17] | Hsu et al., 2021 [42] | Prospective randomised controlled trial | EIT: n = 42 PV curve: n = 45 | Moderate-to-severe ARDS | EIT guided PEEP at the intercept point of cumulated alveolar overdistension and collapse. PV curve guided PEEP at the point of maximal hysteresis. | Lower driving pressure and higher surviving rate in the EIT group (69% versus 44.4%). | The selected PEEP was fixed for the first 48 h; more frequent PEEP titration might be valuable. | What is the effect of PEEP titration over a longer period of time |
| Compliance-based approach | He et al., 2021 [40] | Prospective randomized controlled trial | EIT: n = 61 Lower PEEP/FiO2-table: n = 56 | ARDS | EIT guided PEEP at the intercept point of cumulated alveolar overdistension and collapse. If the intercept was between two PEEP steps, the PEEP level with the lowest GI was selected. Control group: lower PEEP/FiO2-table | A non-significant decrease of 6% mortality and a significant improvement in organ function at day 2 in the EIT group. | The effect of prone positioning on the results and outcomes was not analysed. | Could early EIT-guided PEEP setting significantly decrease mortality in ARDS | |
| Compliance-based approach | Heines et al., 2019 [31] | Retrospective analysis | N = 39 | ARDS | PEEP set at the intercept point of cumulated alveolar overdistension and collapse, compared to the ARDS network PEEP/FiO2-table and clinician-based PEEP. | In approximately two-thirds of the patients, EIT-guided PEEP differed from physicians’ set PEEP and from the ARDS network PEEP/FiO2-table. | Retrospective analysis without outcome data | Is EIT-guided PEEP superior to physicians’ set PEEP or the ARDS network table on oxygenation and respiratory mechanics | |
| EELI | Eronia et al., 2017 [49] | Feasibility study | N = 16 | Acute hypoxic respiratory failure | PEEP was set after recruitment manoeuvres until EELI maintained stability over time. | EIT-guided PEEP was feasible and led to a higher PEEP level compared to the ARDS network PEEP/FiO2 table, resulting in improved oxygenation. and a decrease in driving pressure | EELI tracing could not successfully detect the PEEP level associated with sustained recruitment in 2 out of the 16 patients. | Does this strategy of titrating PEEP result in a decrease in ventilator-induced lung injury | |
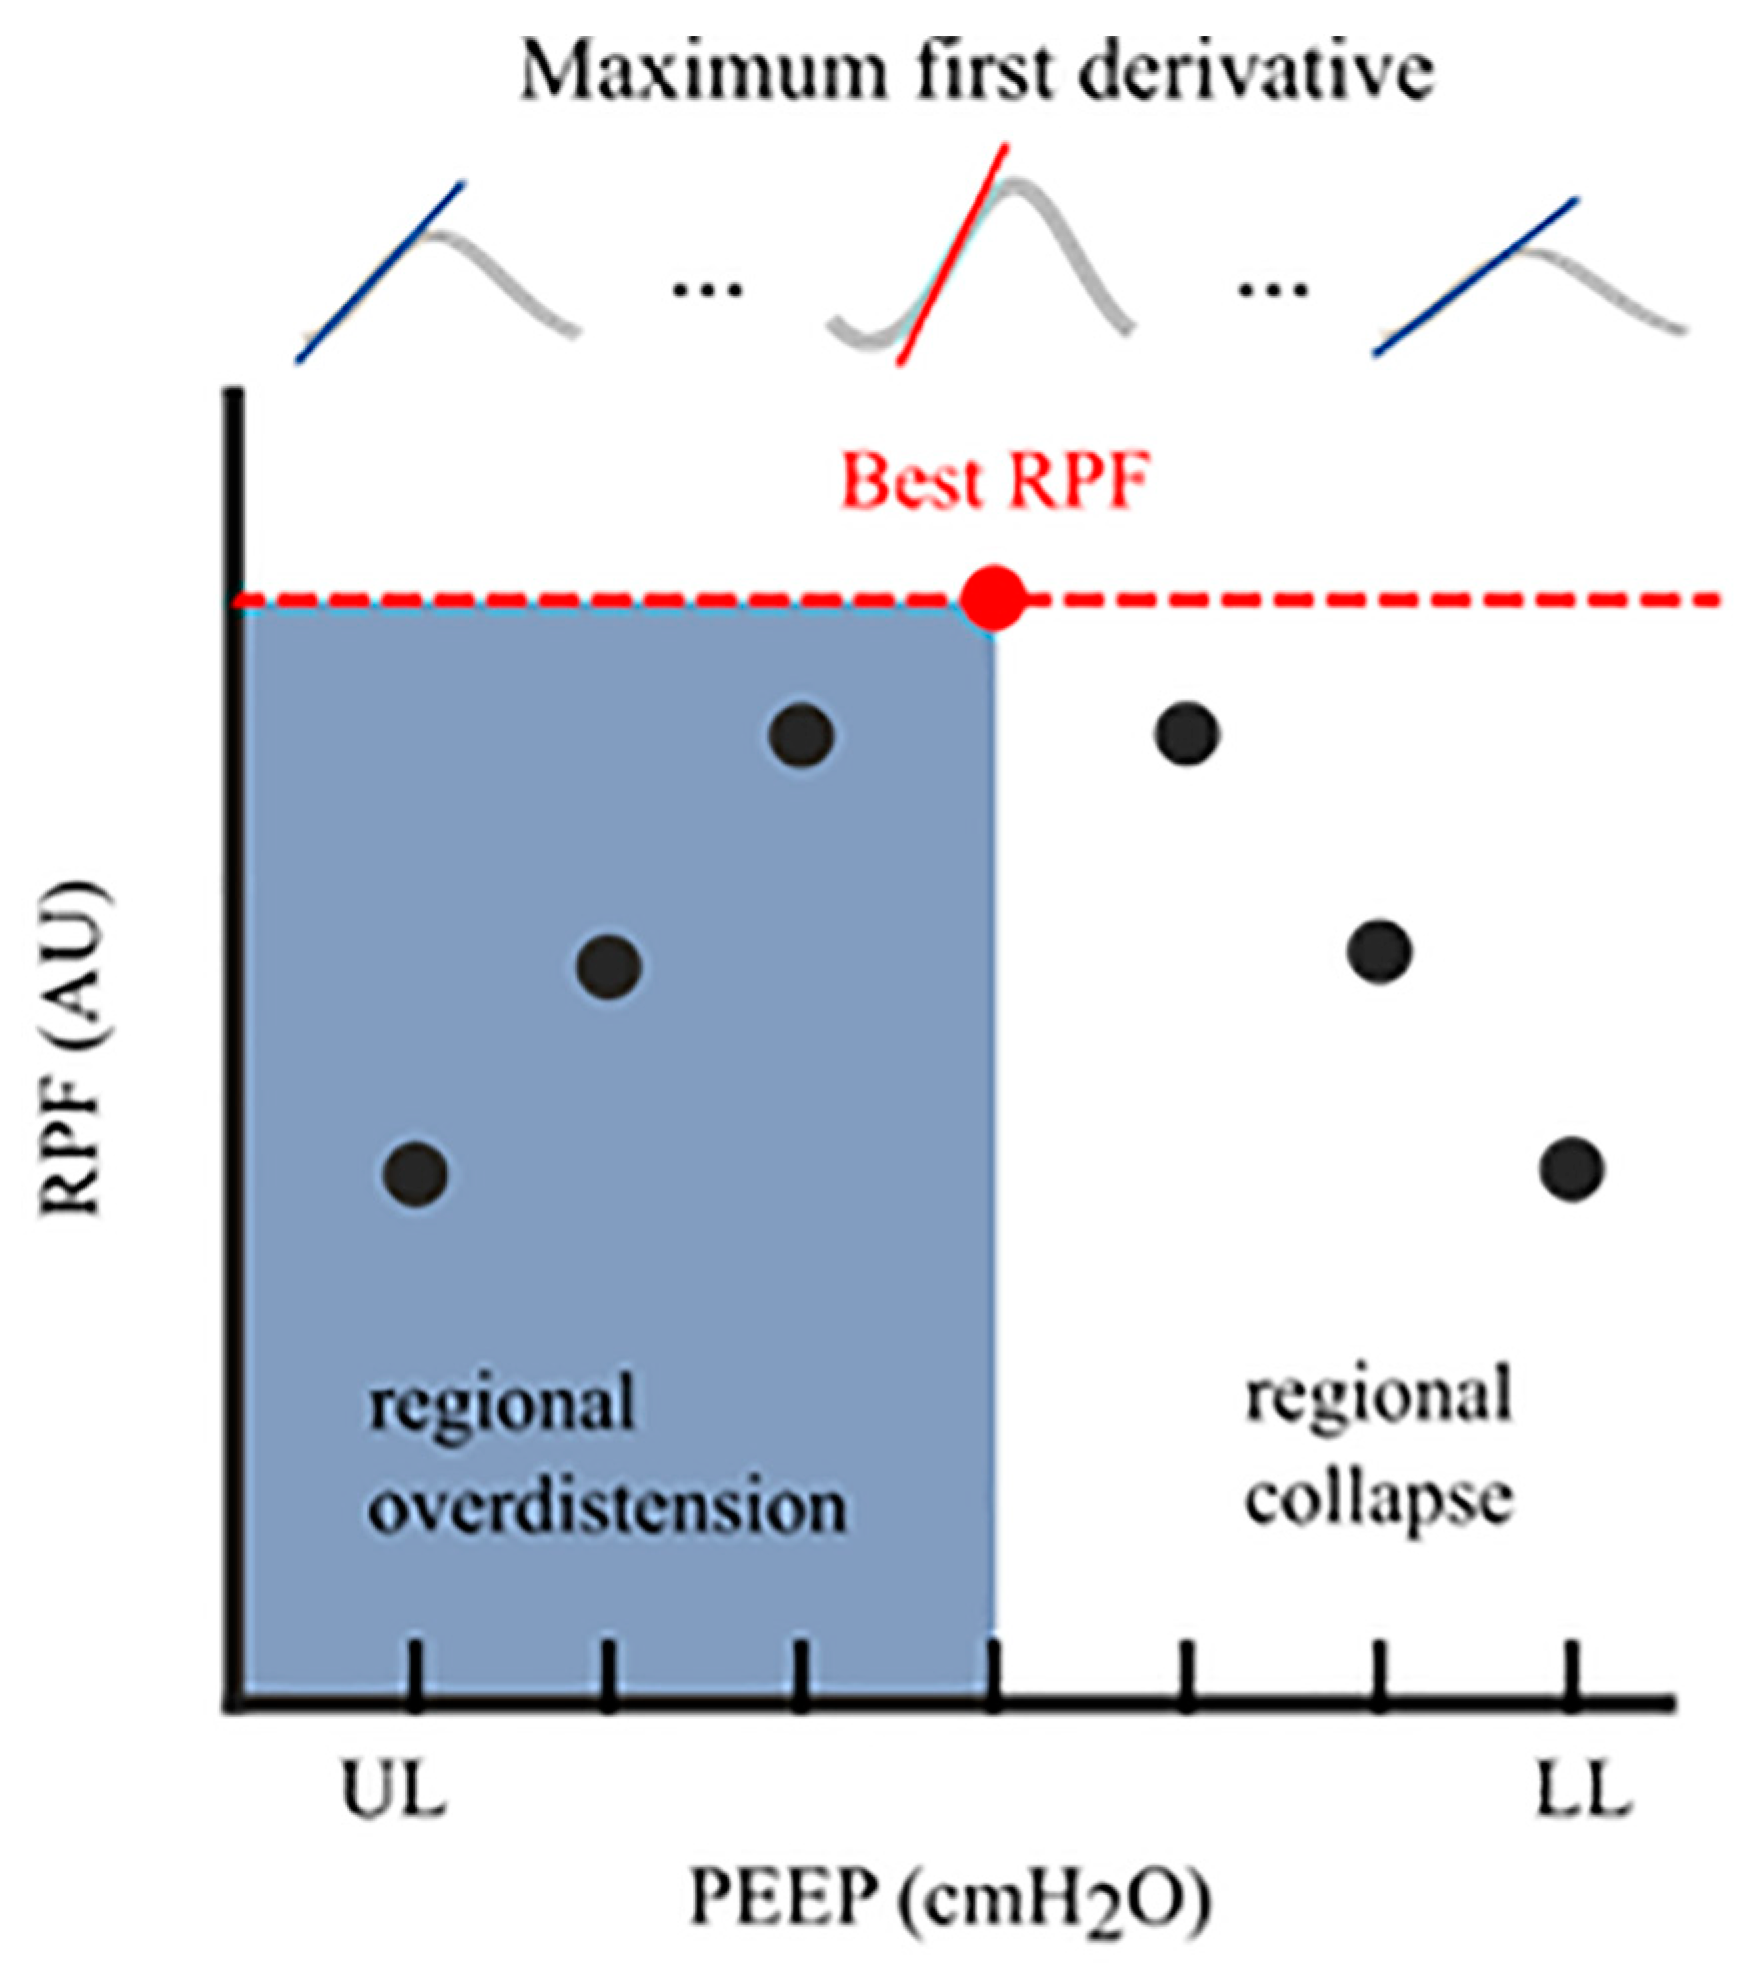
| Regional peak-flow | de Jongh et al., 2023 [19] | An observational validation study in a prospective cohort | N = 78 | COVID-19 ARDS | Cumulative overdistension and cumulative collapse rates are calculated based on the highest regional peak flow and validated with the compliance-based approach to use in spontaneously breathing patients. | The regional peak-flow approach showed good agreement with the compliance-based approach and, therefore, might be a valid method to quantify regional lung mechanics in spontaneously breathing patients. | Validation was only performed in COVID-19 patients. | Would ventilator settings based on this algorithm improve patients’ outcomes and reduce the weaning duration | |
| Inhomogeneity | A/P ratio | Mauri et al., 2013 [67] | Prospective randomised cross-over study | N = 10 | Mild-to-moderate ARDS | Evaluating ventral to dorsal changes in ventilation distribution while increasing/decreasing PEEP and/or PS. | Higher PEEP and lower PS increased the fraction of tidal ventilation reaching dependent lung regions. | The results may not apply to patients with severe ARDS. | What is the mechanism at the basis of the observed redistribution of ventilation (e.g., alveolar recruitment, increased diaphragm activity) |
| CoV | Frerichs et al., 1998 [69] | Prospective observational study | N = 10 | Patients scheduled for elective laparotomy | The CoV was calculated during spontaneous breathing and different modes of mechanical ventilation. | There are differences in ventilation distribution between spontaneous breathing and different ventilation modes. Ventilation distribution was larger in the dorsal lung during spontaneous breathing. | Only patients with healthy lungs were studied. | How does the CoV change in injured lungs and with different PEEP levels | |
| GI | Zhao et al., 2014 [86] | Retrospective analysis | ARDS: n = 18 Lung-healthy patients: n = 8 | ARDS and lung-healthy | A constant low-flow inflation manoeuvre was performed. Recruited lung regions were identified where local impedance amplitudes exceeded 10% of the maximum amplitude during the manoeuvre. | GI highly correlates with lung recruitability. | The gold standard for identifying collapsed lung regions (CT) was missing. | Correlates GI also with alveolar recruitment in standard recruitment manoeuvres | |
| GI | Becher et al., 2015 [87] | Retrospective analysis | N = 9 | ARDS | Lower and higher tidal volume was used at a PEEP level of 2 cmH2O below and 5 cmH2O above the lower inflexion point. | High tidal volumes may lead to a lower GI, especially at low PEEP settings. | Two different EIT devices were used, which may have influenced the results. | What is the influence of respiratory rate and posture on GI | |
| Prevent atelectrauma | RVD | Wrigge et al., 2008 [18] | Randomised prospective experimental study | N = 16 | Pigs with direct, indirect acute lung injury (n = 10) and healthy lungs (n = 6) | During slow inflation, simultaneous measurements of regional ventilation by EIT and dynamic CT. | RVD correlated well with recruited volume as measured by CT. | Experimental model, comparison with patients with lung injury should be made with caution. Control group was measured later in time and was, therefore, not randomised. | Develop a method to detect atelectrauma during normal (ongoing) mechanical ventilation |
| Oxygenation improvement using posture | Prone position | Spaeth et al., 2016 [104] | Prospective clinical study | N = 45 | Patients with healthy lungs undergoing lumbar spine surgery | Patients were examined in the supine and prone position at a PEEP of 6, 9, and 12 cmH2O. | Commonly measured Crs do not reflect the differences in respiratory mechanics between supine and prone posture. Intra-tidal compliance profile revealed substantial differences in lung condition between both postures. | In prone position, chest and pelvis were supported with pads, which allows free movement of the abdomen and lower chest wall, causing lower intra-abdominal and intra-thoracic pressure. These findings only apply when free abdominal movements are ensured. | Is higher PEEP needed in prone position in affected lungs |
| Prone position | Wang et al., 2022 [105] | Prospective physiological study | N = 10 | ARDS | EIT evaluation at ignition of prone positioning, 3 h after and at the end of the first prone session | Increased ventilation in the dorsal regions without affecting ventral regions early after prone position. Resulting in increased PaO2/FiO2 ratio | The EIT assessment was only measured at 3 time points during prone position. Changes in ventilation distribution were not compared after turning to the supine position again. | What is the effect on ventilation distribution and oxygenation after prolonged prone positioning after turning back to the supine position | |
| Prone position and alveolar recruitment | Martinsson et al., 2021 [107] | Randomised controlled trial | N = 30 | Patients after uncomplicated cardiac surgery | Alveolar recruitment manoeuvre in either the supine or the prone position. | Early after cardiac surgery, a lung recruitment manoeuvre in prone position improves oxygenation, dorsal ventilation and dorsal end-expiratory lung volume compared to the supine position. | There is a lack of FRC measurement after extubation. | What is the difference in effect on end-expiratory lung volume and oxygenation after a recruitment manoeuvre in patients with diseased lungs, comparing prone versus supine position | |
| Diagnostic applications | Airway clearance | Garofalo et al., 2023 [122] | Physiological pilot study | N = 15 | Tracheostomised patients undergoing mechanical ventilation | Use short HFPV cycles to investigate the effect on lung aeration and gas exchange. | Short cycles of HFPV superimposed on mechanical ventilation promoted alveolar recruitment and improved oxygenation in tracheostomised patients with high load of secretion. | Small sample size and a heterogeneous population. The definition of a hypersecretive patient is arguable. | Does HFPV increase oxygenation and ventilation in patients with atelectasis |
| Tube placement | Steinmann et al., 2008 [125] | Feasibility study | N = 40 | Patients requiring insertion of left-sided double-lumen tubes for one-lung ventilation during thoracic surgery | EIT was recorded during two-lung ventilation before induction of anaesthesia and after double-lumen tube placement and during one-lung ventilation in the supine and subsequently in the lateral position. | EIT enables online recognition of misplacement of left-sided double-lumen tubes in the contralateral main bronchus. However, as distribution of ventilation did not correlate with endobronchial cuff placement, EIT cannot replace fibreoptic bronchoscopy. | EIT was only used in the presence of left-sided double-lumen tubes. | Does EIT in right-sided double-lumen tube placement require additional definitions to account for the regional ventilation of the right upper lobe | |
| Pleural effusion | Rara et al., 2020 [131] | Prospective interventional study | N = 19 (6 excluded) | Ventilated patients with indication for pleural effusion drainage | Compare changes in EELI and EELV in response to the pleural effusion evacuation | The increase in EELI overestimated the increase in EELV, probably due to the removal of conductive effusion fluid | EELV is a global ventilation parameter, while EIT measurements are focused only on the cross-section within the wide plane of the belt | Estimating the amount of pleural fluid | |
| Pneumothorax | Yang et al., 2023 [135] | Retrospective cohort study | N = 203 (25 with PTX) | Mechanically ventilated patients who received EIT measurements in the supine position | Tidal impedance variation images were divided into four quadrants of equal size to track ventilation distribution in different regions of interest. | Regional ventilation defects can be observed in mechanically ventilated patients with PTX, requiring further diagnostics to confirm. | The baseline EIT in patients with a PTX before the onset was not recorded. Furthermore, the dynamic evolution of the PTX was not monitored. | Developing an algorithm that provides an alert in the presence of a PTX | |
| Pulmonary oedema | Zhao et al., 2019 [137] | Prospective observational study | N = 14 | ARDS | Patients were rotated laterally along their longitudinal axis from the supine position to 45-degree left and right tilt to induce gravity-dependent redistribution of pulmonary oedema. | Postural changes did not reflect total extra-vascular lung water content. | Non-reproducible results may be introduced by measurement error of the trans-pulmonary thermodilution technique. No other reference technique was used. | Develop advanced measures to assess the level of pulmonary oedema | |
| Chronic lung diseases | Zhao et al., 2020 [140] | Prospective observational study | N = 25 | Exacerbation of COPD and asthma | EIT measurements were conducted before and one hour after inhaling medication on two consecutive days. | Regional end-expiratory flow characterises air trapping, providing diagnostic information for monitoring the treatment of COPD and asthma patients. | No systematic clinical intervention was used to reduce air trapping. | What is the most effective way of medication nebulisation, and with which device |
Disclaimer/Publisher’s Note: The statements, opinions and data contained in all publications are solely those of the individual author(s) and contributor(s) and not of MDPI and/or the editor(s). MDPI and/or the editor(s) disclaim responsibility for any injury to people or property resulting from any ideas, methods, instructions or products referred to in the content. |
© 2023 by the authors. Licensee MDPI, Basel, Switzerland. This article is an open access article distributed under the terms and conditions of the Creative Commons Attribution (CC BY) license (https://creativecommons.org/licenses/by/4.0/).
Share and Cite
Heines, S.J.H.; Becher, T.H.; van der Horst, I.C.C.; Bergmans, D.C.J.J. Clinical Applicability of Electrical Impedance Tomography in Patient-Tailored Ventilation: A Narrative Review. Tomography 2023, 9, 1903-1932. https://doi.org/10.3390/tomography9050150
Heines SJH, Becher TH, van der Horst ICC, Bergmans DCJJ. Clinical Applicability of Electrical Impedance Tomography in Patient-Tailored Ventilation: A Narrative Review. Tomography. 2023; 9(5):1903-1932. https://doi.org/10.3390/tomography9050150
Chicago/Turabian StyleHeines, Serge J. H., Tobias H. Becher, Iwan C. C. van der Horst, and Dennis C. J. J. Bergmans. 2023. "Clinical Applicability of Electrical Impedance Tomography in Patient-Tailored Ventilation: A Narrative Review" Tomography 9, no. 5: 1903-1932. https://doi.org/10.3390/tomography9050150
APA StyleHeines, S. J. H., Becher, T. H., van der Horst, I. C. C., & Bergmans, D. C. J. J. (2023). Clinical Applicability of Electrical Impedance Tomography in Patient-Tailored Ventilation: A Narrative Review. Tomography, 9(5), 1903-1932. https://doi.org/10.3390/tomography9050150