Extension of Lung Damage at Chest Computed Tomography in Severely Ill COVID-19 Patients Treated with Interleukin-6 Receptor Blockers Correlates with Inflammatory Cytokines Production and Prognosis
Abstract
1. Introduction
2. Materials and Methods
2.1. Study Population and Treatment for COVID-19
2.2. Clinical, Laboratory Variables Collection and Computed Tomography Acquisitions
2.3. Computed Tomography Image Interpretation
2.4. Statistical Analysis
3. Results
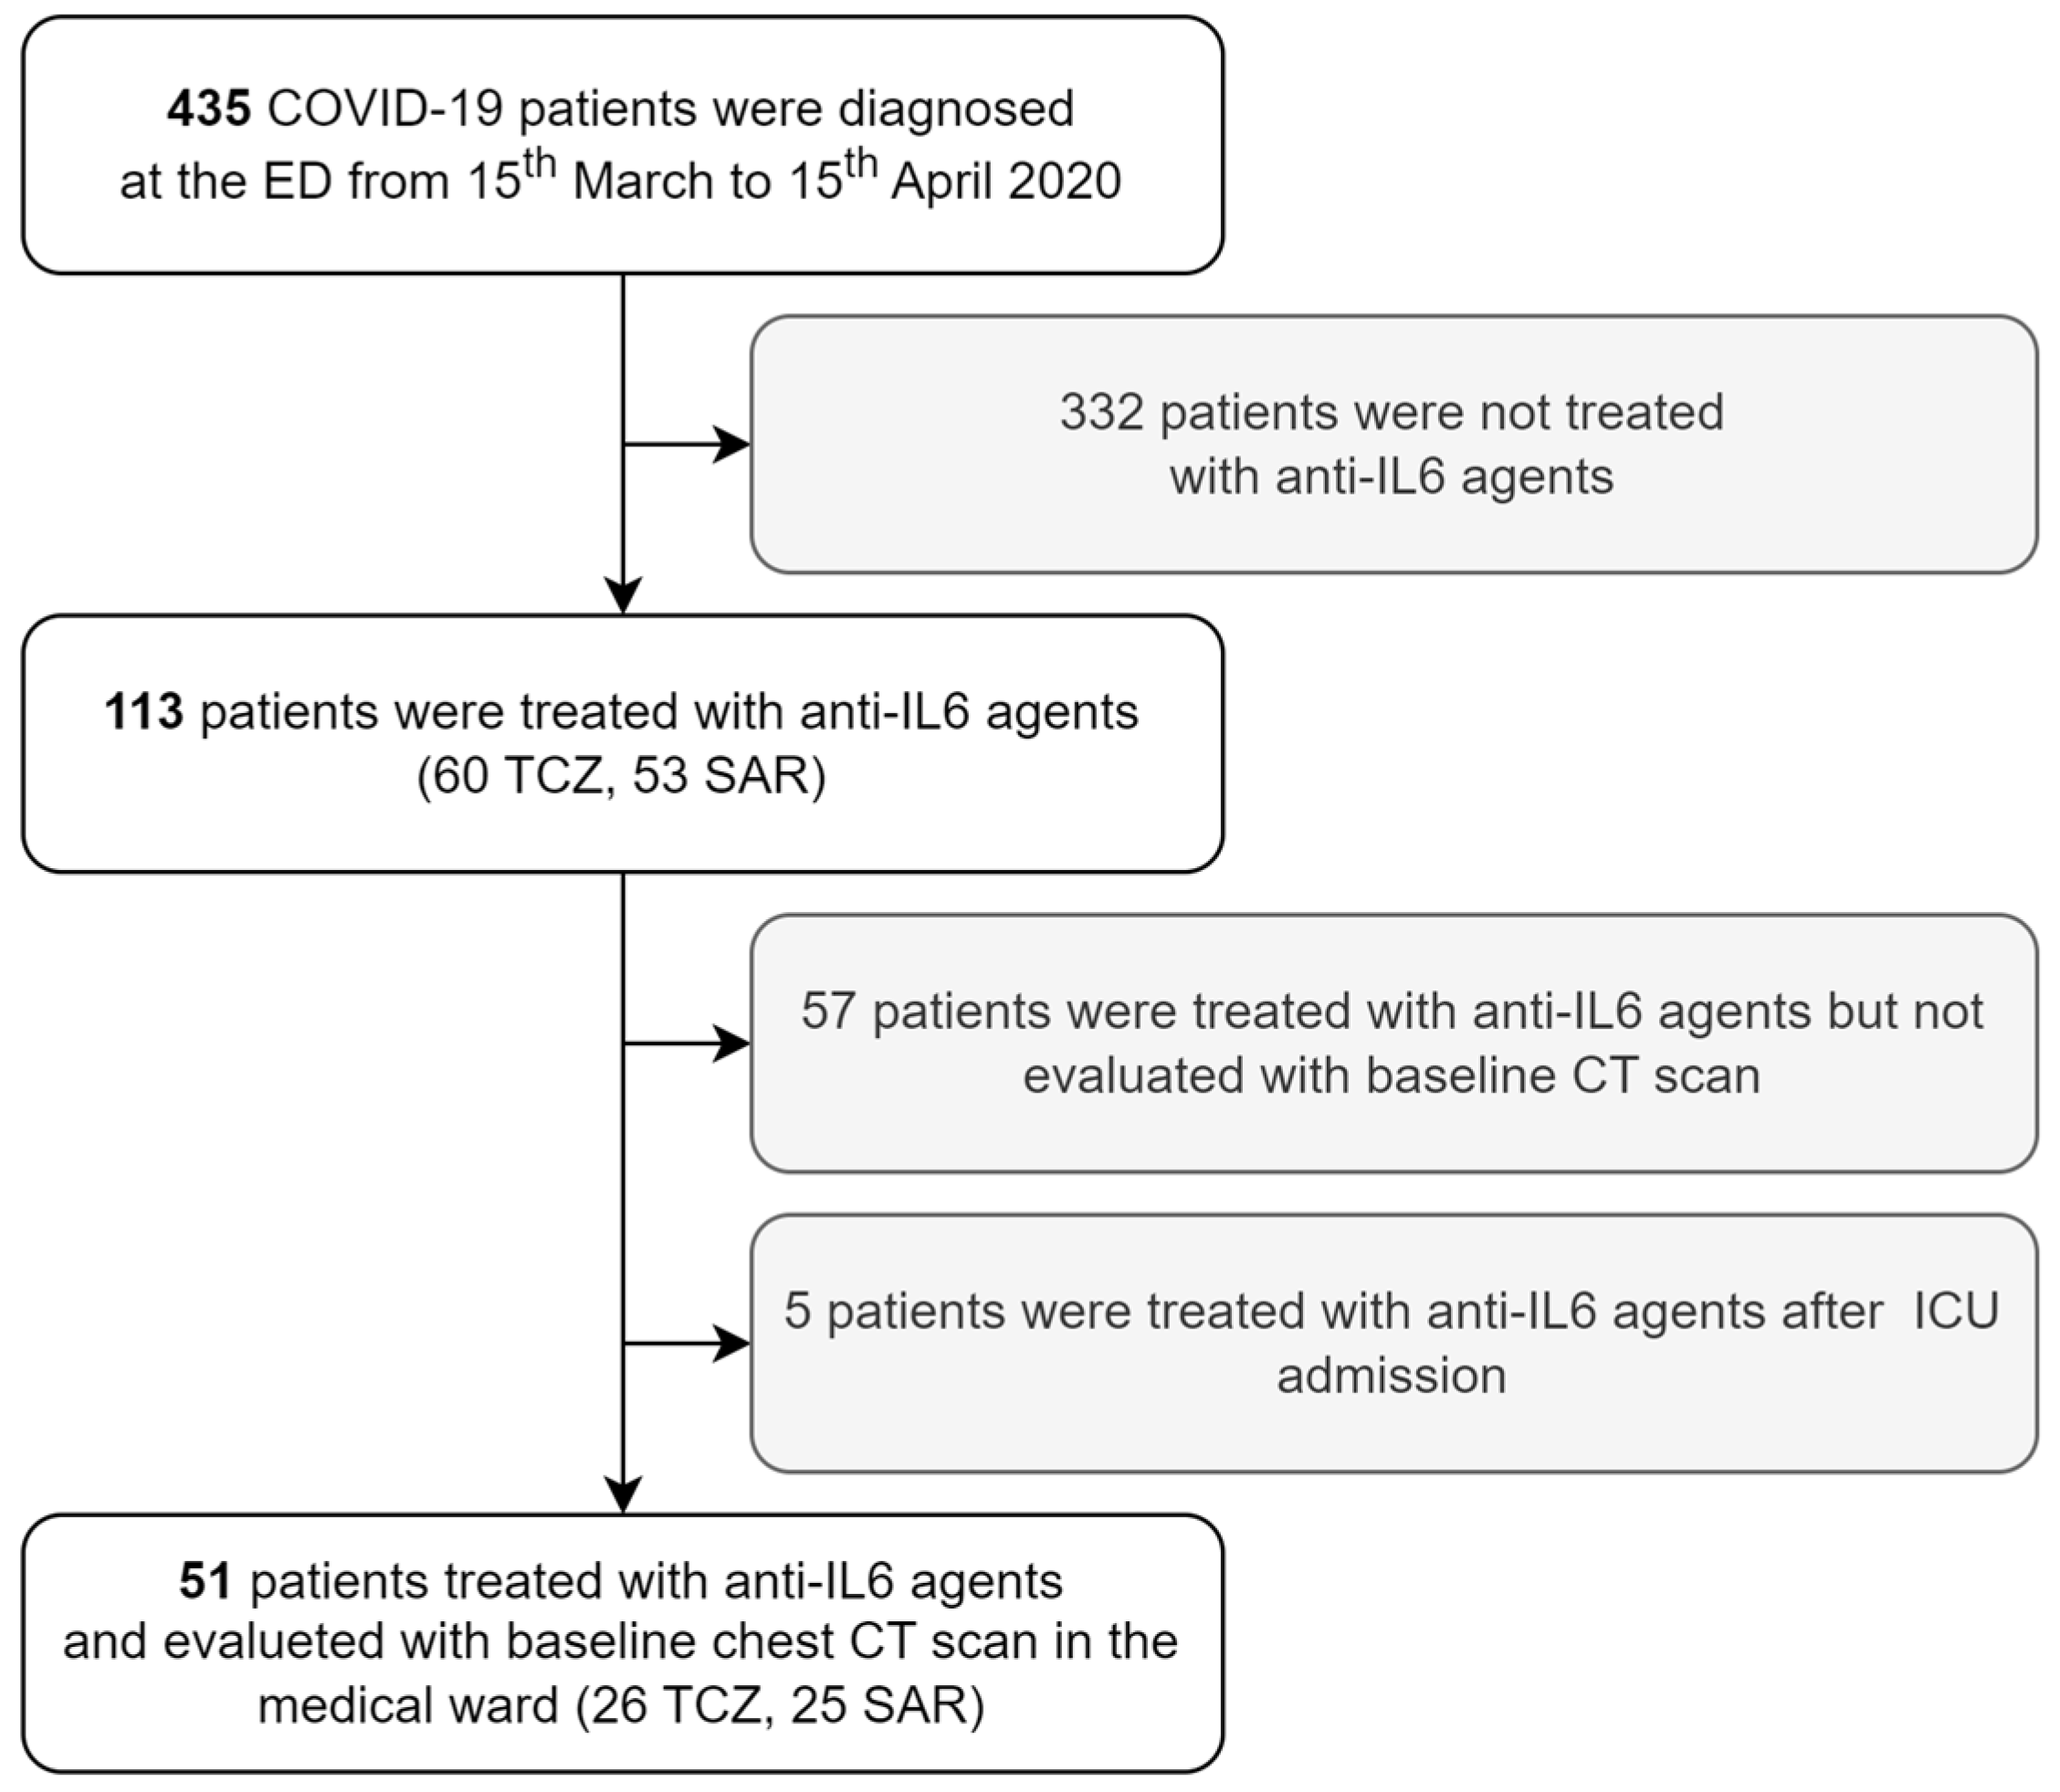
3.1. Study Population Selection
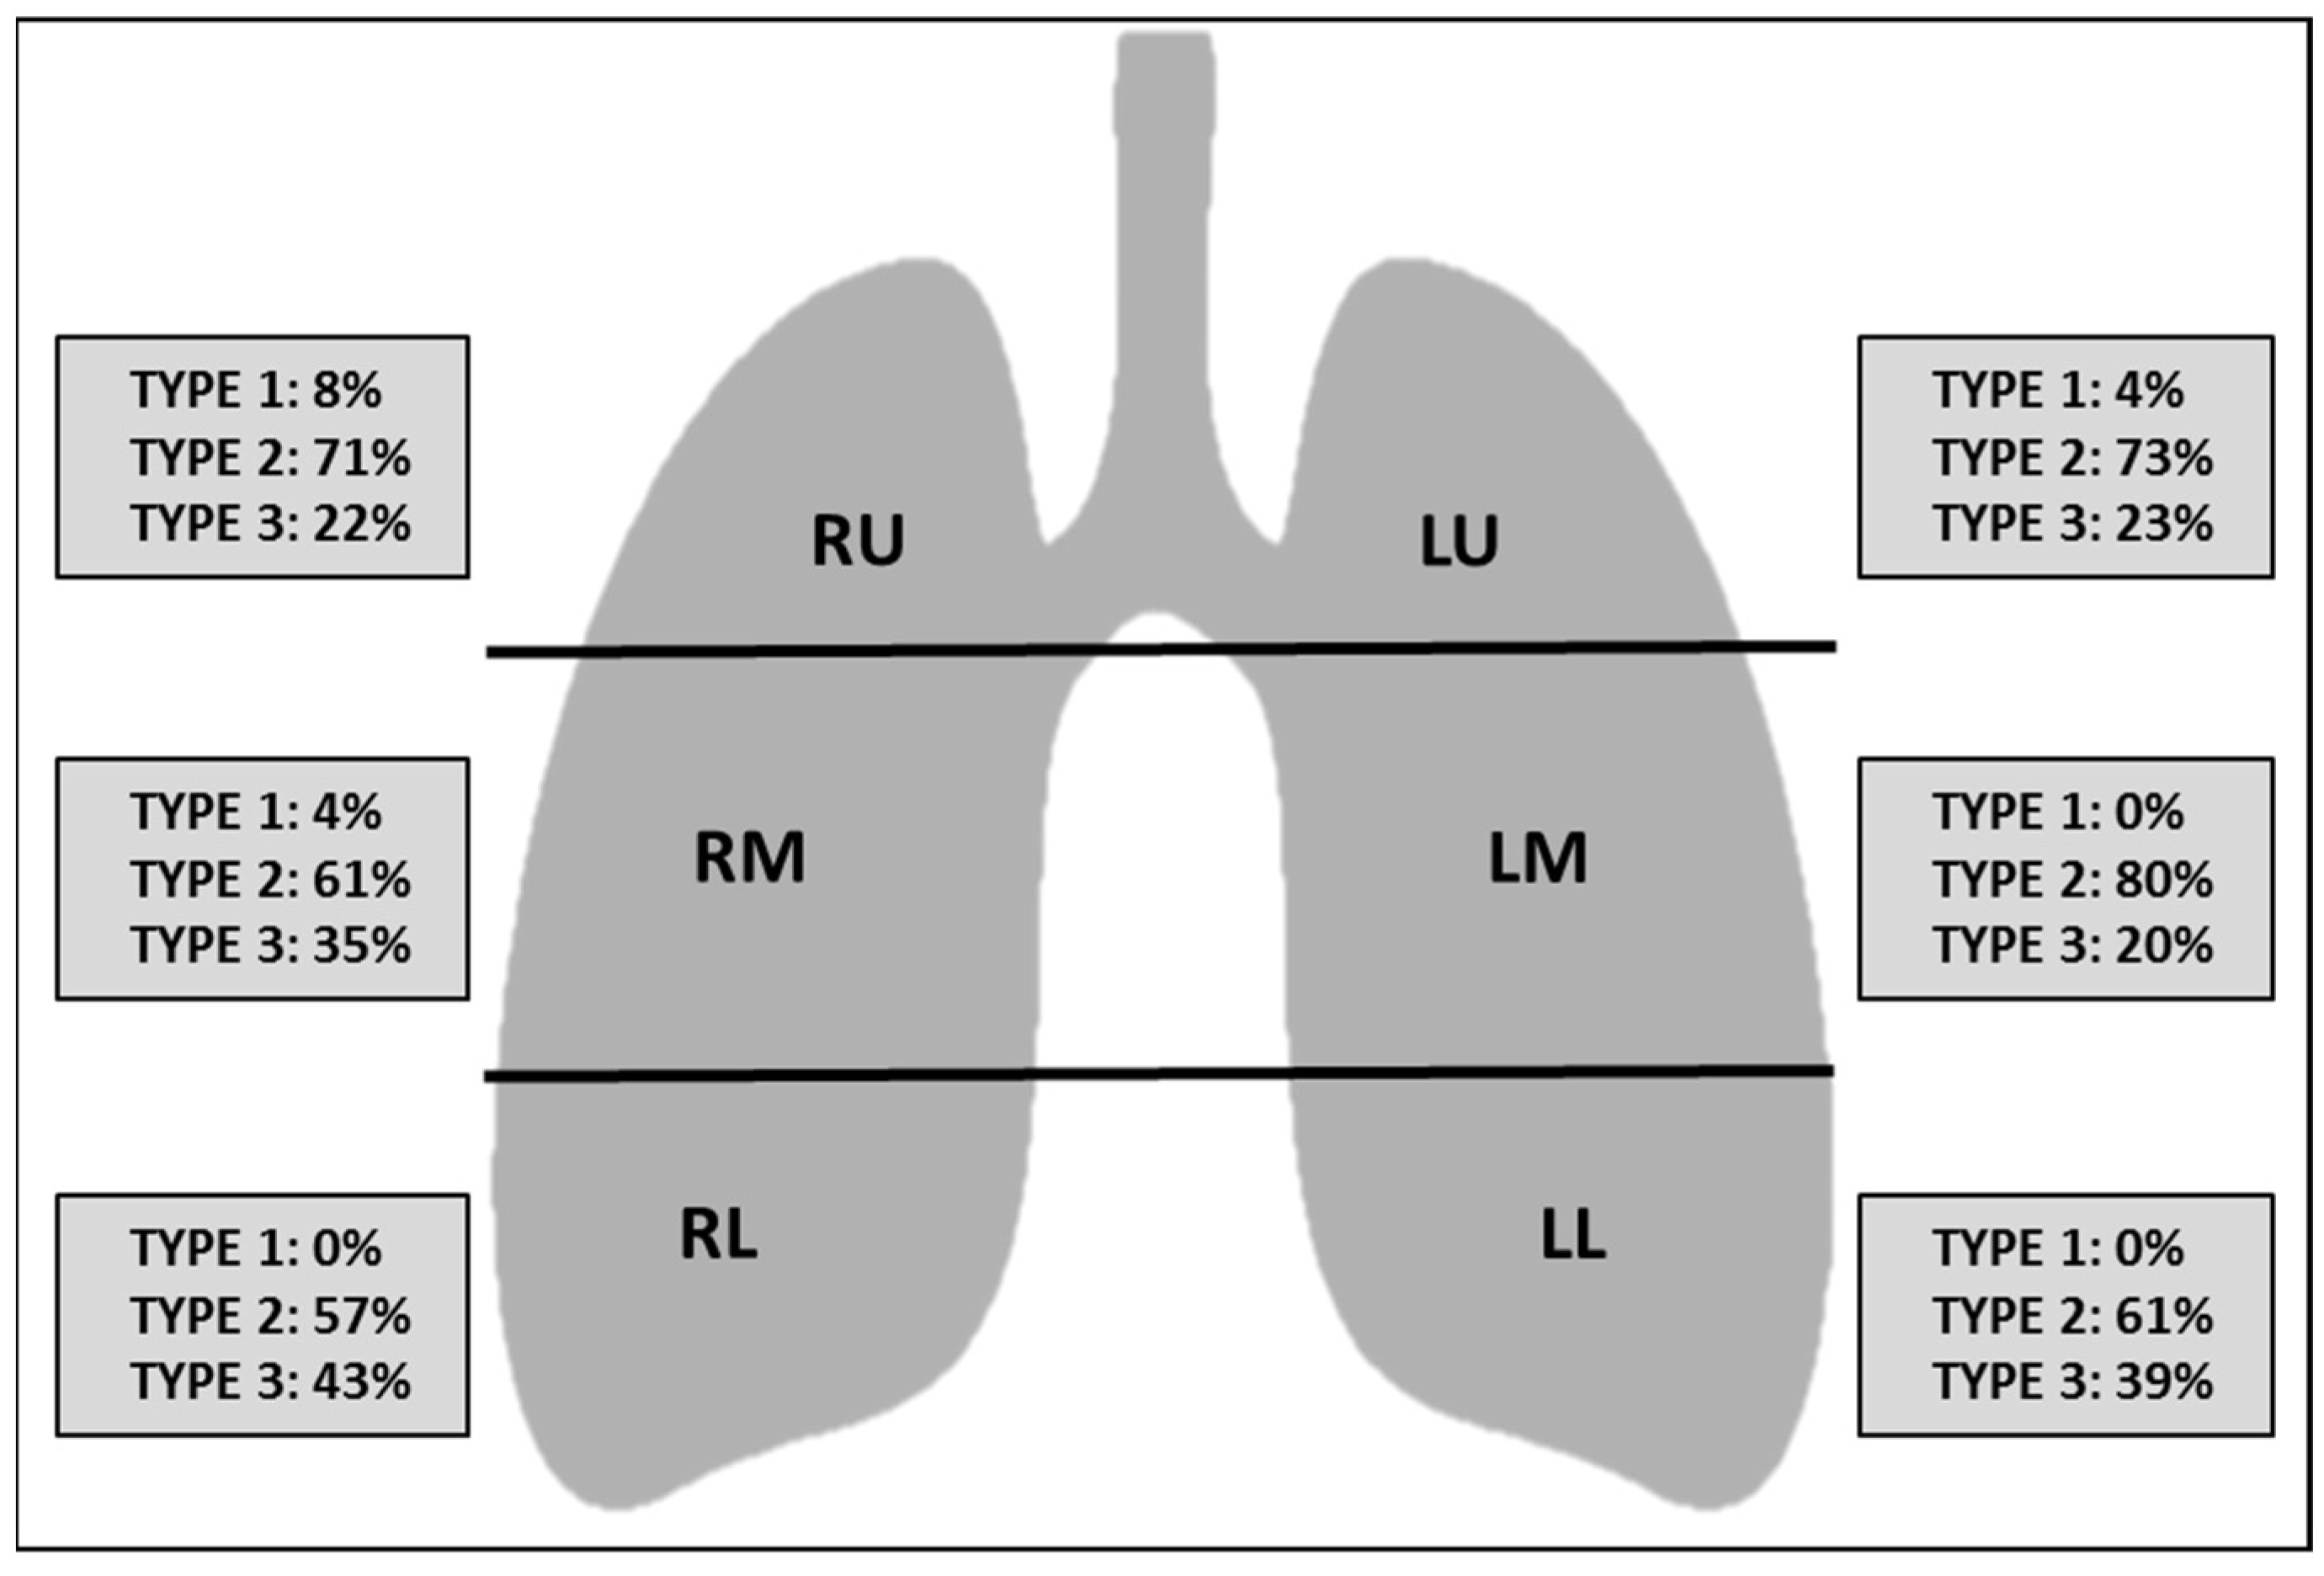
3.2. CT Scores, Clinical Characteristics, and Laboratory Variables
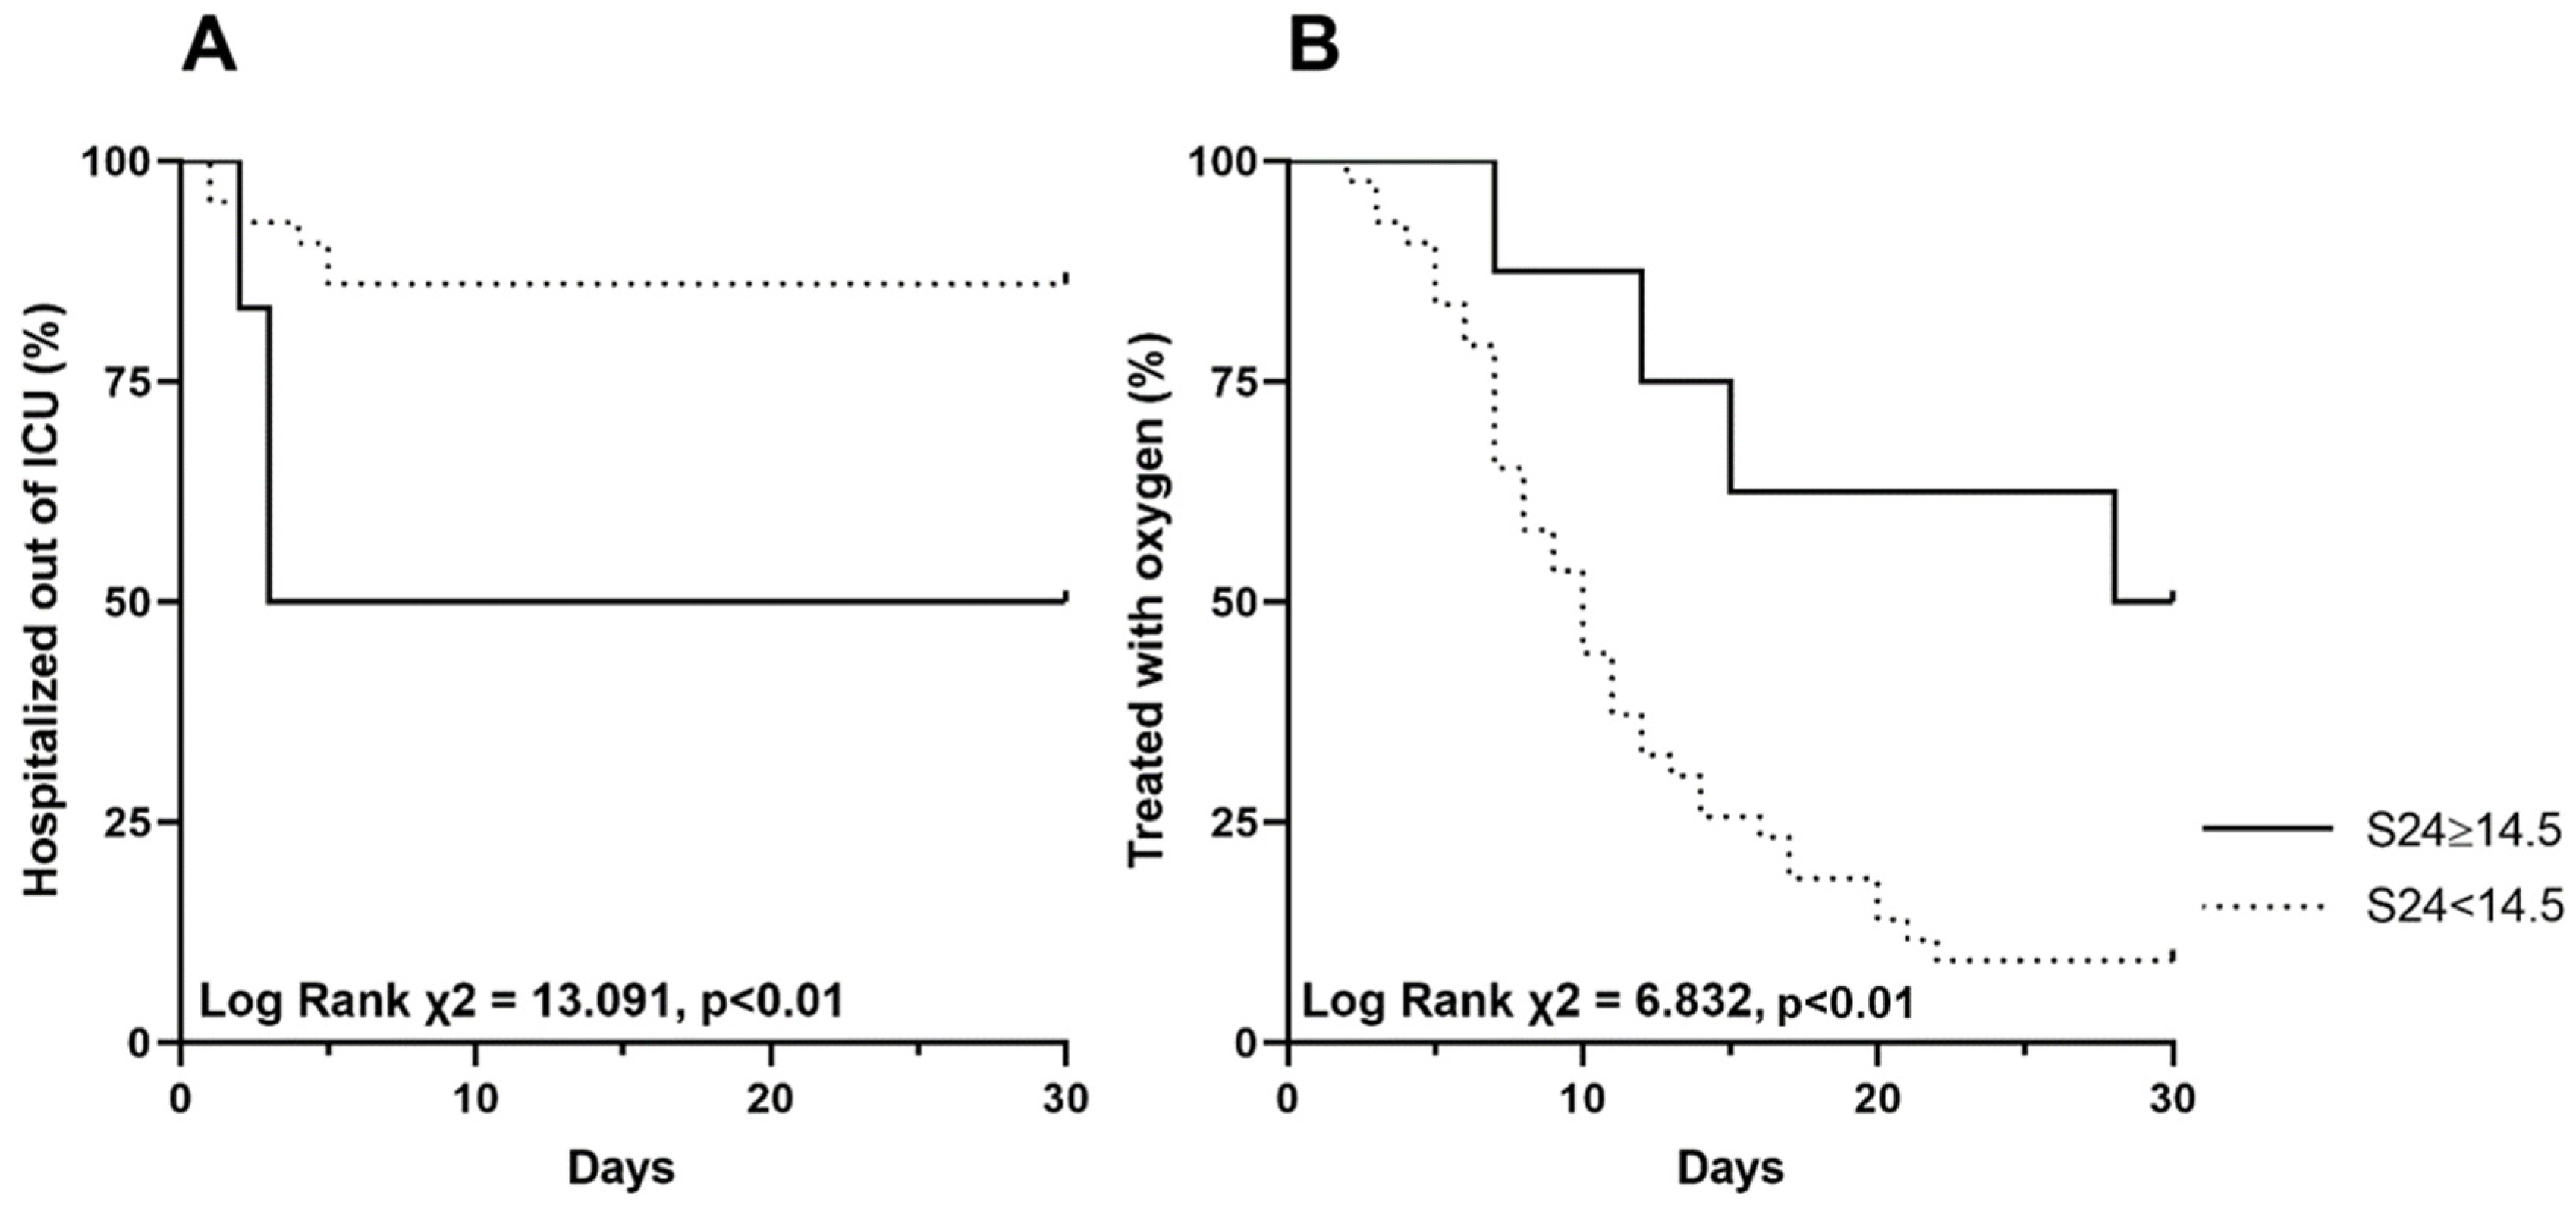
3.3. Predictors of ICU Admission and Oxygen Weaning
4. Discussion
5. Conclusions
Supplementary Materials
Author Contributions
Funding
Institutional Review Board Statement
Informed Consent Statement
Data Availability Statement
Acknowledgments
Conflicts of Interest
References
- The Lancet. Emerging understandings of 2019-nCoV. Lancet 2020, 395, 311. [Google Scholar] [CrossRef] [PubMed]
- Kronbichler, A.; Kresse, D. Asymptomatic patients as a source of COVID-19 infections: A systematic review and meta-analysis. Int. J. Infect. Dis. 2020, 98, 180–186. [Google Scholar] [CrossRef] [PubMed]
- Henderson, L.A.; Canna, S.W. On the Alert for Cytokine Storm: Immunopathology in COVID-19. Arthritis Rheumatol. 2020, 72, 1059–1063. [Google Scholar] [CrossRef] [PubMed]
- McGonagle, D.; Sharif, K. The Role of Cytokines including Interleukin-6 in COVID-19 induced Pneumonia and Macrophage Activation Syndrome-Like Disease. Autoimmun. Rev. 2020, 19, 102537. [Google Scholar] [CrossRef]
- Caricchio, R.; Gallucci, M. Preliminary predictive criteria for COVID-19 cytokine storm. Ann. Rheum. Dis. 2021, 80, 88–95. [Google Scholar] [CrossRef]
- Alijotas-Reig, J.; Esteve-Valverde, E. Immunomodulatory therapy for the management of severe COVID-19. Beyond the anti-viral therapy: A comprehensive review. Autoimmun. Rev. 2020, 19, 102569. [Google Scholar] [CrossRef]
- Cortegiani, A.; Ippolito, M. Rationale and evidence on the use of tocilizumab in COVID-19: A systematic review. Pulmonology 2021, 27, 52–66. [Google Scholar] [CrossRef]
- Gremese, E.; Cingolani, A. Sarilumab use in severe SARS-CoV-2 pneumonia. EClinicalMedicine 2020, 27, 100553. [Google Scholar] [CrossRef]
- Shionoya, Y.; Taniguchi, T. Possibility of deterioration of respiratory status when steroids precede antiviral drugs in patients with COVID-19 pneumonia: A retrospective study. PLoS ONE 2021, 16, e0256977. [Google Scholar] [CrossRef]
- Chung, M.; Bernheim, A. CT Imaging Features of 2019 Novel Coronavirus (2019-nCoV). Radiology 2020, 295, 202–207. [Google Scholar] [CrossRef]
- Larici, A.R.; Cicchetti, G. Multimodality imaging of COVID-19 pneumonia: From diagnosis to follow-up. A comprehensive review. Eur. J. Radiol. 2020, 131, 109217. [Google Scholar] [CrossRef]
- Chen, L.D.; Zhang, Z.Y. Association between cytokine profiles and lung injury in COVID-19 pneumonia. Respir. Res. 2020, 21, 201. [Google Scholar] [CrossRef]
- He, S.; Zhou, C. Relationship between chest CT manifestations and immune response in COVID-19 patients. Int. J. Infect. Dis. 2020, 98, 125–129. [Google Scholar] [CrossRef]
- Colombi, D.; Bodini, F.C. Well-aerated Lung on Admitting Chest CT to Predict Adverse Outcome in COVID-19 Pneumonia. Radiology 2020, 296, E86–E96. [Google Scholar] [CrossRef]
- Francone, M.; Iafrate, F. Chest CT score in COVID-19 patients: Correlation with disease severity and short-term prognosis. Eur. Radiol. 2020, 30, 6808–6817. [Google Scholar] [CrossRef]
- Guillo, E.; Bedmar Gomez, I. COVID-19 pneumonia: Diagnostic and prognostic role of CT based on a retrospective analysis of 214 consecutive patients from Paris, France. Eur. J. Radiol. 2020, 131, 109209. [Google Scholar] [CrossRef]
- Grieser, C.; Goldmann, A. Computed tomography findings from patients with ARDS due to Influenza A (H1N1) virus-associated pneumonia. Eur. J. Radiol. 2012, 81, 389–394. [Google Scholar] [CrossRef]
- Detterbeck, F.C.; Boffa, D.J. The Eighth Edition Lung Cancer Stage Classification. Chest 2017, 151, 193–203. [Google Scholar] [CrossRef]
- Lynch, D.A.; Godwin, J.D. High-resolution computed tomography in idiopathic pulmonary fibrosis: Diagnosis and prognosis. Am. J. Respir. Crit. Care Med. 2005, 172, 488–493. [Google Scholar] [CrossRef]
- Brandi, N.; Ciccarese, F. An Imaging Overview of COVID-19 ARDS in ICU Patients and Its Complications: A Pictorial Review. Diagnostics 2022, 12, 846. [Google Scholar] [CrossRef]
- Kwee, T.C.; Kwee, R.M. Chest CT in COVID-19: What the Radiologist Needs to Know. Radiographics 2020, 40, 1848–1865. [Google Scholar] [CrossRef] [PubMed]
- Yuan, M.; Yin, W. Association of radiologic findings with mortality of patients infected with 2019 novel coronavirus in Wuhan, China. PLoS ONE 2020, 15, e0230548. [Google Scholar] [CrossRef] [PubMed]
- Carvalho, A.; Cunha, R. Chest CT imaging features of COVID-19 pneumonia: First radiological insights from Porto, Portugal. Eur. J. Radiol. Open 2020, 7, 100294. [Google Scholar] [CrossRef] [PubMed]
- Li, K.; Fang, Y. CT image visual quantitative evaluation and clinical classification of coronavirus disease (COVID-19). Eur. Radiol. 2020, 30, 4407–4416. [Google Scholar] [CrossRef] [PubMed]
- Bernheim, A.; Mei, X. Chest CT Findings in Coronavirus Disease-19 (COVID-19): Relationship to Duration of Infection. Radiology 2020, 295, 200463. [Google Scholar] [CrossRef]
- Huang, G.; Gong, T. Timely Diagnosis and Treatment Shortens the Time to Resolution of Coronavirus Disease (COVID-19) Pneumonia and Lowers the Highest and Last CT Scores From Sequential Chest CT. AJR Am. J. Roentgenol. 2020, 215, 367–373. [Google Scholar] [CrossRef]
- Herr, C.; Mang, S. Distinct Patterns of Blood Cytokines Beyond a Cytokine Storm Predict Mortality in COVID-19. J. Inflamm. Res. 2021, 14, 4651–4667. [Google Scholar] [CrossRef]
- Brasen, C.L.; Christensen, H. Daily monitoring of viral load measured as SARS-CoV-2 antigen and RNA in blood, IL-6, CRP and complement C3d predicts outcome in patients hospitalized with COVID-19. Clin. Chem. Lab. Med. 2021, 59, 1988–1997. [Google Scholar] [CrossRef]
- Webb, B.J.; Peltan, I.D. Clinical criteria for COVID-19-associated hyperinflammatory syndrome: A cohort study. Lancet Rheumatol. 2020, 2, e754–e763. [Google Scholar] [CrossRef]
- Leisman, D.E.; Ronner, L. Cytokine elevation in severe and critical COVID-19: A rapid systematic review, meta-analysis, and comparison with other inflammatory syndromes. Lancet Respir. Med. 2020, 8, 1233–1244. [Google Scholar] [CrossRef]
- Osuchowski, M.F.; Winkler, M.S. The COVID-19 puzzle: Deciphering pathophysiology and phenotypes of a new disease entity. Lancet Respir. Med. 2021, 9, 622–642. [Google Scholar] [CrossRef]
- Martins-Filho, P.R.; Tavares, C.S.S. Factors associated with mortality in patients with COVID-19. A quantitative evidence synthesis of clinical and laboratory data. Eur. J. Intern. Med. 2020, 76, 97–99. [Google Scholar] [CrossRef]
- Aarskog, N.R.; Aass, H.C. Interleukin-6 in Critical Coronavirus Disease 2019, a Driver of Lung Inflammation of Systemic Origin? Crit. Care Explor. 2021, 3, e0542. [Google Scholar] [CrossRef]
- Khosravi, B.; Aghaghazvini, L. Predictive value of initial CT scan for various adverse outcomes in patients with COVID-19 pneumonia. Heart Lung 2021, 50, 13–20. [Google Scholar] [CrossRef]
- Cereser, L.; Girometti, R. Inter-reader agreement of high-resolution computed tomography findings in patients with COVID-19 pneumonia: A multi-reader study. Radiol. Med. 2021, 126, 577–584. [Google Scholar] [CrossRef]
- The WHO Rapid Evidence Appraisal for COVID-19 Therapies (REACT) Working Group; Shankar-Hari, M. Association between Administration of IL-6 Antagonists and Mortality among Patients Hospitalized for COVID-19: A Meta-Analysis. JAMA 2021, 326, 499–518. [Google Scholar]
- Nicastri, E.; Petrosillo, N. National Institute for the Infectious Diseases “L. Spallanzani”, IRCCS. Recommendations for COVID-19 clinical management. Infect. Dis. Rep. 2020, 12, 8543. [Google Scholar] [CrossRef]
- de Jaegere, T.M.H.; Krdzalic, J.; COVID-19 CT Investigators South-East Netherlands (CISEN) Study Group. Radiological Society of North America Chest CT Classification System for Reporting COVID-19 Pneumonia: Interobserver Variability and Correlation with Reverse-Transcription Polymerase Chain Reaction. Radiol. Cardiothorac. Imaging 2020, 2, e200213. [Google Scholar] [CrossRef]
- Balacchi, C.; Brandi, N. Comparing the first and the second waves of COVID-19 in Italy: Differences in epidemiological features and CT findings using a semi-quantitative score. Emerg. Radiol. 2021, 28, 1055–1061. [Google Scholar] [CrossRef]


| All Patients n = 51 | TCZ n = 26 | SAR n = 25 | p | |
|---|---|---|---|---|
| Male, n (%) | 41 (80.4) | 20 (76.9) | 21 (84.4) | 0.53 |
| Age, years, mean ± SD | 62.6 ± 12.5 | 60.8 ± 12.3 | 64.5 ± 12.7 | 0.29 |
| Disease duration, days, mean ± SD | 12.9 ± 6.0 | 14.4 ± 7.3 | 11.4 ± 3.0 | 0.74 |
| Diabetes, n (%) | 14 (27.5) | 7 (26.9) | 7 (28.0) | 0.93 |
| Coronary heart disease, n (%) | 10 (19.6) | 3 (11.5) | 7 (28.0) | 0.14 |
| Active cancer, n (%) | 0 (0) | 0 (0) | 0 (0) | - |
| COPD, n (%) | 0 (0) | 0 (0) | 0 (0) | - |
| pO2/FiO2, mean ± SD | 207 ± 79 | 231 ± 91 | 186 ± 61 | 0.05 |
| CRP, mg/dL, mean ± SD | 124 ± 86 | 100 ± 94 | 134 ± 79 | 0.20 |
| Ferritin, mg/dL, median (IQR) | 656 (482–1464) | 646 (537–1290) | 1089 (425–1962) | 0.81 |
| Albumin, g/dL, mean ± SD | 3.0 ± 0.5 | 3.0 ± 0.4 | 3.0 ± 0.5 | 0.78 |
| Lymphocytes, %, median (IQR) | 12.4 (7.5–22.1) | 9.6 (7.0–20.6) | 14.3 (8.4–23.1) | 0.39 |
| Neutrophiles, n/mcl, mean ± SD | 5621 ± 3058 | 6684 ± 3267 | 4808 ± 2707 | 0.10 |
| ALT, mg/dL, median (IQR) | 32 (23–44) | 32 (23–44) | 31 (24–43) | 0.99 |
| AST, mg/dL, median (IQR) | 24 (22–42) | 24 (23–85) | 28 (19–28) | 0.91 |
| Dimers, mg/dL, median (IQR) | 1523 (718–3683) | 1083 (435–5840) | 1525 (1039–3359) | 0.28 |
| LDH, mg/dL, mean ± SD | 360 ± 111 | 347 ± 113 | 375 ± 111 | 0.47 |
| Troponin, ng/mL, median (IQR) | 0.07 (0.03–0.34) | 0.08 (0.04–0.27) | 0.04 (0.03–0.39) | 0.76 |
| Anion gap, mEq/L, mean ± SD | 14.5 ± 3.1 | 16.8 ± 3.3 | 12.5 ± 0.8 | 0.01 |
| Chloride, mEq/L, mean ± SD | 103.0 ± 5.4 | 102.4 ± 6.5 | 103.4 ± 4.7 | 0.70 |
| Potassium, mEq/L, mean ± SD | 3.8 ± 0.4 | 3.9 ± 0.5 | 3.8 ± 0.4 | 0.64 |
| Creatinine, mg/dL, median (IQR) | 0.9 (0.9–1.2) | 1.0 (0.8–1.2) | 0.9 (0.8–1.2) | 0.14 |
| BUN/creatinine ratio, median (IQR) | 18.2 (14.6–24.7) | 18.3 (15.1–25.6) | 17.9 (13.6–24.8) | 0.65 |
| TCZ/SAR, n (%) | 26 (51.0)/25 (49.0) | - | - | - |
| Hydroxychloroquine, n (%) | 51 (100.0) | 25 (100.0) | 26 (100.0) | - |
| Azithromycin, n (%) | 51 (100.0) | 25 (100.0) | 26 (100.0) | - |
| Darunavir/ritonavir, n (%) | 34 (66.7) | 15 (57.7) | 19 (76.0) | 0.17 |
| Lopinavir/ritonavir, n (%) | 17 (33.3) | 11 (42.3) | 6 (24.0) | 0.17 |
| LMWH, n (%) | 32 (65.3) | 12 (50.0) | 20 (80.0) | 0.03 |
| CT Findings | n. (Percentage) | |
|---|---|---|
| Centrilobular nodules | 0 (0) | |
| Pleural effusion | Right | 0 (0) |
| Left | 5 (9.8) | |
| Bilateral | 15 (29.4) | |
| Cavitation | 0 (0) | |
| Lymph node enlargement (lymph node sized ≥10 mm in short-axis dimension) | 17 (33.3) | |
| Airways abnormalities | Bronchial wall thickening | 2 (3.9) |
| Bronchiectasis | 9 (17.6) | |
| Endoluminal secretions | 0 (0) | |
| Axial distribution | Random | 30 (58.8) |
| Central | 0 (0) | |
| Peripheral | 21 (41.2) | |
| Crazy Paving | 10 (19.6) | |
| Underlying disease | Fibrosis | 0 (0) |
| Emphysema | 7 (13.7) |
| S20 | S24 | S60 | S72 | ||||||
|---|---|---|---|---|---|---|---|---|---|
| Male | ρ (p) | 0.16 | (0.28) | 0.17 | (0.23) | 0.18 | (0.22) | 0.20 | (0.15) |
| Age | ρ (p) | 0.16 | (0.27) | 0.15 | (0.31) | 0.16 | (0.30) | 0.12 | (0.39) |
| Disease duration | rs (p) | 0.12 | (0.41) | −0.12 | (0.40) | −0.05 | (0.73) | −0.04 | (0.78) |
| Diabetes | ρ (p) | 0.00 | (0.82) | −0.04 | (0.79) | −0.04 | (0.77) | −0.06 | (0.67) |
| Coronary heart disease | ρ (p) | 0.27 | (0.06) | 0.24 | (0.09) | 0.18 | (0.20) | 0.15 | (0.29) |
| pO2/FiO2 | ρ (p) | −0.29 | (0.04) | −0.33 | (0.02) | −0.32 | (0.03) | −0.36 | (0.01) |
| CRP | ρ (p) | 0.44 | (<0.01) | 0.45 | (<0.01) | 0.34 | (0.01) | 0.37 | (<0.01) |
| Dimers | rs (p) | 0.17 | (0.31) | 0.19 | (0.24) | 0.23 | (0.16) | 0.23 | (0.16) |
| Ferritin | rs (p) | 0.23 | (0.31) | 0.23 | (0.32) | 0.19 | (0.41) | 0.12 | (0.41) |
| IL-6 | rs (p) | 0.59 | (<0.01) | 0.60 | (<0.01) | 0.55 | (<0.01) | 0.57 | (<0.01) |
| IL-6 * | ρ (p) | 0.54 | (<0.01) | 0.55 | (<0.01) | 0.47 | (<0.01) | 0.49 | (<0.01) |
| IL-8 | rs (p) | 0.53 | (<0.01) | 0.52 | (<0.01) | 0.40 | (<0.01) | 0.56 | (<0.01) |
| IL-8 * | ρ (p) | 0.45 | (<0.01) | 0.45 | (<0.01) | 0.35 | (0.02) | 0.33 | (0.02) |
| IL-1 | rs (p) | 0.28 | (0.07) | 0.28 | (0.07) | 0.35 | (0.03) | 0.33 | (0.03) |
| IL-1 * | ρ (p) | 0.17 | (0.29) | 0.13 | (0.40) | 0.19 | (0.22) | 0.15 | (0.33) |
| TNF-α | ρ (p) | 0.36 | (0.02) | 0.35 | (0.02) | 0.36 | (0.03) | 0.38 | (0.01) |
| Cytokine storm | ρ (p) | 0.39 | (0.05) | 0.39 | (0.05) | 0.31 | (0.03) | 0.32 | (0.02) |
| Area | IC 95% | p | |
|---|---|---|---|
| S20 | 0.785 | 0.579–0.991 | 0.02 |
| S24 | 0.776 | 0.569–0.983 | 0.03 |
| S60 | 0.739 | 0.538–0.939 | 0.06 |
| S72 | 0.746 | 0.559–0.933 | 0.05 |
| ICU Admission | Oxygen Weaning | |||||||||||
|---|---|---|---|---|---|---|---|---|---|---|---|---|
| Unadjusted | Adjusted † | Unadjusted | Adjusted ‡ | |||||||||
| HR | CI 95% | p | HR | CI 95% | p | HR | CI 95% | p | HR | CI 95% | p | |
| S20 | 1.24 | 1.09–1.42 | <0.01 | 1.17 | 0.99–1.37 | 0.06 | 0.86 | 0.78–0.95 | 0.04 | 0.97 | 0.86–1.09 | 0.63 |
| S24 | 1.21 | 1.08–1.35 | <0.01 | 1.16 | 1.01–1.33 | 0.04 | 0.88 | 0.82–0.96 | <0.01 | 0.97 | 0.88–1.07 | 0.52 |
| S60 | 1.09 | 1.02–1.18 | 0.02 | 1.06 | 0.97–1.16 | 0.21 | 0.94 | 0.89–0.98 | <0.01 | 1.00 | 0.95–1.05 | 0.99 |
| S72 | 1.08 | 1.02–1.15 | 0.01 | 1.06 | 0.99–1.14 | 0.12 | 0.95 | 0.91–0.99 | <0.01 | 0.99 | 0.95–1.04 | 0.77 |
| Age | 0.98 | 0.93–1.02 | 0.28 | 0.98 | 0.96–1.01 | 0.18 | ||||||
| Male | 2.59 | 0.33–20.25 | 0.36 | 0.90 | 0.43–1.88 | 0.77 | ||||||
| Disease duration | 0.85 | 0.51–1.42 | 0.53 | 1.07 | 0.86–1.33 | 0.56 | ||||||
| CRP | 1.00 | 1.00–1.01 | 0.23 | 1.00 | 0.99–1.00 | 0.09 | ||||||
| pO2/FiO2 | 0.99 | 0.98–1.00 | 0.20 | 1.01 | 1.00–1.01 | <0.01 | ||||||
| Cytokine storm | 1.89 | 0.41–8.78 | 0.42 | 0.17 | 0.04–0.72 | 0.16 | ||||||
| IL-6 * | 2.13 | 1.12–4.07 | 0.02 | 0.69 | 0.54–0.88 | <0.02 | ||||||
| IL-8 * | 2.10 | 1.14–3.88 | 0.02 | 0.60 | 0.39–0.94 | 0.03 | ||||||
| IL-1 * | 2.71 | 0.78–9.43 | 0.12 | 0.93 | 0.49–1.76 | 0.82 | ||||||
| TNF-α | 0.999 | 0.92–1.09 | 0.98 | 0.94 | 0.90–0.99 | 0.02 | ||||||
| TCZ/SAR | 0.851 | 0.26–2.79 | 0.79 | 1.12 | 0.613–2.03 | 0.72 | ||||||
Disclaimer/Publisher’s Note: The statements, opinions and data contained in all publications are solely those of the individual author(s) and contributor(s) and not of MDPI and/or the editor(s). MDPI and/or the editor(s) disclaim responsibility for any injury to people or property resulting from any ideas, methods, instructions or products referred to in the content. |
© 2023 by the authors. Licensee MDPI, Basel, Switzerland. This article is an open access article distributed under the terms and conditions of the Creative Commons Attribution (CC BY) license (https://creativecommons.org/licenses/by/4.0/).
Share and Cite
Calandriello, L.; De Lorenzis, E.; Cicchetti, G.; D’Abronzo, R.; Infante, A.; Castaldo, F.; Del Ciello, A.; Farchione, A.; Gremese, E.; Marano, R.; et al. Extension of Lung Damage at Chest Computed Tomography in Severely Ill COVID-19 Patients Treated with Interleukin-6 Receptor Blockers Correlates with Inflammatory Cytokines Production and Prognosis. Tomography 2023, 9, 981-994. https://doi.org/10.3390/tomography9030080
Calandriello L, De Lorenzis E, Cicchetti G, D’Abronzo R, Infante A, Castaldo F, Del Ciello A, Farchione A, Gremese E, Marano R, et al. Extension of Lung Damage at Chest Computed Tomography in Severely Ill COVID-19 Patients Treated with Interleukin-6 Receptor Blockers Correlates with Inflammatory Cytokines Production and Prognosis. Tomography. 2023; 9(3):981-994. https://doi.org/10.3390/tomography9030080
Chicago/Turabian StyleCalandriello, Lucio, Enrico De Lorenzis, Giuseppe Cicchetti, Rosa D’Abronzo, Amato Infante, Federico Castaldo, Annemilia Del Ciello, Alessandra Farchione, Elisa Gremese, Riccardo Marano, and et al. 2023. "Extension of Lung Damage at Chest Computed Tomography in Severely Ill COVID-19 Patients Treated with Interleukin-6 Receptor Blockers Correlates with Inflammatory Cytokines Production and Prognosis" Tomography 9, no. 3: 981-994. https://doi.org/10.3390/tomography9030080
APA StyleCalandriello, L., De Lorenzis, E., Cicchetti, G., D’Abronzo, R., Infante, A., Castaldo, F., Del Ciello, A., Farchione, A., Gremese, E., Marano, R., Natale, L., D’Agostino, M. A., Bosello, S. L., & Larici, A. R. (2023). Extension of Lung Damage at Chest Computed Tomography in Severely Ill COVID-19 Patients Treated with Interleukin-6 Receptor Blockers Correlates with Inflammatory Cytokines Production and Prognosis. Tomography, 9(3), 981-994. https://doi.org/10.3390/tomography9030080


