
Prognostic Value of Initial Diagnostic Imaging Findings for Patient Outcomes in Adult Patients with Traumatic Brain Injury: A Systematic Review and Meta-Analysis


Abstract
1. Introduction
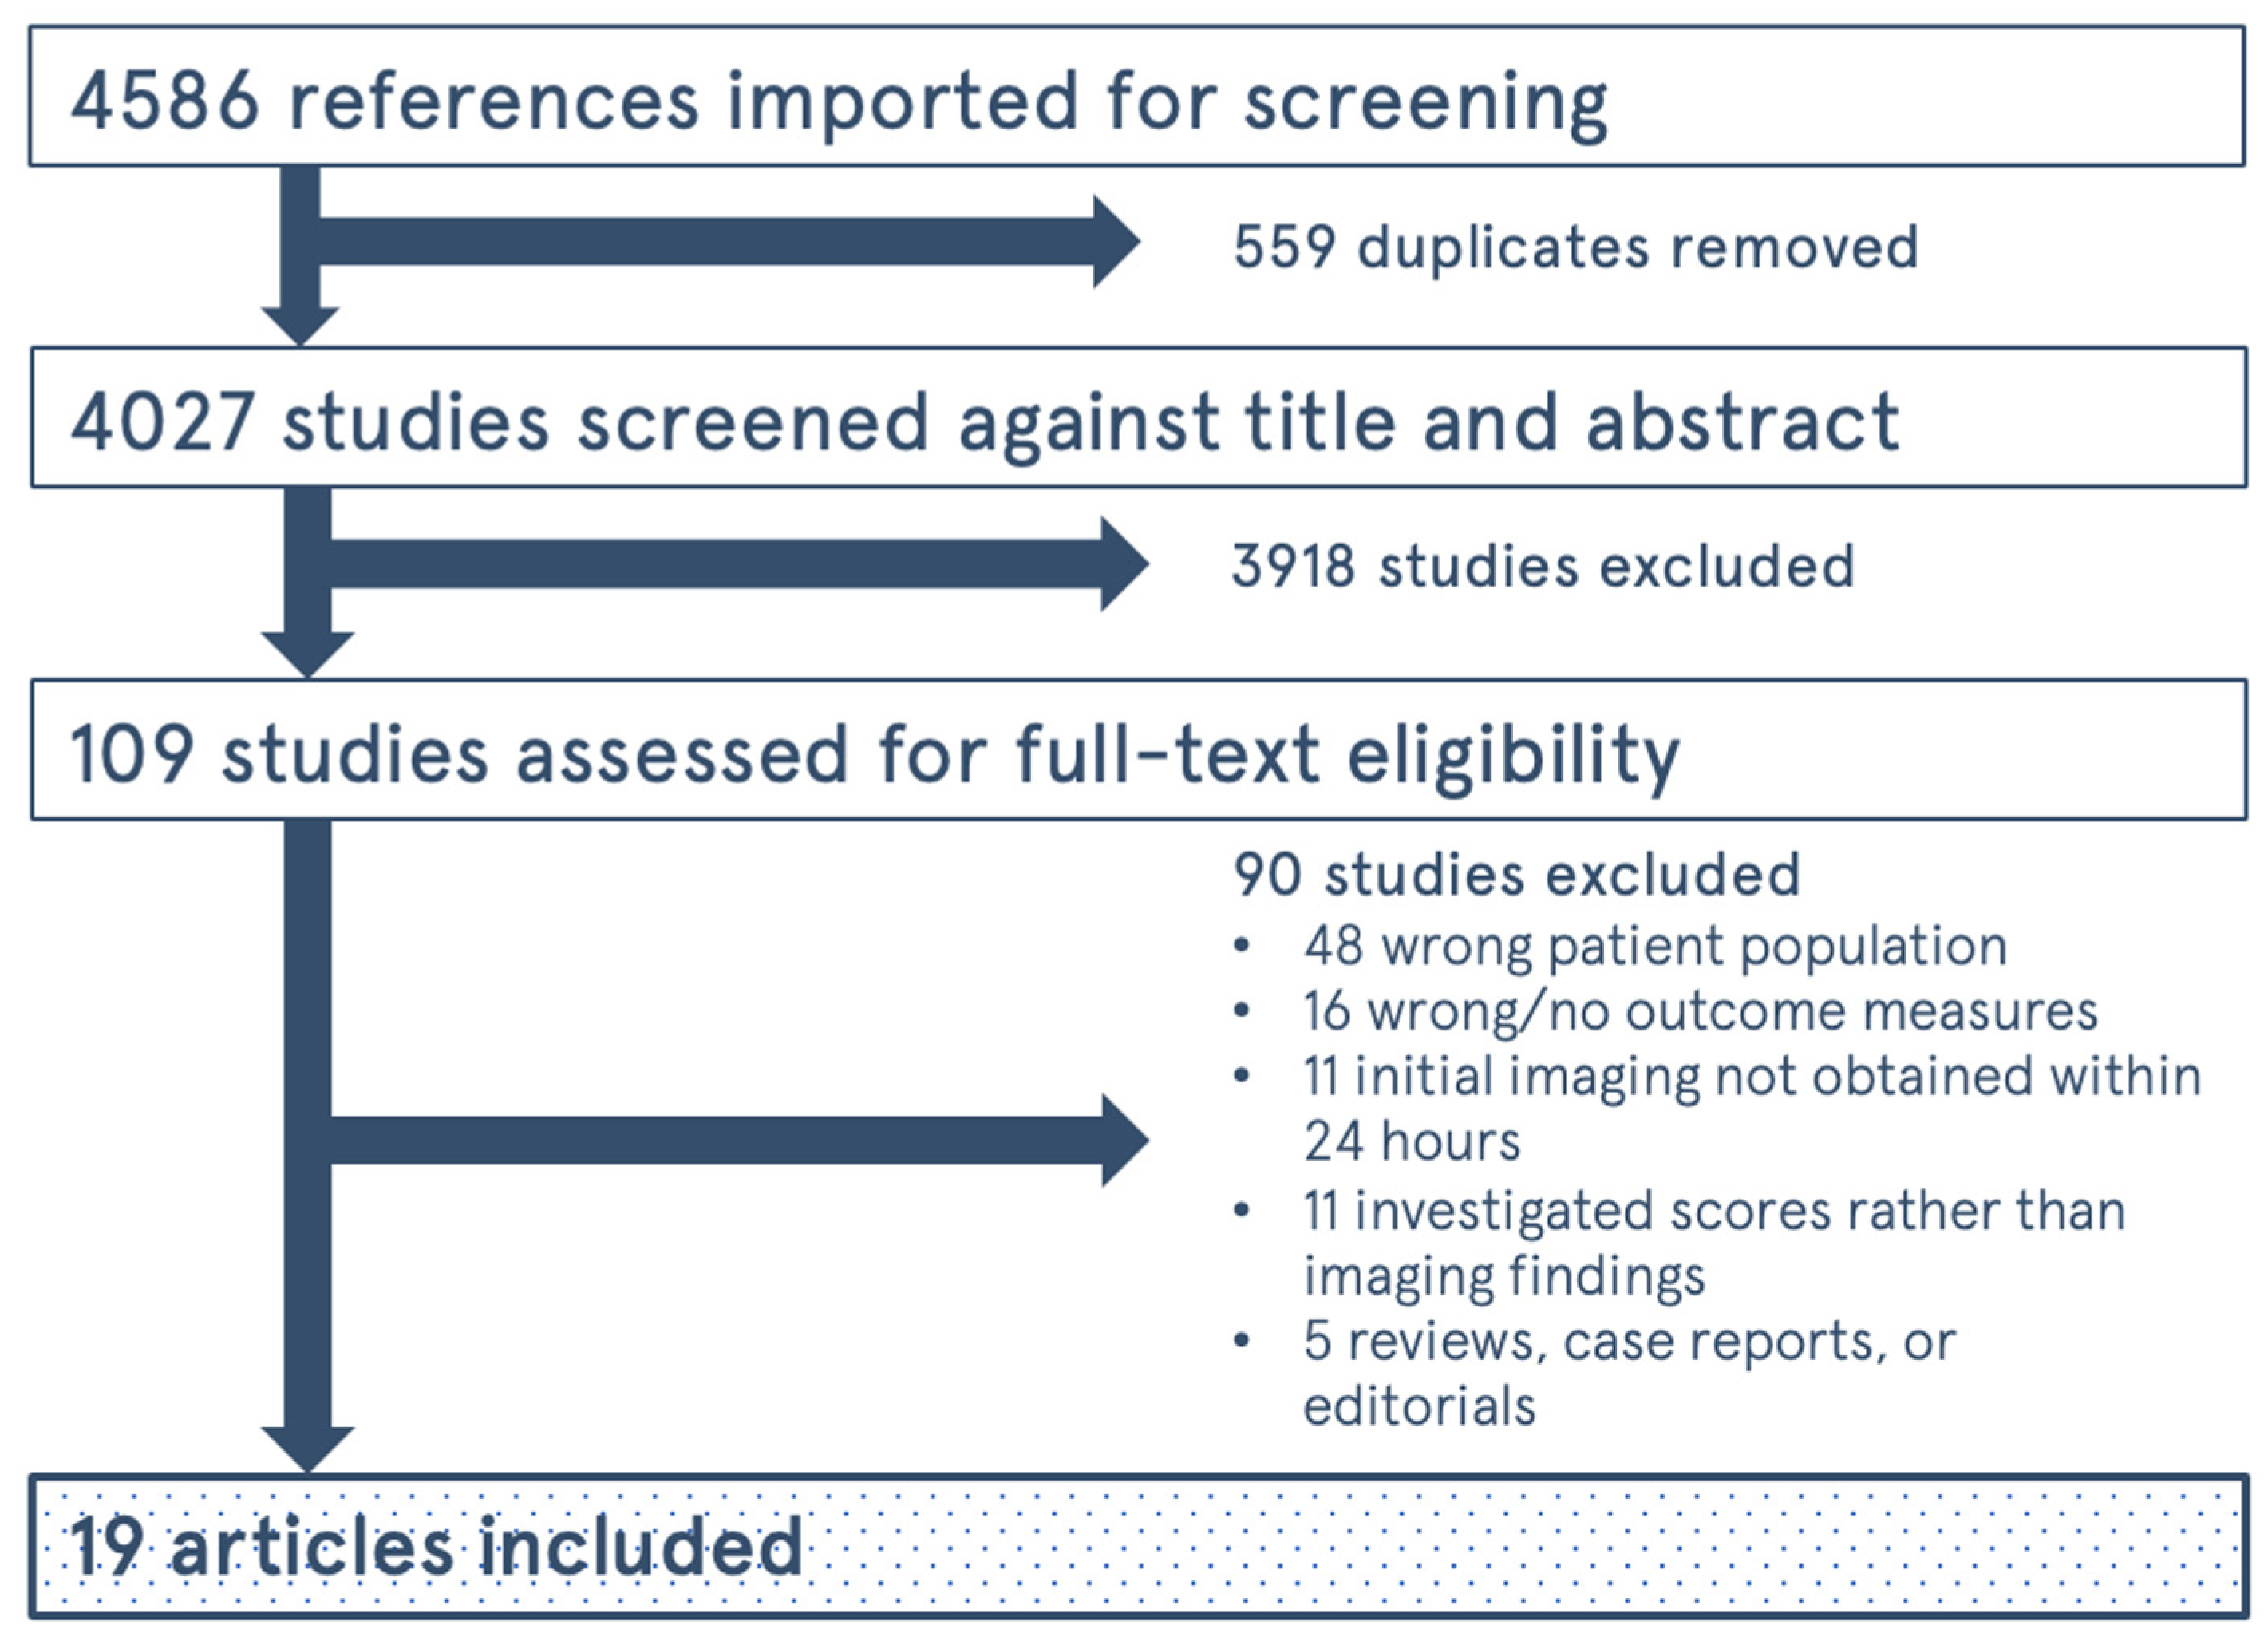
2. Methods
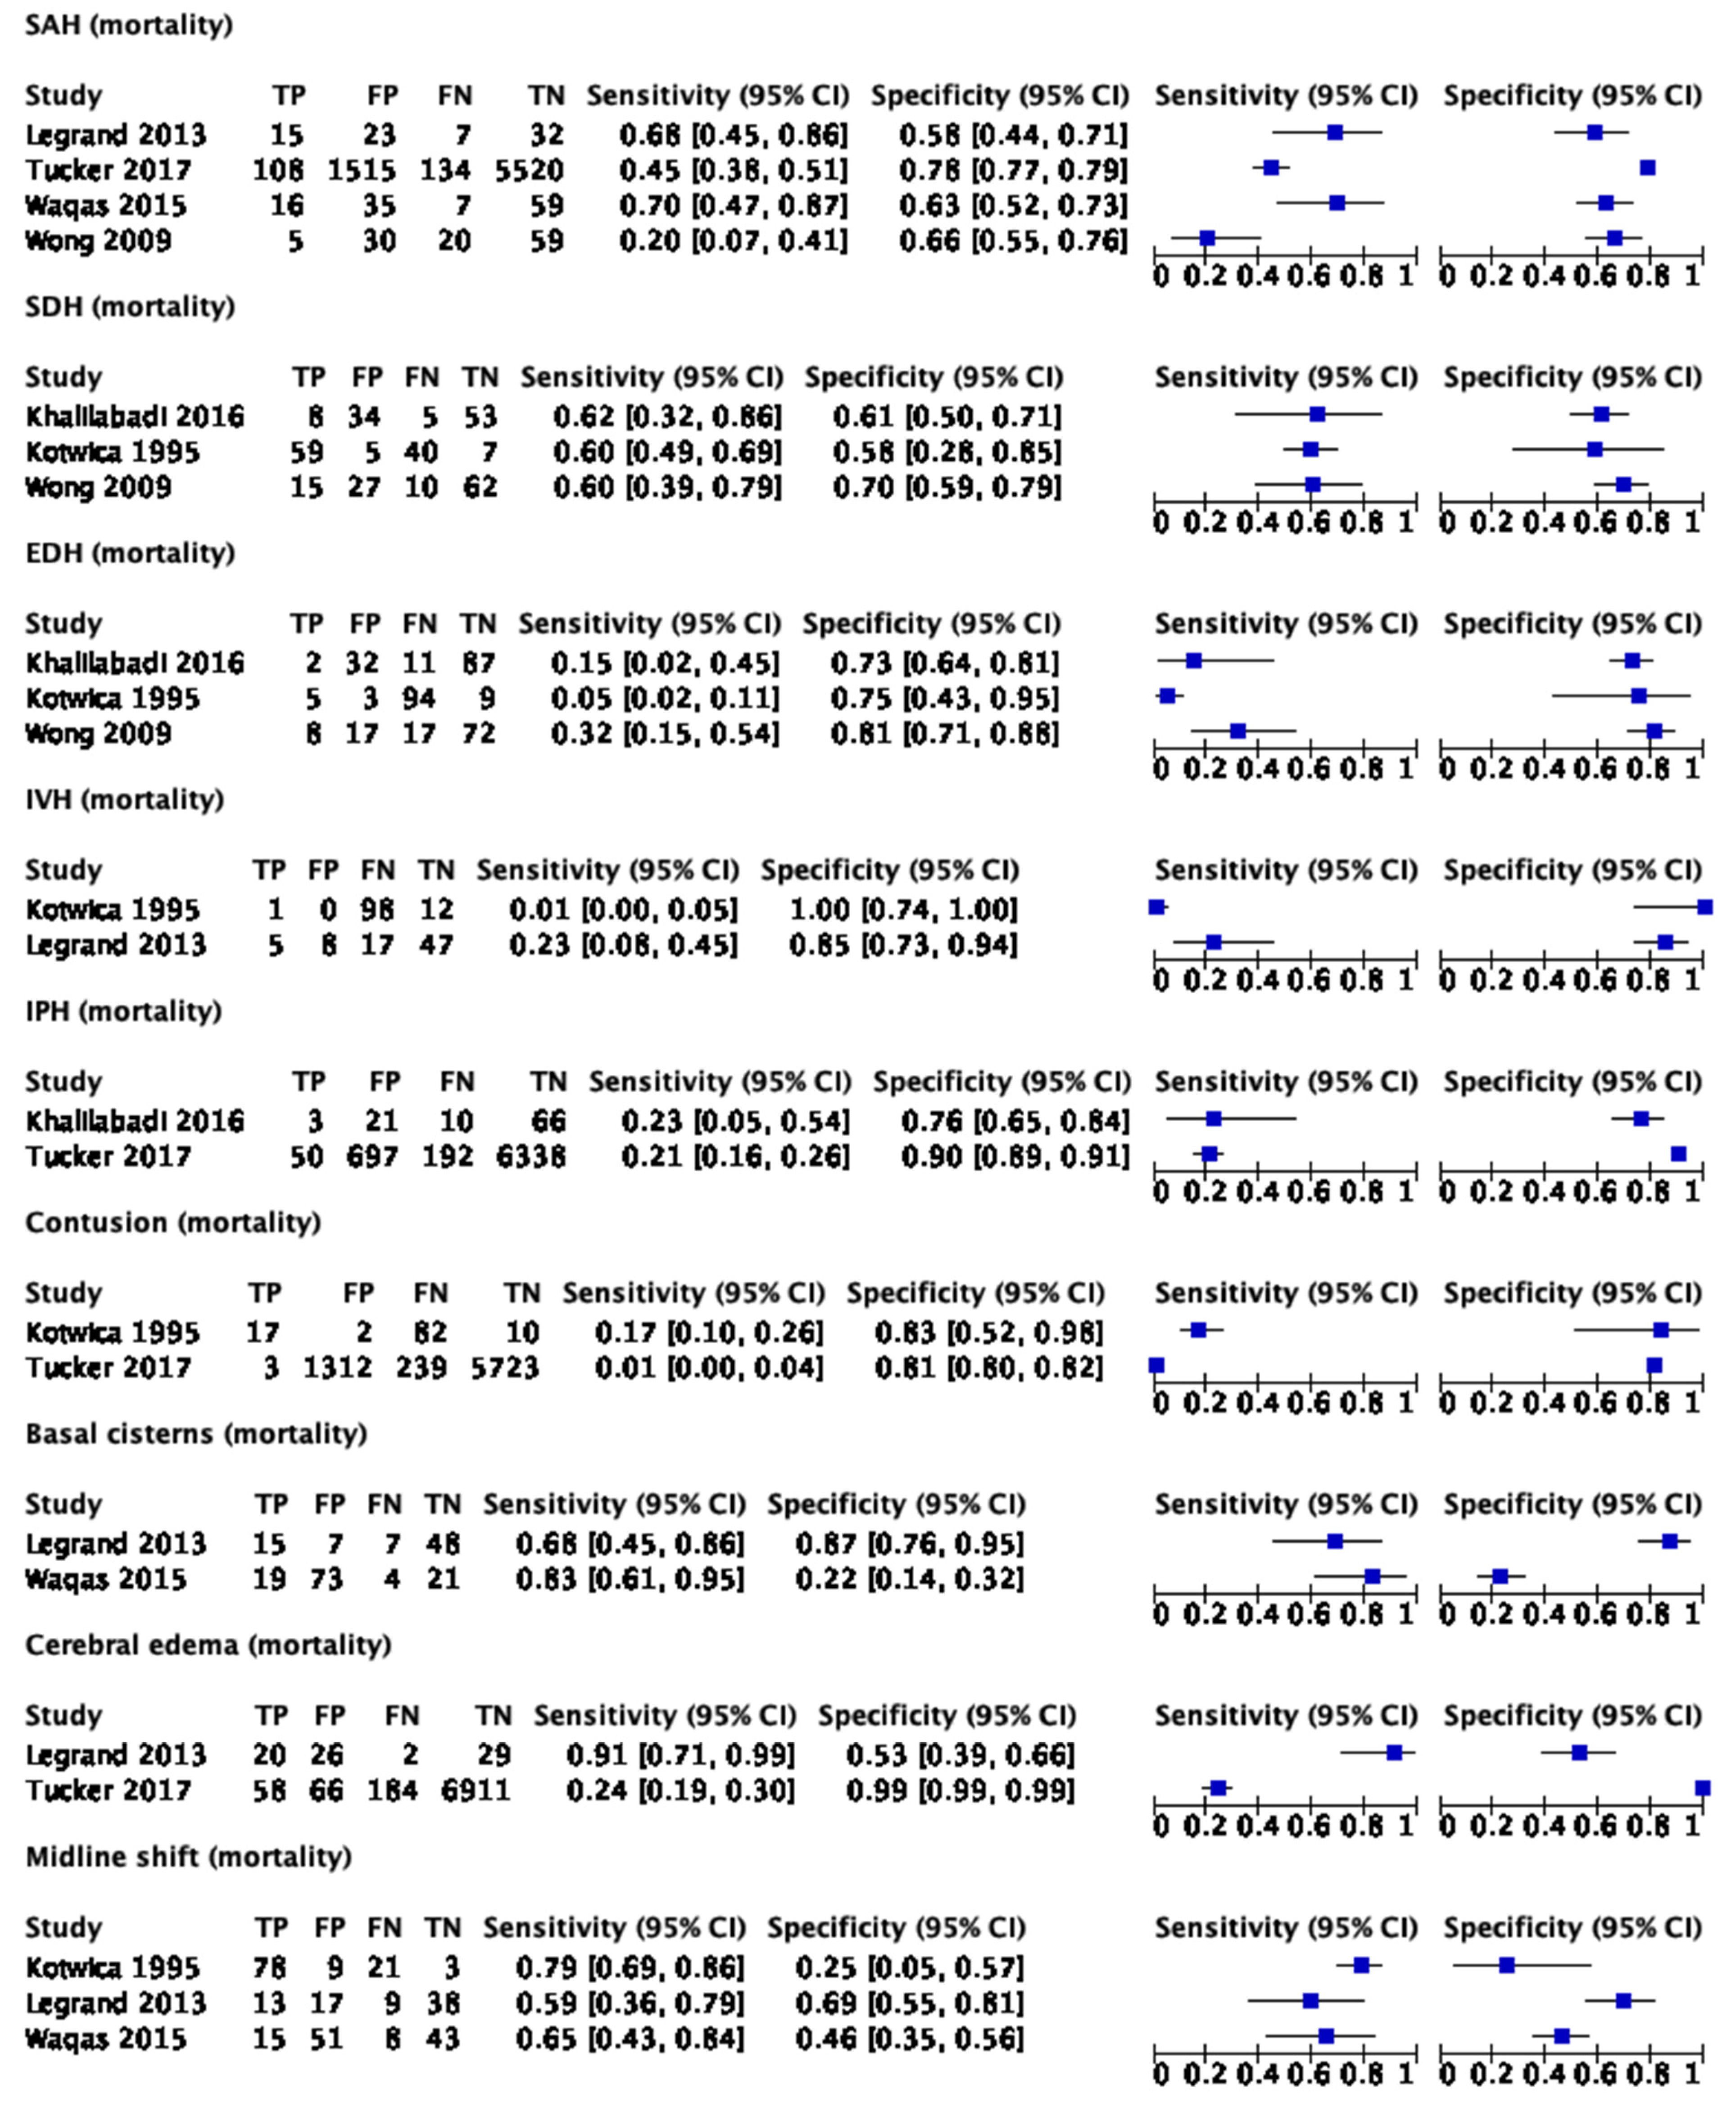
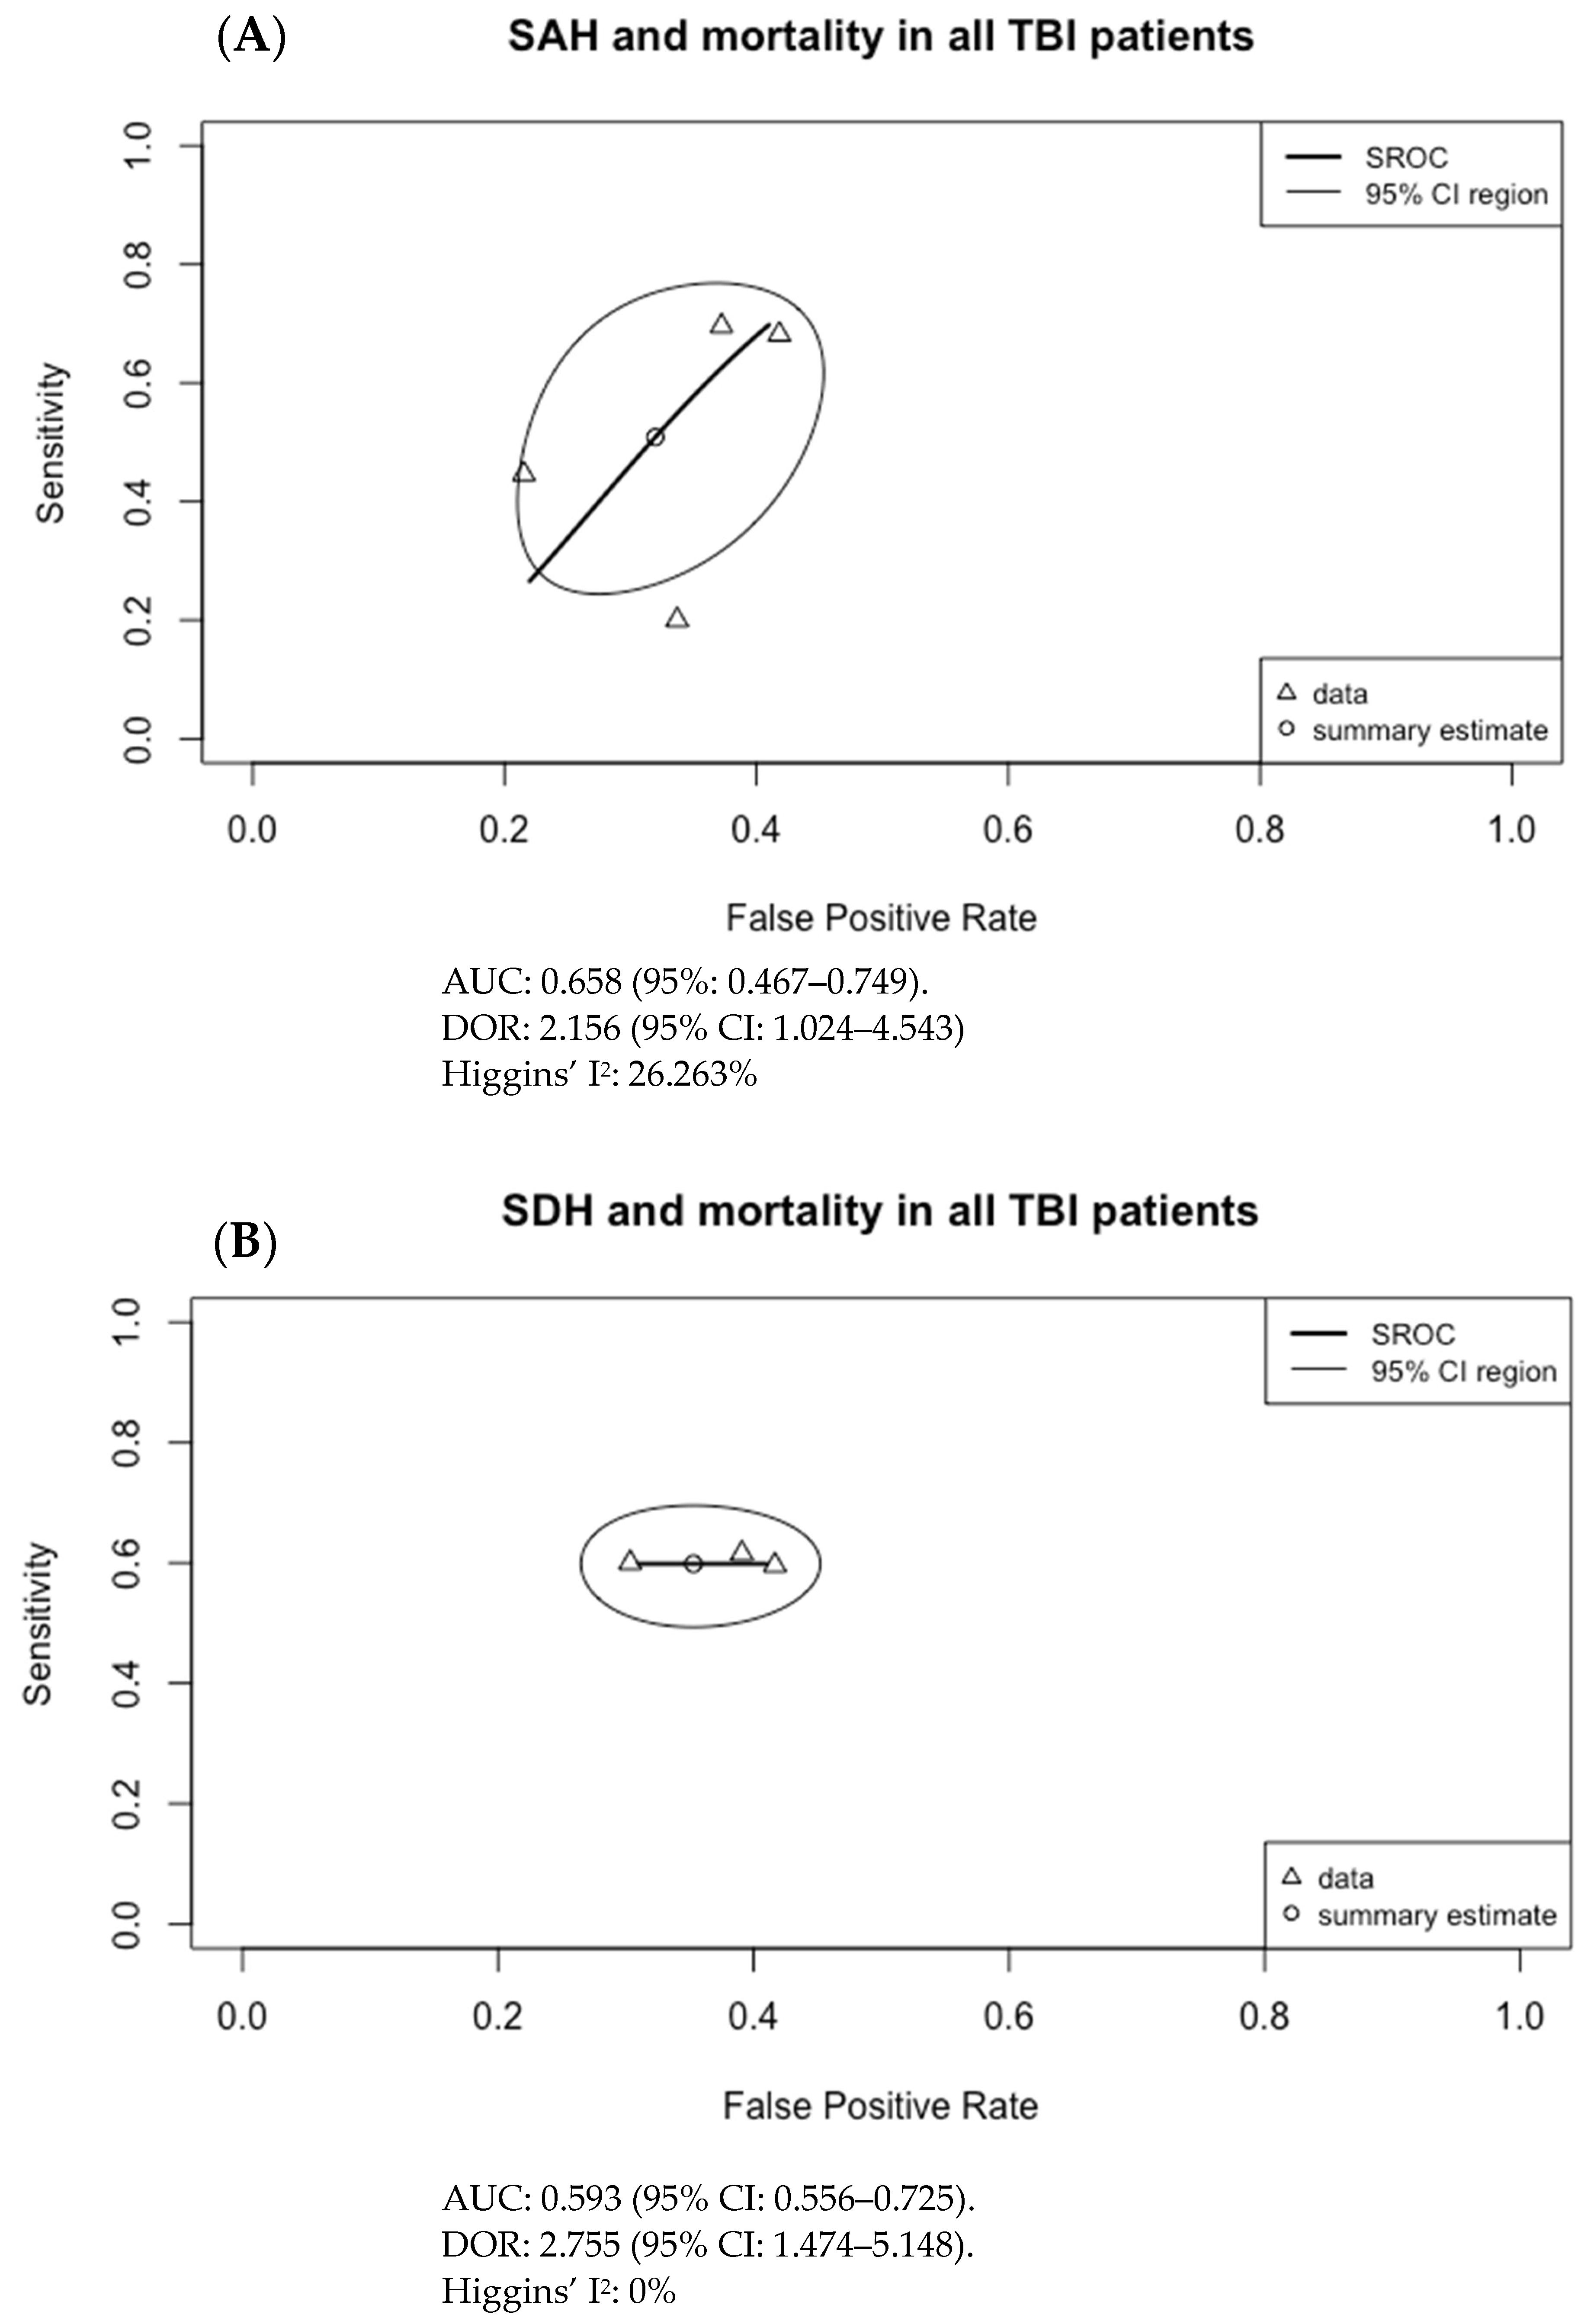
2.1. Statistics
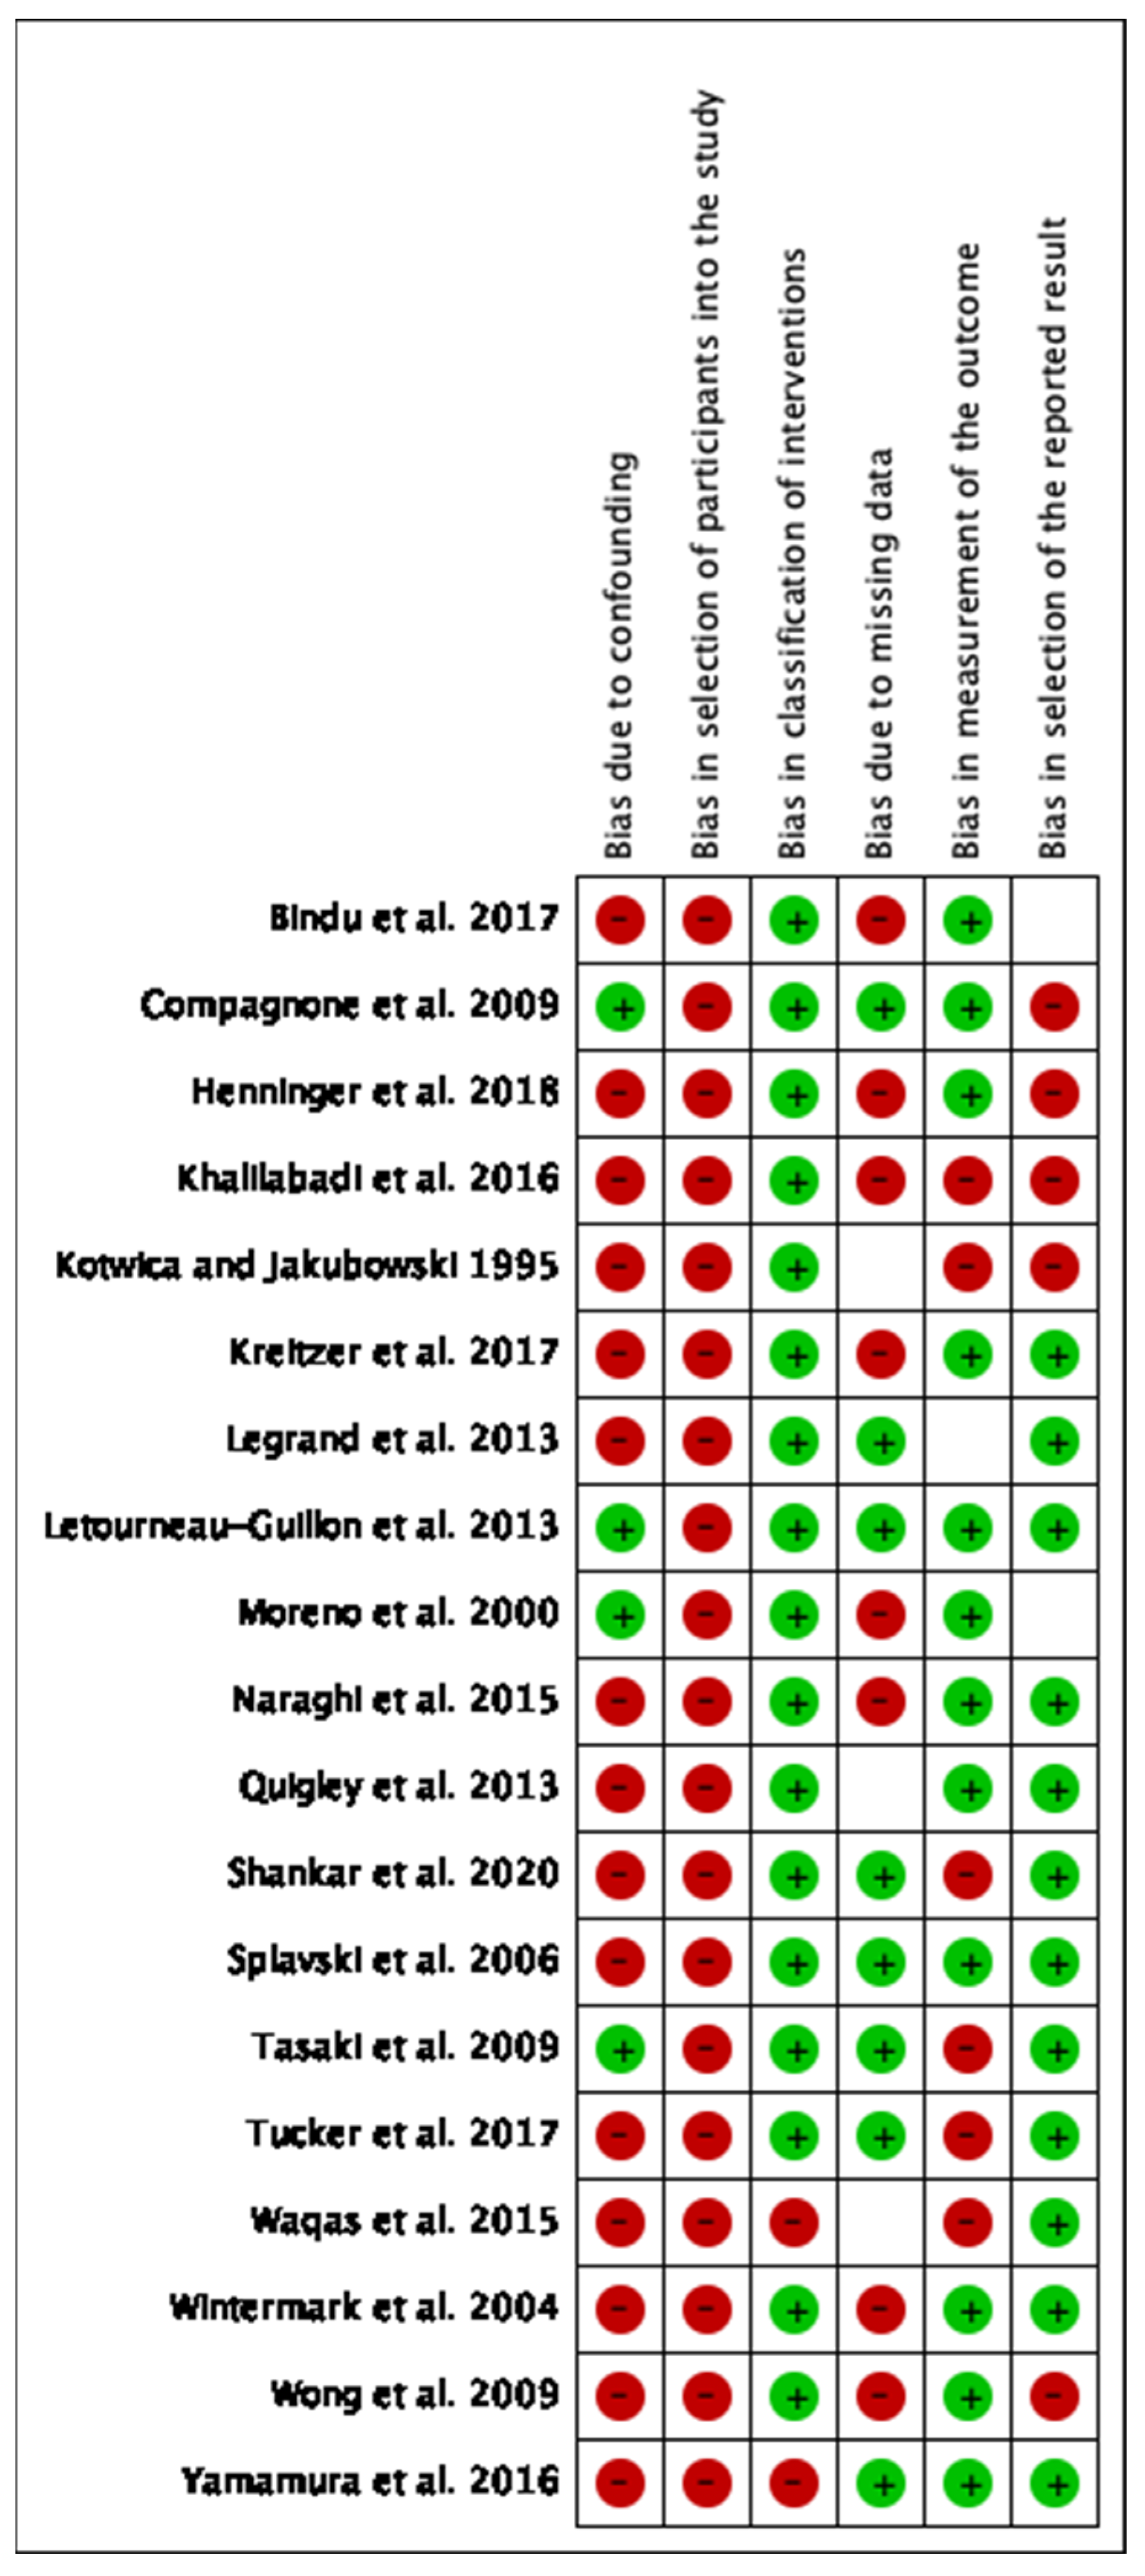
2.2. Assessing Bias
3. Results
4. Discussion
5. Conclusions
Author Contributions
Funding
Institutional Review Board Statement
Informed Consent Statement
Data Availability Statement
Conflicts of Interest
Abbreviations
| ACA | anterior cerebral artery |
| ARDS | acute respiratory distress syndrome |
| AUC | area under (the receiver operating characteristic) curve |
| CBF | cerebral blood flow |
| CBV | cerebral blood volume |
| CI | confidence interval |
| CT | computed tomography |
| CTA | CT angiography |
| CTP | CT perfusion |
| ED | emergency department |
| EDH | epidural hematoma |
| FU | follow-up |
| GCS | Glasgow Coma Score |
| GOS | Glasgow Outcome Scale |
| ICH | intracranial hemorrhage |
| ICP | intracranial pressure |
| ICU | intensive care unit |
| IPH | intraparenchymal hematoma |
| ISS | injury severity score |
| IVH | intraventricular hemorrhage |
| LR | likelihood ratio |
| MCA | middle cerebral artery |
| MRI | magnetic resonance imaging |
| MTT | mean transit time |
| NECT | non-enhanced CT |
| NPV | negative predictive value |
| ONSD | optic nerve sheath diameter |
| PET | positron emission tomography |
| PCA | posterior cerebral artery |
| PI | pulsatility index |
| PPV | positive predictive value |
| ROC | receiver operating characteristic |
| SAH | subarachnoid hemorrhage |
| SDH | subdural hematoma |
| SPECT | single-photon emission computed tomography |
| SROC | summary receiver operating characteristic |
| TBI | traumatic brain injury |
References
- Dewan, M.C.; Rattani, A.; Gupta, S.; Baticulon, R.E.; Hung, Y.-C.; Punchak, M.; Agrawal, A.; Adeleye, A.O.; Shrime, M.G.; Rubiano, A.M.; et al. Estimating the global incidence of traumatic brain injury. J. Neurosurg. 2019, 130, 1080–1097. [Google Scholar] [CrossRef] [PubMed]
- Ng, S.Y.; Lee, A.Y.W. Traumatic Brain Injuries: Pathophysiology and Potential Therapeutic Targets. Front. Cell. Neurosci. 2019, 13, 528. [Google Scholar] [CrossRef] [PubMed]
- Zaloshnja, E.; Miller, T.; Langlois, J.A.; Selassie, A.W. Prevalence of Long-Term Disability From Traumatic Brain Injury in the Civilian Population of the United States, 2005. J. Head Trauma Rehabil. 2008, 23, 394–400. [Google Scholar] [CrossRef] [PubMed]
- Seifert, J. Incidence and economic burden of injuries in the United States. J. Epidemiol. Community Health 2007, 61, 926. [Google Scholar] [CrossRef]
- Lee, B.; Newberg, A. Neuroimaging in Traumatic Brain Imaging. NeuroRx 2005, 2, 372–383. [Google Scholar] [CrossRef]
- Marshall, L.F.; Marshall, S.B.; Klauber, M.R.; Clark, M.V.B.; Eisenberg, H.M.; Jane, J.A.; Luerssen, T.G.; Marmarou, A.; Foulkes, M.A. A new classification of head injury based on computerized tomography. J. Neurosurg. 1991, 75, S14–S20. [Google Scholar] [CrossRef]
- Maas, A.I.; Hukkelhoven, C.W.; Marshall, L.F.; Steyerberg, E.W. Prediction of Outcome in Traumatic Brain Injury with Computed Tomographic Characteristics: A Comparison between the Computed Tomographic Classification and Combinations of Computed Tomographic Predictors. Neurosurgery 2005, 57, 1173–1182. [Google Scholar] [CrossRef]
- Steyerberg, E.W.; A Mushkudiani, N.; Perel, P.; Butcher, I.; Lu, J.; McHugh, G.S.; Murray, G.; Marmarou, A.; Roberts, I.; Habbema, J.D.F.; et al. Predicting Outcome after Traumatic Brain Injury: Development and International Validation of Prognostic Scores Based on Admission Characteristics. PLoS Med. 2008, 5, e165. [Google Scholar] [CrossRef]
- Bendinelli, C.; Cooper, S.; Abel, C.; Balogh, A.; Balogh, Z.J. Perfusion Computed Tomography in Traumatic Brain Injury. Traumatic Brain Injury-Pathobiology, Advanced Diagnostics and Acute Management. IntechOpen. 2018. Available online: https://www.intechopen.com/books/traumatic-brain-injury-pathobiology-advanced-diagnostics-and-acute-management/perfusion-computed-tomography-in-traumatic-brain-injury (accessed on 21 January 2021).
- Byrnes, K.R.; Wilson, C.M.; Brabazon, F.; Von Leden, R.; Jurgens, J.S.; Oakes, T.R.; Selwyn, R.G. FDG-PET imaging in mild traumatic brain injury: A critical review. Front. Neuroenerget. 2014, 5, 13. [Google Scholar] [CrossRef]
- Donohoe, K.J.; Agrawal, G.; Frey, K.A.; Gerbaudo, V.H.; Mariani, G.; Nagel, J.S.; Shulkin, B.L.; Stabin, M.G.; Stokes, M.K. SNM Practice Guideline for Brain Death Scintigraphy 2.0. J. Nucl. Med. Technol. 2012, 40, 198–203. [Google Scholar] [CrossRef]
- Fatima, N.; Shuaib, A.; Chughtai, T.; Ayyad, A.; Saqqur, M. The role of transcranial doppler in traumatic brain injury: A systemic review and meta-analysis. Asian J. Neurosurg. 2019, 14, 626–633. [Google Scholar] [CrossRef]
- Haghbayan, H.; Boutin, A.; Laflamme, M.; Lauzier, F.; Shemilt, M.; Moore, L.; Zarychanski, R.; Douville, V.; Fergusson, D.; Turgeon, A.F. The Prognostic Value of MRI in Moderate and Severe Traumatic Brain Injury: A Systematic Review and Meta-Analysis. Crit. Care Med. 2017, 45, e1280–e1288. [Google Scholar] [CrossRef] [PubMed]
- Page, M.J.; McKenzie, J.E.; Bossuyt, P.M.; Boutron, I.; Hoffmann, T.C.; Mulrow, C.D.; Shamseer, L.; Tetzlaff, J.M.; Akl, E.A.; Brennan, S.E.; et al. The PRISMA 2020 statement: An updated guideline for reporting systematic reviews. BMJ 2021, 372, n71. [Google Scholar] [CrossRef] [PubMed]
- RevMan. 2022. Available online: https://training.cochrane.org/online-learning/core-software/revman (accessed on 24 May 2021).
- R: The R Project for Statistical Computing. 2022. Available online: https://www.r-project.org/ (accessed on 3 June 2021).
- Noma, H.; Matsushima, Y.; Ishii, R. Confidence interval for the AUC of SROC curve and some related methods using bootstrap for meta-analysis of diagnostic accuracy studies. Commun. Stat. Case Stud. Data Anal. Appl. 2021, 7, 344–358. [Google Scholar] [CrossRef]
- Sterne, J.A.C.; Hernán, M.A.; Reeves, B.C.; Savović, J.; Berkman, N.D.; Viswanathan, M.; Henry, D.; Altman, D.G.; Ansari, M.T.; Boutron, I.; et al. ROBINS-I: A tool for assessing risk of bias in non-randomised studies of interventions. BMJ 2016, 355, i4919. [Google Scholar] [CrossRef] [PubMed]
- Bindu, T.S.; Vyas, S.; Khandelwal, N.; Bhatia, V.; Dhandapani, S.; Kumar, A.; Ahuja, C.K. Role of whole-brain computed tomography perfusion in head injury patients to predict outcome. Indian J. Radiol. Imaging 2017, 27, 268–273. [Google Scholar] [CrossRef]
- Compagnone, C.; d’Avella, D.; Servadei, F.; Angileri, F.F.; Brambilla, G.; Conti, C.; Cristofori, L.; Delfini, R.; Denaro, L.; Ducati, A.; et al. Patients with moderate head injury: A prospective multicenter study of 315 patients. Neurosurgery 2009, 64, 690–696, discussion 696–697. [Google Scholar] [CrossRef]
- Henninger, N.; Compton, R.A.; Khan, M.W.; Carandang, R.; Hall, W.; Muehlschlegel, S. “Don’t lose hope early”: Hemorrhagic diffuse axonal injury on head computed tomography is not associated with poor outcome in moderate to severe traumatic brain injury patients. J. Trauma Inj. Infect. Crit. Care 2018, 84, 473–482. [Google Scholar] [CrossRef]
- Khalilabadi, A.J.; Shahraki, M.K.; Rezaeifard, R.; Jafari, R.; Zarooei, J.M.; Salarzaei, M.; Zaare, M.A. The Relationship between CT scan Findings, Level of Consciousness and Outcome Score in Patients with Traumatic Brain Hemorrhage. Pharm. Lett. 2016, 8, 140–144. [Google Scholar]
- Kotwica, Z.; Jakubowski, J.K. Head-injured adult patients with GCS of 3 on admission--who have a chance to survive? Acta Neurochir. 1995, 133, 56–59. [Google Scholar] [CrossRef]
- Kreitzer, N.; Hart, K.; Lindsell, C.J.; Betham, B.; Gozal, Y.; Andaluz, N.O.; Lyons, M.S.; Bonomo, J.; Adeoye, O. Factors associated with adverse outcomes in patients with traumatic intracranial hemorrhage and Glasgow Coma Scale of 15. Am. J. Emerg. Med. 2017, 35, 875–880. [Google Scholar] [CrossRef]
- Legrand, A.; Jeanjean, P.; Delanghe, F.; Peltier, J.; Lecat, B.; Dupont, H. Estimation of optic nerve sheath diameter on an initial brain computed tomography scan can contribute prognostic information in traumatic brain injury patients. Crit. Care 2013, 17, R61. [Google Scholar] [CrossRef]
- Letourneau-Guillon, L.; Huynh, T.; Jakobovic, R.; Milwid, R.; Symons, S.; Aviv, R. Traumatic Intracranial Hematomas: Prognostic Value of Contrast Extravasation. Am. J. Neuroradiol. 2012, 34, 773–779. [Google Scholar] [CrossRef] [PubMed]
- Moreno, J.A.; Mesalles, E.; Gener, J.; Tomasa, A.; Ley, A.; Roca, J.; Fernández-Llamazares, J. Evaluating the outcome of severe head injury with transcranial Doppler ultrasonography. Neurosurg. Focus 2000, 8, e8. [Google Scholar] [CrossRef]
- Naraghi, L.; Larentzakis, A.; Chang, Y.; Duhaime, A.C.; Kaafarani, H.; Yeh, D.D.; King, D.R.; de Moya, M.A.; Velmahos, G.C. Is CT Angiography of the Head Useful in the Management of Traumatic Brain Injury? J. Am. Coll. Surg. 2015, 220, 1027–1031. [Google Scholar] [CrossRef] [PubMed]
- Quigley, M.R.; Chew, B.G.; Swartz, C.E.; Wilberger, J.E. The clinical significance of isolated traumatic subarachnoid hemorrhage. J. Trauma Inj. Infect. Crit. Care 2013, 74, 581–584. [Google Scholar] [CrossRef] [PubMed]
- Shankar, J.J.S.; Green, R.; Virani, K.; Wong, H.; Eddy, K.; Vandorpe, R. Admission Perfusion CT for Classifying Early In-Hospital Mortality of Patients With Severe Traumatic Brain Injury: A Pilot Study. Am. J. Roentgenol. 2020, 214, 872–876. [Google Scholar] [CrossRef] [PubMed]
- Splavski, B.; Radanović, B.; Vranković, D.; Has, B.; Mužević, D.; Jančuljak, D.; Legcević, J. Transcranial Doppler ultrasonography as an early outcome forecaster following severe brain injury. Br. J. Neurosurg. 2006, 20, 386–390. [Google Scholar] [CrossRef]
- Tasaki, O.; Shiozaki, T.; Hamasaki, T.; Kajino, K.; Nakae, H.; Tanaka, H.; Shimazu, T.; Sugimoto, H. Prognostic Indicators and Outcome Prediction Model for Severe Traumatic Brain Injury. J. Trauma Inj. Infect. Crit. Care 2009, 66, 304–308. [Google Scholar] [CrossRef]
- Tucker, B.; Aston, J.; Dines, M.; Caraman, E.; Yacyshyn, M.; McCarthy, M.; Olson, J.E. Early Brain Edema is a Predictor of In-Hospital Mortality in Traumatic Brain Injury. J. Emerg. Med. 2017, 53, 18–29. [Google Scholar] [CrossRef]
- Waqas, M.; Bakhshi, S.K.; Shamim, M.S.; Anwar, S. Radiological prognostication in patients with head trauma requiring decompressive craniectomy: Analysis of optic nerve sheath diameter and Rotterdam CT Scoring System. J. Neuroradiol. 2016, 43, 25–30. [Google Scholar] [CrossRef]
- Wintermark, M.; van Melle, G.; Schnyder, P.; Revelly, J.-P.; Porchet, F.; Regli, L.; Meuli, R.; Maeder, P.; Chioléro, R. Admission Perfusion CT: Prognostic Value in Patients with Severe Head Trauma. Radiology 2004, 232, 211–220. [Google Scholar] [CrossRef] [PubMed]
- Wong, G.K.; Tang, B.Y.H.; Yeung, J.H.H.; Collins, G.; Rainer, T.; Ng, S.C.; Poon, W.S. Traumatic intracerebral haemorrhage: Is the CT pattern related to outcome? Br. J. Neurosurg. 2009, 23, 601–605. [Google Scholar] [CrossRef] [PubMed]
- Yamamura, H.; Morioka, T.; Yamamoto, T.; Mizobata, Y. Head computed tomographic measurement as a predictor of outcome in patients with subdural hematoma with cerebral edema. Scand. J. Trauma Resusc. Emerg. Med. 2016, 24, 83. [Google Scholar] [CrossRef]
- Carney, N.; Totten, A.M.; O’Reilly, C.; Ullman, J.S.; Hawryluk, G.W.J.; Bell, M.J.; Bratton, S.L.; Chesnut, R.; Harris, O.A.; Kissoon, K.N.; et al. Guidelines for the Management of Severe Traumatic Brain Injury, Fourth Edition. Neurosurgery 2017, 80, 6–15. [Google Scholar] [CrossRef] [PubMed]
- Husson, E.; Ribbers, G.; Son, A.W.-V.; Verhagen, A.; Stam, H. Prognosis of six-month functioning after moderate to severe traumatic brain injury: A systematic review of prospective cohort studies. J. Rehabil. Med. 2010, 42, 425–436. [Google Scholar] [CrossRef]
- Perel, P.; Edwards, P.; Wentz, R.; Roberts, I. Systematic review of prognostic models in traumatic brain injury. BMC Med. Inform. Decis. Mak. 2006, 6, 38. [Google Scholar] [CrossRef]
- Kelly, A.B.; Zimmerman, R.D.; Snow, R.B.; E Gandy, S.; A Heier, L.; Deck, M.D. Head trauma: Comparison of MR and CT--experience in 100 patients. Am. J. Neuroradiol. 1988, 9, 699–708. [Google Scholar]


| First Author and Year | Study Design | # of Patients | Imaging Modality | Patient Outcome Measure(s) |
|---|---|---|---|---|
| Bindu et al. 2017 [19] | Prospective cohort | 78 | CTP | GOS at 3-month follow-up.
|
| Compagnone et al. 2009 [20] | Prospective cohort | 315 | NECT | GOS at 6-month follow-up.
|
| Henninger et al. 2018 [21] | Prospective cohort | 361 | NECT | ICU length of stay and complications. Survival at discharge, and 3-month and 12-month follow-up. GOS at 3-month and 12-month follow-up.
|
| Khalilabadi et al. 2016 [22] | Prospective cohort | 100 | NECT | GOS (unspecified follow-up interval).
|
| Kotwica and Jakubowski 1995 [23] | Retrospective cohort | 111 | NECT | GOS 60 days post-admission. |
| Kreitzer et al. 2017 [24] | Retrospective cohort | 240 | NECT | Mortality within 2 weeks. Social security death index for no follow-up after 14 days post-injury. Neurosurgical intervention (procedure performed by neurosurgery for head injury, including external ventricular drain (EVD) placement or intracranial pressure (ICP) monitor placement) within 2 weeks. Length of stay >48 h. |
| Legrand et al. 2013 [25] | Prospective cohort | 77 | NECT | Mortality during ICU admission. GOS at 6-month follow-up.
|
| Letourneau-Guillon et al. 2013 [26] | Retrospective cohort | 66 | CTA with delayed phase | Hematoma expansion (>12 mL and 33%) Need for hematoma surgical evacuation and in-hospital mortality.
|
| Moreno et al. 2000 [27] | Prospective cohort | 125 | TCD and NECT | GOS at 6-month follow-up.
|
| Naraghi et al. 2015 [28] | Retrospective cohort | 600 (132) | NECT (with CTA) | Primary: Changes to management or additional medical therapy by CTA findings. Secondary: Admission to ICU, ICU length-of-stay, hospital length-of-stay, discharge disposition, in-hospital mortality. |
| Quigley et al. 2013 [29] | Retrospective cohort | 478 | NECT | Length of ICU and hospital stay, progression of hemorrhage and other injuries, any need for further intervention or clinical deterioration, in-hospital mortality, discharge home status. |
| Shankar et al. 2020 [30] | Pilot prospective cohort | 19 | NECT with CTA and CTP | In-hospital mortality ≤48 h of admission. |
| Splavski et al. 2006 [31] | Prospective cohort | 30 | TCD | GOS at 6-month follow-up.
|
| Tasaki et al. 2009 [32] | Prospective cohort | 111 | NECT | GOS at 6-month follow-up.
|
| Tucker et al. 2017 [33] | Prospective cohort | 7277 | NECT | In-hospital mortality. |
| Waqas et al. 2015 [34] | Retrospective cohort | 117 | NECT | ICU length of stay, total length of stay, survival at discharge. GOS at latest follow-up.
|
| Wintermark et al. 2004 [35] | Prospective cohort | 130 | NECT with CTP | GOS at 3-month follow-up.
|
| Wong et al. 2009 [36] | Retrospective cohort | 464 | NECT | Length of ICU stay, and total hospital stay. In-hospital mortality and 1-year mortality. GOS at 1-year follow-up.
|
| Yamamura et al. 2016 [37] | Prospective cohort | 34 | NECT | In-hospital mortality. GOS during admission.
|
| Imaging Finding | Relationship with Patient Outcome |
|---|---|
| Subarachnoid hemorrhage (SAH) | Association with worse outcomes
|
| Subdural hematoma (SDH) | Association with worse outcomes
|
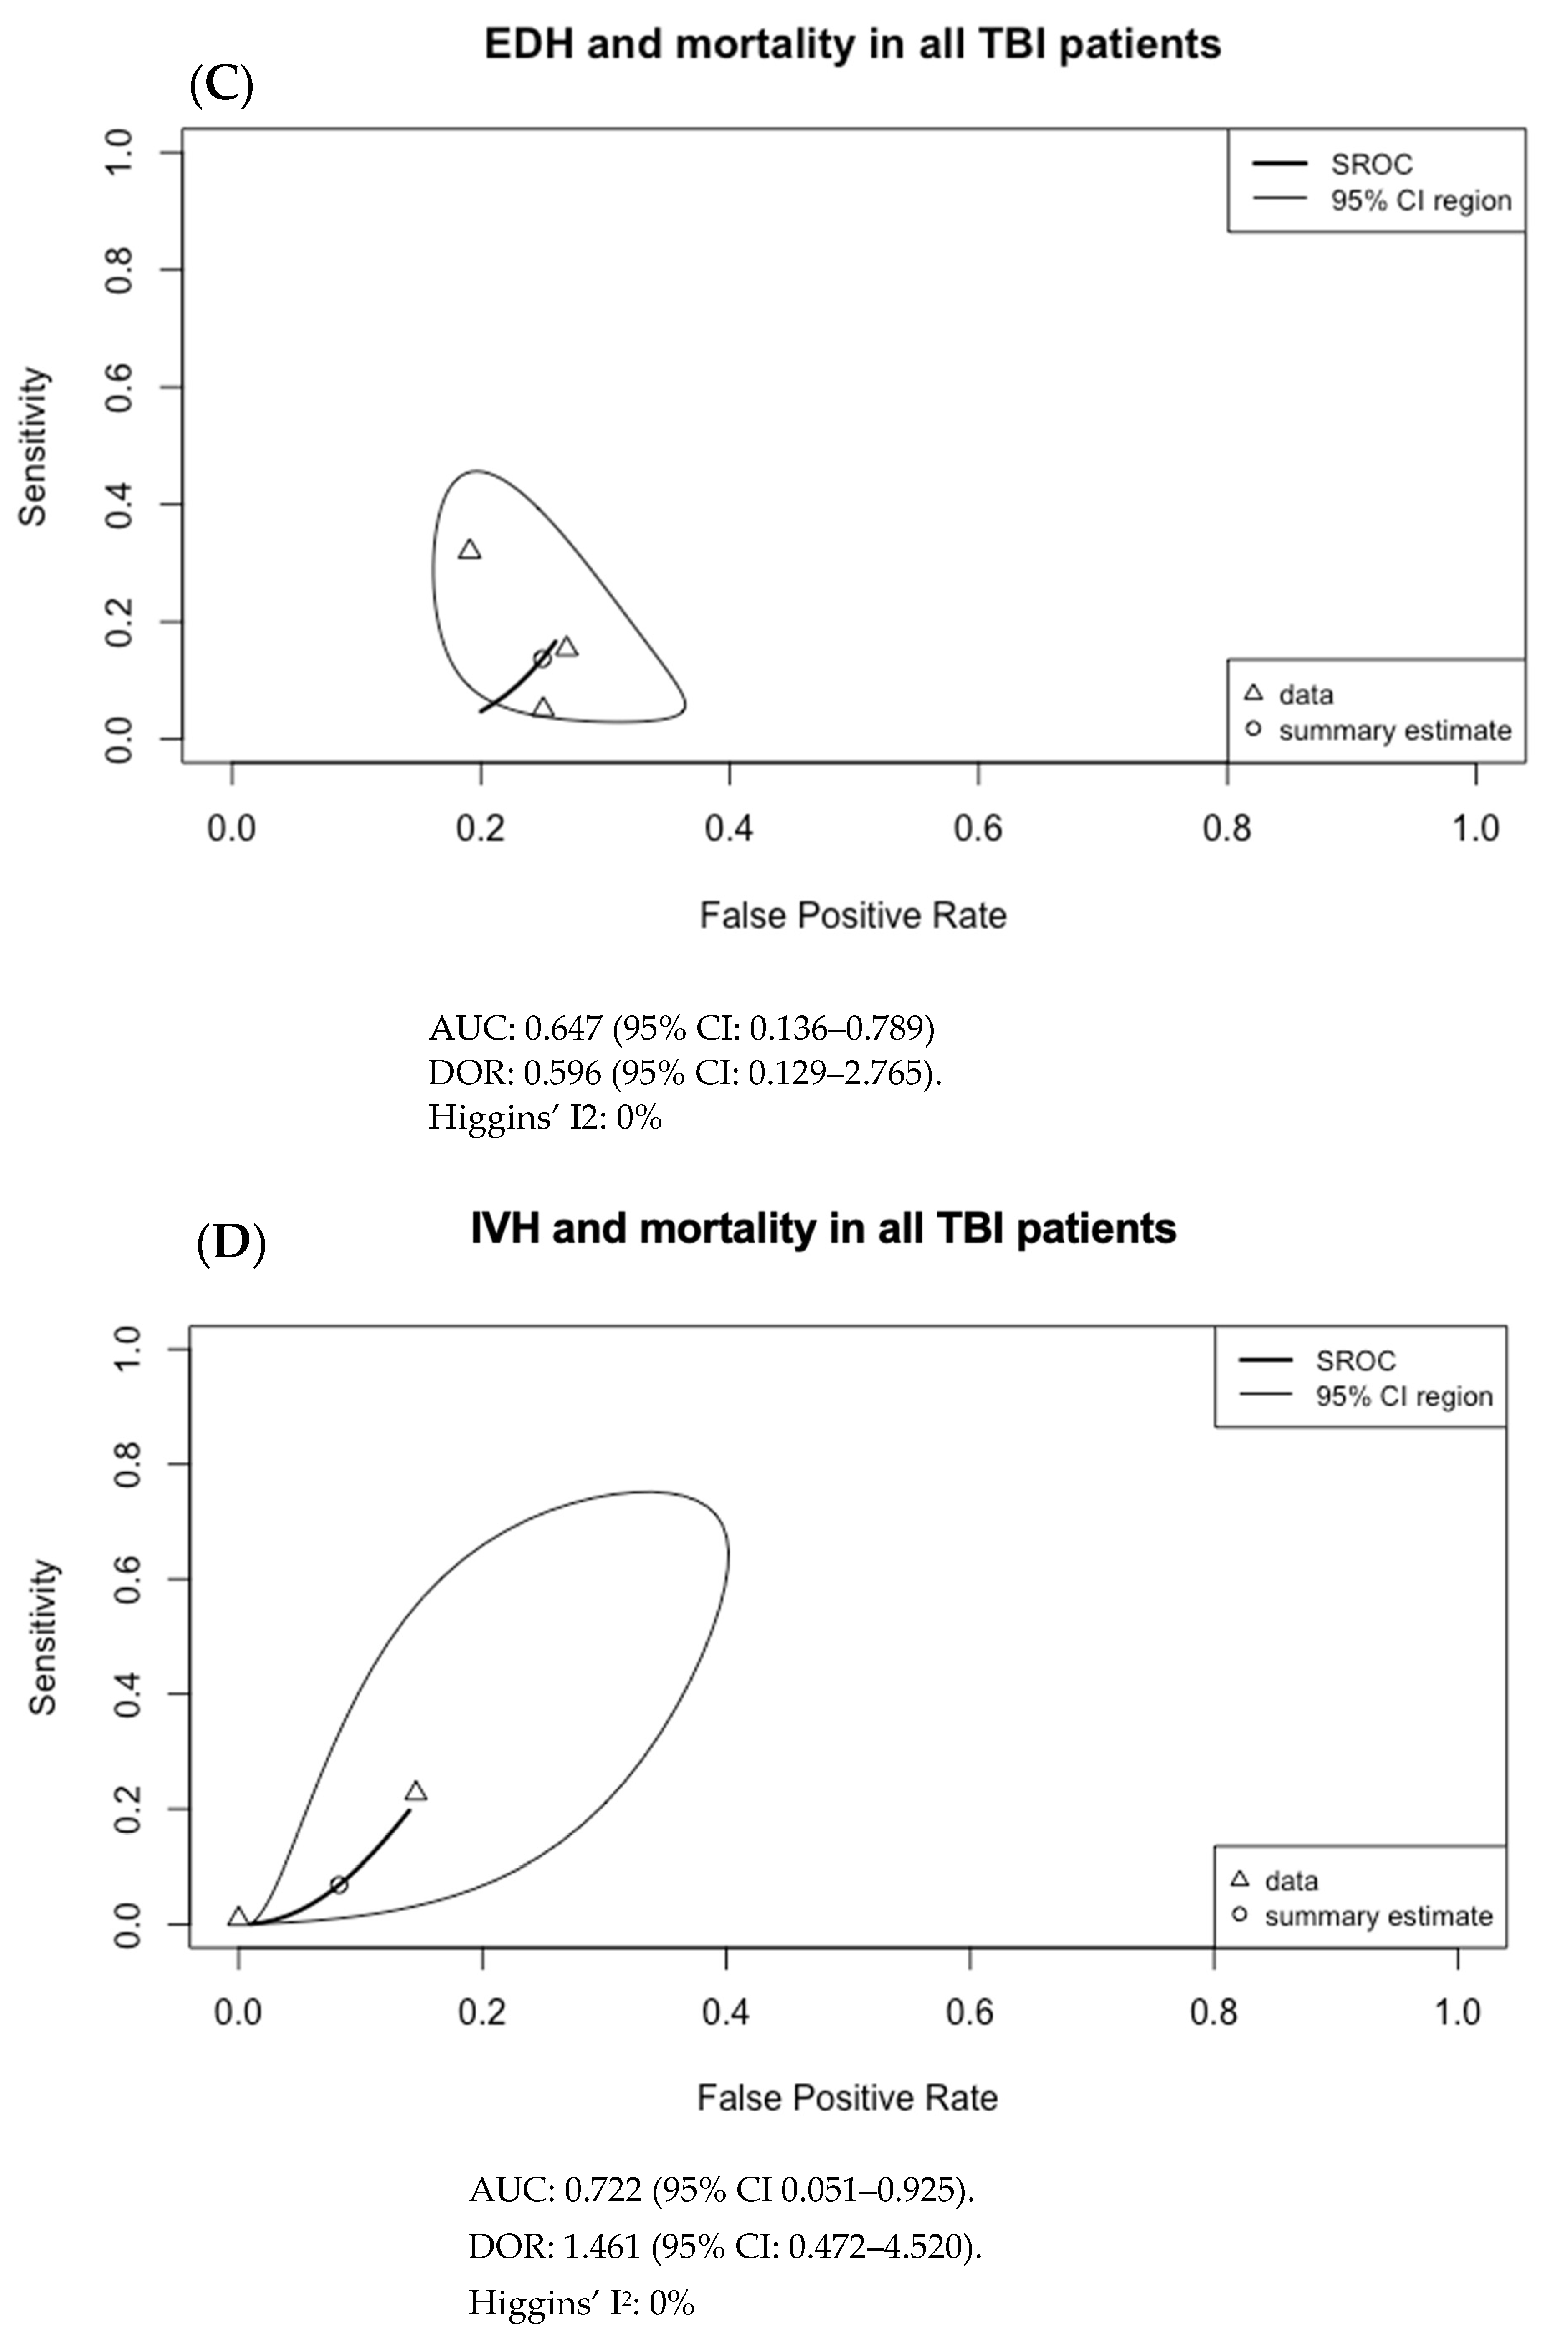
| Epidural hematoma (EDH) | Association with better outcomes
|
| Intraparenchymal hematoma (IPH)/Contusion | No significant association with outcome
|
| Intraventricular hemorrhage (IVH) | No significant association with outcome
|
| Hematoma size | Association with worse outcomes
|
| Hematoma location | Wong 2009 [36]:
|
| Diffuse axonal injury (DAI) | Henninger 2018 [21]:
|
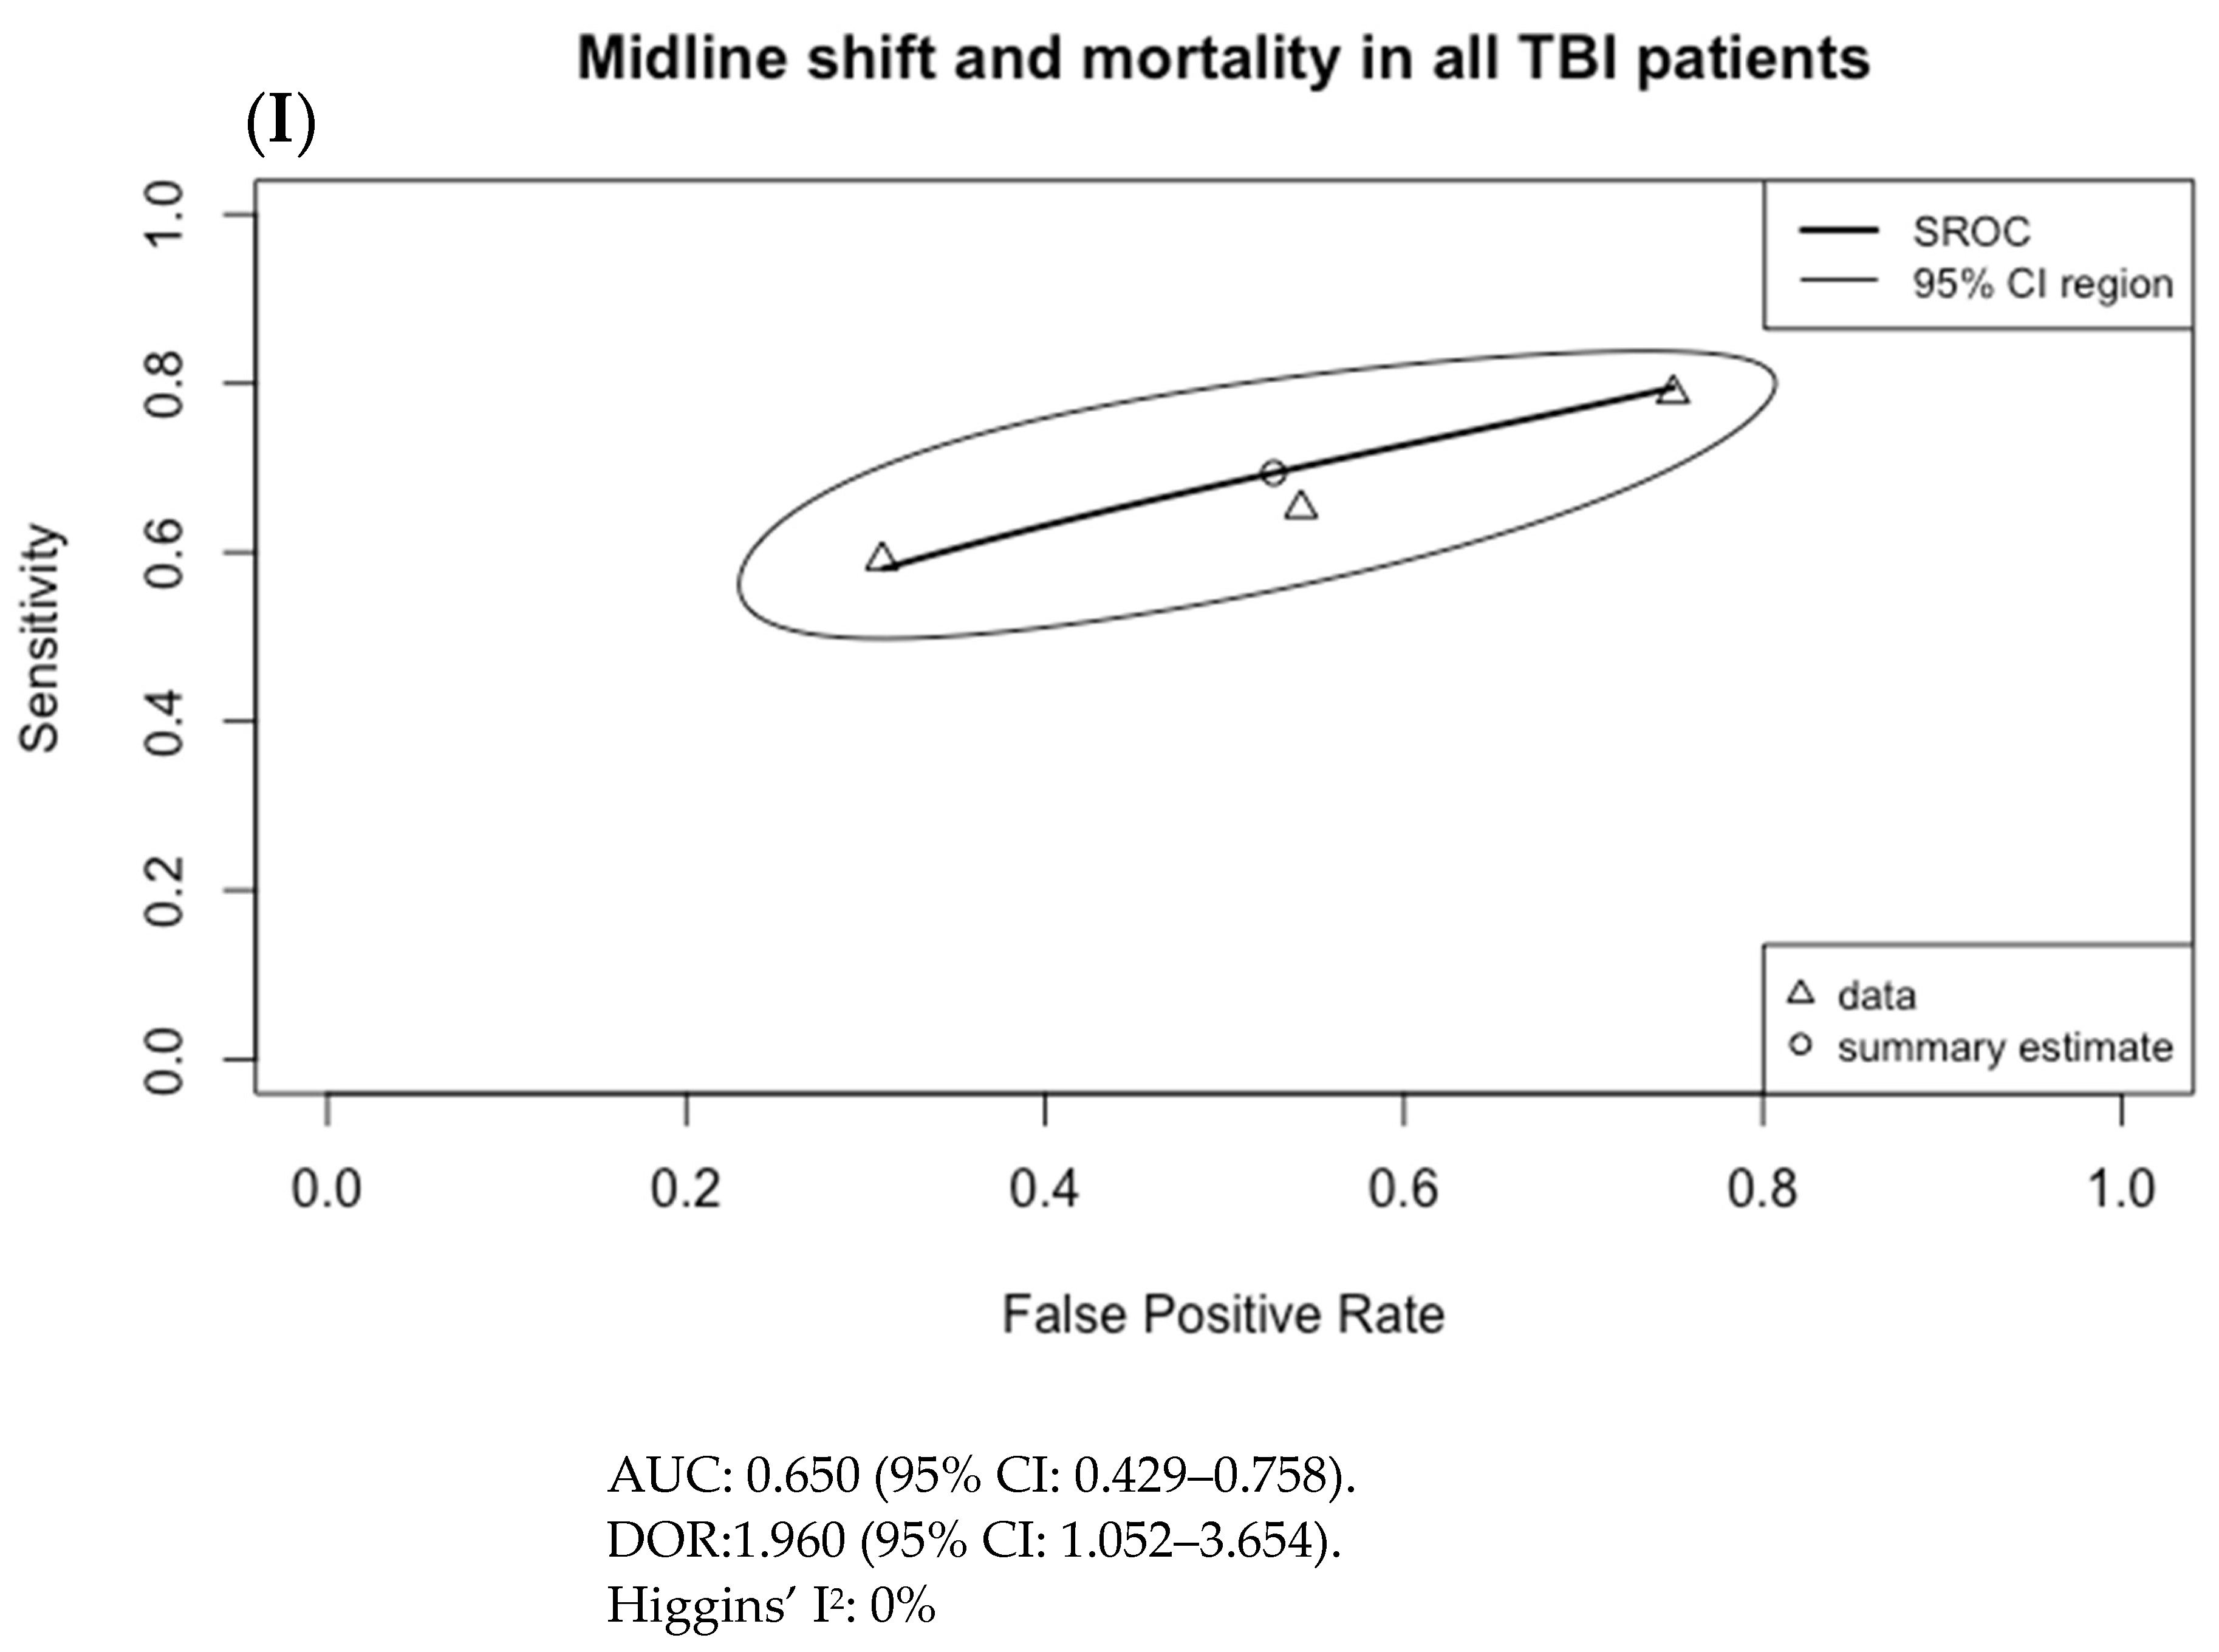
| Midline shift | Association with worse outcomes
|
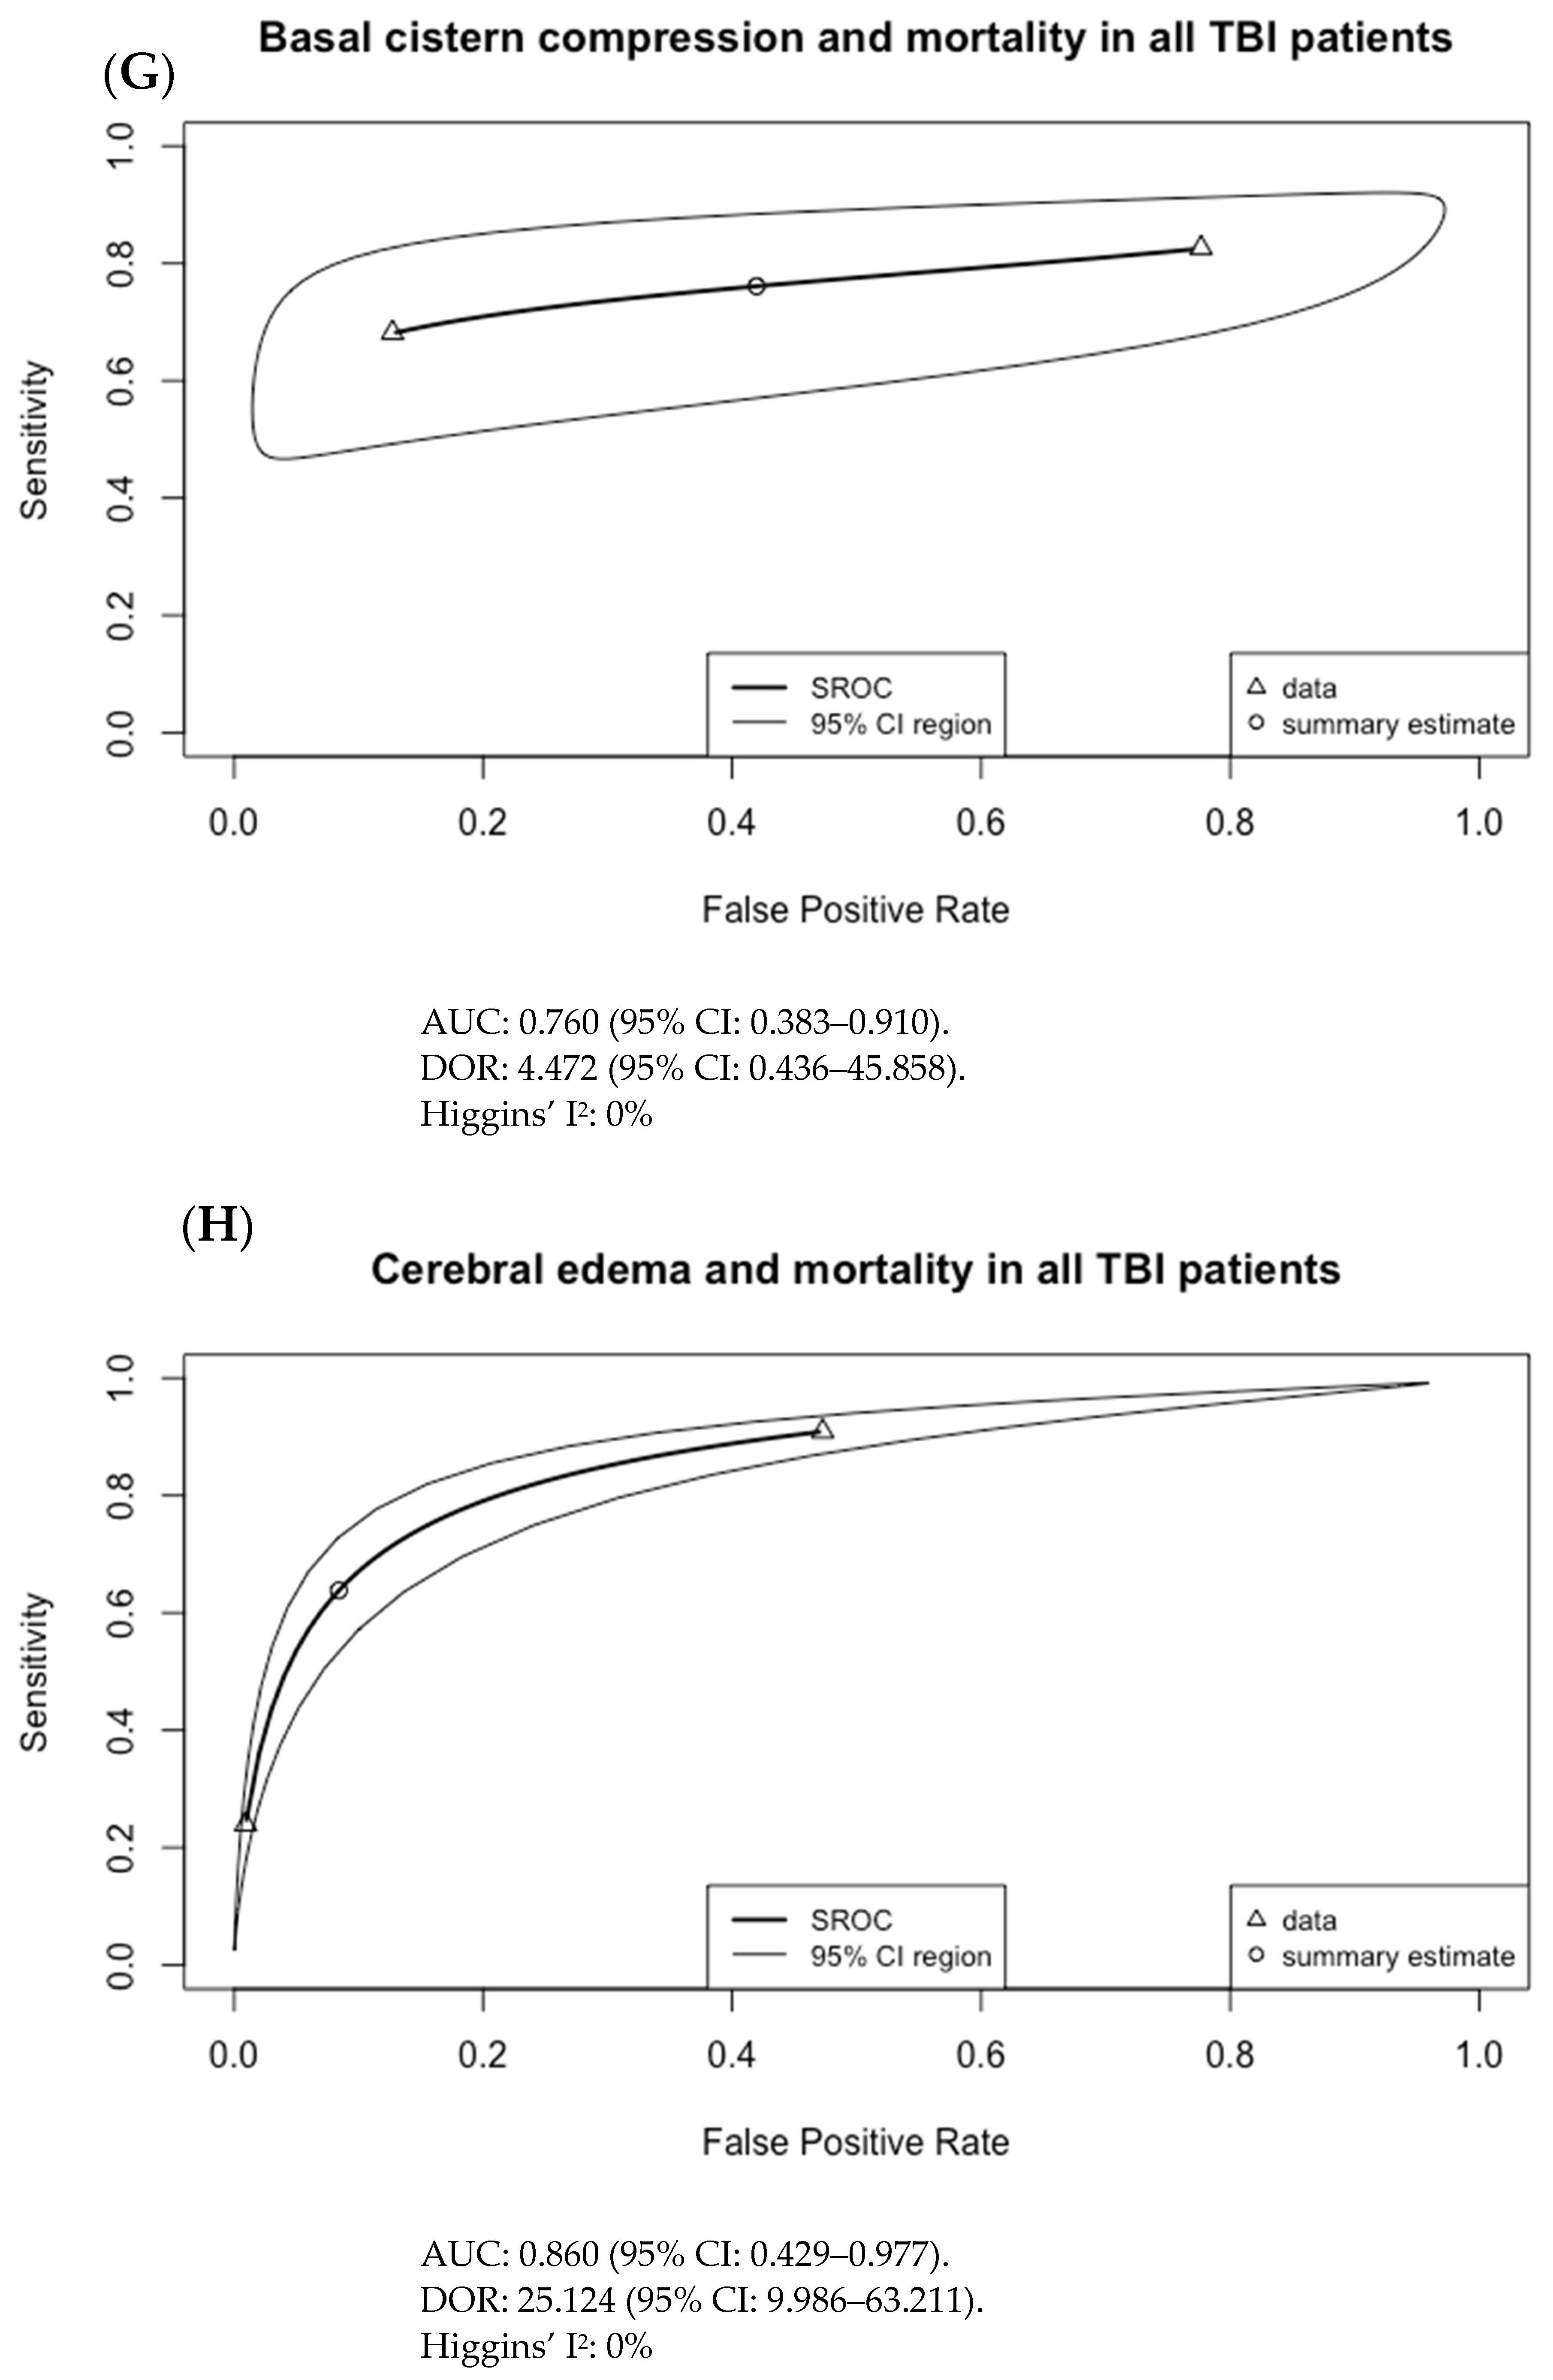
| Cerebral edema | Association with worse outcomes
|
| Basal cistern effacement/ compression | Association with worse outcomes
|
| Brain herniation | Association with worse outcomes
|
| Skull fracture | No significant association with outcome
|
| Angiography findings | Letourneau-Guillon 2013 [26]:
|
| CT Perfusion findings | Bindu 2017 [19]
|
| MCA velocity and PI | Moreno 2000 [27]:
|
| Optic nerve sheath diameter (ONSD) | Legrand 2013 [25]:
|
Disclaimer/Publisher’s Note: The statements, opinions and data contained in all publications are solely those of the individual author(s) and contributor(s) and not of MDPI and/or the editor(s). MDPI and/or the editor(s) disclaim responsibility for any injury to people or property resulting from any ideas, methods, instructions or products referred to in the content. |
© 2023 by the authors. Licensee MDPI, Basel, Switzerland. This article is an open access article distributed under the terms and conditions of the Creative Commons Attribution (CC BY) license (https://creativecommons.org/licenses/by/4.0/).
Share and Cite
Yu, H.; Ande, S.R.; Batoo, D.; Linton, J.; Shankar, J. Prognostic Value of Initial Diagnostic Imaging Findings for Patient Outcomes in Adult Patients with Traumatic Brain Injury: A Systematic Review and Meta-Analysis. Tomography 2023, 9, 509-528. https://doi.org/10.3390/tomography9020042
Yu H, Ande SR, Batoo D, Linton J, Shankar J. Prognostic Value of Initial Diagnostic Imaging Findings for Patient Outcomes in Adult Patients with Traumatic Brain Injury: A Systematic Review and Meta-Analysis. Tomography. 2023; 9(2):509-528. https://doi.org/10.3390/tomography9020042
Chicago/Turabian StyleYu, Hang, Sudharsana Rao Ande, Divjeet Batoo, Janice Linton, and Jai Shankar. 2023. "Prognostic Value of Initial Diagnostic Imaging Findings for Patient Outcomes in Adult Patients with Traumatic Brain Injury: A Systematic Review and Meta-Analysis" Tomography 9, no. 2: 509-528. https://doi.org/10.3390/tomography9020042
APA StyleYu, H., Ande, S. R., Batoo, D., Linton, J., & Shankar, J. (2023). Prognostic Value of Initial Diagnostic Imaging Findings for Patient Outcomes in Adult Patients with Traumatic Brain Injury: A Systematic Review and Meta-Analysis. Tomography, 9(2), 509-528. https://doi.org/10.3390/tomography9020042