Article

Comparison of 18F-fluorothymidine Positron Emission Tomography/Computed Tomography and 18F-fluorodeoxyglucose Positron Emission Tomography/Computed Tomography in Patients with Breast Cancer

1
Department of Diagnostic Radiology, Tokyo Medical and Dental University, 1-5-45 Yushima, Bunkyo-ku, Tokyo 113-8510, Japan
2
Department of Surgery, Breast Surgery, Tokyo Medical and Dental University, 1-5-45 Yushima, Bunkyo-ku, Tokyo 113-8510, Japan
3
Department of Comprehensive Pathology, Tokyo Medical and Dental University, 1-5-45 Yushima, Bunkyo-ku, Tokyo 113-8510, Japan
4
Department of Radiology, Dokkyo Medical University Saitama Medical Center, 2-1-50 Minamiko-shigaya, Koshigaya, Saitama 343-8555, Japan
*
Author to whom correspondence should be addressed.
Tomography 2022, 8(5), 2533-2546; https://doi.org/10.3390/tomography8050211
Submission received: 3 September 2022 / Revised: 8 October 2022 / Accepted: 9 October 2022 / Published: 11 October 2022
(This article belongs to the Special Issue New and Emerging Trends in Breast Imaging and Treatment)

Abstract

:
The uptake of 18F-fluorothymidine (18F-FLT) depends on cells’ proliferative rates. We compared the characteristics of 18F-FLT positron emission tomography/computed tomography (PET/CT) with those of 18F-fluorodeoxyglucose (18F-FDG) PET/CT for breast cancer. We prospectively diagnosed patients with breast cancer who underwent 18F-FLT PET/CT and 18F-FDG PET/CT. Subsequently, significant differences and correlation coefficients of the maximum standardized uptake value (SUVmax) in primary breast cancer and axillary lymph nodes were statistically evaluated. We enrolled eight patients with breast cancer. In six treatment-naive patients, the SUVmax for primary lesions showed a significant difference (mean, 2.1 vs. 4.1, p = 0.031) and a strong correlation (r = 0.969) between 18F-FLT and 18F-FDG. Further, although the SUVmax for the axillary lymph nodes did not show a significant difference between 18F-FLT and 18F-FDG (P = 0.246), there was a strong correlation between the two (r = 0.999). In a patient-by-patient study, there were cases in which only 18F-FDG uptake was observed in lymph nodes and normal breasts. Bone metastases demonstrated lower accumulation than bone marrow on the 18F-FLT PET/CT. In conclusion, a strong correlation was observed between the 18F-FLT PET/CT and 18F-FDG PET/CT uptake. Differences in the biochemical characteristics of 18F-FLT and 18F-FDG were reflected in the accumulation differences for breast cancer, metastatic lesions, and normal organs.

1. Introduction

Breast cancer staging aids in determining disease severity, informing treatment planning, and predicting prognosis [1]. 18F-fluorodeoxyglucose positron emission tomography/computed tomography (18F-FDG PET/CT) can be used to evaluate a lesion’s morphology and glucose metabolism [2]. In addition, the maximum standardized uptake value (SUVmax) of 18F-FDG can inform patients’ prognosis [3,4,5]. However, 18F-FDG accumulates in areas of inflammation and benign/malignant neoplasms [6]; considerable experience and knowledge are necessary when using 18F-FDG to achieve an accurate diagnosis.
Recently, 3′-deoxy-3′-18F-fluorothymidine (18F-FLT) was introduced as a stable cell proliferation imaging agent [7]. This pyrimidine analog uses the DNA synthesis salvage pathway for imaging proliferation [8]. The uptake of 18F-FLT reflects the activity of thymidine kinase-1, an enzyme expressed during the DNA synthesis phase of the cell cycle [9]. 18F-FLT PET is often compared with 18F-FDG PET for the visualization, diagnosis, and staging of lung, head, neck, stomach, esophagus, brain, and breast tumors [9,10,11,12,13,14,15,16]. Although the tumoral uptake of 18F-FLT is generally lower than that of 18F-FDG, 18F-FLT PET can provide high specificity because it is less likely to accumulate in the areas of inflammation associated with cancer therapy [6,8,17]. Furthermore, 18F-FLT uptake correlates significantly with cell proliferation, as indicated by the Ki-67 labeling indices in lung and brain tumors [6,9,13]. This tracer can help differentiate benign from malignant lesions, measure tumor aggressiveness, and monitor treatment response [6,8,18]. Few studies have compared 18F-FLT PET/CT and 18F-FDG PET/CT in patients with untreated breast cancer [19]. However, several studies have used 18F-FLT PET/CT to assess the early response to hormone therapy and chemotherapy as well as long-term survival in patients with breast cancer treated with neoadjuvant chemotherapy [18,20,21,22]. In this study, we aimed to clarify the characteristics of these tracers by comparing 18F-FLT PET/CT and 18F-FDG PET/CT in patients with breast cancer and assess the role of 18F-FLT PET/CT in breast cancer diagnosis.

2. Materials and Methods

2.1. PET/CT Protocol

18F-FLT and 18F-FDG were administered intravenously to patients at a dose of 3.7 MBq/kg. Fasting for at least 4 h was required before 18F-FDG administration but not for 18F-FLT administration. Whole-body images were obtained using a PET/CT system (Cartesion Prime or Celesteion; Canon Medical Systems, Tochigi, Japan). No-contrast CT scans were performed using the following parameters: pitch, 0.938; gantry rotation time, 0.5 s; table time, 30 mm/s; auto-exposure control (SD 20), 120 KVp; and slice thickness, 2.0 mm. After approximately 60 min of 18F-FDG administration, a whole-body emission PET was performed using the following parameters for the Cartesion Prime and Celesteion, respectively: emission time per bed, 90 s and 2 min; bed position, 6–7 and 9–10; slice thickness, 2.11 and 4.08 mm; and matrix, 336 × 336 and 144 × 144.

2.2. PET/CT Analysis

One of four nuclear medicine specialists with 8–12 years of experience prospectively evaluated eligible patients with breast cancer. The nuclear medicine specialists, who were unblinded to each patient’s breast cancer diagnosis, evaluated the images and cross-referenced the mammography, ultrasound, and magnetic resonance imaging images as required. Accumulations within primary breast tumors and metastatic lesions were measured in terms of the SUVmax using Vox-base version 2.8 (J-MAC System, Inc., Hokkaido, Japan). For diagnosing the axillary lymph node metastases, we compared the tumor size and 18F-FDG uptake between the affected and contralateral sides. A mass with an abnormal 18F-FDG uptake was considered a distant metastasis. Concurrent CT scans were also carefully examined for regions with high physiologic accumulation (i.e., the brain for 18F-FDG PET/CT and bone marrow for 18F-FLT PET/CT).

2.3. Statistical Analysis

The SUVmax for primary breast cancer and axillary lymph nodes in treatment-naive (no prior surgery or chemotherapy) patients before PET/CT were compared between 18F-FLT PET/CT and 18F-FDG PET/CT. Distributions were analyzed using the Shapiro–Wilk test, and p-values of ≥0.05 were considered normally distributed. Significant differences were tested using a two-tailed paired t-test for normally distributed variables and the Wilcoxon signed-rank test for non-normally distributed variables. A p-value of <0.05 was considered statistically significant. In addition, the correlation between the SUVmax of the 18F-FLT PET/CT and that of the 18F-FDG PET/CT was assessed using Pearson’s correlation coefficient. The correlation coefficients ranged from −1 to +1, with 0 indicating no linear or monotonic associations; the relationship was considered stronger as the coefficient approached an absolute value of 1 [23].

3. Results

A total of 8 female patients with breast cancer, with a mean age of 64.8 years (standard deviation, 9.8 years; range, 49–73 years), were enrolled. Six patients were treatment-naive before the PET/CT, which included three surgical cases and three inoperable cases. Table 1 shows the number of days from biopsy to 18F-FLT PET/CT, 18F-FDG PET/CT, and surgery. All six treatment-naive breast cancers were invasive ductal carcinomas (the luminal type). We compared the 18F-FLT PET/CT with the 18F-FDG PET/CT in one of the two patients treated (i.e., non-treatment-naive) before the PET/CT. The interval between the PET/CTs was four days. Further, another patient was assessed solely based on recent 18F-FLT PET/CT findings.

3.1. Surgical Cases

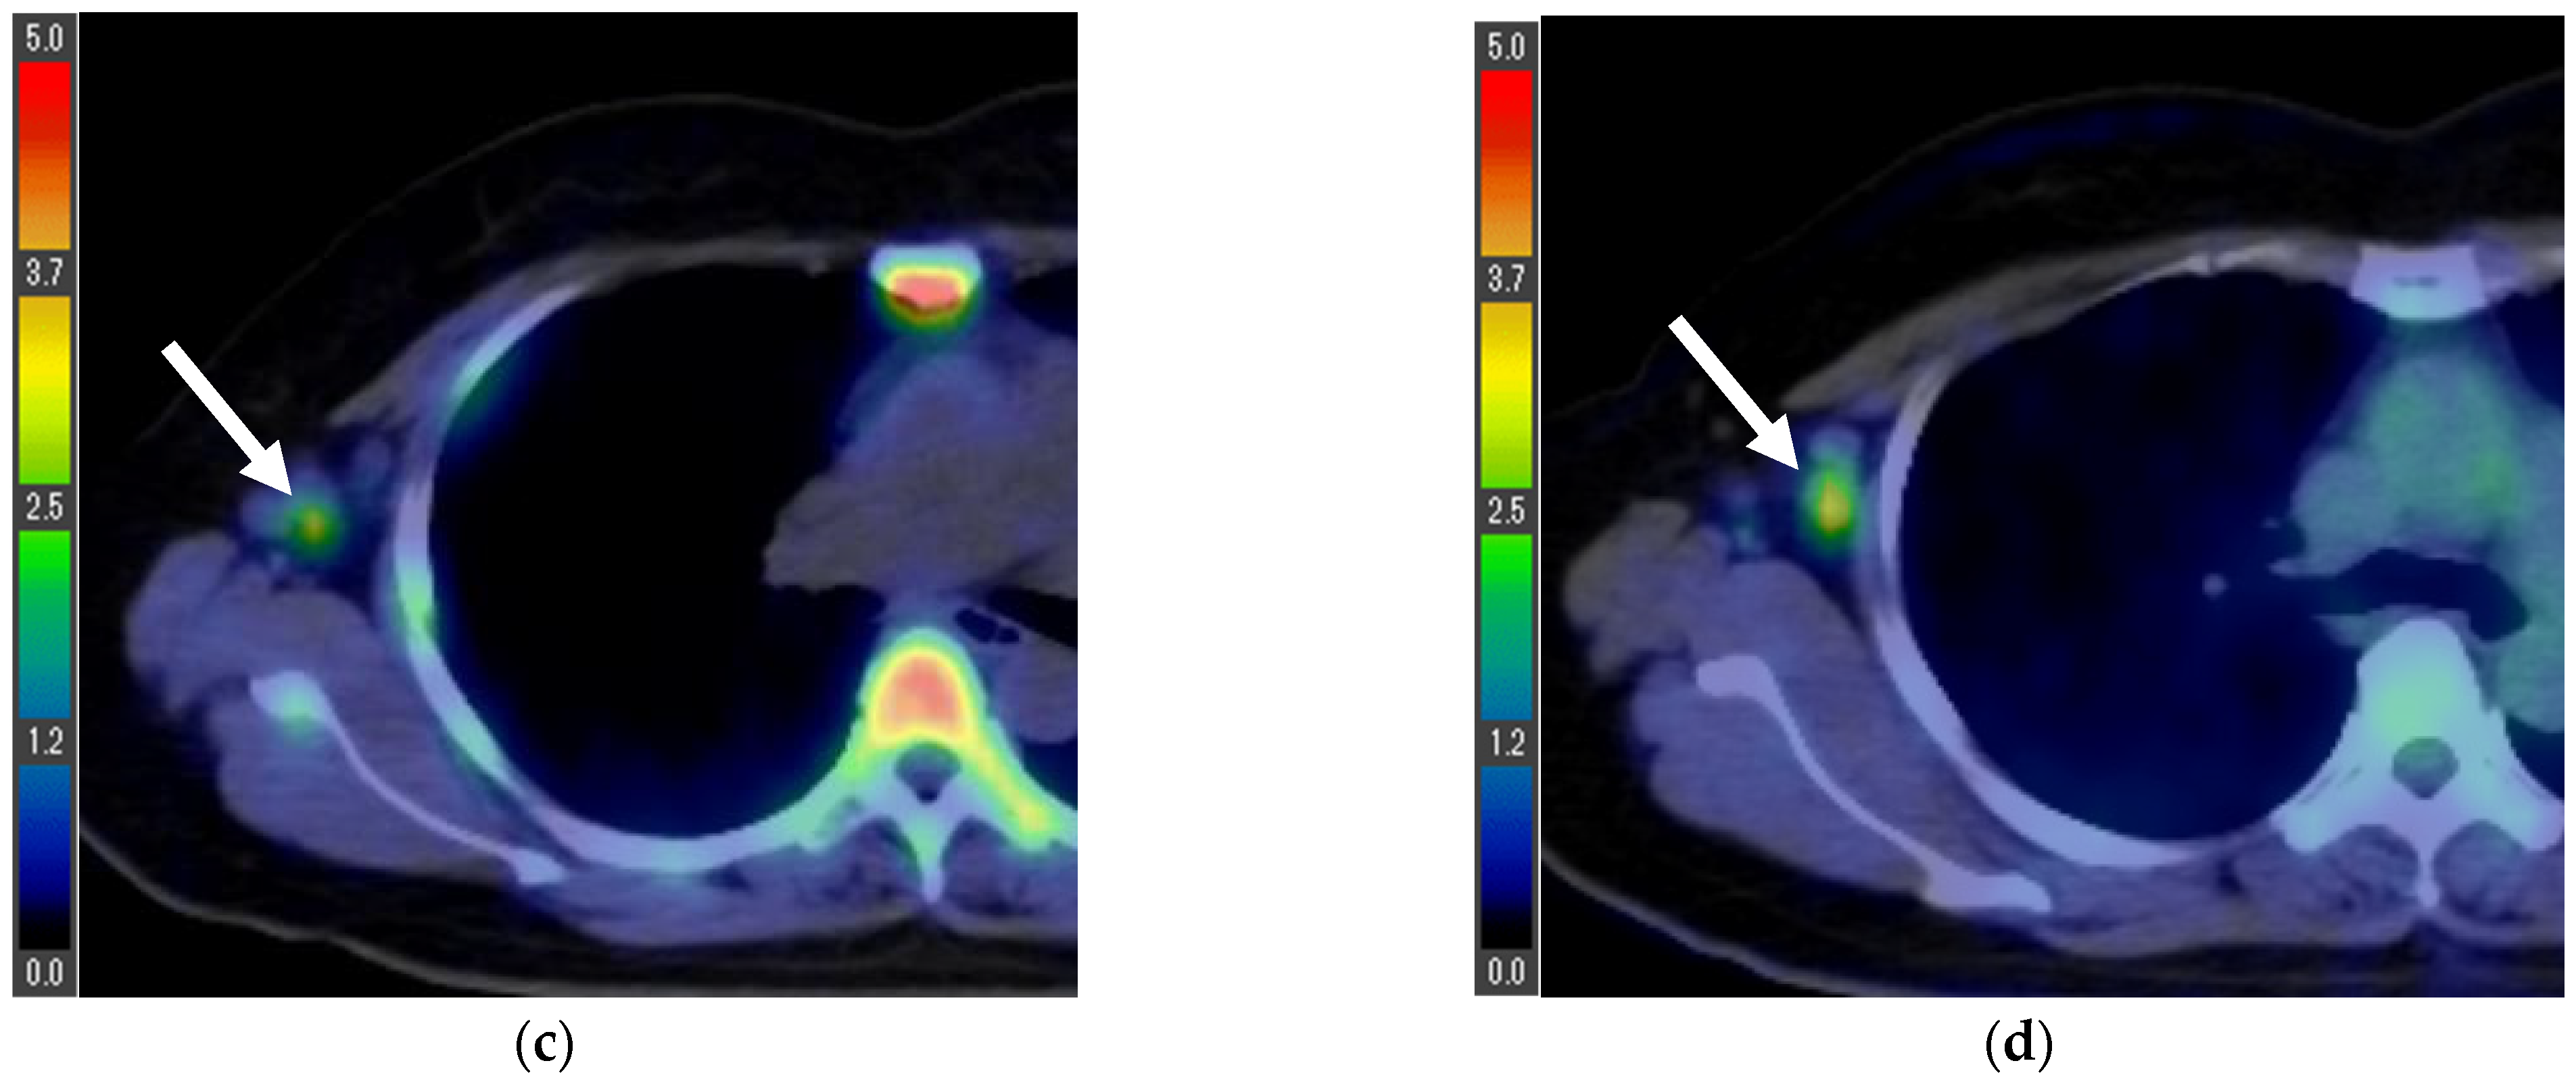
Three patients underwent 18F-FLT PET/CT for preoperative staging. In all patients, the SUVmax values of the primary lesions and axillary lymph nodes were lower on the 18F-FLT PET/CT than on the 18F-FDG PET/CT (Table 2). Patient one had metastases in 5/15 dissected axillary lymph nodes. The axillary lymph node that showed the greatest accumulation differed between the 18F-FLT PET/CT and 18F-FDG PET/CT, with SUVmax values of 3.0 and 3.4, respectively (Figure 1).

3.2. Inoperable Cases

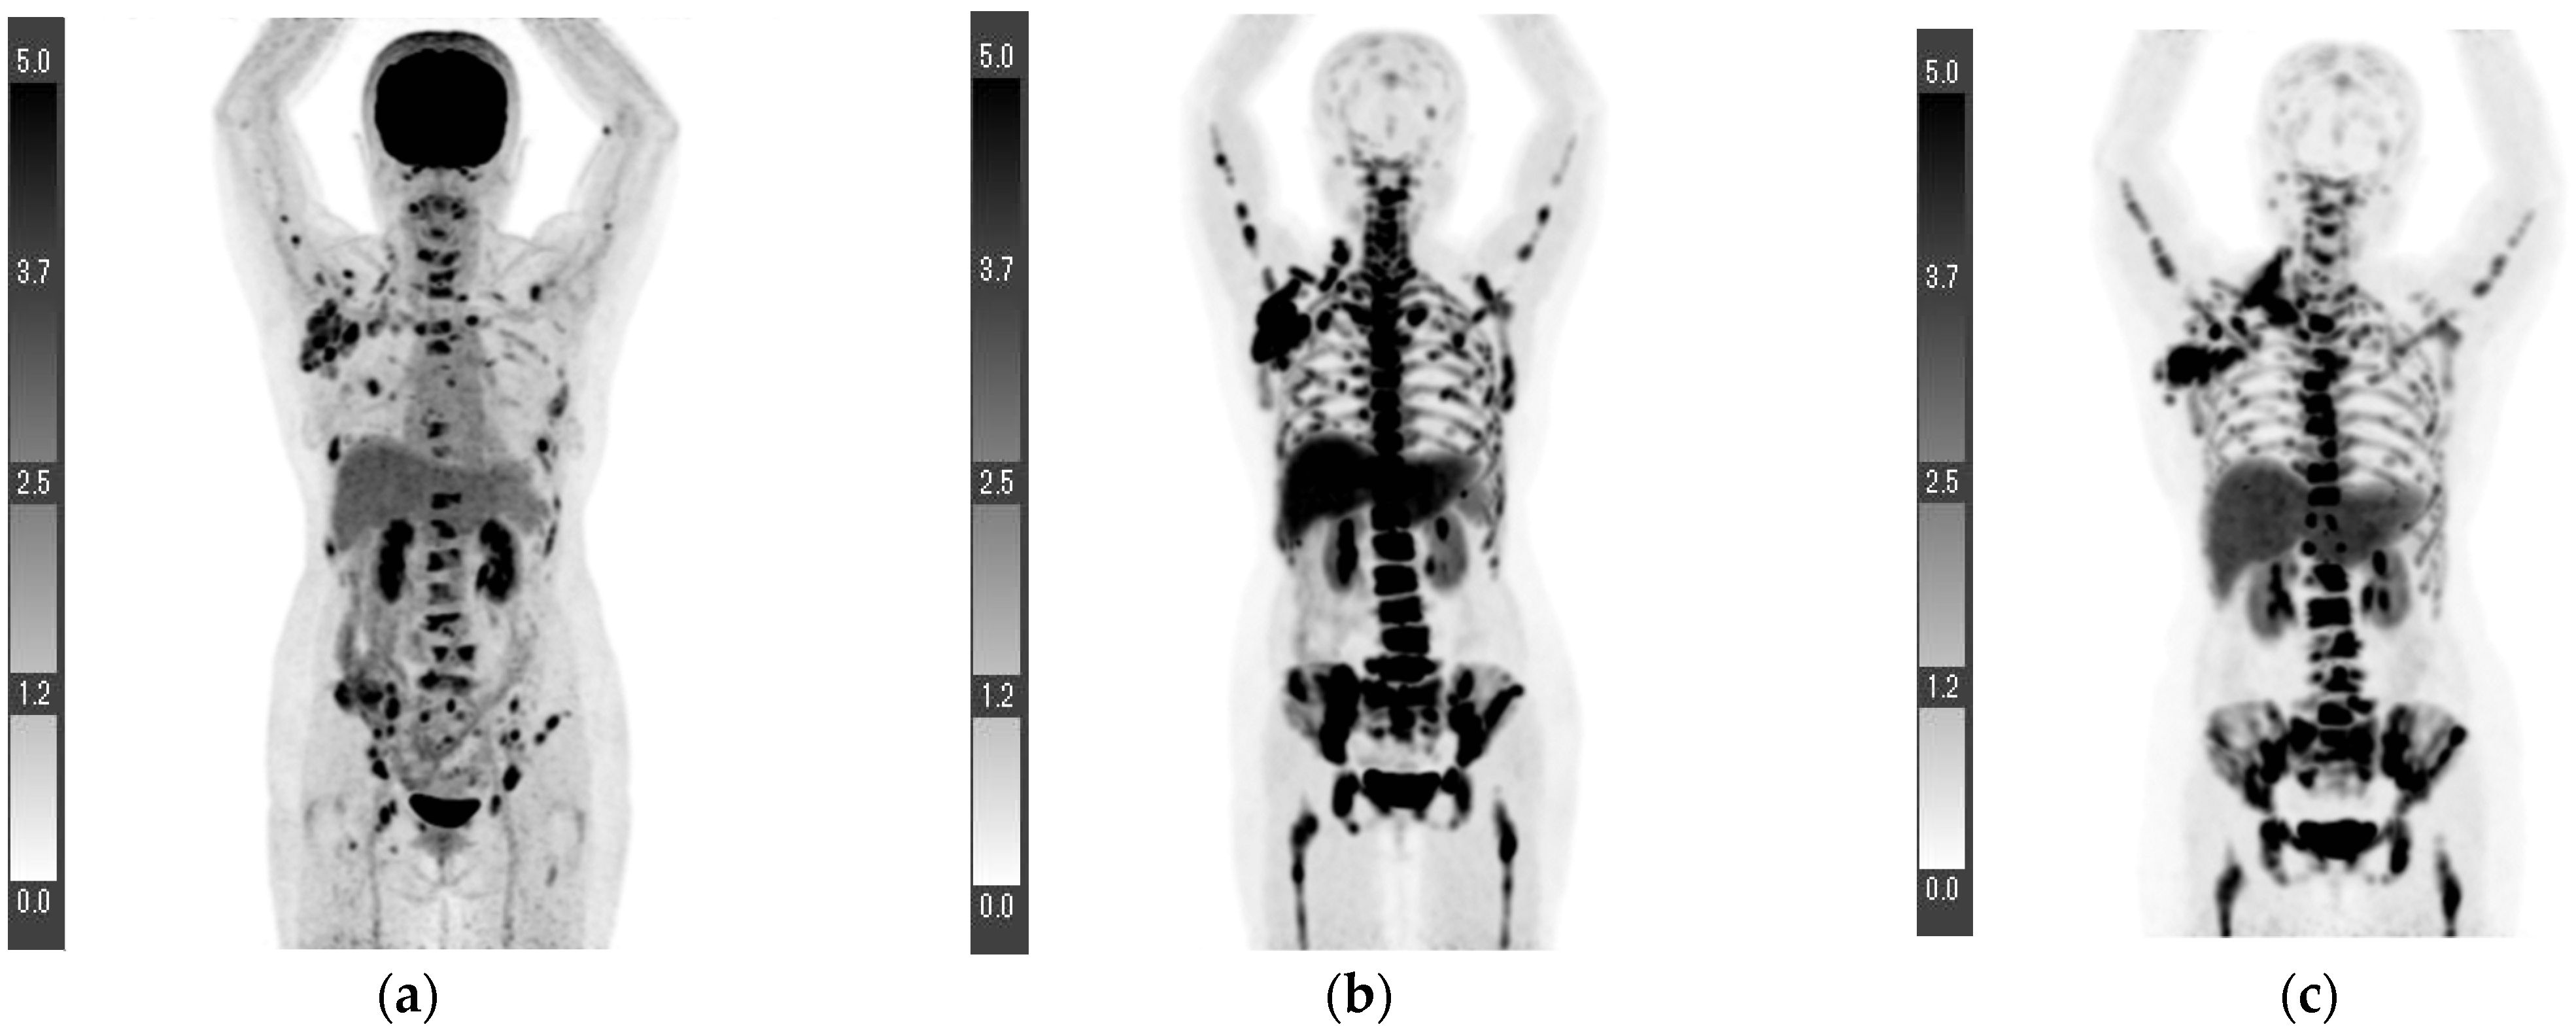
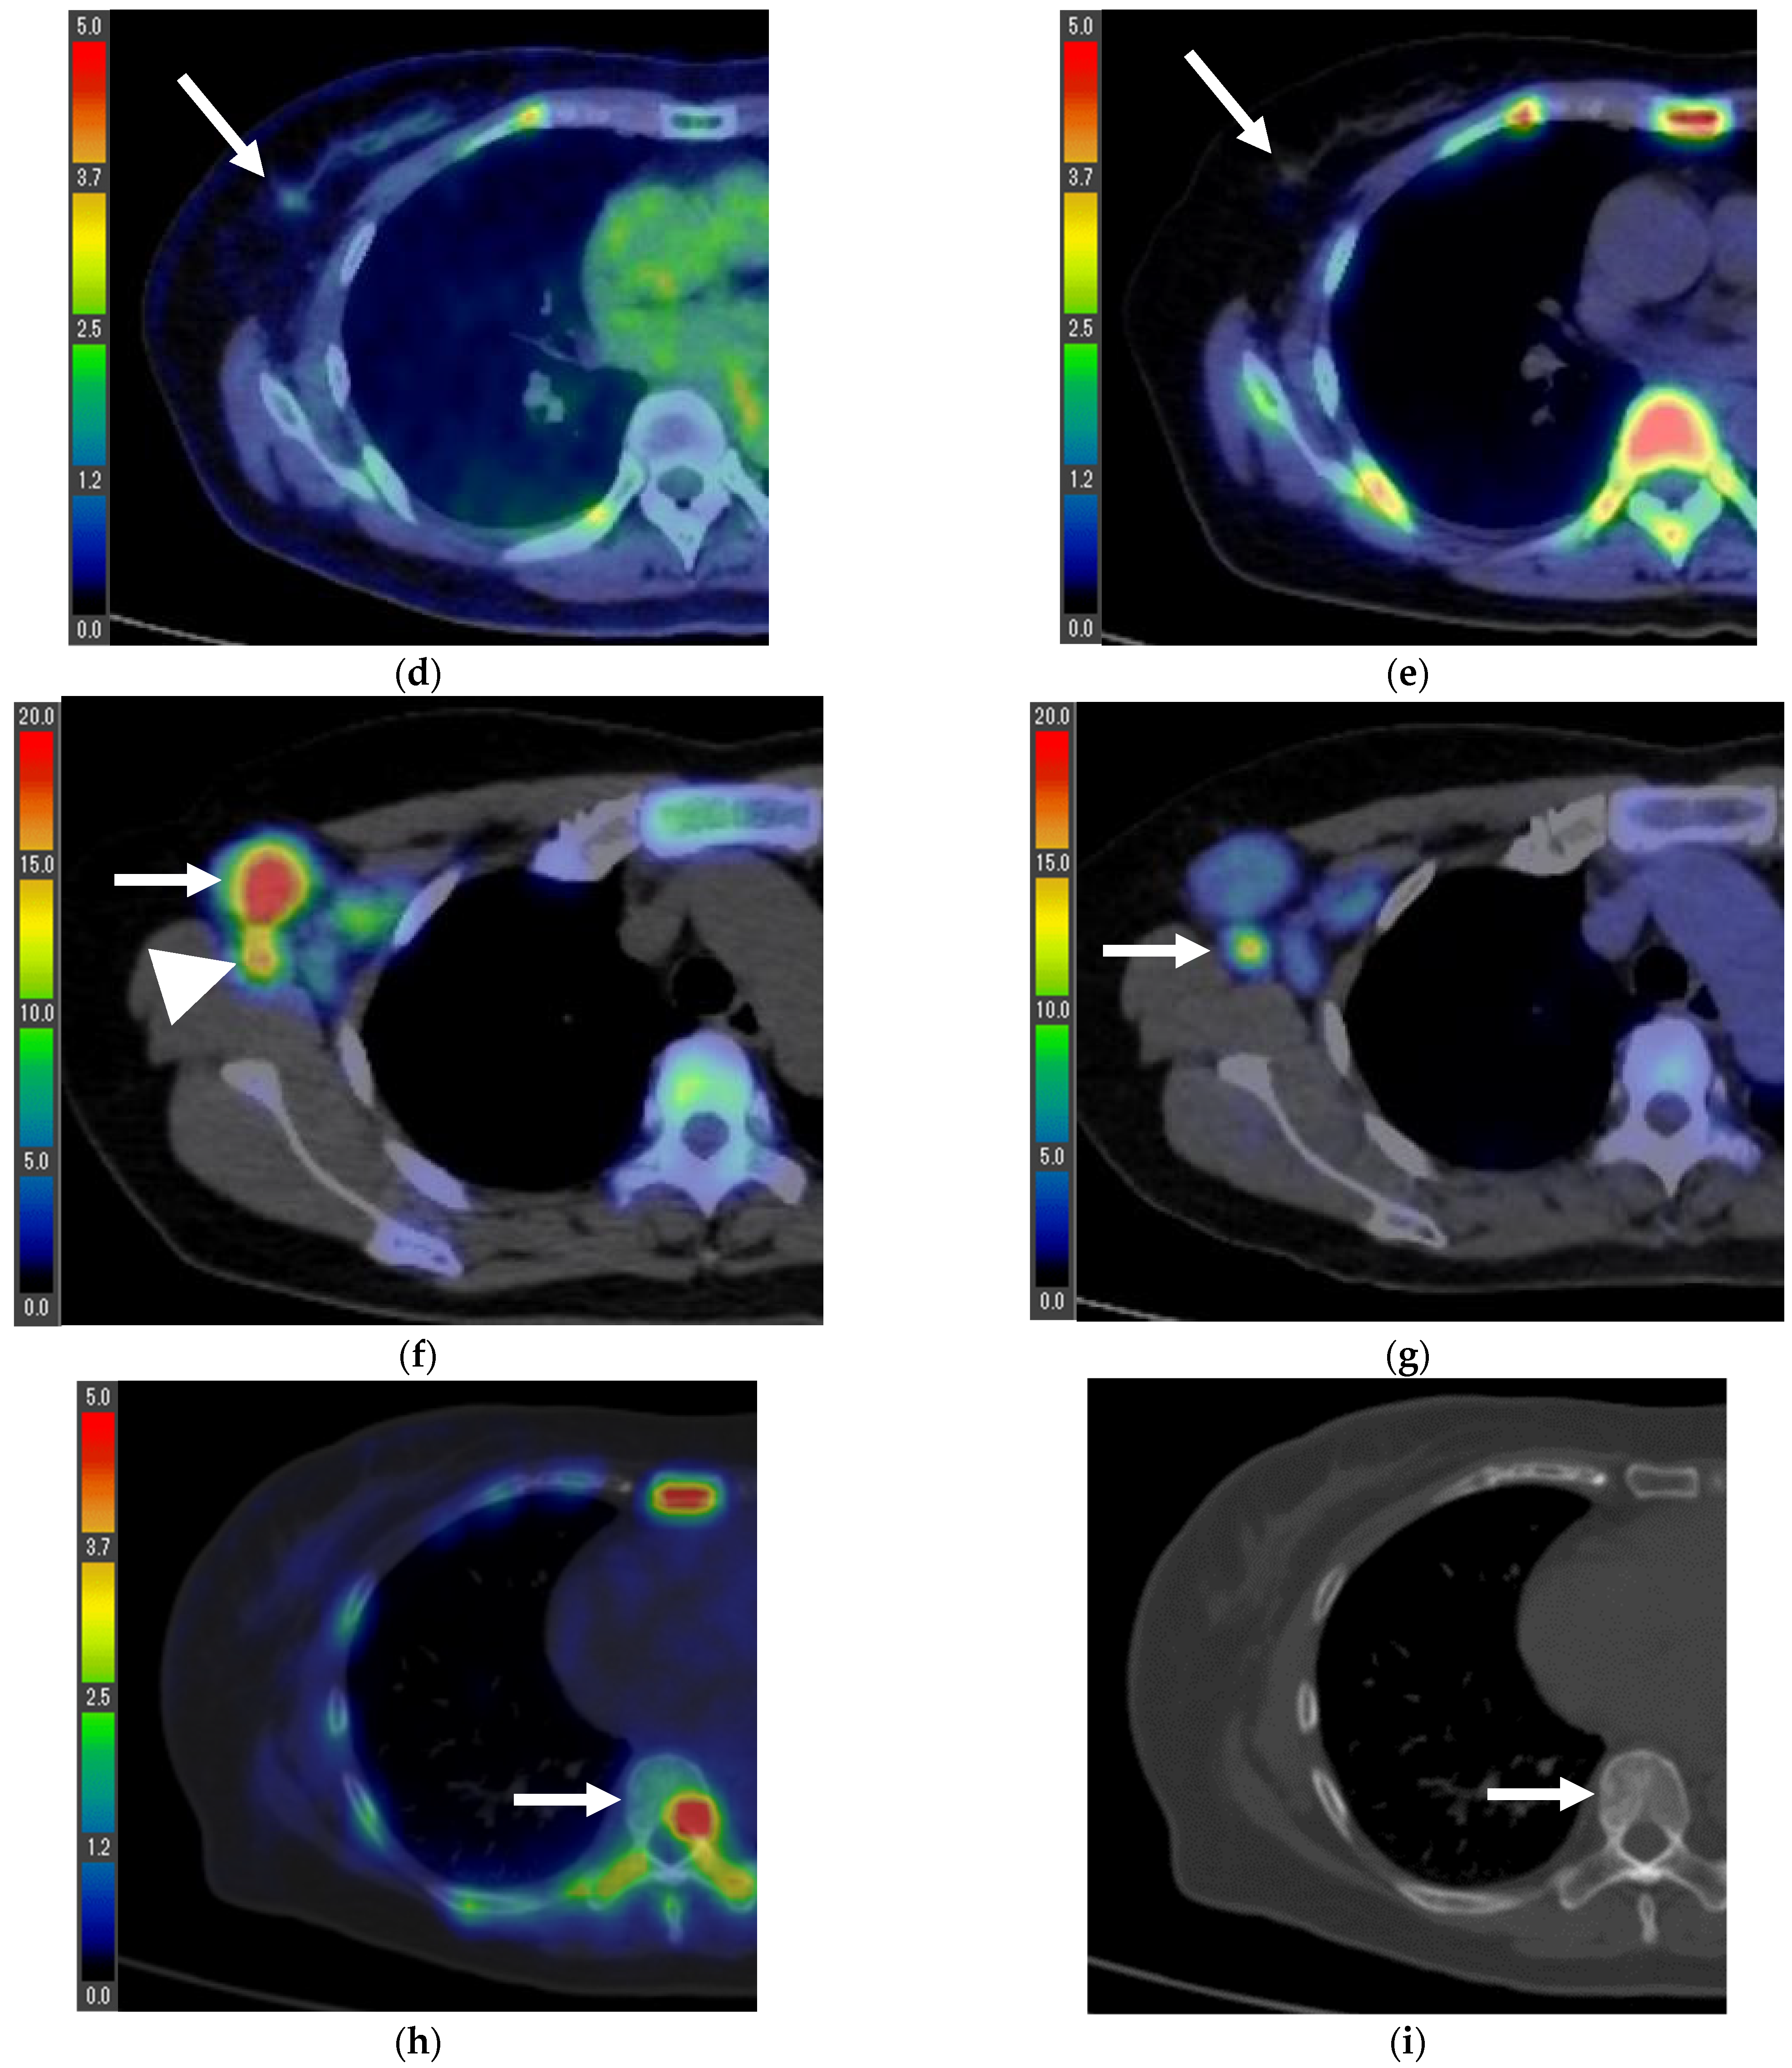
Three patients possessed an inoperable disease. The SUVmax of their primary lesions was lower on the 18F-FLT PET/CT than on the 18F-FDG PET/CT (Table 2). In patient four, both the initial 18F-FLT and 18F-FDG PET/CTs showed a slight accumulation in the primary lesion but high accumulation in multiple lymph node metastases, as well as in multiple bone metastases. She underwent chemotherapy, and a second 18F-FLT PET/CT was performed 147 days after the first 18F-FLT PET/CT. At that time, some bone metastases showed lower 18F-FLT accumulation than the physiological accumulation within the bone marrow, presumably because the treatment reduced cell proliferation (Figure 2).
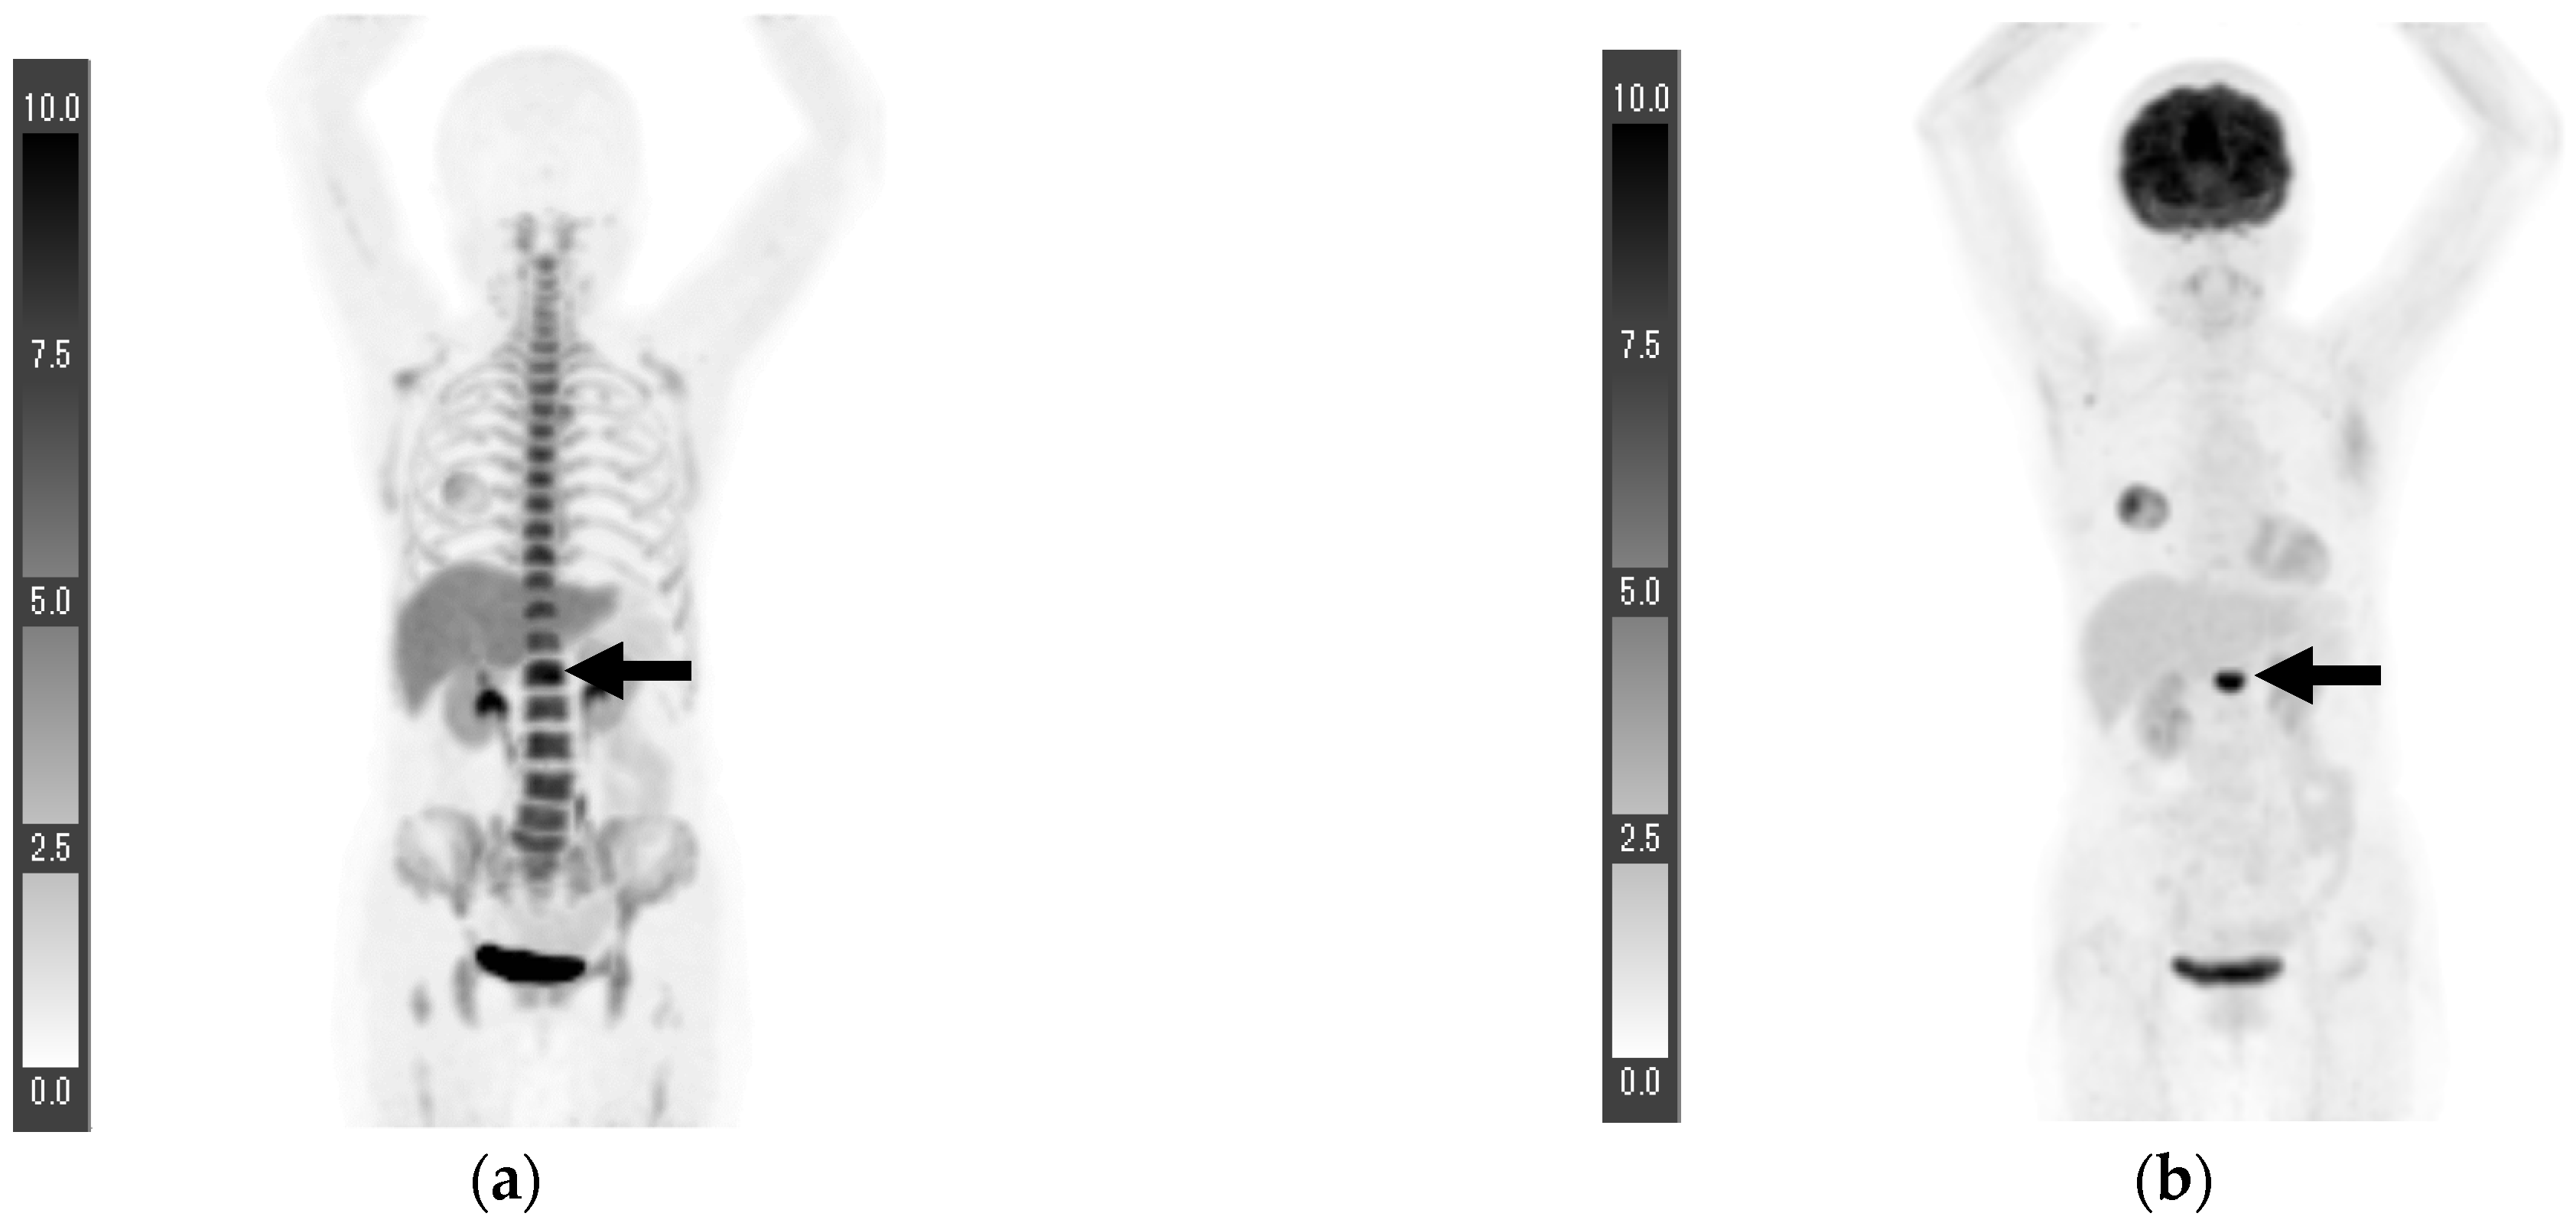
Patient six experienced a first lumbar vertebra metastasis, and 18F-FDG PET/CT revealed a clear accumulation. The SUVmax of the first lumbar vertebra was 12.6, whereas that of the second lumbar vertebra was 1.9 (Figure 3). As for the 18F-FLT PET/CT, which was performed 25 days before the 18F-FDG PET/CT, the accumulation in the first lumbar vertebra (SUVmax, 10.8) was similar to the bone marrow uptake (SUVmax in the second lumbar vertebra, 8.5), but the CT showed an osteolytic mass (not shown).

3.3. Statistical Analysis

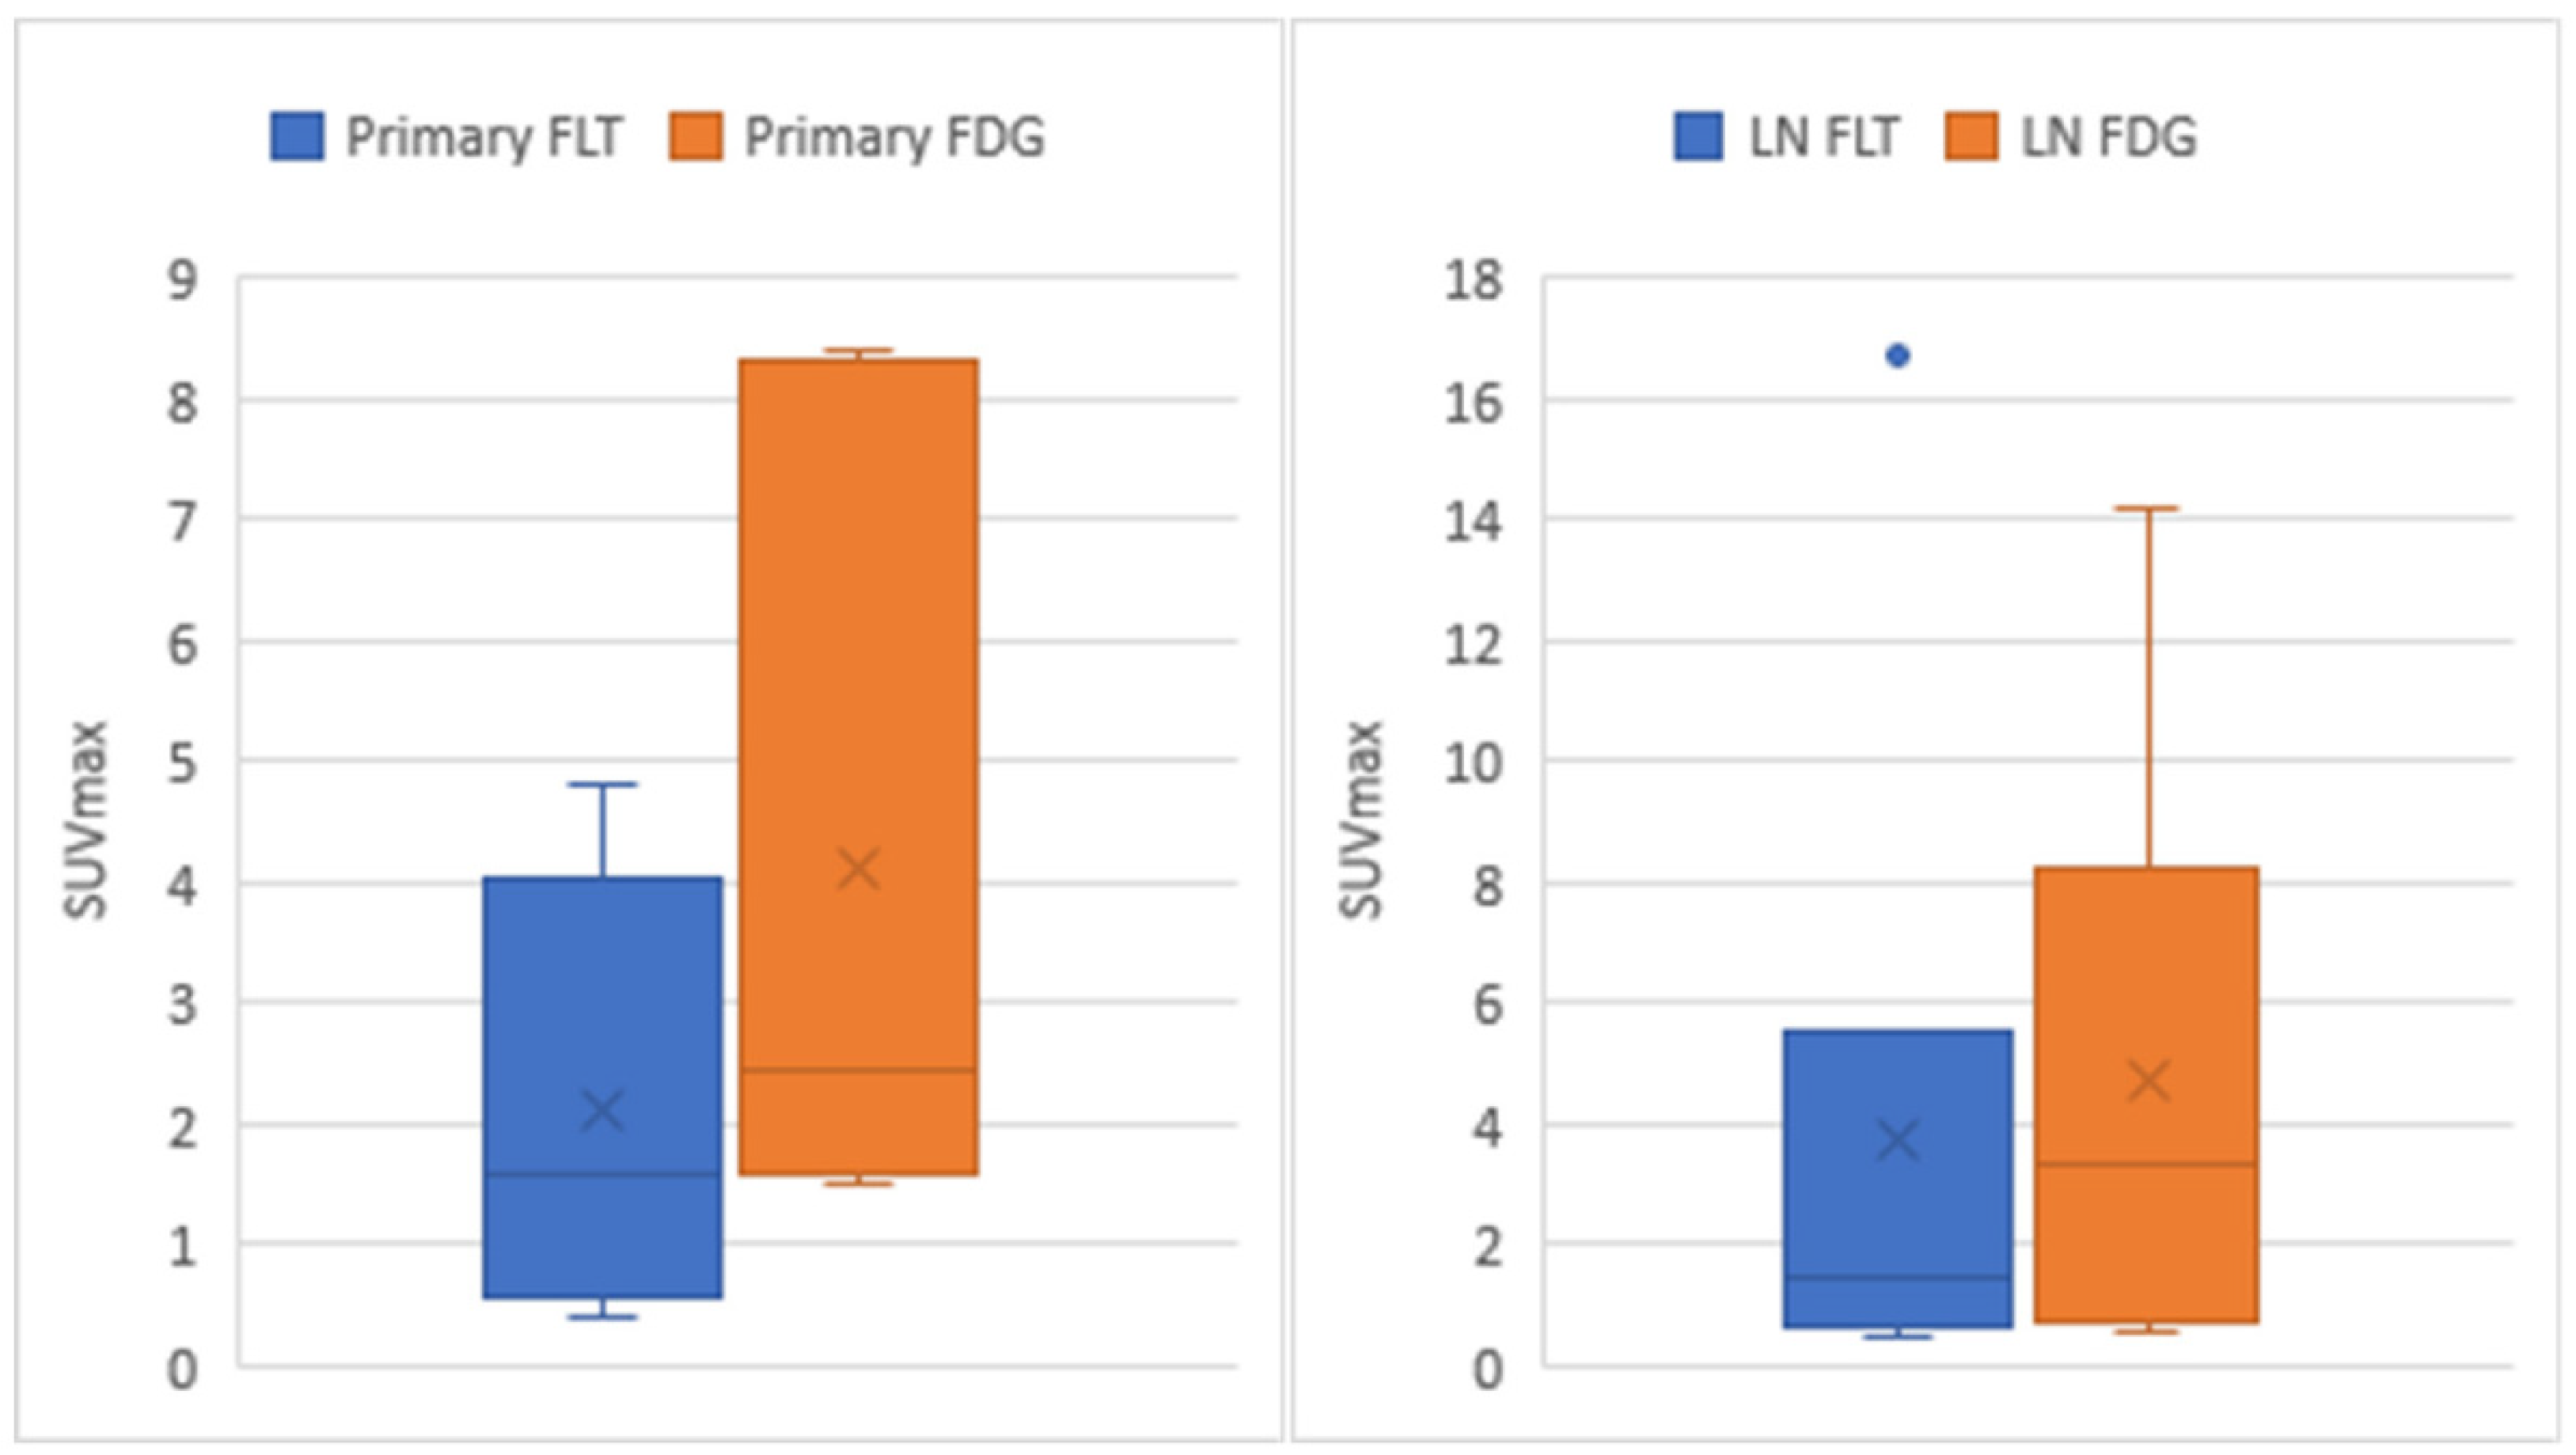
When the Shapiro–Wilk test was performed for treatment-naive patients with primary breast cancer (patients 1–6), the p-value for the SUVmax was 0.596 for the 18F-FLT PET/CT and 0.061 for the 18F-FDG PET/CT, and both were normally distributed. Regarding the subsequent two-tailed paired t-test, the p-value was 0.031, and the SUVmax of the 18F-FLT PET/CT was significantly lower than that of the 18F-FDG PET/CT (mean, 2.1 ± 1.8 vs. 4.1 ± 3.3). The Pearson’s correlation coefficient was 0.969, indicating a strong correlation (Figure 4 and Table 3).
For the axillary lymph node analysis, two patients (patients one and four) with different nodes showed the greatest SUVmax for the 18F-FLT PET/CT and 18F-FDG PET/CT; consequently, the SUVmax of the corresponding lymph node was used for the analysis. The Shapiro–Wilk test showed that the SUVmax of the 18F-FDG PET/CT was normally distributed (p = 0.097) but not that of the 18F-FLT PET/CT (p = 0.000). The subsequent Wilcoxon signed-rank test showed no significant between-group difference (p = 0.246). The mean and standard deviation were 3.8 ± 6.3 for the 18F-FLT PET/CT and 4.8 ± 5.1 for the 18F-FDG PET/CT. The Pearson’s correlation coefficient was 0.999, indicating a strong correlation (Figure 4 and Table 3).

3.4. Patients with Prior Treatment before PET/CT

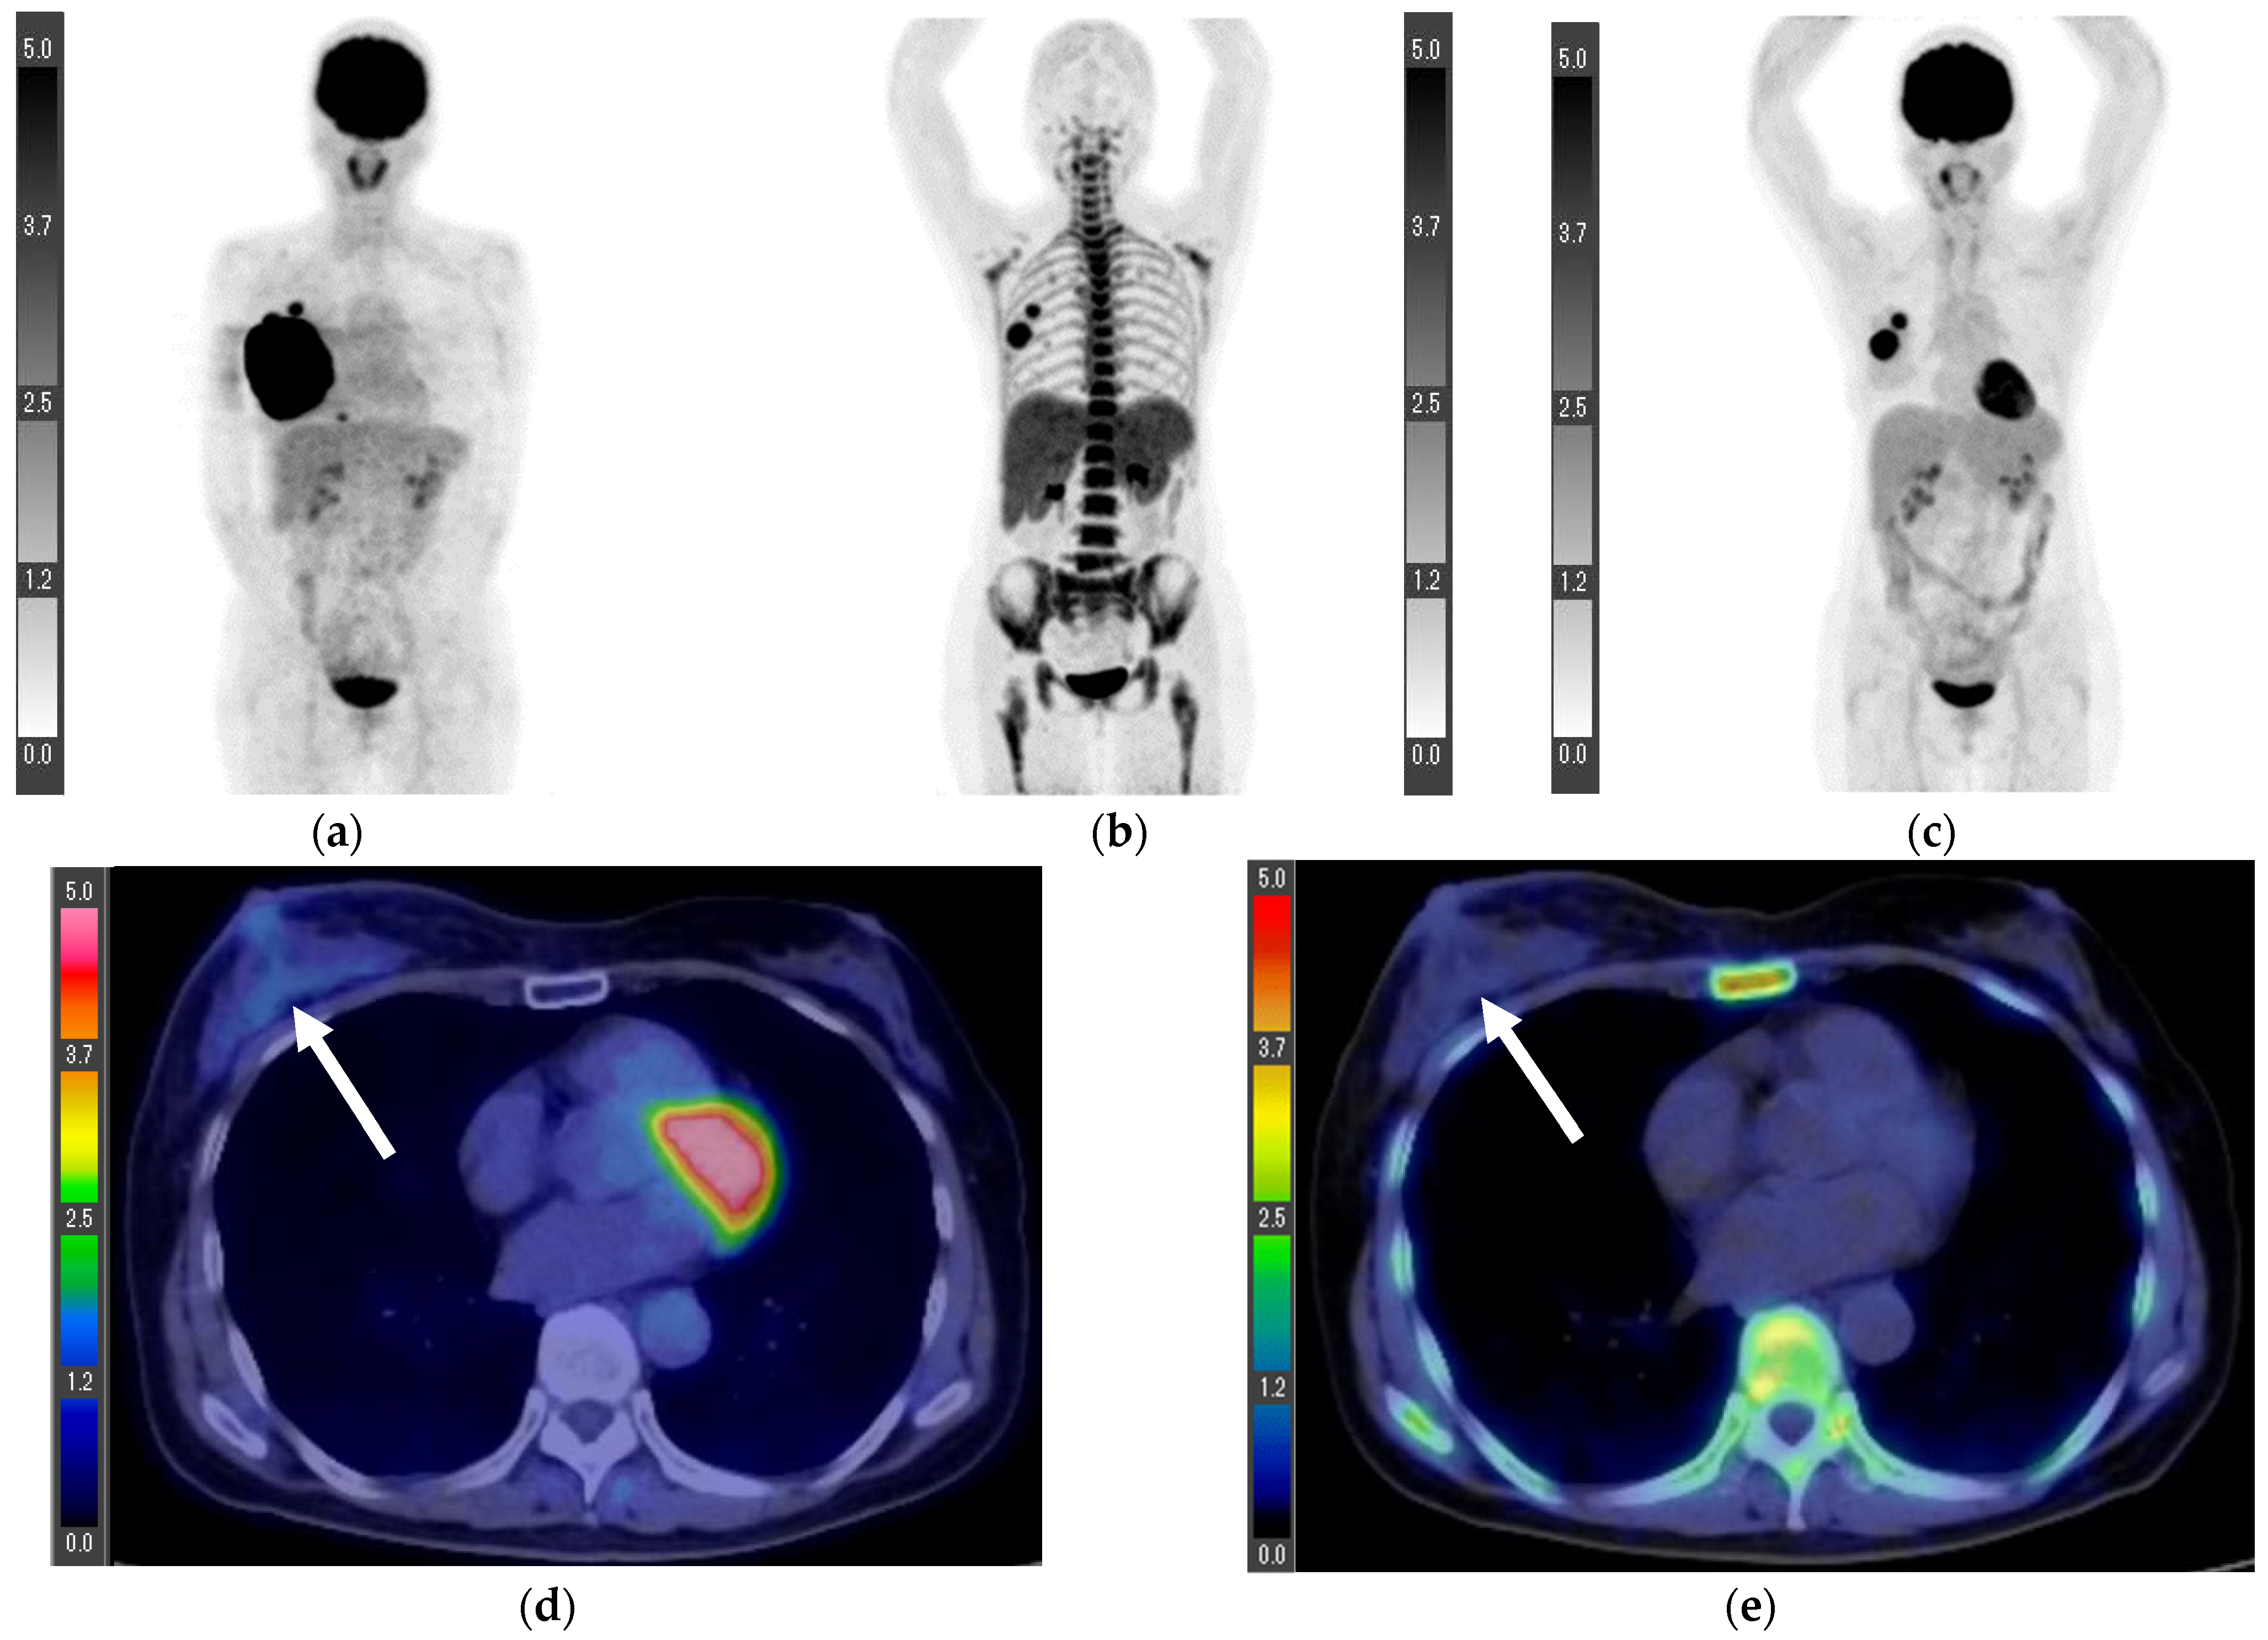
Patient 7 was a 62-year-old woman diagnosed with right-sided breast cancer who only received chemotherapy. After five years, the initial 18F-FDG PET/CT showed a large right primary breast tumor, intramammary metastases, and multiple right axillary lymph node metastases (Figure 5). The SUVmax of the primary lesion was 22.0. Additional chemotherapy was provided. She then underwent 18F-FLT PET/CT seven months later, followed by a second 18F-FDG PET/CT four days thereafter. The SUVmax of the primary lesion reduced to 7.0 on the 18F-FLT PET/CT and 10.1 on the 18F-FDG PET/CT. On the second 18F-FDG PET/CT, the accumulation in the right breast was higher than that in the contralateral breast, with an SUVmax of 1.4. However, no increased accumulation was noted on the 18F-FLT PET/CT, with an SUVmax of 0.6. We concluded that the 18F-FDG accumulation in the right breast occurred secondary to inflammation. A subsequent biopsy revealed that her right-sided breast cancer was an invasive ductal carcinoma.
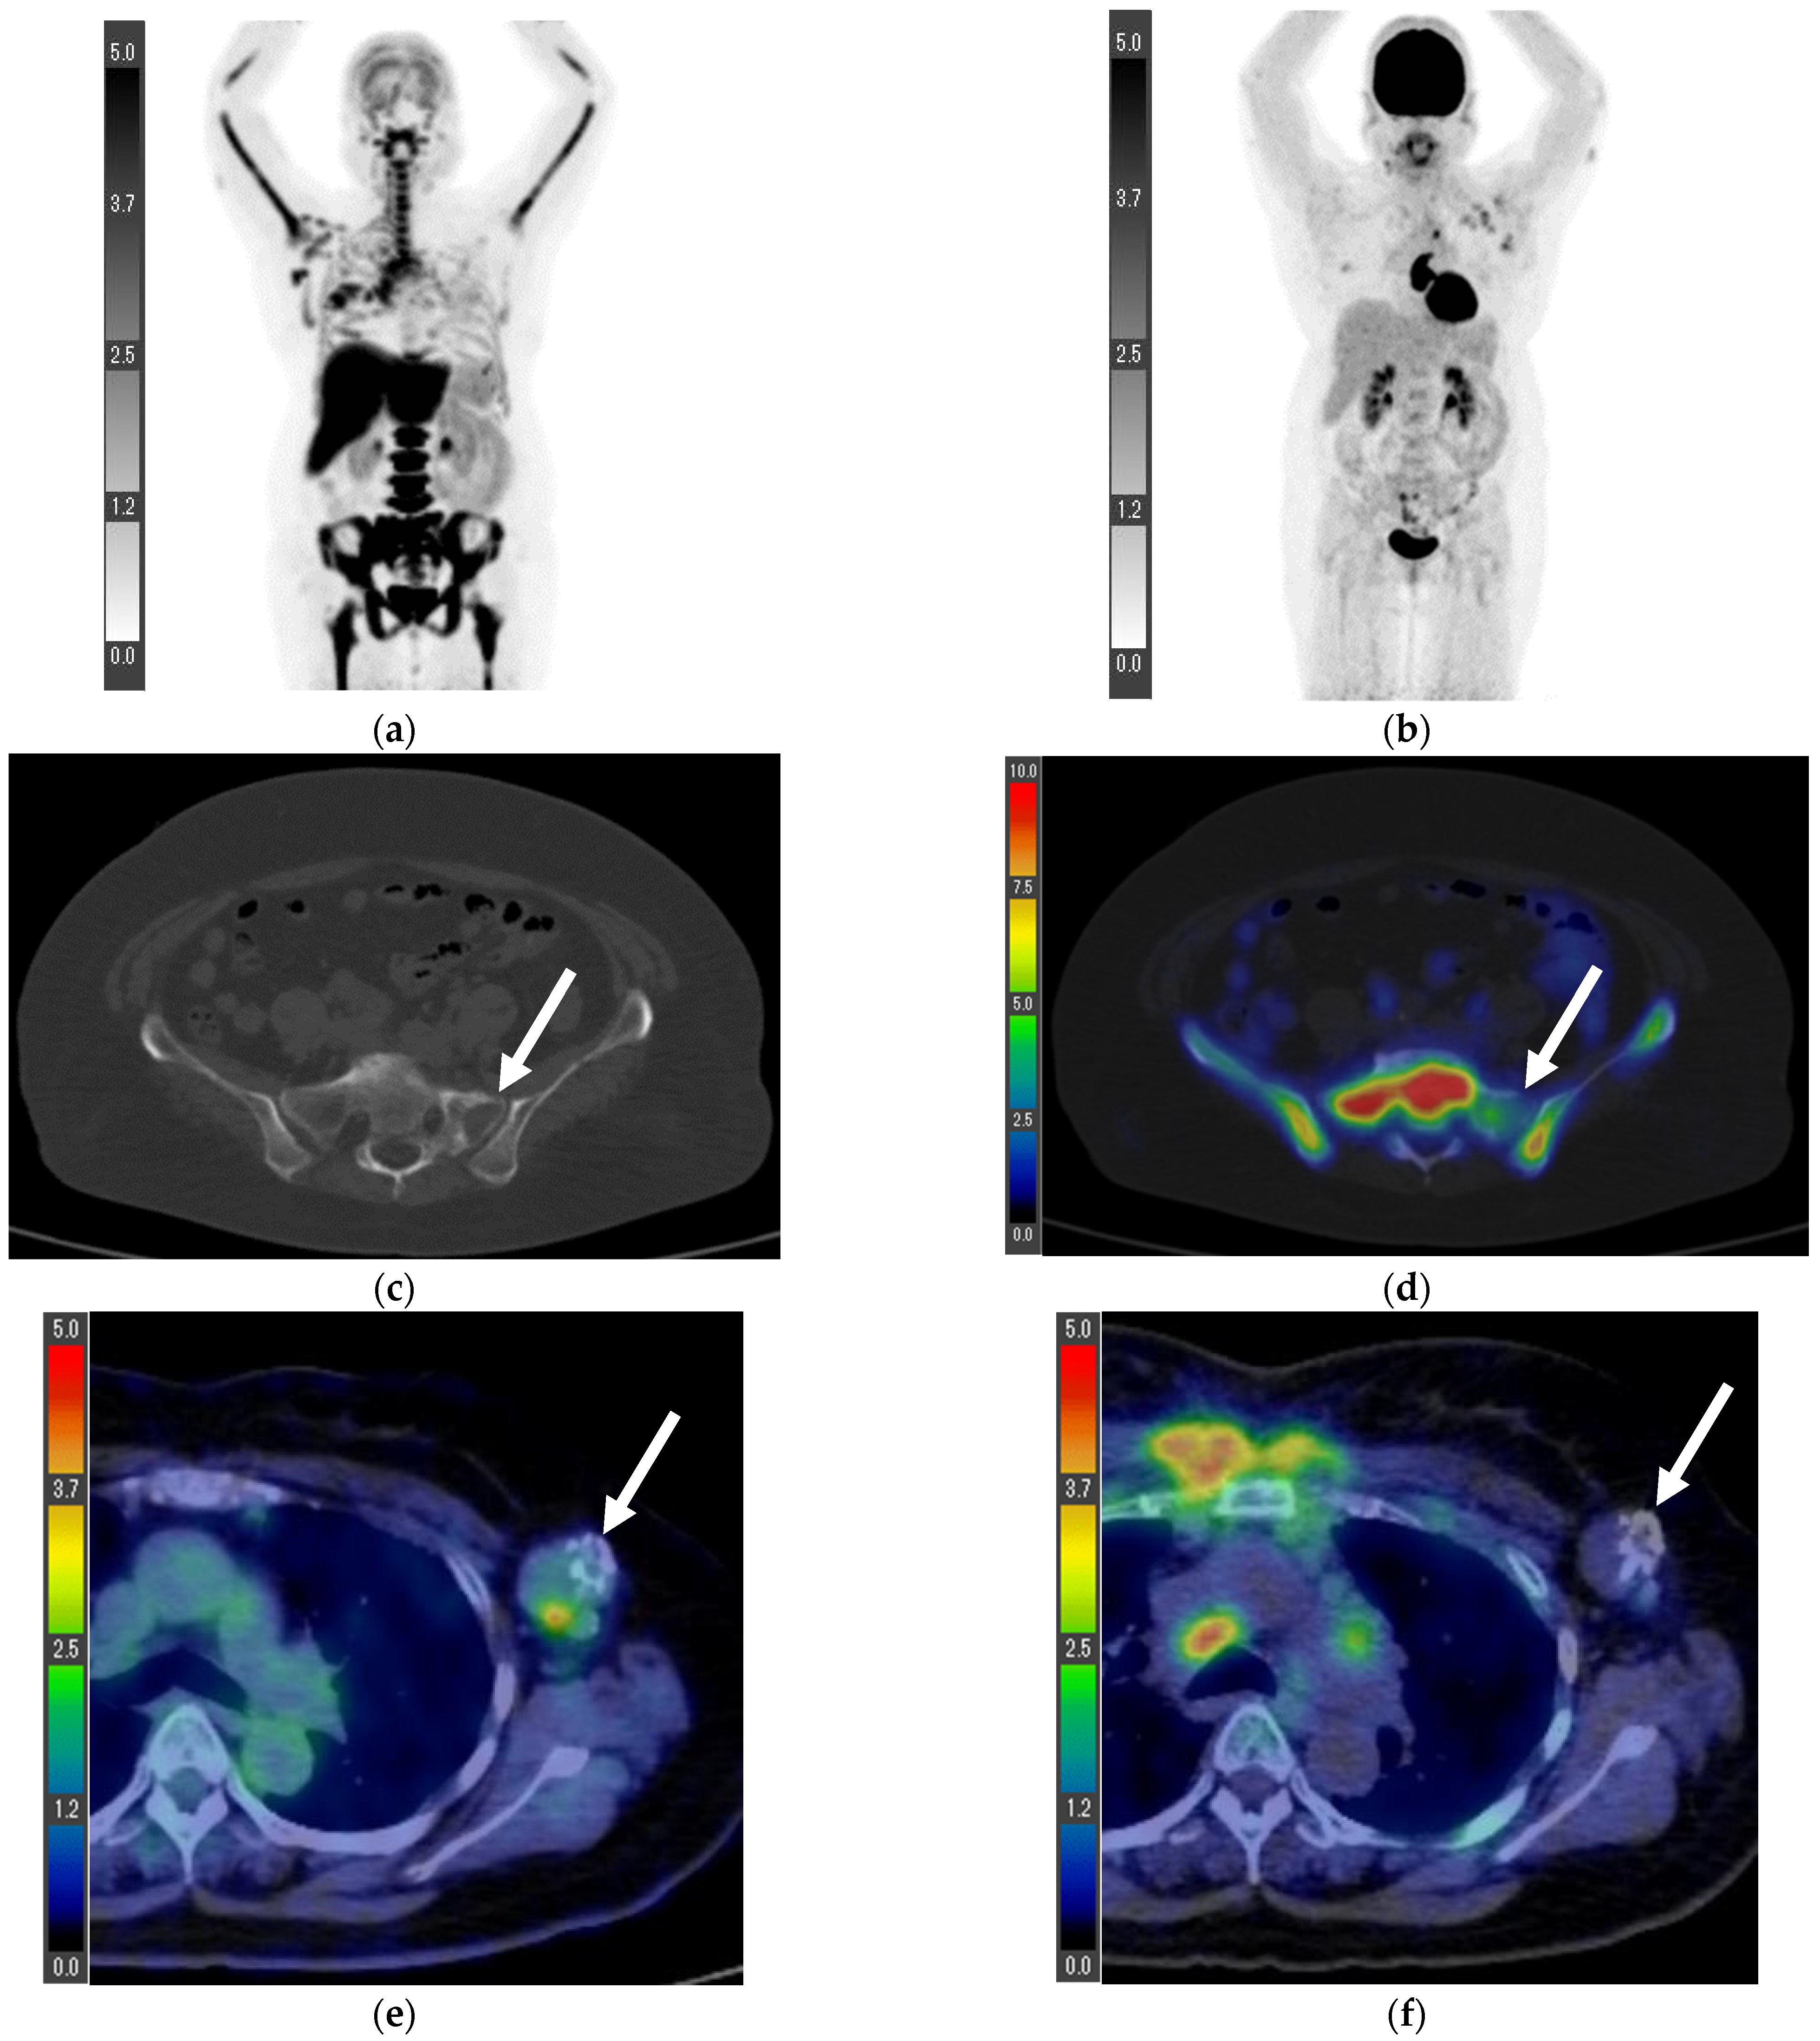
Patient 8 was a 51-year-old woman treated for left-sided breast cancer and multiple metastases for 7 years. She underwent multiple 18F-FDG PET/CTs. Her left breast resection revealed an invasive ductal carcinoma. Thereafter, 18F-FLT PET/CT was performed as the latest PET/CT (Figure 6); on the left side of the sacral bone, we found an osteolytic mass, which appeared metastatic. Considering that the lesion had lower 18F-FLT accumulation than the bone marrow, we concluded that the bone metastasis had less active cell proliferation than the bone marrow. This lesion was not diagnosed histologically, but it had progressed with other lesions on subsequent imaging follow-ups. The left axillary lymph nodes (which exhibited accumulation on the 18F-FDG PET/CT 10 months prior) displayed coarse calcification; therefore, it was difficult to identify whether the 18F-FDG accumulation reflected inflammation or viable cancer. Conversely, we observed no accumulation on the 18F-FLT PET/CT, despite no change in lymph node size. Therefore, cell proliferation was low in the left axillary lymph node with the 18F-FDG accumulation, thereby indicating inflammation.

4. Discussion

This study revealed that 18F-FLT accumulation secondary to primary breast cancer was lower than 18F-FDG accumulation in all cases, and significant differences were found in the SUVmax between these accumulations in treatment-naive patients. In patients with primary breast cancer and axillary lymph nodes, the SUVmax showed a strong correlation between the 18F-FLT PET/CT and 18F-FDG PET/CT. In particular, 18F-FLT PET/CT may be useful for estimating cell proliferation in lymph nodes and bone metastases, distinguishing such changes between inflammation and physiological accumulation.
18F-FLT is a radiolabeled imaging agent serving as the structural analog of the DNA constituent, thymidine [18,24]. The radiolabeling activity depends on DNA replication within the cells; hence, 18F-FLT uptake depends on the cells’ proliferative rate [18,24]. In contrast, 18F-FDG accumulation depends on glucose intake and reflects an increased metabolism and the Warburg effect [18]. Few studies have examined the differences between 18F-FLT and 18F-FDG accumulation in human breast cancer. For instance, in a study by Smyczek-Gargya et al., six patients with breast cancer received 18F-FLT PET/CT and 18F-FDG PET/CT within one week. Five of them possessed primary breast cancers with a lower SUVmax and SUVmean in the 18F-FLT PET/CT than in the 18F-FDG PET/CT, whereas the remaining patients demonstrated the opposite result; unfortunately, the reason for this discrepancy was not discussed [19]. In the present study, the SUVmax of 18F-FLT in the primary lesions averaged 2.1 (range, 0.6–4.8), whereas that of 18F-FDG averaged 4.1 (range, 1.5–8.4) among treatment-naive patients (patients 1–6). The SUVmax of 18F-FLT was approximately half that of 18F-FDG; this difference was statistically significant in patients 1–6. One esophageal cancer study showed that the 18F-FLT uptake was significantly lower than the 18F-FDG uptake, potentially as a result of the difference in biochemical and biological mechanisms between these two radiotracers during cell proliferation and differentiation [25]. Although low 18F-FLT accumulation might lead to an oversight, studies of head and neck squamous cell cancers have shown that the detection of primary lesions and metastatic lymph nodes was comparable between 18F-FLT PET/CT and 18F-FDG PET/CT [12,26]. Our present study also reported a strong correlation of the SUVmax between 18F-FLT and 18F-FDG in primary breast cancer and axillary lymph nodes.
Because 18F-FLT PET/CT reflects the cell proliferation cycle, several reports show an association with the Ki-67 labeling index, a pathological marker of cell proliferation [6,9,13]. The accumulation of 18F-FLT correlates with the Ki-67 labeling index [6,27]. In a meta-analysis that investigated the relationship between the SUVmax and the Ki-67 labeling index in breast cancer, 18F-FLT PET showed a higher correlation coefficient (r = 0.54) than 18F-FDG PET (r = 0.40) [28]. In our study, the higher the Ki-67 labeling index, the higher the 18F-FLT and 18F-FDG accumulation in surgical cases (patients 1–3). However, this relationship did not seem relevant in inoperable cases (patients 4–6). This discrepancy could be attributed to the fact that the Ki-67 labeling index was measured in a small number of biopsy specimens obtained from patients with inoperable diseases. In other words, estimating cell proliferation using 18F-FLT PET/CT might be helpful in measuring the accuracy of the Ki-67 labeling index in patients with inoperable diseases.
Our study yielded interesting results regarding lymph node accumulation. The lymph nodes with the greatest accumulation sometimes differed between the 18F-FLT PET/CT and the 18F-FDG PET/CT. In two patients, the SUVmax of 18F-FLT was higher than that of 18F-FDG. A study on primary colorectal cancer similarly concluded that the SUVmax of 18F-FLT was significantly lower than that of 18F-FDG in primary foci; however, the SUVmax of 18F-FLT was not always lower, and the SUVmax values of the two tracers were not significantly different in positive metastatic nodes [29]. The authors speculated that this finding was probably due to the different biochemical characteristics of the two tracers. Lymph nodes with higher 18F-FLT accumulation may have faster cancer cell proliferation. In thoracic esophageal squamous cell carcinoma, 18F-FLT PET/CT has a significantly higher specificity for diagnosing lymph node metastases than 18F-FDG PET/CT [16]; and in such cases, 18F-FLT PET/CT may be deemed more important than 18F-FDG PET/CT.
A few studies have evaluated distant metastatic lesions using 18F-FLT PET/CT. In patients four and eight, the bone metastases had a relatively low accumulation because of the high physiological 18F-FLT accumulation in the bone marrow. Therefore, on 18F-FLT PET/CT, bone metastases may demonstrate a lower accumulation than bone marrow; however, no similar reports exist. Interestingly, the lumbar metastasis in patient six showed 18F-FLT accumulation equivalent to that of bone marrow. In this case, concurrent CT might facilitate the detection of bone metastases.
Because physiological 18F-FLT accumulation in the brain is extremely low, brain metastases should be easily detected [30]; however, the present study had no patients with brain metastases. 18F-FLT PET can provide high specificity because 18F-FLT is less likely to accumulate in areas of inflammation secondary to cancer therapy [6,8,17]. Therefore, 18F-FDG accumulation and scarce 18F-FLT accumulation in the lymph nodes and breast are presumably the results of inflammation.
This study has several limitations. First, the sample size was small. Second, we did not control for surgical history, disease stage, or prior treatments. However, patients were divided into treatment-naive and non-treatment-naive groups before statistical analysis. Third, one patient did not undergo 18F-FDG PET/CT concurrently with 18F-FLT PET/CT. Fourth, the assessments performed by the nuclear medicine specialists were not consistent because the diagnoses were conducted prospectively. Finally, considering that breast cancer diagnoses were conducted before PET/CT, the influence of a prior biopsy was inevitable.

5. Conclusions

A strong correlation was found between the 18F-FLT PET/CT and 18F-FDG PET/CT uptake in primary breast tumors and axillary lymph nodes. Differences in the degree of breast cancer accumulation, lesions with the greatest accumulation, and physiological accumulation in organs reflected the different biochemical characteristics of 18F-FLT PET/CT and 18F-FDG PET/CT. Clinicians should be aware of these features when using 18F-FLT PET/CT to evaluate patients with breast cancer.

Author Contributions

Conceptualization, T.F., K.K. and U.T.; methodology, T.F., K.K. and U.T.; software, J.T. and U.T.; validation, M.M. and T.F.; formal analysis, M.M. and T.F.; investigation, R.I. (Ryota Ichikawa), R.I. (Reina Inomata), L.K., Y.Y. and E.Y.; resources, K.H., Y.K., G.O., T.N. and I.O.; data curation, M.M. and T.F.; writing—original draft preparation, M.M.; writing—review and editing, M.M., T.F., K.K. and U.T.; visualization, M.M.; supervision, T.N., K.K. and U.T.; project administration, J.T., K.K. and U.T.; funding acquisition, M.M. All authors have read and agreed to the published version of the manuscript.

Funding

This research was funded by a scientific grant (MEXT/JSPS KAKENHI Grant Number JP 20K16754).

Institutional Review Board Statement

The study was conducted according to the guidelines of the Declaration of Helsinki and approved by the medical ethics committee of the Tokyo Medical and Dental University (no. R2017-032; 16 November 2017).

Informed Consent Statement

Informed consent was obtained from all subjects involved in the study. Written informed consent was obtained from the patients to publish this paper.

Data Availability Statement

No new data were created or analyzed in this study. Data sharing is not applicable to this article.

Conflicts of Interest

The authors declare no conflict of interest.

References

  1. Weiss, A.; Chavez-Mac Gregor, M.; Lichtensztajn, D.Y.; Yi, M.; Tadros, A.; Hortobagyi, G.N.; Giordano, S.H.; Hunt, K.K.; Mittendorf, E.A. Validation study of the American Joint Committee on Cancer Eighth Edition prognostic stage compared with the anatomic stage in breast cancer. JAMA Oncol. 2018, 4, 203–209. [Google Scholar] [CrossRef] [PubMed]
  2. Mori, M.; Fujioka, T.; Katsuta, L.; Tsuchiya, J.; Kubota, K.; Kasahara, M.; Oda, G.; Nakagawa, T.; Onishi, I.; Tateishi, U. Diagnostic performance of time-of-flight PET/CT for evaluating nodal metastasis of the axilla in breast cancer. Nucl. Med. Commun. 2019, 40, 958–964. [Google Scholar] [CrossRef] [PubMed]
  3. Mori, M.; Fujioka, T.; Kubota, K.; Katsuta, L.; Yashima, Y.; Nomura, K.; Yamaga, E.; Tsuchiya, J.; Hosoya, T.; Oda, G.; et al. Relationship between prognostic stage in breast cancer and fluorine-18 fluorodeoxyglucose positron emission tomography/computed tomography. J. Clin. Med. 2021, 10, 3173. [Google Scholar] [CrossRef] [PubMed]
  4. Kadoya, T.; Aogi, K.; Kiyoto, S.; Masumoto, N.; Sugawara, Y.; Okada, M. Role of maximum standardized uptake value in fluorodeoxyglucose positron emission tomography/computed tomography predicts malignancy grade and prognosis of operable breast cancer: A multi-institute study. Breast Cancer Res. Treat. 2013, 141, 269–275. [Google Scholar] [CrossRef] [Green Version]
  5. Wen, W.; Xuan, D.; Hu, Y.; Li, X.; Liu, L.; Xu, D. Prognostic value of maximum standard uptake value, metabolic tumor volume, and total lesion glycolysis of positron emission tomography/computed tomography in patients with breast cancer: A systematic review and meta-analysis. PLoS ONE 2019, 14, e0225959. [Google Scholar] [CrossRef] [Green Version]
  6. Kenny, L.; Coombes, R.C.; Vigushin, D.M.; Al-Nahhas, A.; Shousha, S.; Aboagye, E.O. Imaging early changes in proliferation at 1 week post chemotherapy: A pilot study in breast cancer patients with 3′-deoxy-3′-[18F]fluorothymidine positron emission tomography. Eur. J. Nucl. Med. Mol. Imaging 2007, 34, 1339–1347. [Google Scholar] [CrossRef]
  7. Shields, A.F.; Grierson, J.R.; Dohmen, B.M.; Machulla, H.J.; Stayanoff, J.C.; Lawhorn-Crews, J.M.; Obradovich, J.E.; Muzik, O.; Mangner, T.J. Imaging proliferation in vivo with [F-18]FLT and positron emission tomography. Nat. Med. 1998, 4, 1334–1336. [Google Scholar] [CrossRef]
  8. Been, L.B.; Suurmeijer, A.J.; Cobben, D.C.; Jager, P.L.; Hoekstra, H.J.; Elsinga, P.H. [18F]FLT-PET in oncology: Current status and opportunities. Eur. J. Nucl. Med. Mol. Imaging 2004, 31, 1659–1672. [Google Scholar] [CrossRef]
  9. Chen, W.; Cloughesy, T.; Kamdar, N.; Satyamurthy, N.; Bergsneider, M.; Liau, L.; Mischel, P.; Czernin, J.; Phelps, M.E.; Silverman, D.H. Imaging proliferation in brain tumors with 18F-FLT PET: Comparison with 18F-FDG. J. Nucl. Med. 2005, 46, 945–952. [Google Scholar]
  10. Dittmann, H.; Dohmen, B.M.; Paulsen, F.; Eichhorn, K.; Eschmann, S.M.; Horger, M.; Wehrmann, M.; Machulla, H.J.; Bares, R. [18F]FLT PET for diagnosis and staging of thoracic tumours. Eur. J. Nucl. Med. Mol. Imaging 2003, 30, 1407–1412. [Google Scholar] [CrossRef]
  11. Buck, A.K.; Halter, G.; Schirrmeister, H.; Kotzerke, J.; Wurziger, I.; Glatting, G.; Mattfeldt, T.; Neumaier, B.; Reske, S.N.; Hetzel, M. Imaging proliferation in lung tumors with PET: 18F-FLT versus 18F-FDG. J. Nucl. Med. 2003, 44, 1426–1431. [Google Scholar] [PubMed]
  12. Hoshikawa, H.; Nishiyama, Y.; Kishino, T.; Yamamoto, Y.; Haba, R.; Mori, N. Comparison of FLT-PET and FDG-PET for visualization of head and neck squamous cell cancers. Mol. Imaging Biol. 2011, 13, 172–177. [Google Scholar] [CrossRef] [PubMed]
  13. Yamamoto, Y.; Nishiyama, Y.; Ishikawa, S.; Nakano, J.; Chang, S.S.; Bandoh, S.; Kanaji, N.; Haba, R.; Kushida, Y.; Ohkawa, M. Correlation of 18F-FLT and 18F-FDG uptake on PET with Ki-67 immunohistochemistry in non-small cell lung cancer. Eur. J. Nucl. Med. Mol. Imaging 2007, 34, 1610–1616. [Google Scholar] [CrossRef] [PubMed]
  14. Kameyama, R.; Yamamoto, Y.; Izuishi, K.; Takebayashi, R.; Hagiike, M.; Murota, M.; Kaji, M.; Haba, R.; Nishiyama, Y. Detection of gastric cancer using 18F-FLT PET: Comparison with 18F-FDG PET. Eur. J. Nucl. Med. Mol. Imaging 2009, 36, 382–388. [Google Scholar] [CrossRef] [PubMed]
  15. van Westreenen, H.L.; Cobben, D.C.; Jager, P.L.; van Dullemen, H.M.; Wesseling, J.; Elsinga, P.H.; Plukker, J.T. Comparison of 18F-FLT PET and 18F-FDG PET in esophageal cancer. J. Nucl. Med. 2005, 46, 400–404. [Google Scholar] [PubMed]
  16. Han, D.; Yu, J.; Zhong, X.; Fu, Z.; Mu, D.; Zhang, B.; Xu, G.; Yang, W.; Zhao, S. Comparison of the diagnostic value of 3-deoxy-3-18F-fluorothymidine and 18F-fluorodeoxyglucose positron emission tomography/computed tomography in the assessment of regional lymph node in thoracic esophageal squamous cell carcinoma: A pilot study. Dis. Esophagus 2012, 25, 416–426. [Google Scholar] [CrossRef]
  17. van Waarde, A.; Cobben, D.C.; Suurmeijer, A.J.; Maas, B.; Vaalburg, W.; de Vries, E.F.; Jager, P.L.; Hoekstra, H.J.; Elsinga, P.H. Selectivity of 18F-FLT and 18F-FDG for differentiating tumor from inflammation in a rodent model. J. Nucl. Med. 2004, 45, 695–700. [Google Scholar] [PubMed]
  18. Wesolowski, R.; Stover, D.G.; Lustberg, M.B.; Shoben, A.; Zhao, M.; Mrozek, E.; Layman, R.M.; Macrae, E.; Duan, W.; Zhang, J.; et al. Phase I study of veliparib on an intermittent and continuous schedule in combination with carboplatin in metastatic breast cancer: A safety and [18F]-fluorothymidine positron emission tomography biomarker study. Oncologist 2020, 25, e1158–e1169. [Google Scholar] [CrossRef]
  19. Smyczek-Gargya, B.; Fersis, N.; Dittmann, H.; Vogel, U.; Reischl, G.; Machulla, H.J.; Wallwiener, D.; Bares, R.; Dohmen, B.M. PET with [18F]fluorothymidine for imaging of primary breast cancer: A pilot study. Eur. J. Nucl. Med. Mol. Imaging 2004, 31, 720–724. [Google Scholar] [CrossRef]
  20. Contractor, K.B.; Kenny, L.M.; Stebbing, J.; Rosso, L.; Ahmad, R.; Jacob, J.; Challapalli, A.; Turkheimer, F.; Al-Nahhas, A.; Sharma, R.; et al. 3′Deoxy-3′-fluorothymidine positron emission tomography and breast cancer response to docetaxel. Clin. Cancer Res. 2011, 17, 7664–7672. [Google Scholar] [CrossRef] [Green Version]
  21. Fantini, L.; Belli, M.L.; Azzali, I.; Loi, E.; Bettinelli, A.; Feliciani, G.; Mezzenga, E.; Fedeli, A.; Asioli, S.; Paganelli, G.; et al. Exploratory analysis of 18F-3′-deoxy-3′-fluorothymidine (18F-FLT) PET/CT-based Radiomics for the early evaluation of response to neoadjuvant chemotherapy in patients with locally advanced breast cancer. Front. Oncol. 2021, 11, 601053. [Google Scholar] [CrossRef] [PubMed]
  22. Romine, P.E.; Peterson, L.M.; Kurland, B.F.; Byrd, D.W.; Novakova-Jiresova, A.; Muzi, M.; Specht, J.M.; Doot, R.K.; Link, J.M.; Krohn, K.A.; et al. 18F-fluorodeoxyglucose (FDG) PET or 18F-fluorothymidine (FLT) PET to assess early response to aromatase inhibitors (AI) in women with ER+ operable breast cancer in a window-of-opportunity study. Breast Cancer Res. 2021, 23, 88. [Google Scholar] [CrossRef] [PubMed]
  23. Schober, P.; Boer, C.; Schwarte, L.A. Correlation coefficients: Appropriate use and interpretation. Anesth. Analg. 2018, 126, 1763–1768. [Google Scholar] [CrossRef] [PubMed]
  24. Bollineni, V.R.; Kramer, G.M.; Jansma, E.P.; Liu, Y.; Oyen, W.J. A systematic review on [18F]FLT-PET uptake as a measure of treatment response in cancer patients. Eur. J. Cancer 2016, 55, 81–97. [Google Scholar] [CrossRef] [Green Version]
  25. Ma, C.; Li, D.; Yin, Y.; Cao, J. Comparison of characteristics of 18F-fluorodeoxyglucose and 18F-fluorothymidine PET during staging of esophageal squamous cell carcinoma. Nucl. Med. Commun. 2015, 36, 1181–1186. [Google Scholar] [CrossRef] [PubMed]
  26. Hoshikawa, H.; Kishino, T.; Mori, T.; Nishiyama, Y.; Yamamoto, Y.; Inamoto, R.; Akiyama, K.; Mori, N. Comparison of (18). Acta Oto-Laryngol. 2012, 132, 1347–1354. [Google Scholar] [CrossRef] [PubMed]
  27. Shen, G.; Ma, H.; Pang, F.; Ren, P.; Kuang, A. Correlations of 18F-FDG and 18F-FLT uptake on PET with Ki-67 expression in patients with lung cancer: A meta-analysis. Acta Radiol. 2018, 59, 188–195. [Google Scholar] [CrossRef]
  28. Surov, A.; Meyer, H.J.; Wienke, A. Associations between PET parameters and expression of Ki-67 in breast cancer. Transl. Oncol. 2019, 12, 375–380. [Google Scholar] [CrossRef]
  29. Nakajo, M.; Nakajo, M.; Kajiya, Y.; Jinguji, M.; Nishimata, N.; Shimaoka, S.; Nihara, T.; Aridome, K.; Tanaka, S.; Fukukura, Y.; et al. Diagnostic performance of 18F-fluorothymidine PET/CT for primary colorectal cancer and its lymph node metastasis: Comparison with 18F-fluorodeoxyglucose PET/CT. Eur. J. Nucl. Med. Mol. Imaging 2013, 40, 1223–1232. [Google Scholar] [CrossRef]
  30. Morikawa, A.; Grkovski, M.; Patil, S.; Jhaveri, K.L.; Tang, K.; Humm, J.L.; Holodny, A.; Beal, K.; Schöder, H.; Seidman, A.D. A Phase I trial of sorafenib with whole brain radiotherapy (WBRT) in breast cancer patients with brain metastases and a correlative study of FLT-PET brain imaging. Breast Cancer Res. Treat. 2021, 188, 415–425. [Google Scholar] [CrossRef] [PubMed]
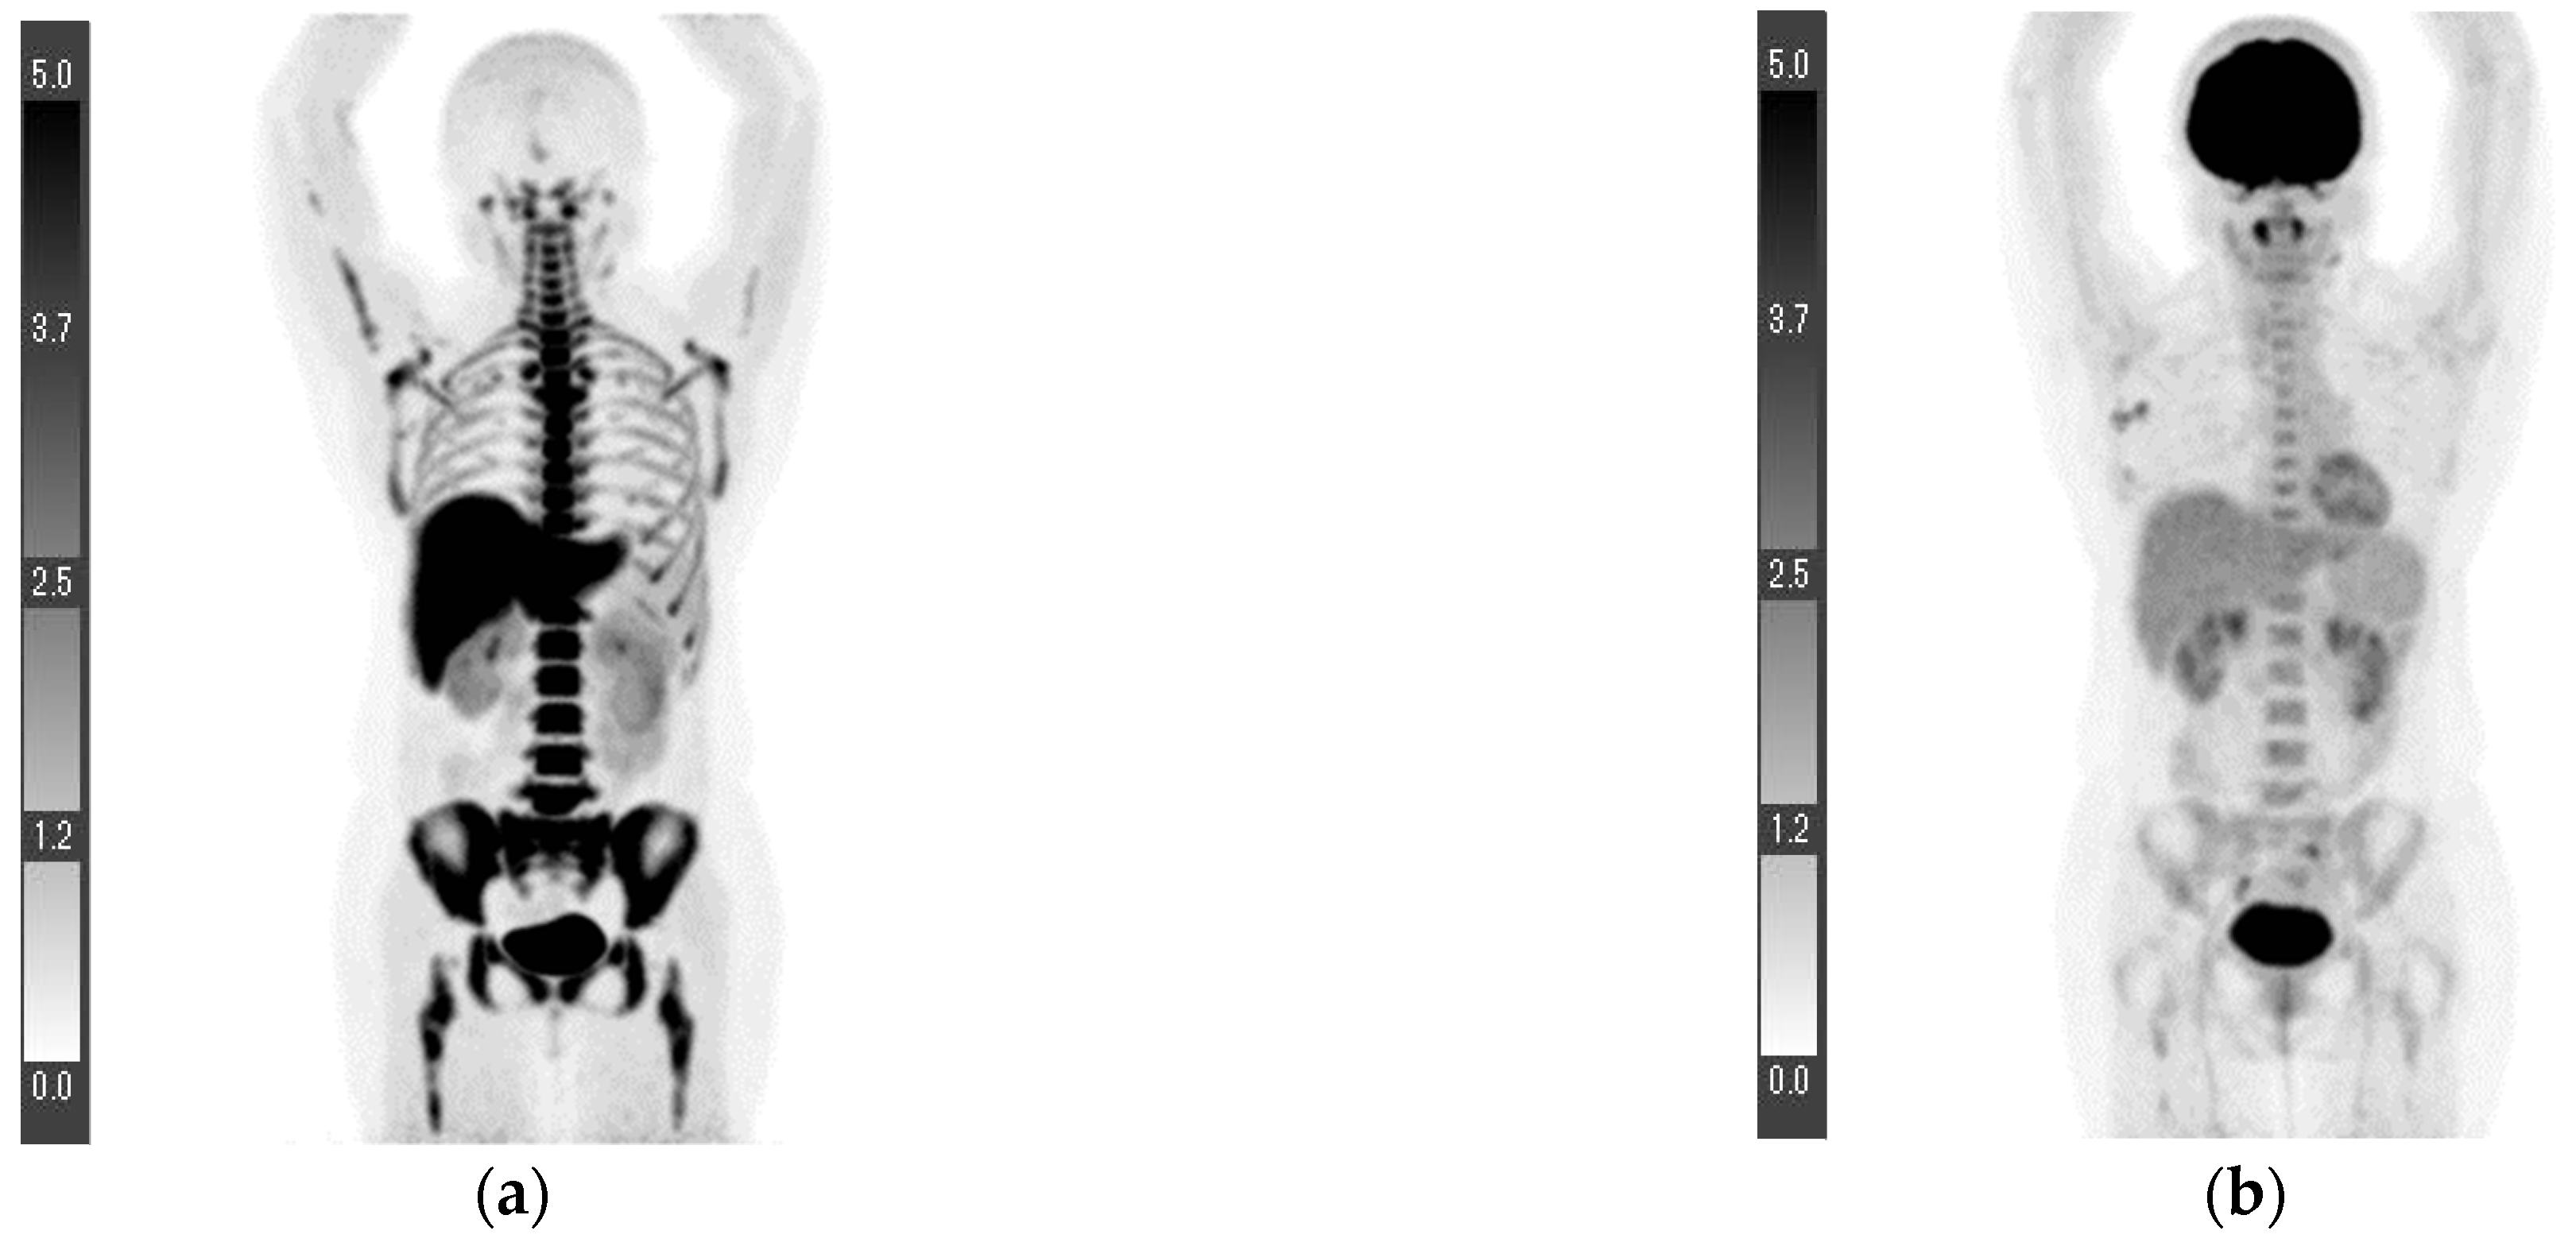
Figure 1. Maximum intensity projection (MIP) of 18F-FLT PET (a), MIP of 18F-FDG PET (b), axial image of 18F-FLT PET/CT (c), and axial image of 18F-FDG PET/CT (d). The axillary lymph node that showed the greatest accumulation differed between the 18F-FLT PET/CT and 18F-FDG PET/CT, with SUVmax values of 3.0 and 3.4, respectively (arrows). Patient 1 (Figure 1).
Tomography 08 00211 g001aTomography 08 00211 g001b
Figure 2. First maximum intensity projection (MIP) of 18F-FDG PET (a), MIP of 18F-FLT PET performed 3 days later (b), and MIP of 18F-FLT PET performed 5 months later (c). In the axial image of the PET/CT at the slice of the primary right breast cancer, both the 18F-FDG PET/CT and 18F-FLT PET/CT showed trace accumulation ((d,e), arrows). The axillary lymph node with the greatest accumulation differed between the 18F-FLT PET/CT (f) and 18F-FDG PET/CT (g), and the SUVmax values were 30.0 and 14.2, respectively (arrows). The lymph node corresponding to the node with the greatest accumulation on the 18F-FDG PET/CT showed an SUVmax of 16.7 on the 18F-FLT PET/CT ((f), arrowhead). The post-chemotherapy thoracic spine metastasis showed low 18F-FLT accumulation and bone sclerosis, suggesting that cell proliferation had decreased ((h,i), arrows). Patient 4 (Figure 2).
Tomography 08 00211 g002aTomography 08 00211 g002b
Figure 3. Maximum intensity projection (MIP) of 18F-FLT PET (a) and MIP of 18F-FDG PET 25 days before the 18F-FLT PET/CT (b). The patient had a first lumbar vertebra metastasis, and the SUVmax of the 18F-FLT PET/CT and 18F-FDG PET/CT were 10.8 and 12.6, respectively (arrows). Patient 6 (Figure 3).
Tomography 08 00211 g003
Figure 4. Boxplots of the SUVmax for treatment-naive patients (patients 1–6). SUVmax, maximum standardized uptake value; primary FLT, SUVmax of the primary breast cancer on 18F-fluorothymidine positron emission tomography/computed tomography (18F-FLT PET/CT); primary FDG, SUVmax of the primary breast cancer on 18F-fluorodeoxyglucose positron emission tomography/computed tomography (18F-FDG PET/CT); LN FLT, SUVmax of the axillary lymph node on 18F-FLT PET/CT; LN FDG, SUVmax of the axillary lymph node on 18F-FDG PET/CT.
Tomography 08 00211 g004
Figure 5. Maximum intensity projection (MIP) of 18F-FDG PET (a), MIP of 18F-FLT PET 7 months after chemotherapy (b), and MIP of 18F-FDG PET 4 days after the 18F-FLT PET (c). 18F-FDG accumulation increased in the right breast following chemotherapy ((e), arrow), whereas 18F-FLT accumulation was not evident ((d), arrow). Patient 7 (Figure 5).
Tomography 08 00211 g005
Figure 6. Maximum intensity projection (MIP) of 18F-FLT PET (a) and 18F-FDG PET 10 months prior (b). 18F-FLT accumulation within an osteolytic lesion ((c), arrow) on the left side of the sacrum was lower than that in the physiological bone marrow ((d), arrow). In addition, left axillary lymph node accumulation with coarse calcification was found on 18F-FDG PET/CT ((e), arrowhead); however, accumulation on 18F-FLT PET/CT did not increase ((f), arrowhead), suggesting inflammation. Patient 8 (Figure 6).
Tomography 08 00211 g006
Table 1. Ages of treatment-naive patients before positron emission tomography/computed tomography and time series of each examination.
Age (Years)18F-FLT PET/CT (Days) *18F-FDG PET/CT (Days) *Surgery (Days) *
Patient 149353356
Patient 272272041
Patient 373211827
Patient 4682219-
Patient 571719-
Patient 6721540-
Patient 763---
Patient 852---
18F-FLT PET/CT, 18F-fluorothymidine positron emission tomography/computed tomography; 18F-FDG PET/CT, 18F-fluorodeoxyglucose positron emission tomography/computed tomography. * Days since biopsy.
Table 2. Positron emission tomography/computed tomography (PET/CT) and pathology results of treatment-naive patients before PET/CT.
PatientPrimary FLTPrimary FDGLN FLTLN FDGStageHistological DiagnosisNuclear GradeERPRHER2Ki-67 (%)
11.01.81.6 *3.4 *T1cN2aM0 **Invasive ductal carcinoma1++1.0
20.61.60.70.8T1bN0M0 **Invasive ductal carcinoma1++6.7
32.23.10.50.6T1cN0M0 **Invasive ductal carcinoma2++24.6
40.41.516.7 *14.2 *T1bN3aM1 ***
(Lymph node and bone
metastases)
Invasive ductal carcinomaData loss++Data loss
53.88.31.86.3T2N3bM0 ***Invasive ductal carcinoma1++25
64.88.41.43.2T4bN1M1 ***
(Lumbar vertebra metastasis)
Invasive ductal carcinoma1++8.9
7 ****7.010.11.20.7T4bN0M0Invasive ductal carcinomaData loss+59
8 *****--1.14.1N3bM1
(Lymph node, lung, and bone metastases)
Invasive ductal carcinoma3++29.3
Primary FLT, maximum standardized uptake value (SUVmax) of primary breast cancer on 18F-fluorothymidine positron emission tomography/computed tomography (18F-FLT PET/CT); primary FDG, SUVmax of primary breast cancer on 18F-fluorodeoxyglucose positron emission tomography/computed tomography (18F-FDG PET/CT); LN FLT, SUVmax of the axillary lymph node on 18F-FLT PET/CT; LN FDG, SUVmax of the axillary lymph node on 18F-FDG PET/CT; ER, estrogen receptor; PR, progesterone receptor; HER2, human epidermal growth factor 2; +, positive; −, negative. * The axillary lymph node that showed the greatest accumulation differed between 18F-FLT PET/CT and 18F-FDG PET/CT. The SUVmax on the 18F-FLT PET/CT showed lymph node values corresponding to those on the 18F-FDG PET/CT. The SUVmax of the lymph node with the greatest accumulation on the 18F-FLT PET/CT was 3.1 for patient 1 and 30.0 for patient 4. ** Pathological stage determined via surgery. *** Clinical stage determined via biopsy and PET/CT. **** SUVmax, stage, histological diagnosis, and immunostaining results are all post-chemotherapy data. ***** SUVmax of the axillary lymph nodes showed recent 18F-FLT PET/CT and 18F-FDG PET/CT 10 months prior. Histological diagnosis and immunostaining results were obtained using surgical specimens after chemotherapy.
Table 3. Results of the statistical analysis of the SUVmax on the 18F-FLT PET/CT and 18F-FDG PET/CT for treatment-naive patients.
Significant DifferenceCorrelation Coefficient
Primary breast cancerp = 0.031 *0.969
Axillary lymph nodep = 0.246 **0.999
SUVmax, maximum standardized uptake value; 18F-FLT PET/CT, 18F-fluorothymidine positron emission tomography/computed tomography; 18F-FDG PET/CT, 18F-fluorodeoxyglucose positron emission tomography/computed tomography. * Result of the two-tailed paired t-test. ** Result of the Wilcoxon signed-rank test.
Publisher’s Note: MDPI stays neutral with regard to jurisdictional claims in published maps and institutional affiliations.