
Anatomically Accurate, High-Resolution Modeling of the Human Index Finger Using In Vivo Magnetic Resonance Imaging
 , , ,
, , ,  and
and 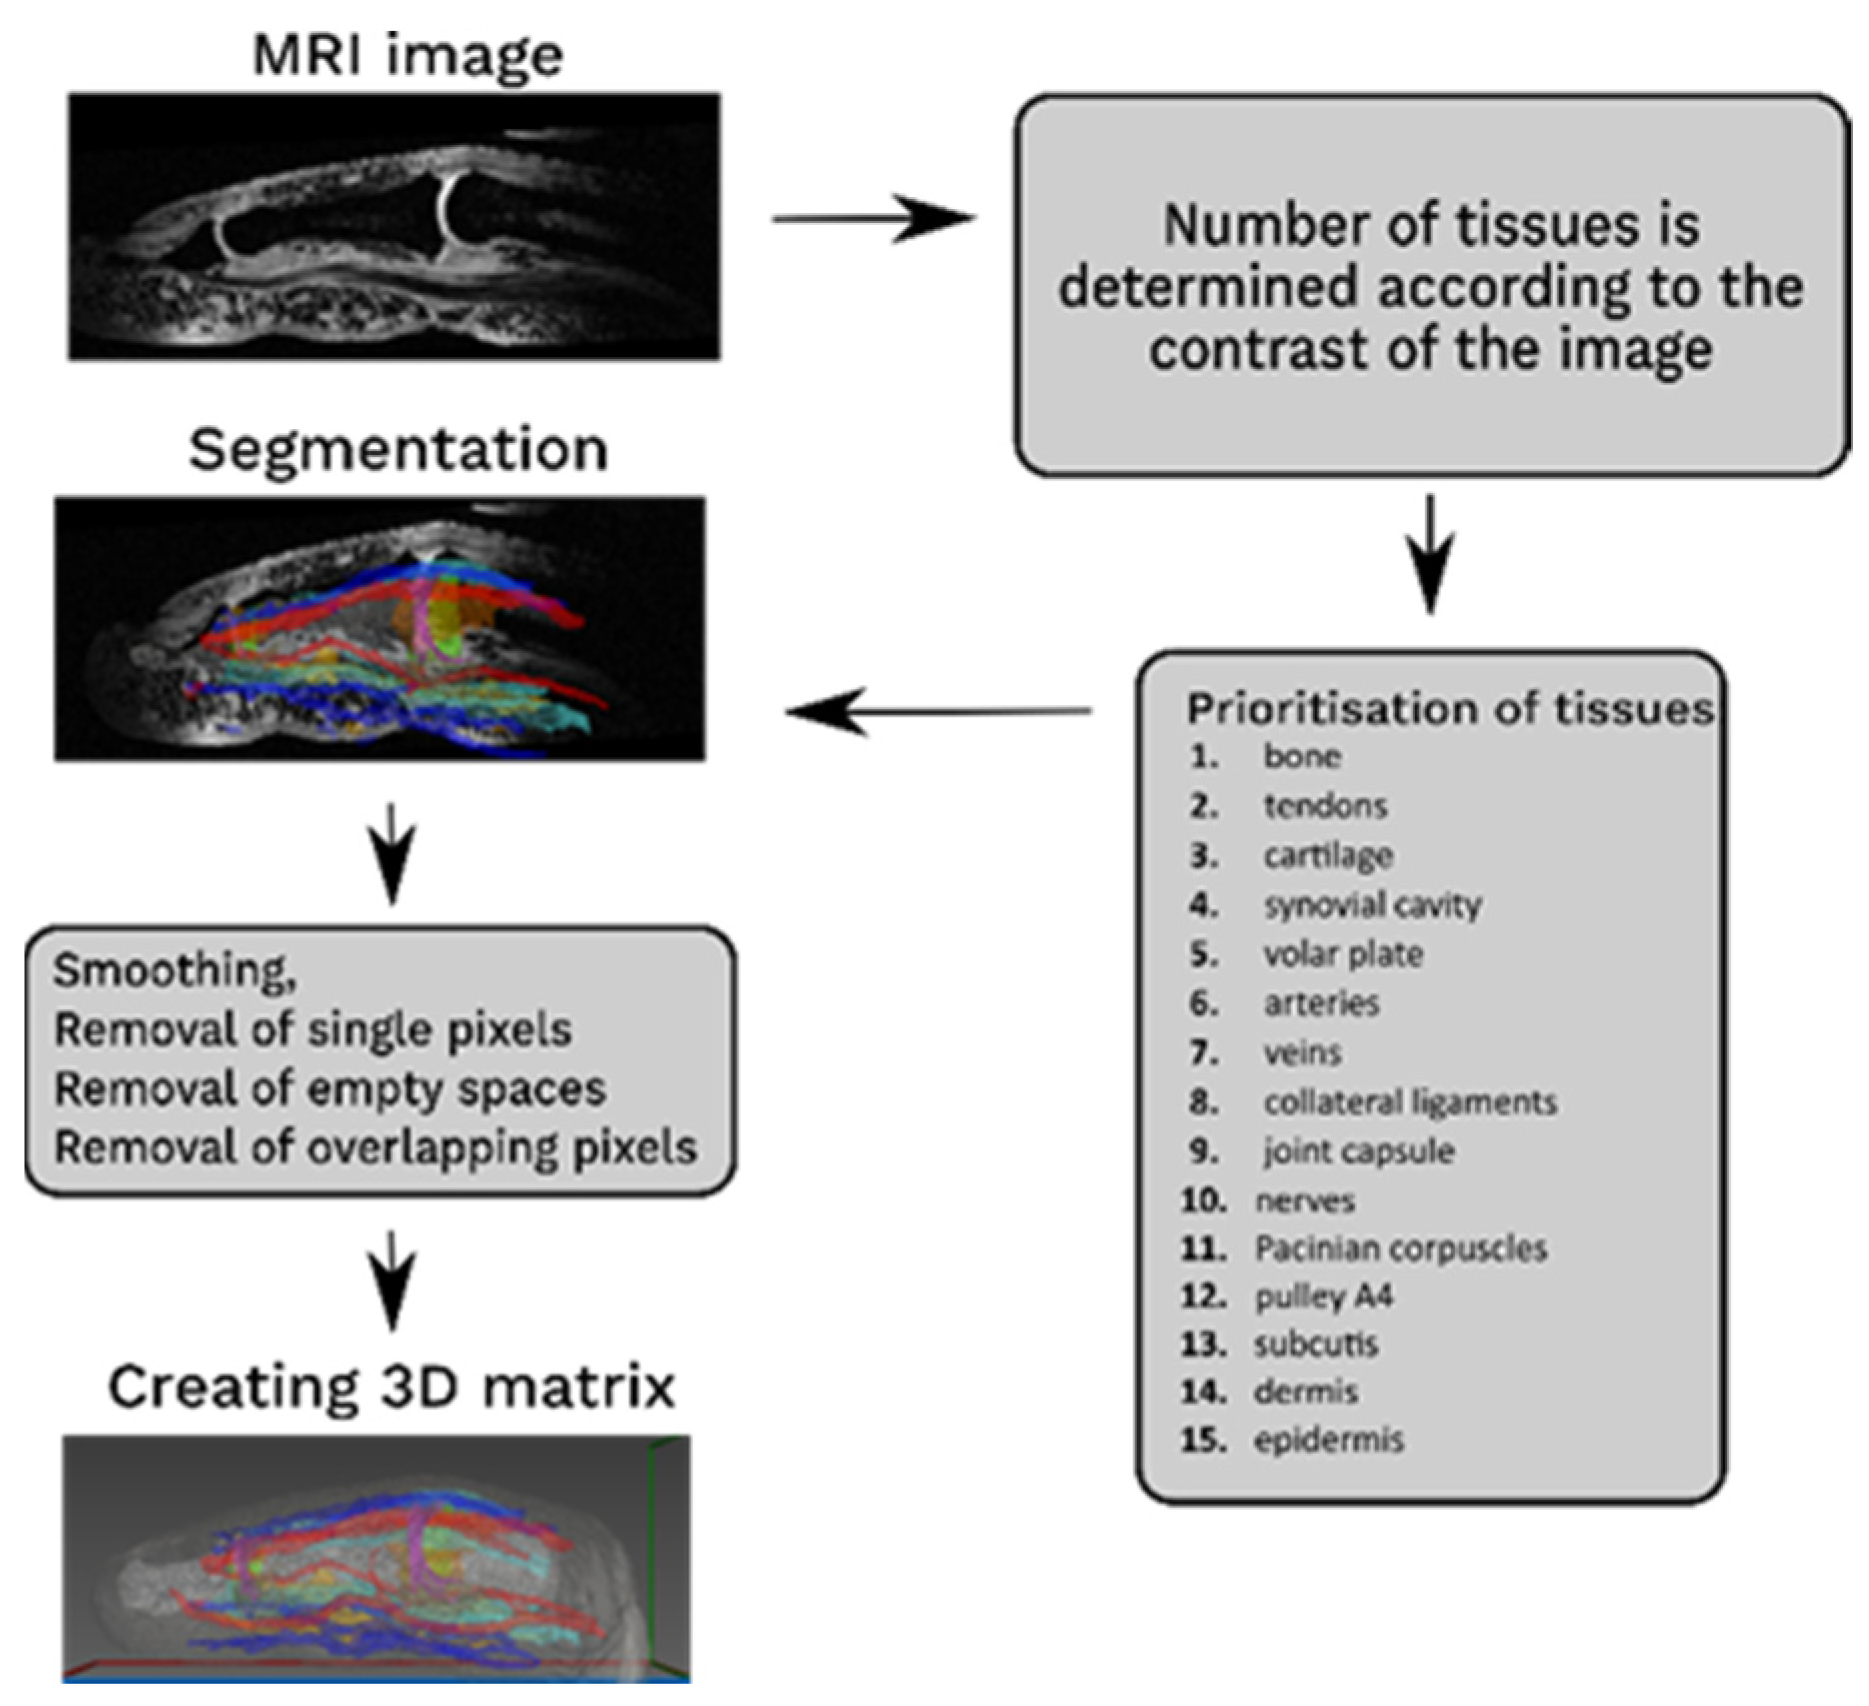
Abstract
1. Introduction
2. Materials and Methods
2.1. Data
2.2. Segmentation
2.3. Versatility of the Model
2.4. Application of the Model
3. Results
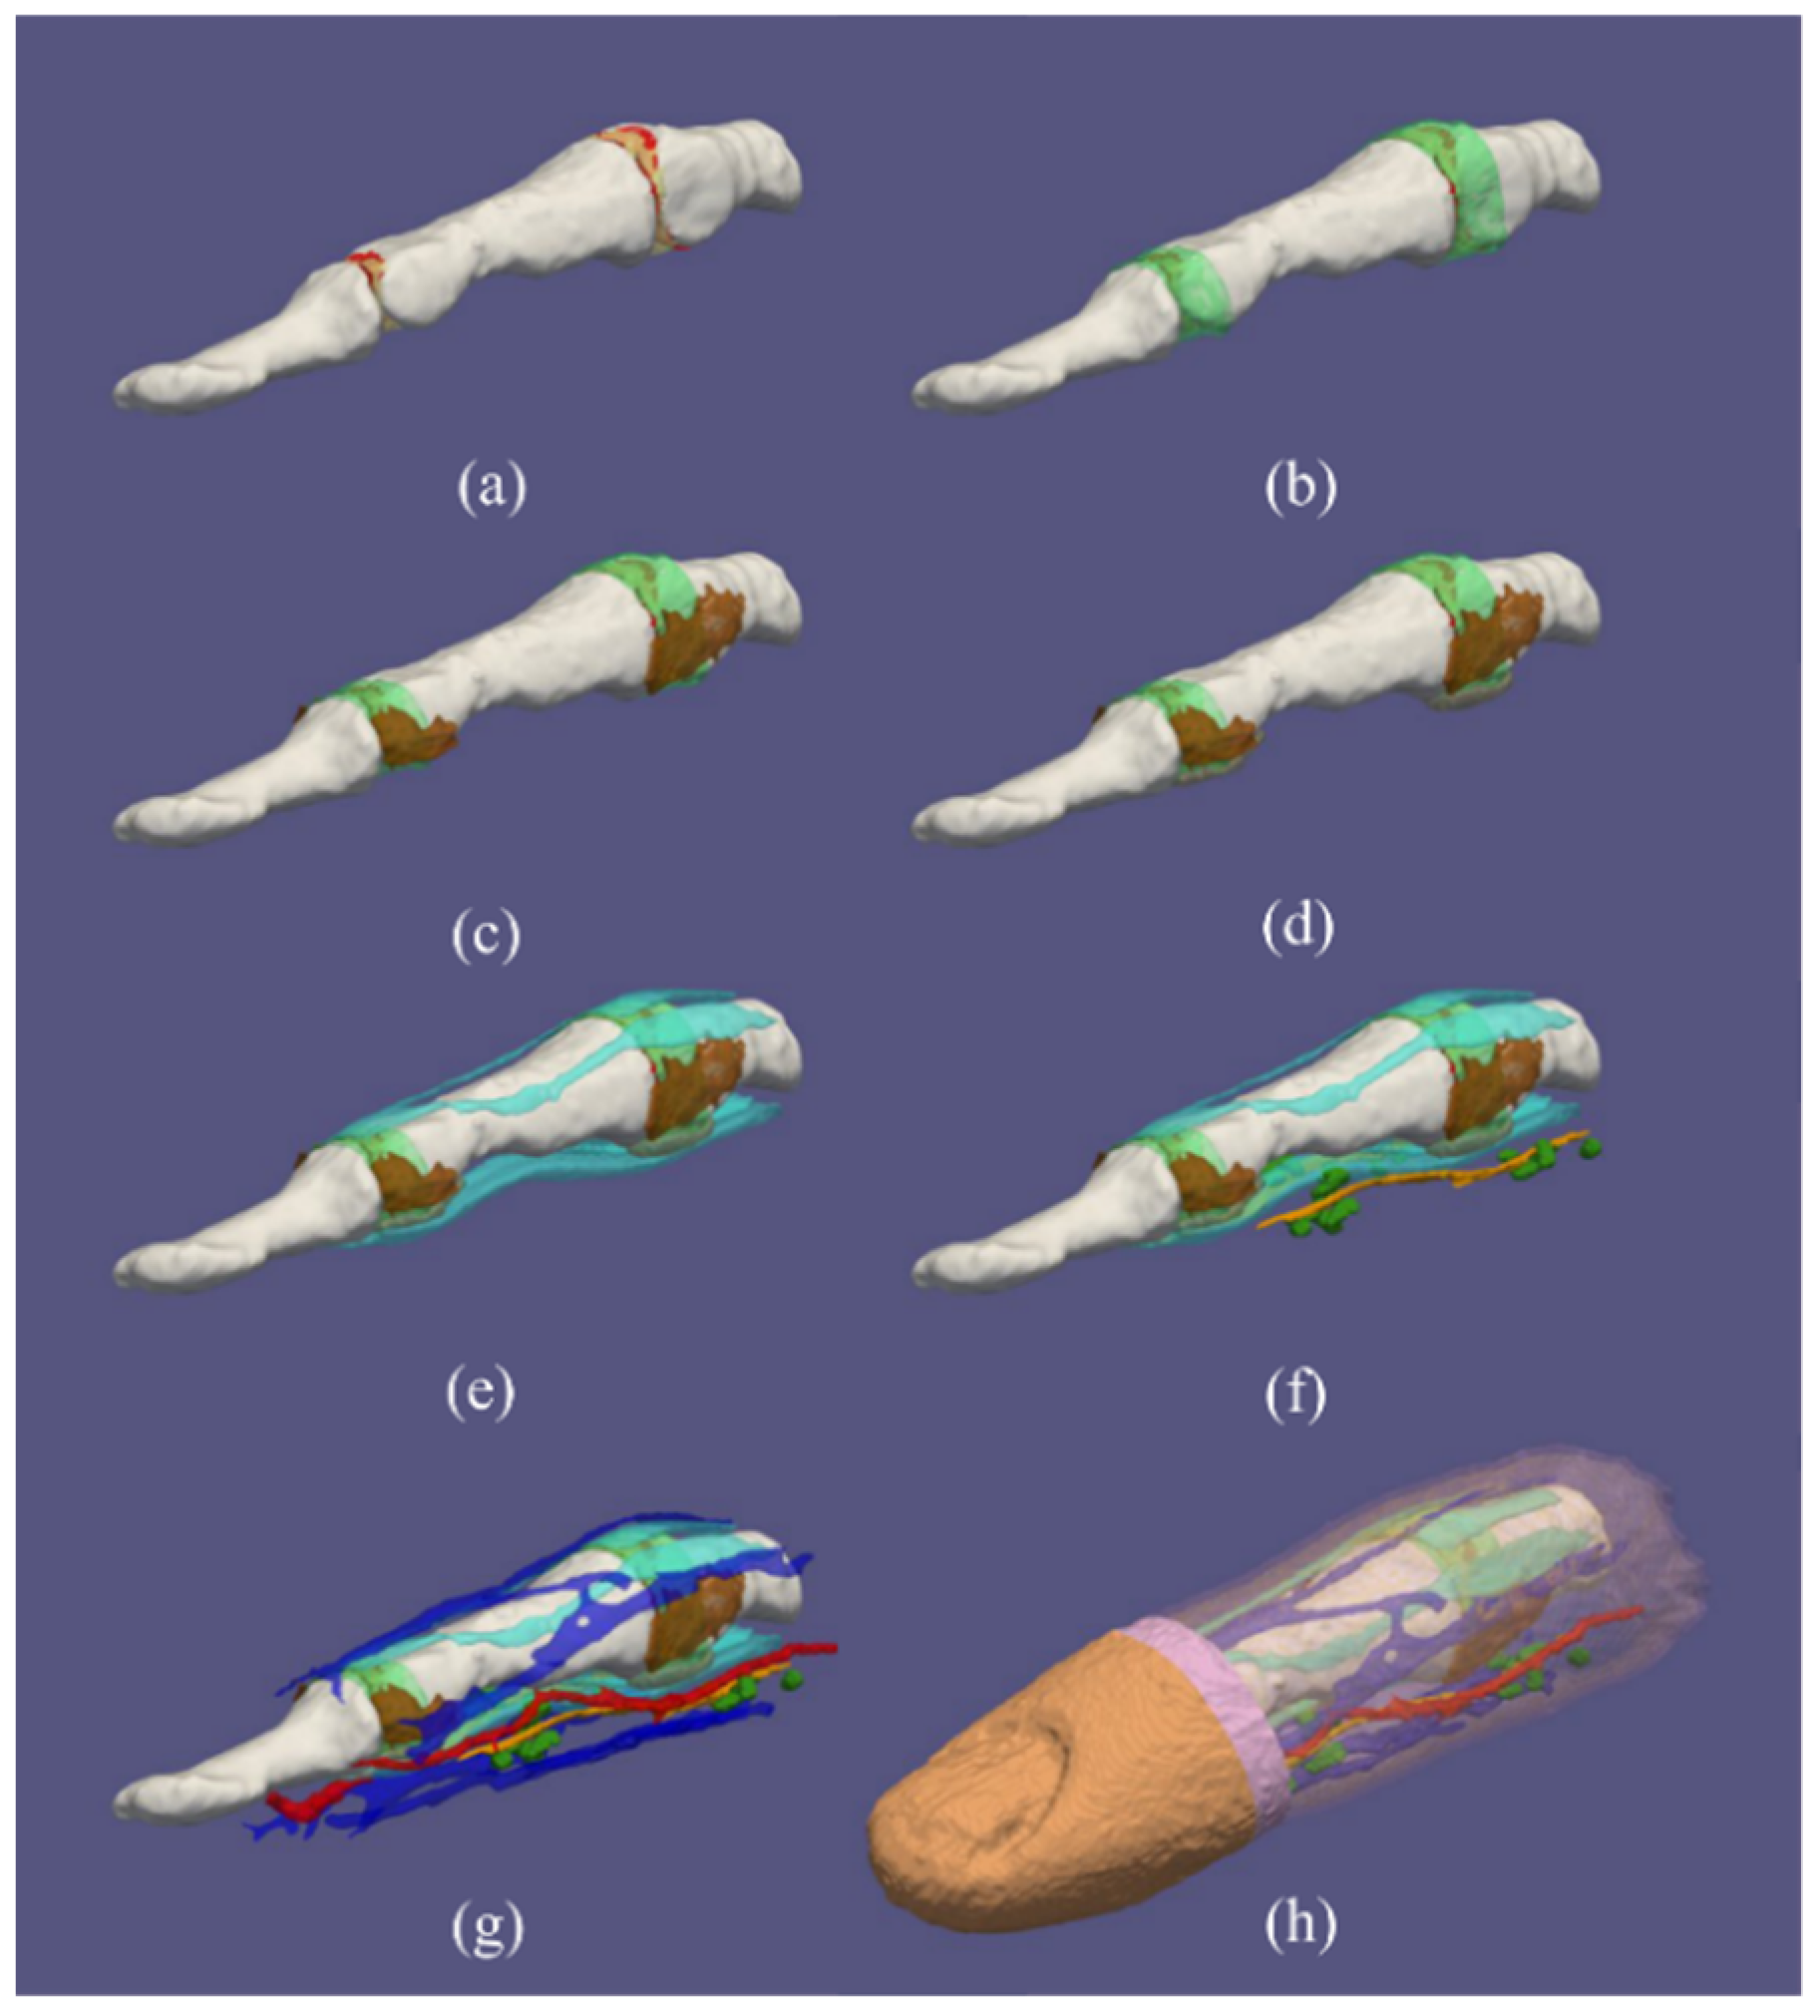
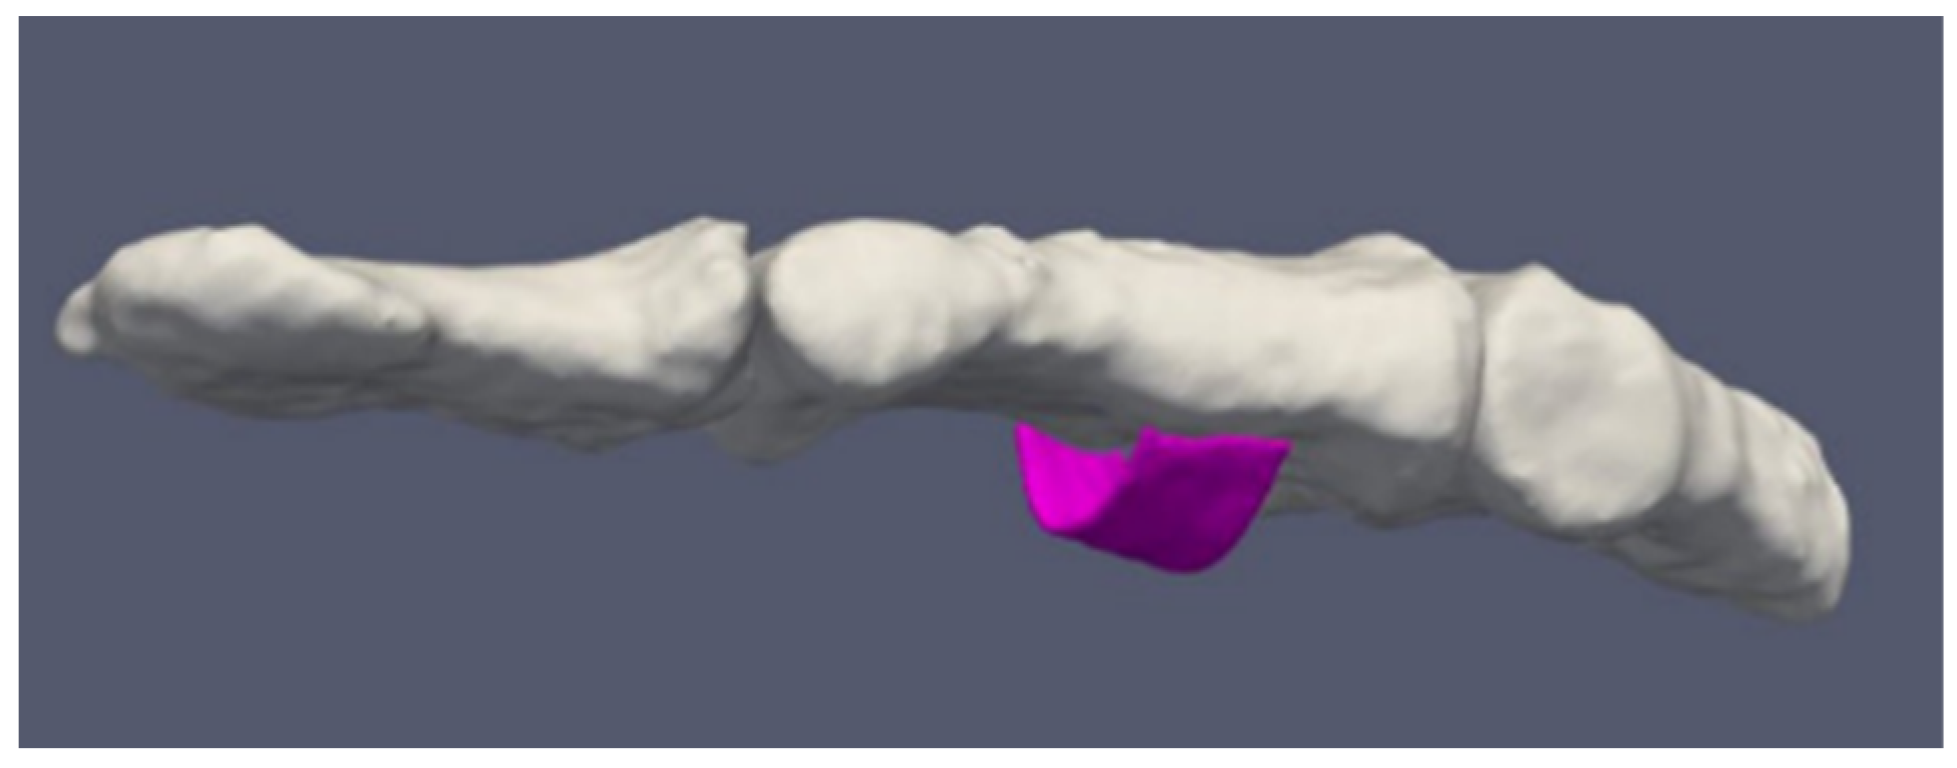
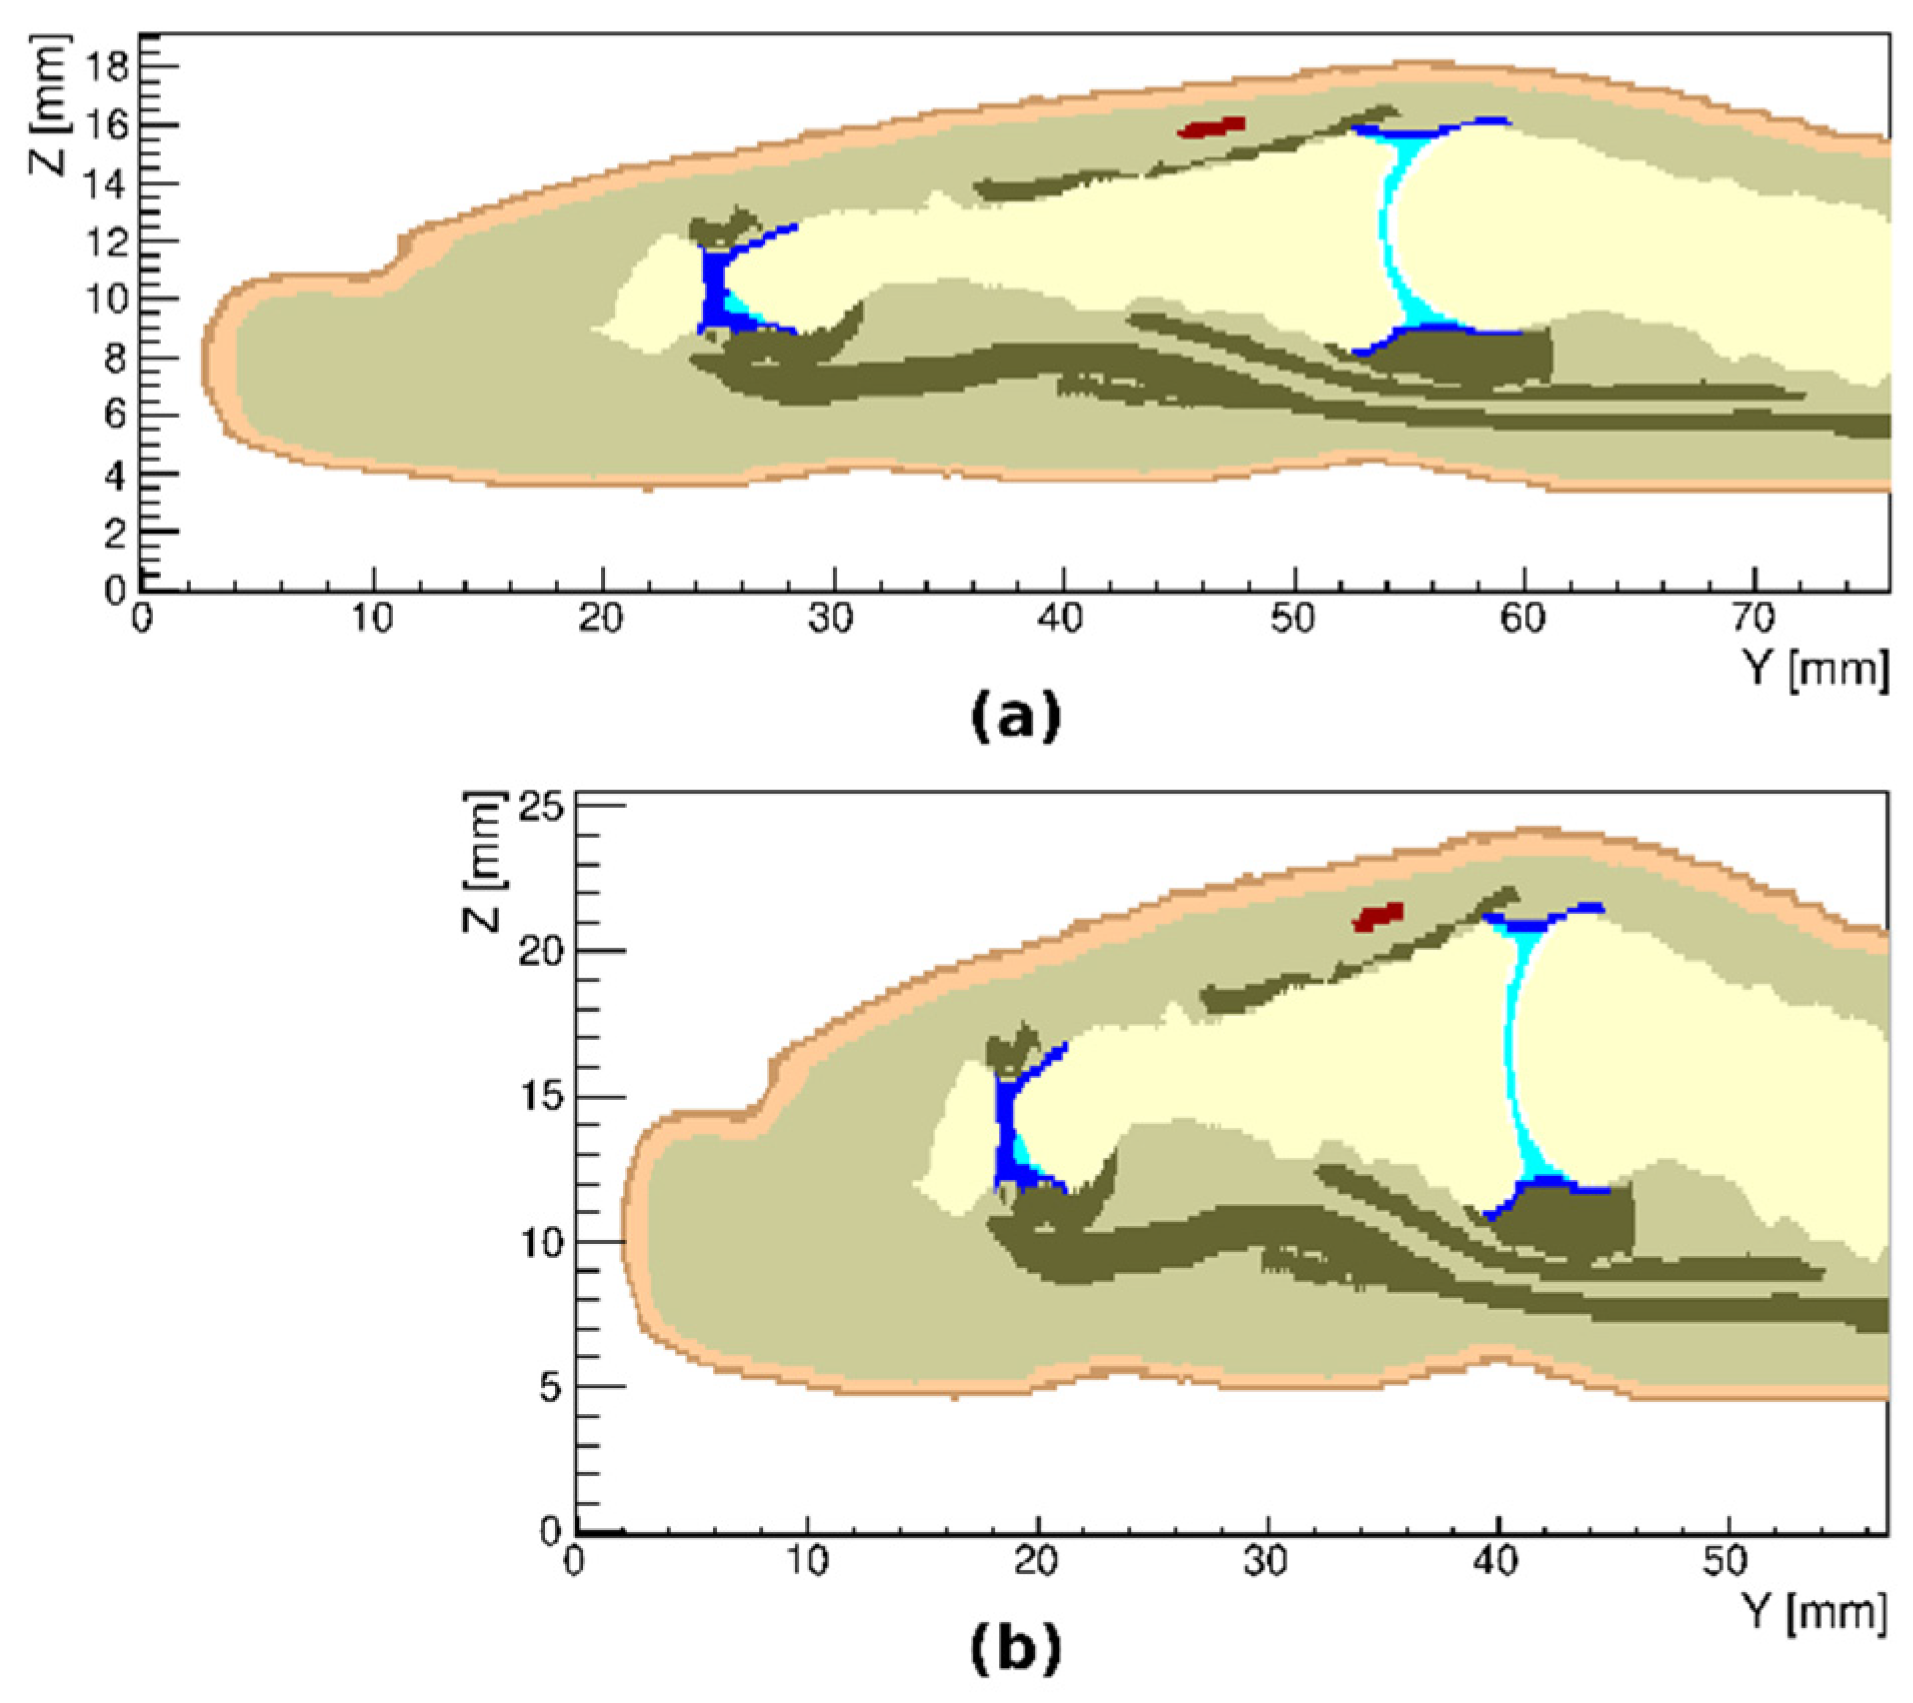
3.1. Healthy Finger
3.2. Arthritic Finger Joints
3.3. Simulated Ruptured Finger Tendon
3.4. Variations in the Geometry of a Finger
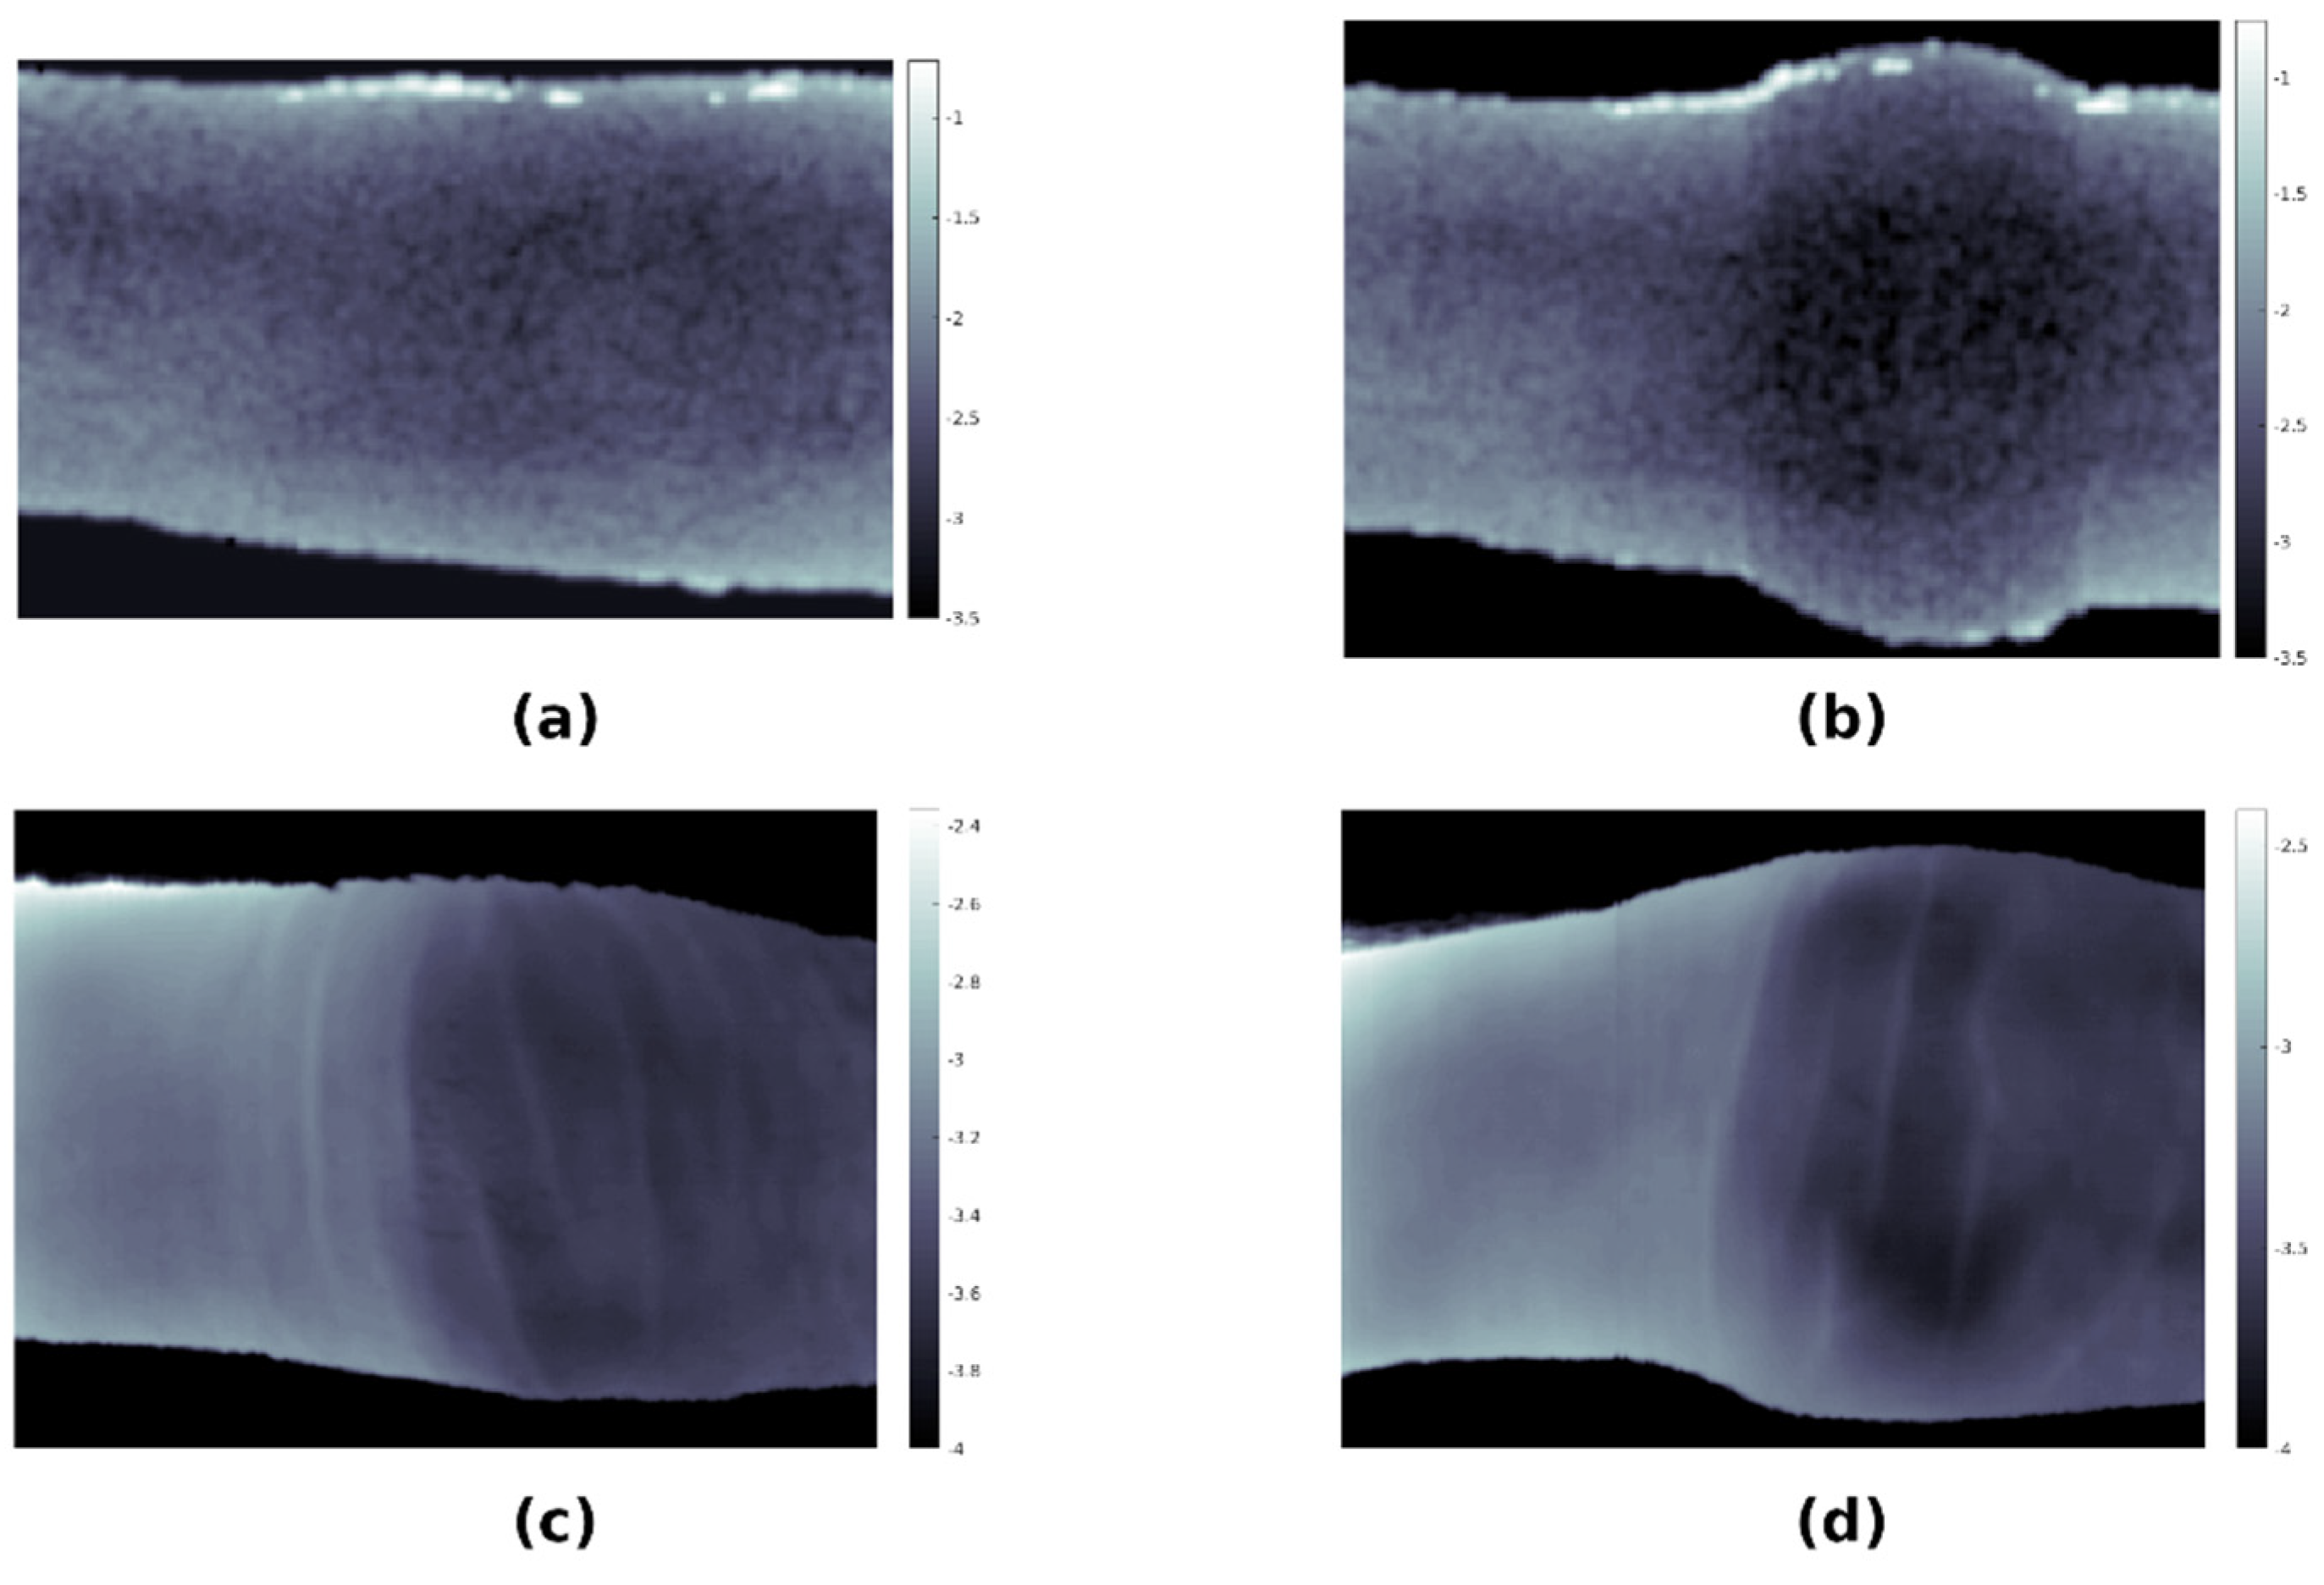
3.5. Monte Carlo Simulations of Optical Transmission
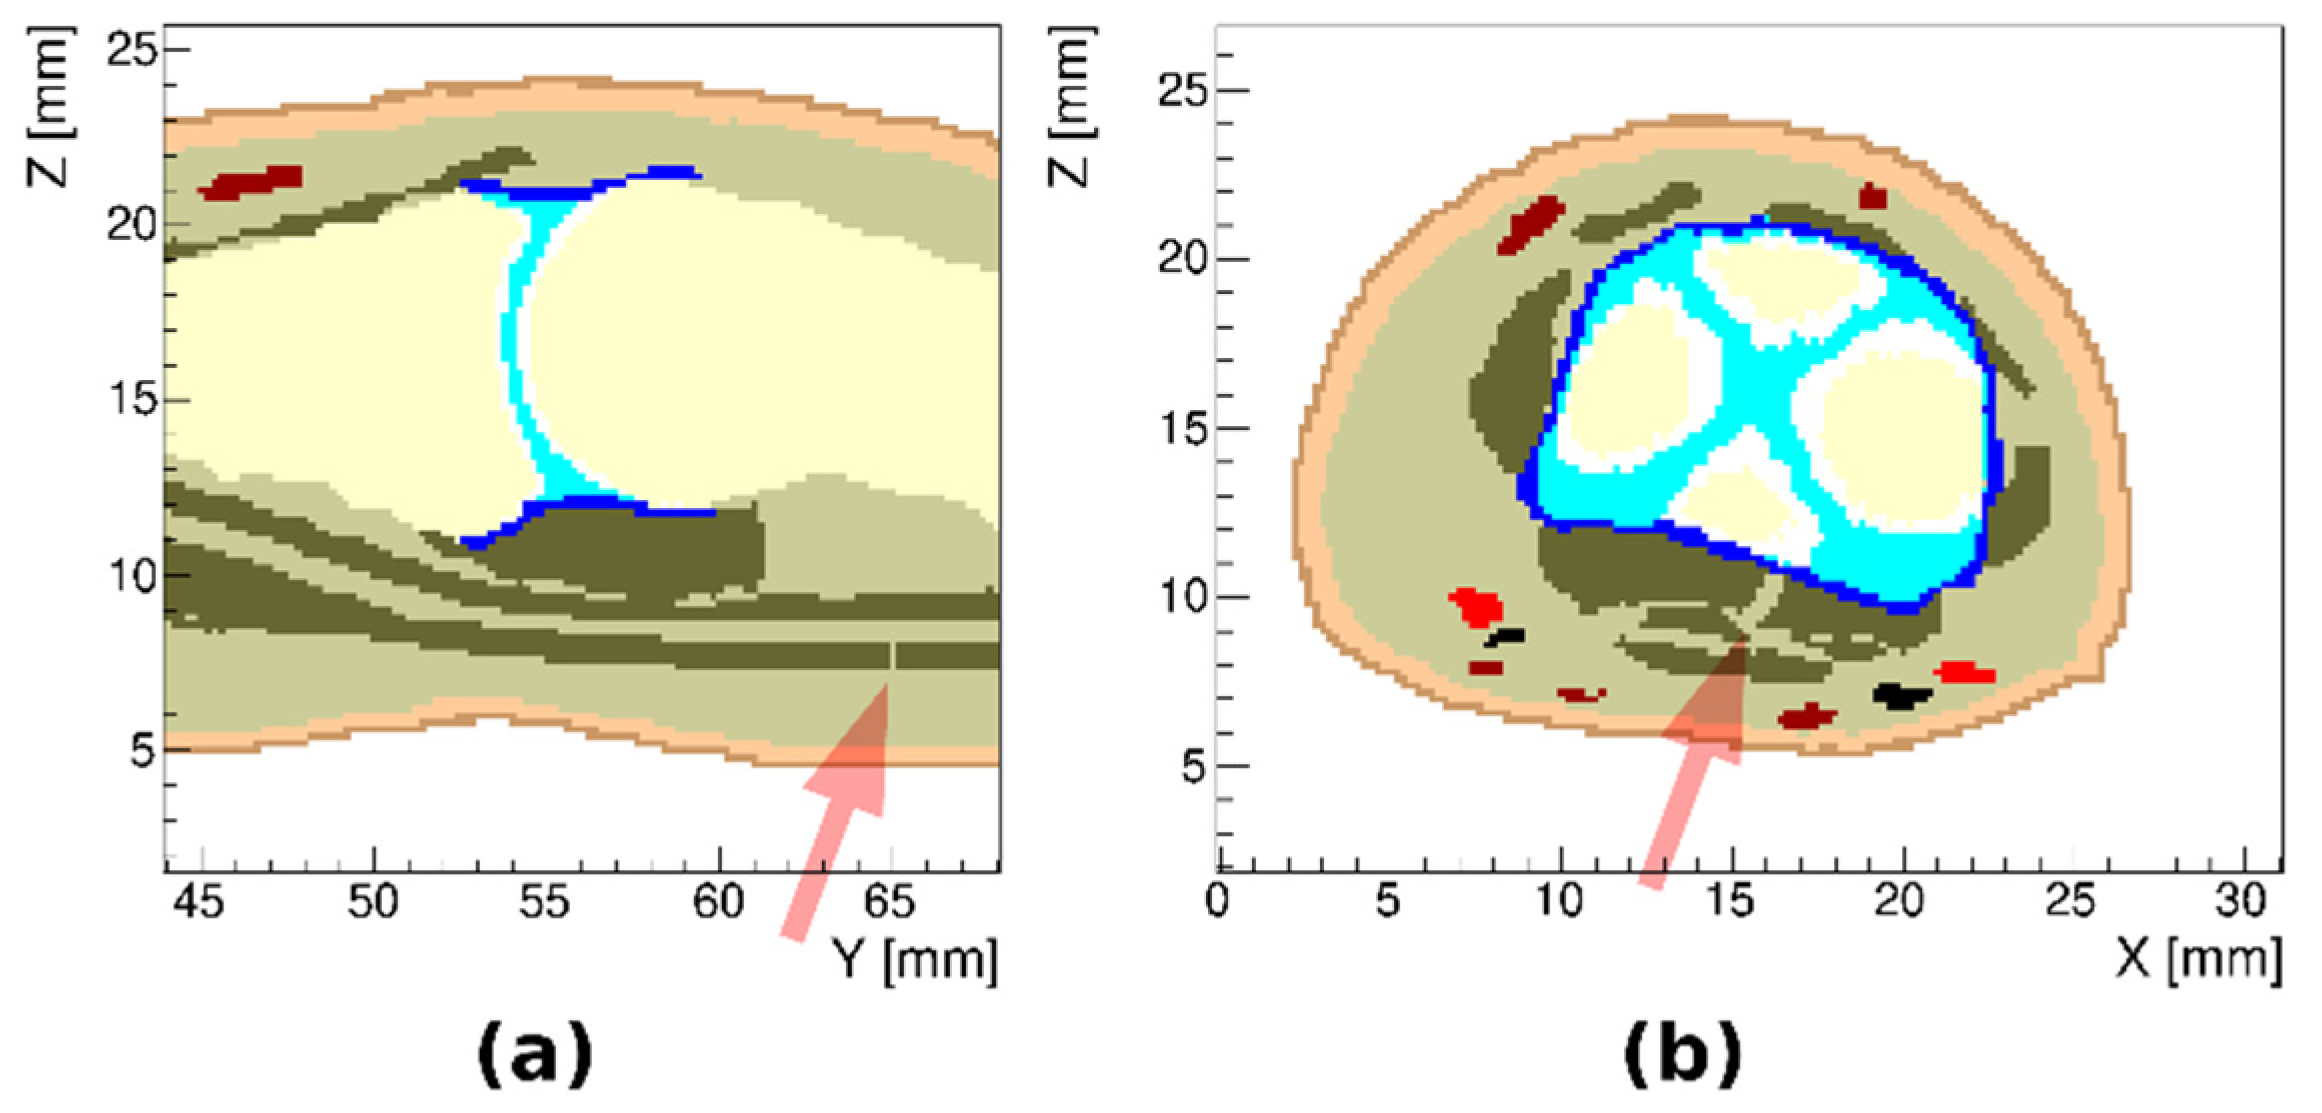
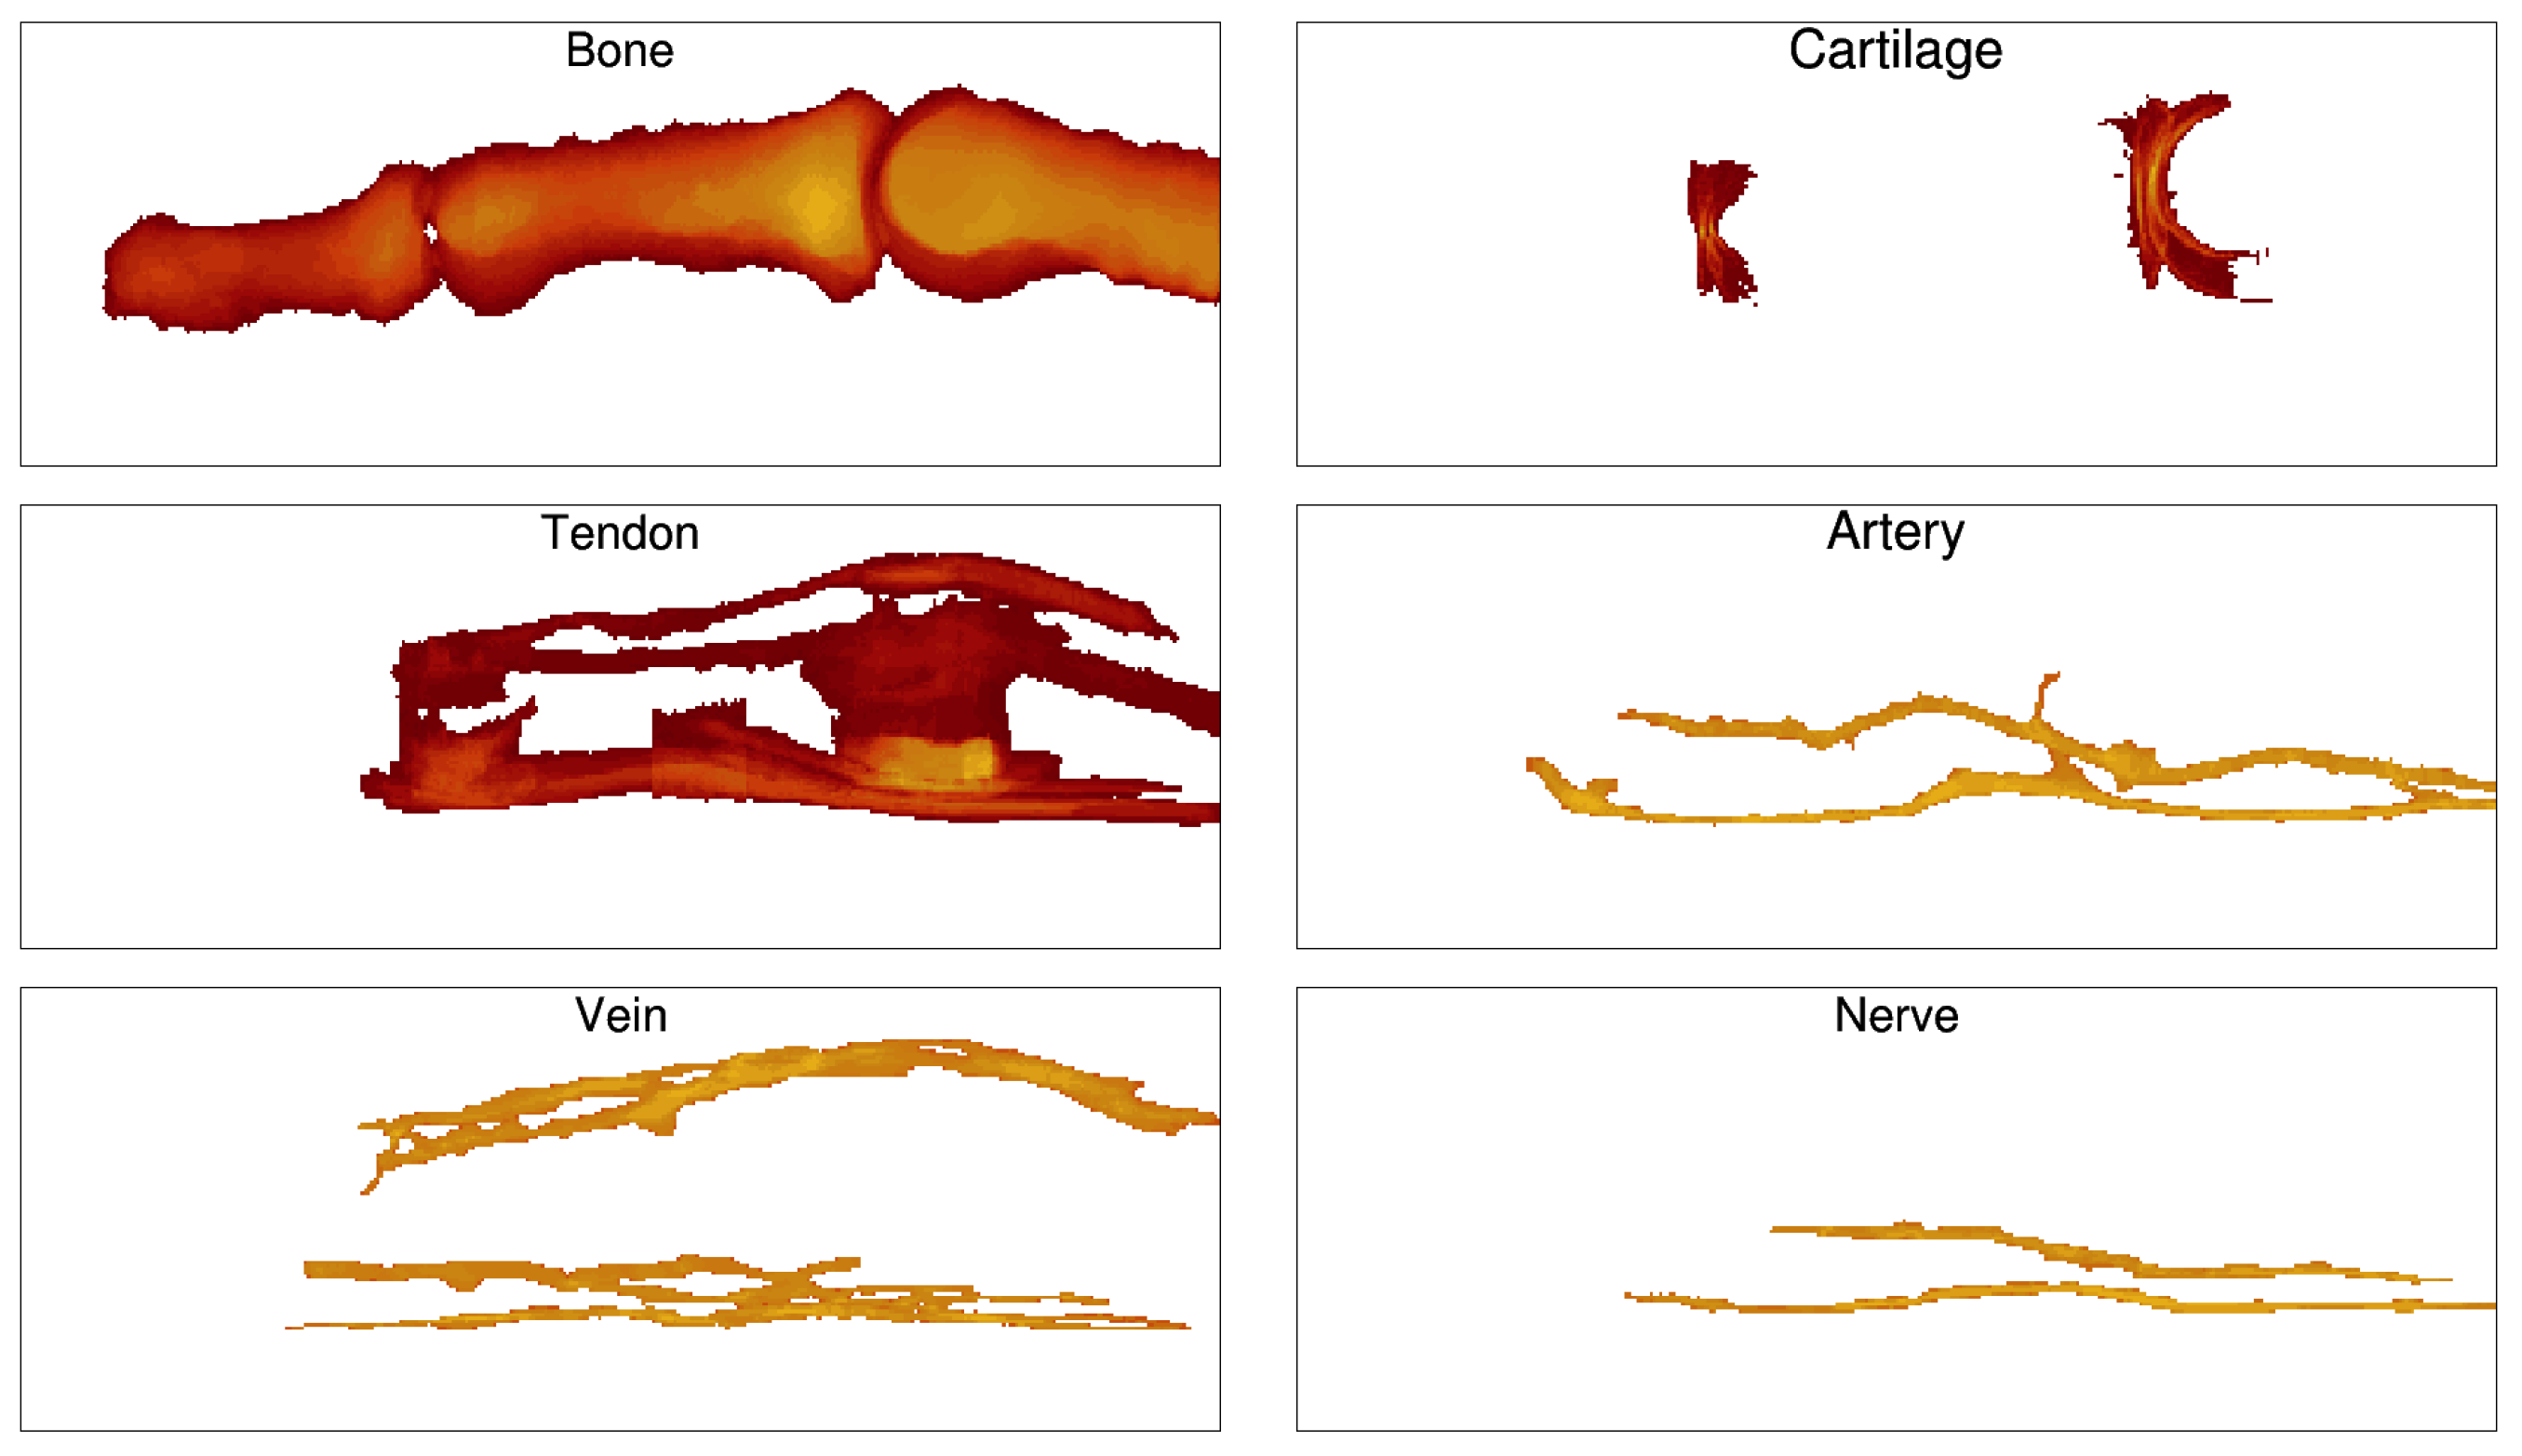
3.6. Tissue Distribution
3.7. Comparison of Simulations with Hyperspectral Imaging of Healthy and Arthritic Fingers
4. Discussion
5. Conclusions
Author Contributions
Funding
Institutional Review Board Statement
Informed Consent Statement
Data Availability Statement
Conflicts of Interest
Appendix A

References
- Schoellnast, H.; Deutschmann, H.A.; Hermann, J.; Schaffler, G.J.; Reittner, P.; Kammerhuber, F.; Szolar, D.H.; Preidler, K.W. Psoriatic Arthritis and Rheumatoid Arthritis: Findings in Contrast-Enhanced MRI. Am. J. Roentgenol. 2006, 187, 351–357. [Google Scholar] [CrossRef] [PubMed]
- Farrant, J.M.; O’Connor, P.J.; Grainger, A.J. Advanced Imaging in Rheumatoid Arthritis: Part 1: Synovitis. Skelet. Radiol. 2007, 36, 269–279. [Google Scholar] [CrossRef] [PubMed]
- Farrant, J.M.; Grainger, A.J.; O’Connor, P.J. Advanced Imaging in Rheumatoid Arthritis: Part 2: Erosions. Skelet. Radiol. 2007, 36, 381–389. [Google Scholar] [CrossRef] [PubMed]
- Chao, Y.; Sinclair, A.; Morrison, A.; Hafizi, D.; Pyke, L. The Canadian Medical Imaging Inventory 2019–2020; CADTH: Ottawa, ON, Canada, 2021. [Google Scholar]
- Schaap, K.; Christopher-De Vries, Y.; Slottje, P.; Kromhout, H. Inventory of MRI Applications and Workers Exposed to MRI-Related Electromagnetic Fields in the Netherlands. Eur. J. Radiol. 2013, 82, 2279–2285. [Google Scholar] [CrossRef]
- Dubey, R. A review on mri image segmentation techniques. Int. J. Adv. Res. Electron. Commun. Eng. 2015, 4, 1451–1455. [Google Scholar] [CrossRef]
- Jansen, M.J.A.; Kuijf, H.J.; Niekel, M.; Veldhuis, W.B.; Wessels, F.J.; Viergever, M.A.; Pluim, J.P.W. Liver Segmentation and Metastases Detection in MR Images Using Convolutional Neural Networks. J. Med. Imag. 2019, 6, 044003. [Google Scholar] [CrossRef]
- Weng, A.M.; Heidenreich, J.F.; Metz, C.; Veldhoen, S.; Bley, T.A.; Wech, T. Deep Learning-Based Segmentation of the Lung in MR-Images Acquired by a Stack-of-Spirals Trajectory at Ultra-Short Echo-Times. BMC Med Imaging 2021, 21, 79. [Google Scholar] [CrossRef]
- Hren, R.; Stroink, G. Application of the Surface Harmonic Expansions for Modeling the Human Torso. IEEE Trans. Biomed. Eng. 1995, 42, 521–524. [Google Scholar] [CrossRef]
- Laistler, E.; Dymerska, B.; Sieg, J.; Goluch, S.; Frass-Kriegl, R.; Kuehne, A.; Moser, E. In Vivo MRI of the Human Finger at 7 T: In Vivo 7T Finger MRI. Magn. Reson. Med. 2017, 79, 588–592. [Google Scholar] [CrossRef]
- Feliner, F.; Holl, K.; Held, P.; Fellner, C.; Schmitt, R.; Böhm-Jurkovic, H. A T1-Weighted Rapid Three-Dimensional Gradient-Echo Technique (MP-RAGE) in Preoperative MRI of Intracranial Tumours. Neuroradiology 1996, 38, 199–206. [Google Scholar] [CrossRef]
- Wolf, I.; Vetter, M.; Wegner, I.; Böttger, T.; Nolden, M.; Schöbinger, M.; Hastenteufel, M.; Kunert, T.; Meinzer, H.-P. The Medical Imaging Interaction Toolkit. Med. Image Anal. 2005, 9, 594–604. [Google Scholar] [CrossRef]
- Maleike, D.; Nolden, M.; Meinzer, H.-P.; Wolf, I. Interactive Segmentation Framework of the Medical Imaging Interaction Toolkit. Comput. Methods Programs Biomed. 2009, 96, 72–83. [Google Scholar] [CrossRef]
- Zhou, S.K.; Rueckert, D.; Fichtinger, G. (Eds.) Handbook of Medical Image Computing and Computer Assisted Intervention; Elsevier: Amsterdam, The Netherlands, 2020; ISBN 978-0-12-816176-0. [Google Scholar]
- Lorensen, W.E.; Cline, H.E. Marching Cubes: A High Resolution 3D Surface Construction Algorithm; ACM Press: New York, NY, USA, 1987; pp. 163–169. [Google Scholar]
- Wang, L.; Jacques, S.L.; Zheng, L. MCML—Monte Carlo Modeling of Light Transport in Multi-Layered Tissues. Comput. Methods Programs Biomed. 1995, 47, 131–146. [Google Scholar] [CrossRef]
- Dolenec, R.; Laistler, E.; Milanic, M. Assessing Spectral Imaging of the Human Finger for Detection of Arthritis. Biomed. Opt. Express 2019, 10, 6555. [Google Scholar] [CrossRef]
- Milanic, M.; Paluchowski, L.A.; Randeberg, L.L. Hyperspectral Imaging for Detection of Arthritis: Feasibility and Prospects. J. Biomed. Opt. 2015, 20, 096011. [Google Scholar] [CrossRef]
- Stergar, J.; Hren, R.; Milanič, M. Design and Validation of a Custom-Made Laboratory Hyperspectral Imaging System for Biomedical Applications Using a Broadband LED Light Source. Sensors 2022, 22, 6274. [Google Scholar] [CrossRef]
- Trattnig, S.; Bogner, W.; Gruber, S.; Szomolanyi, P.; Juras, V.; Robinson, S.; Zbýň, Š.; Haneder, S. Clinical Applications at Ultrahigh Field (7 T). Where Does It Make the Difference?: Clinical Applications at 7 T. NMR Biomed. 2016, 29, 1316–1334. [Google Scholar] [CrossRef]
- Welsch, G.H.; Juras, V.; Szomolanyi, P.; Mamisch, T.C.; Baer, P.; Kronnerwetter, C.; Blanke, M.; Fujita, H.; Trattnig, S. Magnetic Resonance Imaging of the Knee at 3 and 7 Tesla: A Comparison Using Dedicated Multi-Channel Coils and Optimised 2D and 3D Protocols. Eur. Radiol. 2012, 22, 1852–1859. [Google Scholar] [CrossRef]
- Krzyżak, A.T.; Mazur, W.; Fheed, A.; Węglarz, W.P. Prospects and Challenges for the Spatial Quantification of the Diffusion of Fluids Containing 1H in the Pore System of Rock Cores. JGR Solid Earth 2022, 127, e2021JB023299. [Google Scholar] [CrossRef]
- Tomanek, B.; Jasiński, A.; Sułek, Z.; Muszyńska, J.; Kulinowski, P.; Kwieciński, S.; Krzyzak, A.; Skórka, T.; Kibiński, J. Magnetic Resonance Microscopy of Internal Structure of Drone and Queen Honey Bees. J. Apic. Res. 1996, 35, 3–9. [Google Scholar] [CrossRef]
- Borkowski, K.; Krzyżak, A.T. Assessment of the Systematic Errors Caused by Diffusion Gradient Inhomogeneity in DTI-computer Simulations. NMR Biomed. 2019, 32, e4130. [Google Scholar] [CrossRef]
- Borkowski, K.; Krzyżak, A.T. The Generalized Stejskal-Tanner Equation for Non-Uniform Magnetic Field Gradients. J. Magn. Reson. 2018, 296, 23–28. [Google Scholar] [CrossRef]
- Borkowski, K.; Krzyżak, A.T. Analysis and Correction of Errors in DTI-Based Tractography Due to Diffusion Gradient Inhomogeneity. J. Magn. Reson. 2018, 296, 5–11. [Google Scholar] [CrossRef] [PubMed]
- Ryba, T.; Krňoul, Z. Segmentation of Shoulder MRI Data for Musculoskeletal Model Adaptation. In Proceedings of the 12th International Joint Conference on Biomedical Engineering Systems and Technologies, Prague, Czech Republic, 22–24 February 2019; SCITEPRESS—Science and Technology Publications: Prague, Czech Republic, 2019; pp. 155–160. [Google Scholar]
- Ambellan, F.; Tack, A.; Ehlke, M.; Zachow, S. Automated Segmentation of Knee Bone and Cartilage Combining Statistical Shape Knowledge and Convolutional Neural Networks: Data from the Osteoarthritis Initiative. Med. Image Anal. 2019, 52, 109–118. [Google Scholar] [CrossRef] [PubMed]
- Van der Jeught, S.; Dirckx, J.J.J. Real-Time Structured Light Profilometry: A Review. Opt. Lasers Eng. 2016, 87, 18–31. [Google Scholar] [CrossRef]
- Rogelj, L.; Pavlovčič, U.; Stergar, J.; Jezeršek, M.; Simončič, U.; Milanič, M. Curvature and Height Corrections of Hyperspectral Images Using Built-in 3D Laser Profilometry. Appl. Opt. 2019, 58, 9002. [Google Scholar] [CrossRef] [PubMed]
- Steenwijk, M. Transform a 3D Volume by Using an Affine Transformation Matrix; MATLAB Central File Exchange. Available online: https://www.mathworks.com/matlabcentral/fileexchange/25596-transform-a-3d-volume-by-using-an-affine-transformation-matrix (accessed on 20 May 2022).
- Lighter, D.; Filer, A.; Dehghani, H. Detecting Inflammation in Rheumatoid Arthritis Using Fourier Transform Analysis of Dorsal Optical Transmission Images from a Pilot Study. J. Biomed. Opt. 2019, 24, 1. [Google Scholar] [CrossRef]


Publisher’s Note: MDPI stays neutral with regard to jurisdictional claims in published maps and institutional affiliations. |
© 2022 by the authors. Licensee MDPI, Basel, Switzerland. This article is an open access article distributed under the terms and conditions of the Creative Commons Attribution (CC BY) license (https://creativecommons.org/licenses/by/4.0/).
Share and Cite
Rogelj, L.; Dolenec, R.; Tomšič, M.V.; Laistler, E.; Simončič, U.; Milanič, M.; Hren, R. Anatomically Accurate, High-Resolution Modeling of the Human Index Finger Using In Vivo Magnetic Resonance Imaging. Tomography 2022, 8, 2347-2359. https://doi.org/10.3390/tomography8050196
Rogelj L, Dolenec R, Tomšič MV, Laistler E, Simončič U, Milanič M, Hren R. Anatomically Accurate, High-Resolution Modeling of the Human Index Finger Using In Vivo Magnetic Resonance Imaging. Tomography. 2022; 8(5):2347-2359. https://doi.org/10.3390/tomography8050196
Chicago/Turabian StyleRogelj, Luka, Rok Dolenec, Martina Vivoda Tomšič, Elmar Laistler, Urban Simončič, Matija Milanič, and Rok Hren. 2022. "Anatomically Accurate, High-Resolution Modeling of the Human Index Finger Using In Vivo Magnetic Resonance Imaging" Tomography 8, no. 5: 2347-2359. https://doi.org/10.3390/tomography8050196
APA StyleRogelj, L., Dolenec, R., Tomšič, M. V., Laistler, E., Simončič, U., Milanič, M., & Hren, R. (2022). Anatomically Accurate, High-Resolution Modeling of the Human Index Finger Using In Vivo Magnetic Resonance Imaging. Tomography, 8(5), 2347-2359. https://doi.org/10.3390/tomography8050196