1. Introduction
Ultrasonic contrast imaging is now routinely used in most major radiology and cardiology clinical departments with all premium and most mid-range scanners utilising contrast-specific imaging software [
1]. Guidelines and recommendations for the acquisition and interpretation of contrast-enhanced images to aid lesion detection and diagnosis in radiology and perfusion defects in cardiac applications are widely available [
2,
3,
4,
5]. Ultrasonic contrast-specific imaging modes (CSIM) are designed to detect, enhance and preferentially display the non-linear ultrasound signal generated by contrast microbubbles, while suppressing or cancelling the signals generated by tissue. CSIM techniques can be separated into high and low mechanical index (MI) techniques, where the mechanical index is defined as the quotient of the derated peak negative pressure to the square-root of the centre frequency of the transmitted wave. Detection mechanisms of contrast microbubbles capitalise on the non-linear behaviour of the bubbles when insonated at their resonant frequencies and at non-destructive, low mechanical index values (<0.1). At these low pressures, tissue predominantly exhibits linear scattering. To detect the non-linear contrast signal and suppress the linear tissue signal, a range of multi-pulse ultrasonic insonation regimes have been developed—the most widely implemented are pulse/phase-inversion (PI) techniques [
6], amplitude/power modulation (AM) techniques [
7] or a combination of both techniques known as pulse inversion amplitude modulation (PIAM) [
8]. In high mechanical index techniques (MI > 0.1), one or several short high-pressure pulses are emitted from the transducer to destroy the contrast microbubbles in the scan-plane. The subsequent refilling dynamics of contrast in the scan-plane imaged at lower mechanical index values, utilising techniques described above, and the use of maximum intensity projection algorithms, enables a picture of the vasculature architecture and perfusion-related indices to be investigated. This technique is called destruction-reperfusion or replenishment technique. A more detailed description of these techniques can be found elsewhere [
9]. While ultrasound manufacturers have developed their own specific variations on these techniques and given them proprietary names, there have been limited studies to date that compare contrast-enhancement values on scanners optimised by radiologists for specific applications under a range of flow conditions and imaging-depths. Moreover, this information is of importance since clinical diagnosis is rarely dependent on linearising contrast image sequences and performing quantitative analysis but relies principally upon the clinician’s or sonographer’s visual assessment of the spatial and temporal enhancement pattern of contrast within an organ or vessel. Hence the set-up of the scanner optimised by the clinician is of importance. Consequently, the aim of this study was to measure the echo-enhancement of the DICOM images acquired from four premium ultrasound scanners and transducers using CSIM at different flow rates and depths and utilising two different contrast agents. Although for some scanners, it was possible to access images earlier in the processing path, analysis was performed on DICOM images downloaded from each of the clinical scanners as these are the images which are routinely used to determine the clinical diagnosis. The four scanners and transducers studied were a Philips iU22 L9-3 linear array probe (Philips Ultrasound, Bothell, WA, USA), an Esaote MyLab Twice Vet LA523 linear array probe (Esaote S.p.A, Genova, Italy) a GE Logiq E9 C2-9 curvilinear probe (GE, Boston, MA, USA) and a FujiFilm VisualSonics Vevo 3100 MX250 linear array probe (FujiFilm Visualsonics, Amsterdam, The Netherlands). Two commercially available clinical contrast agents DEFINITY
® (Lantheus Medical Imaging, Inc. N Billerica, MA, USA) and SonoVue (Bracco Imaging SpA, Milan, Italy) were used in the study. Both contrast agents are composed of lipid-encapsulated microbubbles, SonoVue is composed of SF
6 microbubbles with a concentration 5.6 × 10
8 microbubbles/mL and DEFINITY
® is composed of octafluoropropane microbubbles with a concentration of 6.4 × 10
9 microbubbles/mL. SonoVue is most widely used in Europe and China, while DEFINITY
® dominates clinically in the USA.
2. Materials and Methods
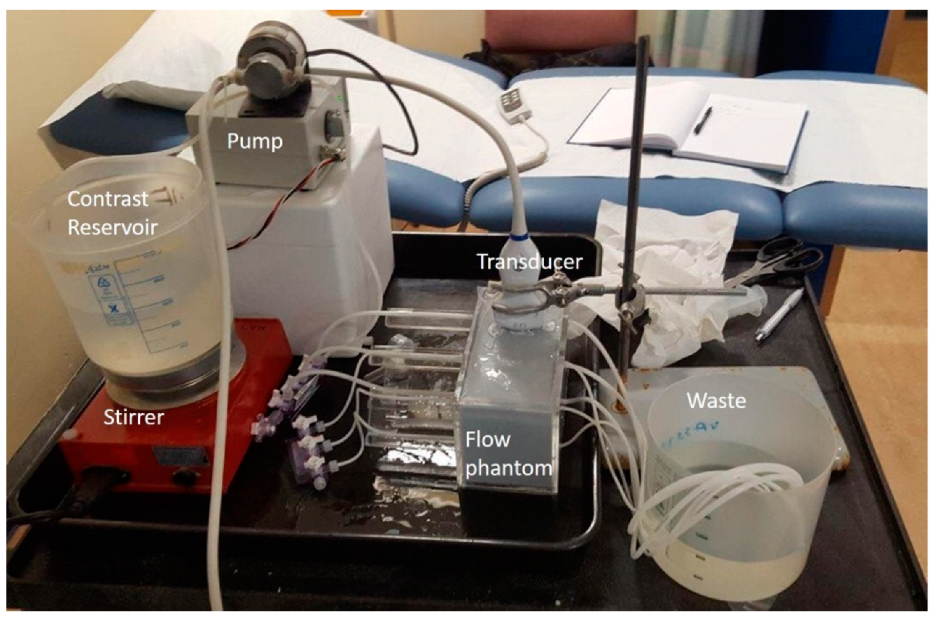
A flow phantom was constructed within a perspex tank (10 × 11 × 20 cm) with 6 C-flex (Sanit-Gobain, Courbevoie, France) tubes suspended horizontally across the tank and threaded through engineered holes in the perspex ends. The inlet tubing was supported external to the Perspex tank on Perspex mouldings of length 10 cm to ensure laminar flow was well established within the section of the tubes that was scanned. To ensure laminar flow was established within the phantom, the minimum inlet length of the tube, L, had to be longer than:
where Re is the Reynolds number and D is the internal diameter of the tube [
10].
The Reynolds number is given by:
where ρ is equal to the density of the water (1000 kg m
−3), µ is the viscosity (1 mPa.s) and v is the velocity in m s
−1. Values for the minimum inlet lengths required are shown in
Table 1. Three tubes were of internal diameter (ID) 1.6 mm and the remaining three of ID 3.2 mm. Tubes of each diameter were centred at depths of 1, 5 and 8 cm from the surface of the tank (0.5, 4.5 and 7.5 cm from the surface of the tissue-mimicking material—TMM) and off-set from each other so that only one pipe was visible in the scanning plane. A system of three-way taps was attached to the end of each of the tubes to enable the contrast solution to be pumped into each of them. Once the tubes were in position, the tank was then filled with an IEC agar-based TMM [
11,
12], to a depth of 0.5 cm below the top of the tank. The TMM was then left to set overnight. The properties of this TMM are well documented by ourselves and others up to frequencies of 60 MHz [
13,
14]. After the TMM was set, TMM maintenance fluid, a combination of glycerol, water and antibacterial fluid (speed of sound 1540 m s
1), was poured onto the top of the phantom [
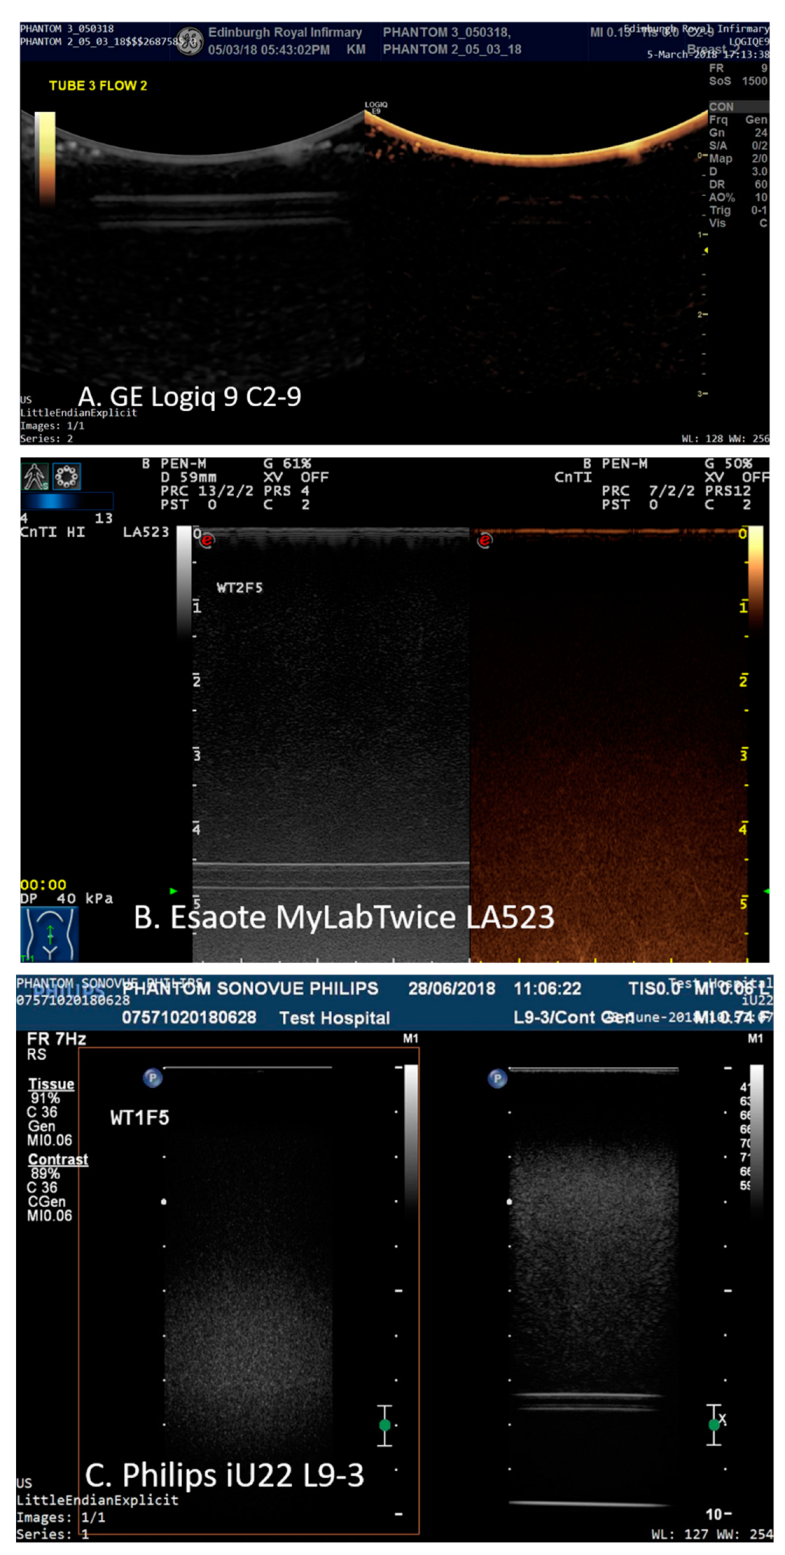
15] and the phantom was covered by cling film to ensure the TMM did not dry out. The experiments described below were undertaken over a period of three months, during which there was no evidence of degradation of the phantom. All scanning experiments were undertaken in clinical radiology departments (GE Logiq E9), in University of Edinburgh veterinary radiology departments (Esaote MyLab Twice) or in biological research facilities (Philips iU22, FujiFilm Visualsonics Vevo 3100) in light levels similar to those used for clinical examinations (
Figure 1).
During the experiments the maintenance fluid was removed from the top of the phantom and the transducers were mounted using a retort stand and clamp so that each tube could be imaged sequentially. The final 0.5 cm of the phantom was filled with water for experiments undertaken with the linear transducers and with gel for the curvilinear probes. Both techniques ensured good acoustical coupling of the transducers with the phantom surface.
A reservoir of degassed water was then pumped sequentially through each of the tubes at two flow settings—0.25 mL s
−1 and 1.5 mL s
−1 using a Micropump suction pump (Micropump, Inc, Vancouver, WA, USA). To determine the mean velocity within each of the pipes the equation of continuity was used such that:
where Q is the flow rate, v is the mean velocity of the fluid and A is the cross-sectional area of the space the fluid is moving through. The mean velocities within each of the tubes are shown in
Table 1.
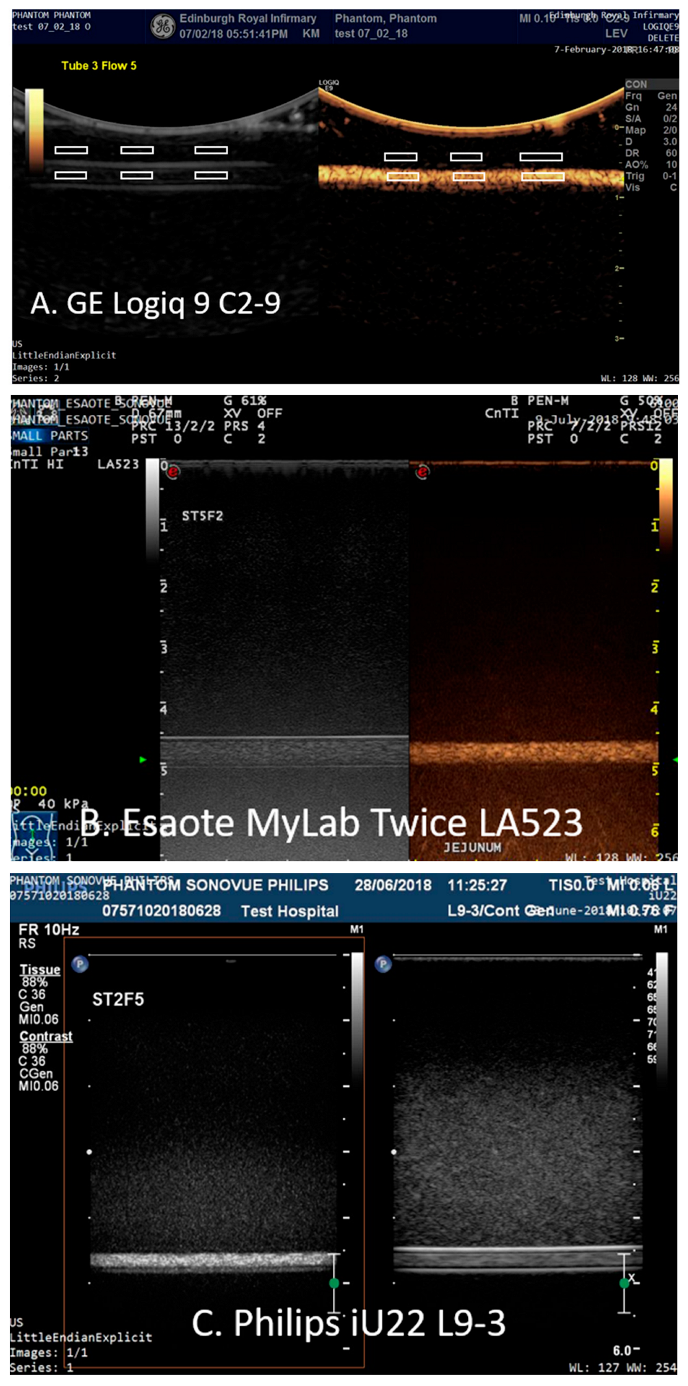
Each scanner was setup in default contrast mode using the same criteria. Acoustic output values were set automatically for all transducers. Depth was adjusted so that each pipe could be visualised in the B-mode scan-plane; the focal point was positioned to below the distal edge of the tube and the gain of the system was adjusted so that the distal edge of the tubing was just visible in the B-mode image when water was circulating through the tube—at almost all depths this resulted in the tube and the TMM not being visible in the contrast-specific imaging mode image (
Figure 2).
Adjustments of other controls on the scanner were left to the discretion of the clinician. A solution of SonoVue or DEFINITY
® was pumped sequentially through each of the tubes at the two flow settings. Three millilitres of freshly activated SonoVue or 0.3 mL of room-temperature DEFINITY
® were diluted in 1 L of deionised water so that there were approximately the same order of magnitude of contrast microbubbles/mL in each solution (
Table 2) (1.68 × 10
6 microbubbles/mL SonoVue and 1.92 × 10
6 DEFINITY
®).
The solution was continuously stirred using a magnetic stirrer. If independent gain settings were available in contrast mode, these were set a mid-range values selected by the clinician. After passing through the phantom, the contrast solution was sent to waste. All tubes within the phantom were scanned in contrast-enhanced mode at all three depths and both flow regimes using 4 transducers: a GE Logiq E9 (C2-9) curvilinear probe, a Philips iU22 L9-3 linear array probe, an Esaote MyLAbTwice linear array LA523 (4–13 MHz) and a Fujifilm VisualSonics Vevo3100 MX250 (21 MHz) probe (
Table 3).
On a separate occasion, the same probes were used again to scan the tubes with the second contrast agent using the identical scanner settings. Images were acquired when contrast enhancement had reached maximum backscatter intensity which was assessed visually by the operator, an experienced radiologist (EQ) with over 15 years’ experience of ultrasonic contrast imaging. Images were downloaded in DICOM (Medical Imaging and Technology Alliance, Arlington, VA, USA) format and subsequently analysed off-line by a medical student (CA).
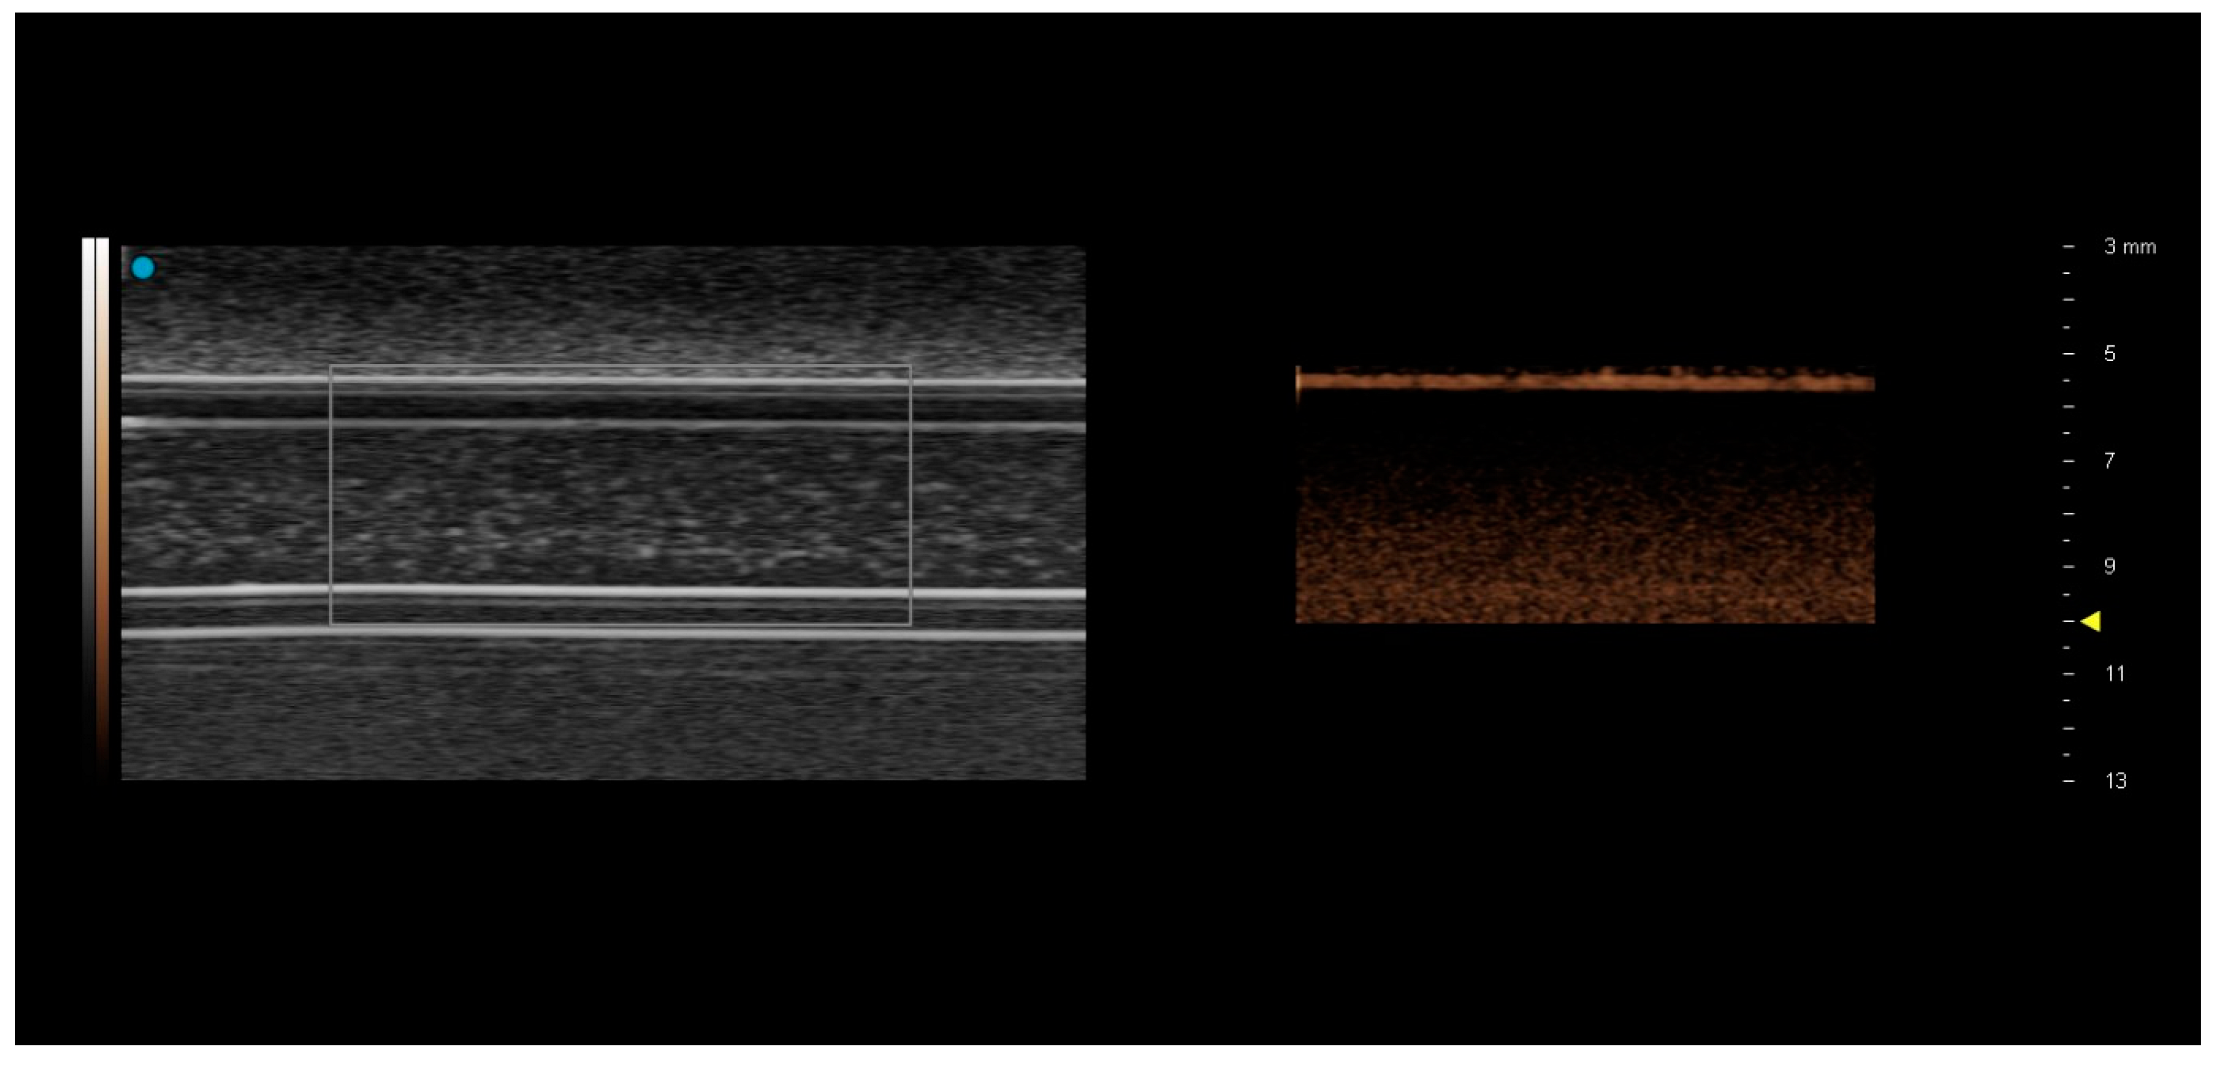
The images were analysed using Analyze 11.0 (Mayo Clinic Rochester, MN, USA) by CA who was not blinded to the study. Six regions-of-interest (ROIs) were placed on the B-mode images: 3 ROIs proximal to the upper edge of the tubing within the TMM and 3 ROIs centred within the tubing (
Figure 3).
The size of the ROIs was chosen so that there were no reverberations from the tubing within any of the ROIs sited within the tubing and ranged in area from a minimum of 252 pixels (1.6 mm ID tube) to 1725 pixels (3.2 mm ID tubes). The 6 ROIs were then copied to the same positions onto the corresponding contrast-enhanced image and mean intensity of the final 12 ROIs were exported to an Excel spread sheet. The mean intensity from the 3 ROIs sited within each of the tubes was calculated in CSIM and B-mode (BM) and the relative enhancement in contrast-specific imaging mode relative to B-mode (CSIM-BM) was expressed in decibels. Statistical differences were determined using a Mann Whitney non-parametric test to perform a pairwise comparison between the values of CSIM-BM for both contrast agents, tube diameters, depth and flow rates. Significance was set at the 5% level.
4. Discussion
Despite many of the clinical applications of ultrasonic contrast agents being off-label, the clinical utility of ultrasonic contrast agents is well documented in the literature and in European and world guidelines [
2]. Low-transmit-power insonation at the resonant frequency of the microbubbles produces non-linear microbubble oscillation resulting in the generation of harmonic frequencies. These harmonic frequencies allow clinical users to distinguish the microbubble signal from native tissue clutter by using specialised contrast-specific ultrasound imaging modes. For these reasons, only US systems equipped with non-linear imaging modes designed for contrast imaging should be used in clinical practice.
From a clinical perspective, contrast-specific imaging modes allow an enhanced differentiation between native tissue and pathologic findings predominantly based on the visual interpretation of the temporal and spatial contrast enhancement provided by microbubble agents. The best contrast resolution is obtained when native tissue does not produce any signal and the only signal displayed by the ultrasound scanners is from the microbubbles. Since many of the clinical ultrasound scanners are very efficient at removing the native tissue signal, in this study it was not possible to use the enhancement from the proximal regions-of-interest within the tissue-mimicking material to normalise the results between scanners as these values tended to zero. In addition, the non-linearity of tissue-mimicking materials has recently been documented and is significantly higher than most soft tissues [
16], so results obtained would not be typical of clinical contrast to native tissue ratios observed in diagnostic scanning. For these reasons, we developed the CSIM-BM ratio to determine the sensitivity of contrast-specific imaging modes with reference to the enhancement observed in B-mode imaging at a range of depths and flow rates.
However, although there are many studies reporting comparisons in echogenicity and application of commercial and in-house contrast agents [
1,
17,
18,
19], there are relatively few studies which compare the sensitivity of scanner-specific CSIM of the commercially available contrast agents. The aim of this study was to compare the sensitivity of CSIM from 3 premium clinical, and one preclinical ultrasound scanner under a range of flow conditions typically experienced within humans and small animals. All scanners utilise proprietary techniques for CSIM. The Philips iU22 scanner utilises phase-inversion techniques in its CSIM with MI values in this study remaining at 0.06 for scanning at all depths. The GE Logiq E9 also utilises phase-inversion techniques to isolate the contrast signal. MI values varied with depth, with an MI of 0.13 for imaging the pipes centred at 1 cm depth, 0.16 for imaging the pipes centred at 5 cm and 0.09 for imaging the pipes centred at 8 cm. Esaote MyLab Twice utilises second harmonic imaging and, although no MI values were displayed, the derated pressure was 40 kPa (corresponding to maximum MI values of 0.01 and 0.03, over the 2–9 MHz bandwidth of the transducer). The Vevo3100 preclinical ultrasound scanner uses amplitude modulation CSIM to isolate the microbubble signal. Power output is defined as 10%, although the magnitudes of acoustic output pressures for the MX250 probe are not publicly available. However, since the MI values are inversely proportional to the square-root of the transmitted frequency, peak negative acoustic pressures up to 0.46 MPa, transmitted at 21 MHz, will still result in MI values less than 0.1. The lack of visualisation of contrast in the tubes in CSIM at the higher frequencies utilised by the Visualsonics FujiFilm MX250 probe is not surprising, and most likely due to a combination of the high attenuation of the C-flex tubing [
20] at the transmit frequency of the probe (21 MHz) and that the resonance frequency of the main population of bubbles within both DEFINITY
® and SonoVue is significantly removed from this frequency [
18,
21,
22]. Nevertheless, both SonoVue and DEFINITY
® were visualised in B-mode and, as such, they have potential application within the high-frequency preclinical imaging laboratory for confirmation of injection sites during ultrasound-guided injections [
23].
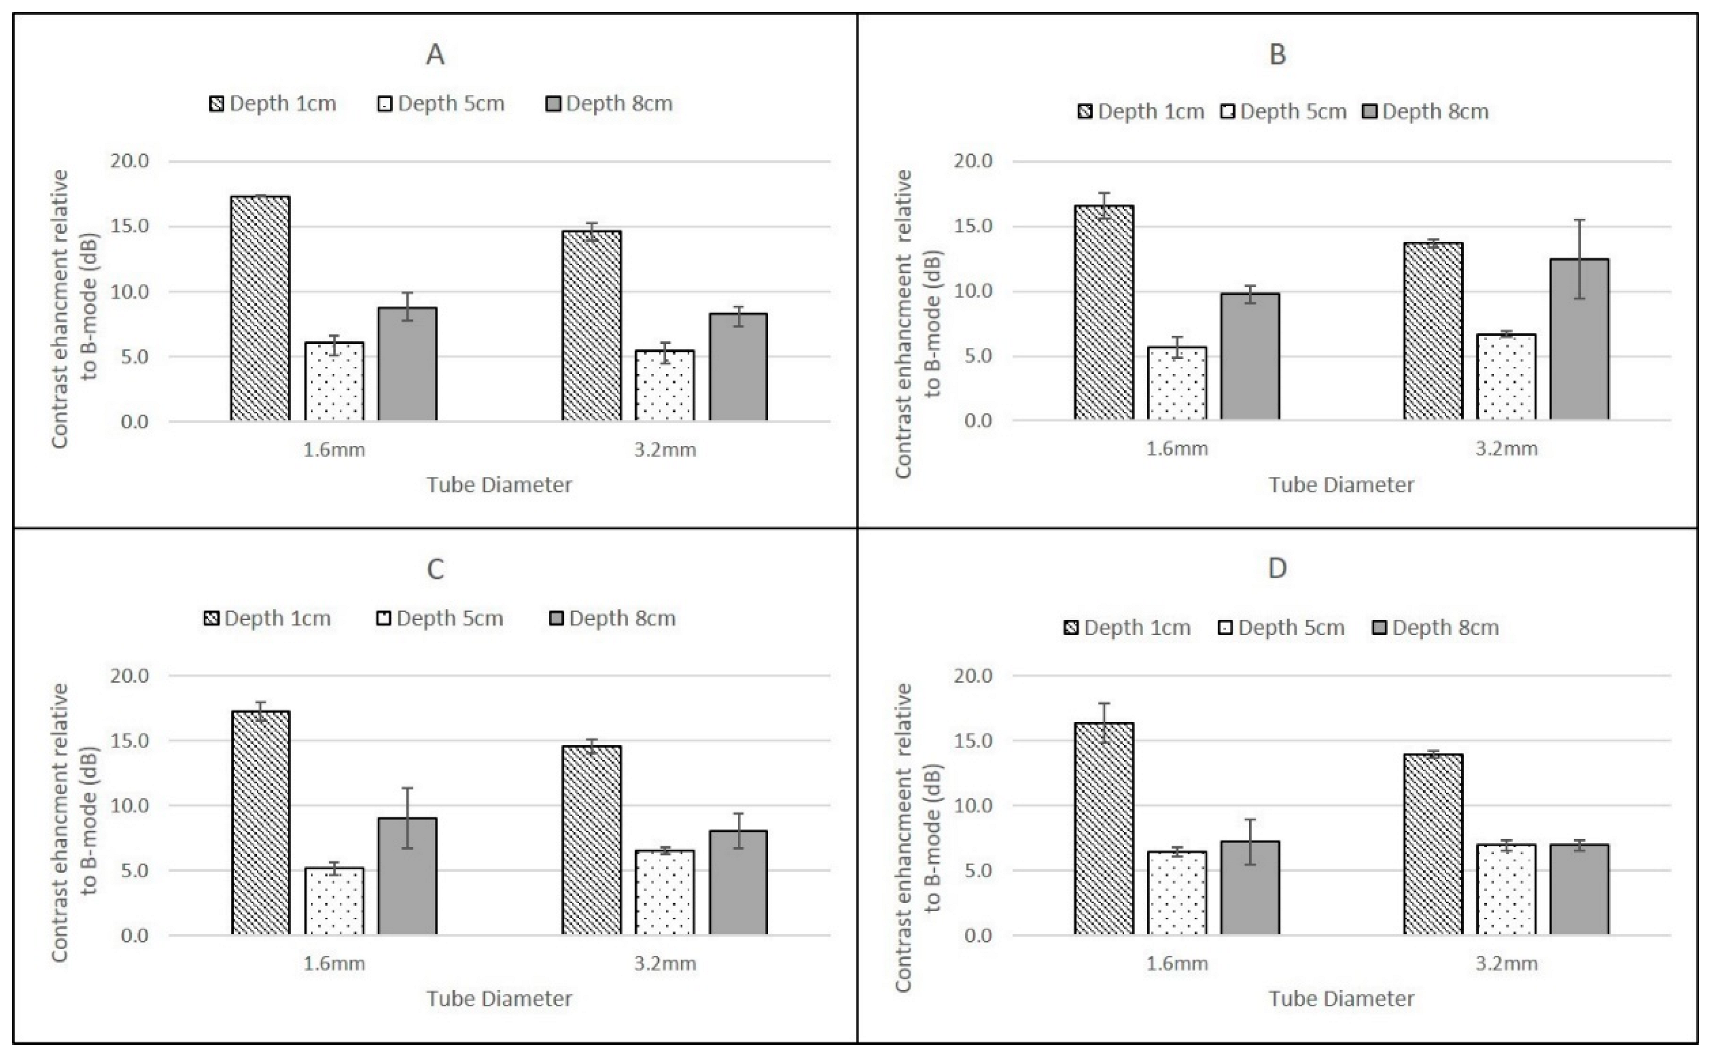
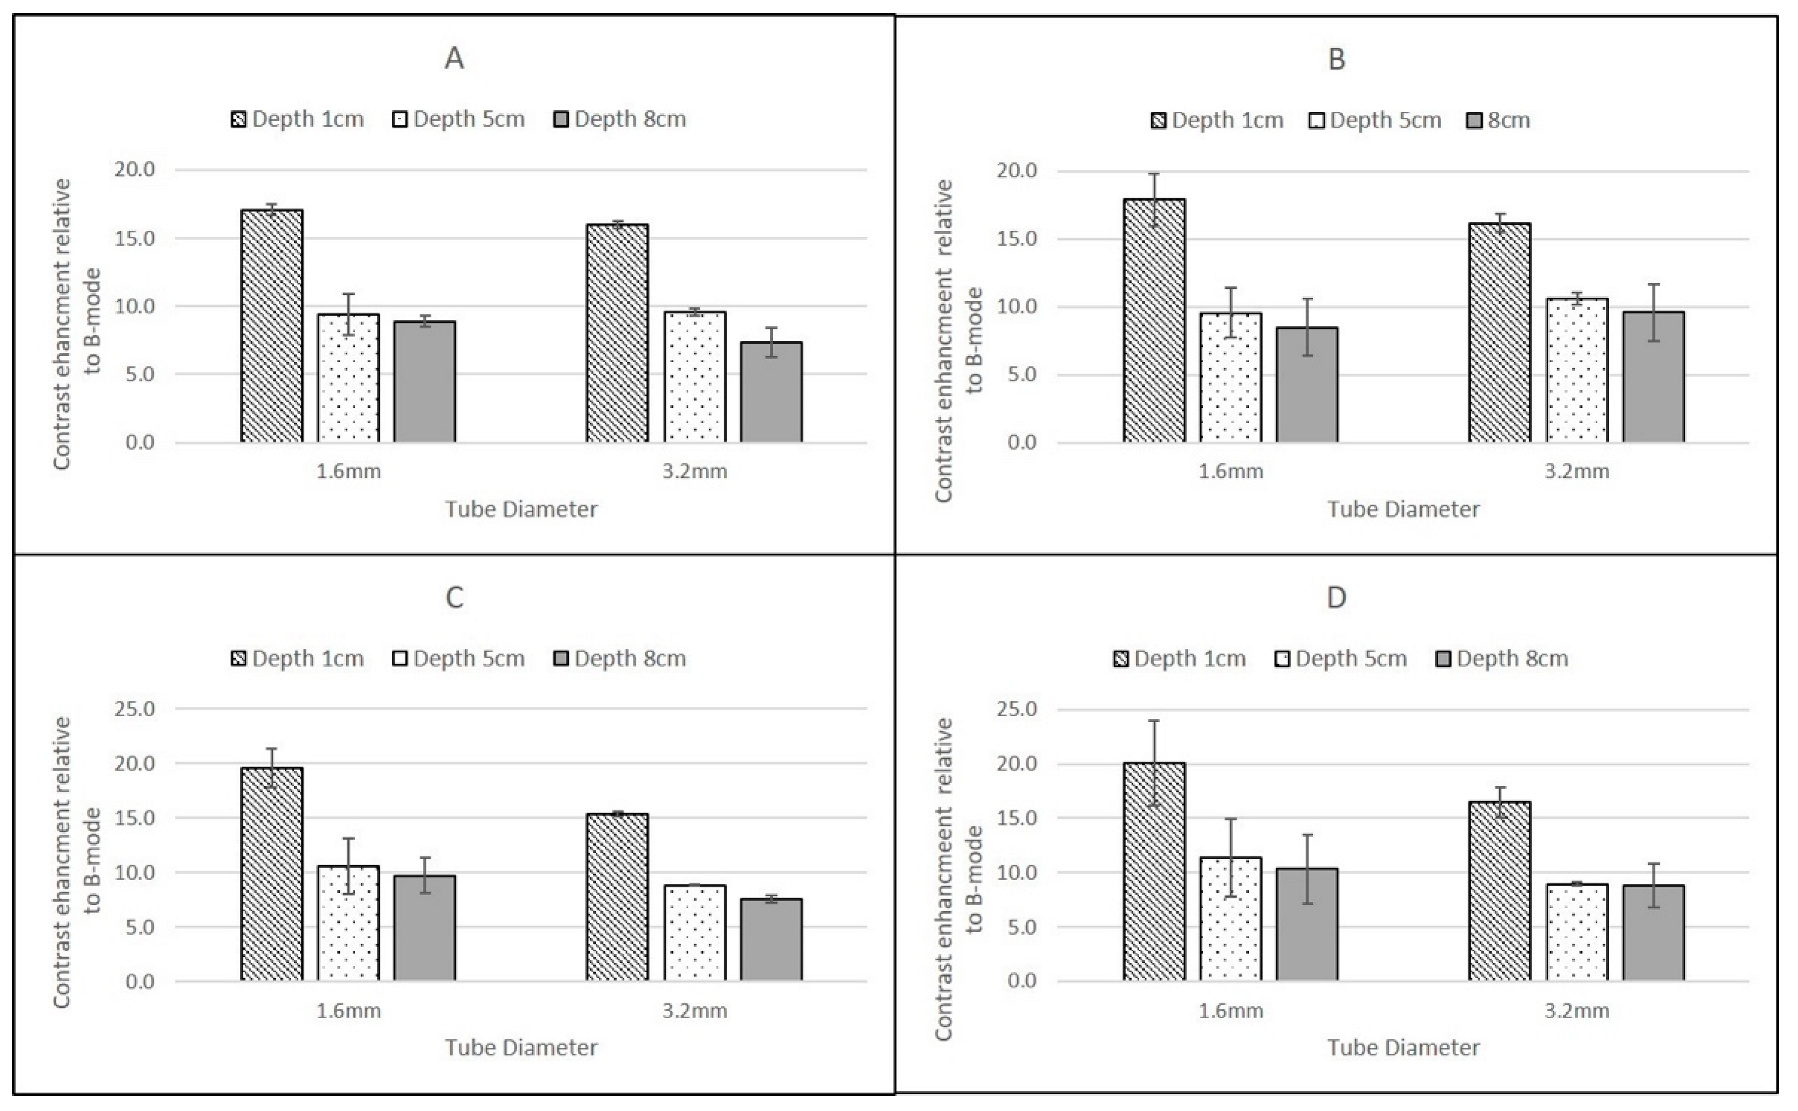
In the 1.6 mm internal diameter tube, at the low flow setting of 0.25 cm3/s, the contrast solution had a mean velocity of 12.44 cm/s, while at the higher flow setting (1. 5 cm3/s) this corresponded to a mean velocity of 74.6 cm/s. In the larger ID tube, these velocities were 3.11 cm/s and 18.66 cm/s respectively. These ranges of velocities are typical of those experienced clinically in a range of vessels, from larger elastic arteries to smaller arteries and veins. For both contrast agents, and all scanners, the magnitude of the CSIM-BM ratio was independent of flow rate within the phantom, highlighting the sensitivity of all the CSIMs to the wide range of flow conditions and velocities within the body.
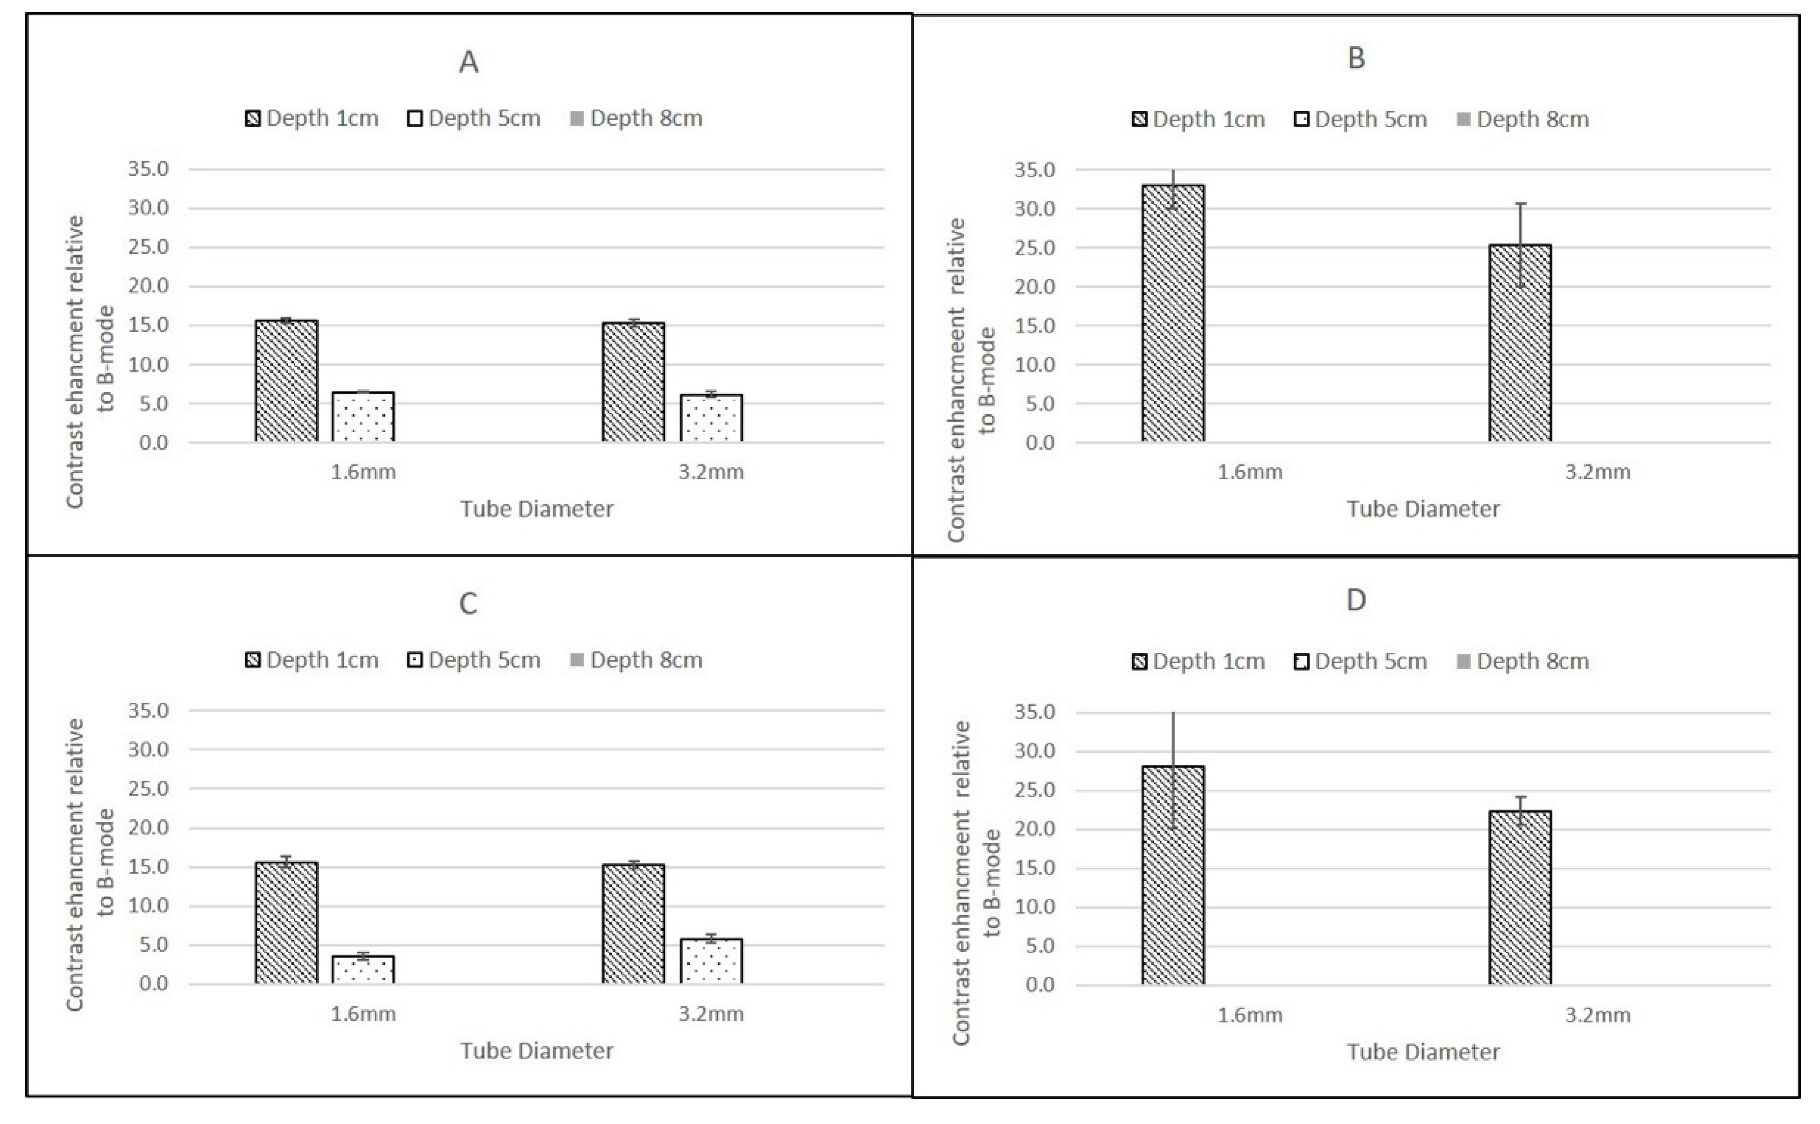
The highest CSIM-BM ratios were observed at superficial depths for all scanners, flow rates and contrast agents and for SonoVue these values ranged from 19.61 ± 1.75 dB (GE Logiq 9 C2-9, 1.6 mm tube) to 14.59 ± 0.52 dB (Philips iU22 L9-3, 3.2 mm tube). For DEFINITY®, although the values for the Philips and GE Logiq 9 CSIM-BM ratios were similar to those obtained from SonoVue, the Esaote MyLab Twice CSIM-BM ratios for DEFINITY® were significantly greater, resulting in a range of CSIM-BM ratios from 33.09 ± 2.9 dB (Esaote MyLab Twice LA523, 1.6 mm tube) to 13.68 ± 0.32 dB (Philips L9-3 3.2 mm tube). At 8 cm depth, although the tubing could be visualised, no contrast-enhancement was observed in B-mode or CSIM for either agent using the Esaote MyLab Twice LA523 probe, suggesting that the ultrasound beam was too strongly attenuated at the high centre frequency of the probe. Indeed, as this probe is designed for small animal veterinary applications, there is limited clinical requirement for imaging beyond 6 cm depth. For all probes, both agents and both flow settings, for tubes centred at 1 cm depth there was a reduction of CSIM-BM ratios within the larger ID tubes compared to the narrower ID tubes, despite both tubes having identical tube-wall thicknesses of 0.8 mm. This is likely due to attenuation and shadowing caused by contrast enhancement within the proximal layers in the larger ROI within the 3.2 mm tubes, reducing the overall mean enhancement measured compared to the smaller ROIs within the smaller ID tubes. With increasing reduction in beam intensity caused by attenuation of the ultrasound beam as it travelled through the TMM to deeper pipes, this difference between CSIM-BM ratios between pipe diameters was no longer evident. Both the GE Logiq E9 C2-9 probe and the Philips iU22 L9-3 probe gave very similar CSIM-BM ratios at 1 cm and 8 cm depths for both flow rates, contrast agents and tube diameters. At 5 cm depth, for both contrast agents the Philips iU22 L9-3 CSIM-BM ratios were significantly lower than those obtained at 1 cm and 8 cm and lower in magnitude than those obtained by the GE Logiq E9 C2-9 probe. The reasons for this are not clear, but may be due to the positioning of the focus during the Philips measurements. Although the focal region was centred below the distal edge of the tube at 5 cm, the focal range extended into the distal regions of the tube. Since pulse-inversion techniques are dependent on low MI values, the acoustic pressure within the focal region may have been sufficiently high to destroy the contrast in the distal region of the tube reducing the magnitude of the overall CSIM values.
The overall similarity in CSIM-BM ratios from the Philips and GE probes is likely due to both scanners utilising phase-inversion techniques as their CSIM. Hyvelin et al. (2016) compared the contrast enhancement obtained from SonoVue, DEFINITY® and Optison using two premium ultrasound scanners (GE Logiq E9 and Toshiba Aplio 500) in in vitro studies and found that the properties of DEFINITY® and SonoVue were broadly similar with both superior to Optison. The results obtained in this study from the Philips iU22 and Logiq E9 transducers are consistent with these results demonstrating broadly similar CSIM-BM ratios for both agents at two flow rates and at 1 cm and 8 cm imaging depths. In addition, SonoVue values, obtained using the Esaote scanner at proximal depths are similar to values obtained from the iU22 and Logiq E9 scanner. Although the differences between SonoVue and DEFINITY® using the Esoate scanner are surprising, without more detailed insight into the contrast-specific imaging mode utilised within the scanner it is difficult to determine if these differences are due to specific contrast-agent properties or the CSIM that is utilised within the Esaote scanner.
This study was performed using a range of transducers which were available to the user and also using a flow phantom which generated relatively fast flow rates, typical of those observed in arteries and significantly faster than those observed within capillaries. Future studies will utilise a pump which can generate lower velocities enabling an assessment of the contrast imaging capability of these scanners for capillary-like flow, rather than large vessel flow described in this study. Including tubes at greater and shallower depths will further test the range over which the curvilinear probes and the high-frequency preclinical scanner probes can be tested. In addition, manufacturing wall-less vessels would remove the high intensity echoes generated from the C-flex tubing embedded within the tissue-mimicking material.


