
Image Quality and Radiation Dose of Contrast-Enhanced Chest-CT Acquired on a Clinical Photon-Counting Detector CT vs. Second-Generation Dual-Source CT in an Oncologic Cohort: Preliminary Results

 , , ,
, , ,
Abstract
:1. Introduction
2. Materials and Methods
2.1. Subjects
2.2. Dual-Source Chest-CT
2.3. Photon-Counting Detector Chest-CT
2.4. Radiation Dose Quantification
2.5. Image Quality Quantification
2.6. Subjective Image Quality
2.7. Statistical Analysis
3. Results
3.1. Patient Characteristics
3.2. Radiation Dose Quantification
3.3. Image Quality Quantification
3.4. Subjective Image Quality
4. Discussion
5. Conclusions
Author Contributions
Funding
Institutional Review Board Statement
Informed Consent Statement
Data Availability Statement
Conflicts of Interest
Abbreviation
| CNR | Contrast-to-Noise Ratio |
| DSCT | Dual-Source CT |
| PCD-CT | Photon-Counting Detector CT |
| SNR | Signal-to-Noise Ratio |
| SSDE | Size-Specific Dose Estimation |
References
- Kalra, M.K.; Maher, M.M.; Toth, T.L.; Hamberg, L.M.; Blake, M.A.; Shepard, J.-A.; Saini, S. Strategies for CT radiation dose optimization. Radiology 2004, 230, 619–628. [Google Scholar] [CrossRef] [PubMed]
- McCollough, C.H.; Bruesewitz, M.R.; Kofler, J.M. CT dose reduction and dose management tools: Overview of available options. Radiographics 2006, 26, 503–512. [Google Scholar] [CrossRef] [PubMed] [Green Version]
- Huda, W.; Scalzetti, E.M.; Levin, G. Technique factors and image quality as functions of patient weight at abdominal CT. Radiology 2000, 217, 430–435. [Google Scholar] [CrossRef] [PubMed]
- Food and Drug Administration. FDA public health notification: Reducing radiation risk from computed tomography for pediatric and small adult patients. Pediatr. Radiol. 2002, 32, 314–316. [Google Scholar]
- Papadakis, A.E.; Perisinakis, K.; Damilakis, J. Angular on-line tube current modulation in multidetector CT examinations of children and adults: The influence of different scanning parameters on dose reduction. Med. Phys. 2007, 34, 2864–2874. [Google Scholar] [CrossRef]
- Higashigaito, K.; Euler, A.; Eberhard, M.; Flohr, T.G.; Schmidt, B.; Alkadhi, H. Contrast-Enhanced Abdominal CT with Clinical Photon-Counting Detector CT: Assessment of Image Quality and Comparison with Energy-Integrating Detector CT. Acad. Radiol. 2022, 29, 689–697. [Google Scholar] [CrossRef]
- Rajendran, K.; Petersilka, M.; Henning, A.; Shanblatt, E.R.; Schmidt, B.; Flohr, T.G.; Ferrero, A.; Baffour, F.; Diehn, F.E.; Yu, L.; et al. First Clinical Photon-counting Detector CT System: Technical Evaluation. Radiology 2022, 303, 130–138. [Google Scholar] [CrossRef]
- Hsieh, S.S.; Leng, S.; Rajendran, K.; Tao, S.; McCollough, C.H. Photon Counting CT: Clinical Applications and Future Developments. IEEE Trans. Radiat. Plasma Med. Sci. 2021, 5, 441–452. [Google Scholar] [CrossRef]
- Wichmann, J.L.; Hardie, A.D.; Schoepf, U.J.; Felmly, L.M.; Perry, J.D.; Varga-Szemes, A.; Mangold, S.; Caruso, D.; Canstein, C.; Vogl, T.J.; et al. Single- and dual-energy CT of the abdomen: Comparison of radiation dose and image quality of 2nd and 3rd generation dual-source CT. Eur. Radiol. 2017, 27, 642–650. [Google Scholar] [CrossRef]
- Tabatabaei SM, H.; Talari, H.; Gholamrezanezhad, A.; Farhood, B.; Rahimi, H.; Razzaghi, R.; Mehri, N.; Rajebi, H. A low-dose chest CT protocol for the diagnosis of COVID-19 pneumonia: A prospective study. Emerg. Radiol. 2020, 27, 607–615. [Google Scholar] [CrossRef]
- Kubo, T.; Lin, P.-J.P.; Stiller, W.; Takahashi, M.; Kauczor, H.-U.; Ohno, Y.; Hatabu, H. Radiation dose reduction in chest CT: A review. AJR Am. J. Roentgenol. 2008, 190, 335–343. [Google Scholar] [CrossRef] [PubMed]
- Yu, L.; Bruesewitz, M.R.; Thomas, K.B.; Fletcher, J.G.; Kofler, J.M.; McCollough, C.H. Optimal tube potential for radiation dose reduction in pediatric CT: Principles, clinical implementations, and pitfalls. Radiographics 2011, 31, 835–848. [Google Scholar] [CrossRef] [PubMed]
- Baek, J.; Pineda, A.R.; Pelc, N.J. To bin or not to bin? The effect of CT system limiting resolution on noise and detectability. Phys. Med. Biol. 2013, 58, 1433–1446. [Google Scholar] [CrossRef] [PubMed]
- Si-Mohamed, S.A.; Greffier, J.; Miailhes, J.; Boccalini, S.; Rodesch, P.A.; Vuillod, A.; van der Werf, N.; Dabli, D.; Racine, D.; Rotzinger, D.; et al. Comparison of image quality between spectral photon-counting CT and dual-layer CT for the evaluation of lung nodules: A phantom study. Eur. Radiol. 2022, 32, 524–532. [Google Scholar] [CrossRef]
- Euler, A.; Higashigaito, K.; Mergen, V.; Sartoretti, T.; Zanini, B.; Schmidt, B.; Flohr, T.G.; Ulzheimer, S.; Eberhard, M.; Alkadhi, H.; et al. High-Pitch Photon-Counting Detector Computed Tomography Angiography of the Aorta: Intraindividual Comparison to Energy-Integrating Detector Computed Tomography at Equal Radiation Dose. Investig. Radiol. 2022, 57, 115–121. [Google Scholar] [CrossRef]
- Christner, J.A.; Braun, N.N.; Jacobsen, M.C.; Carter, R.E.; Kofler, J.M.; McCollough, C.H. Size-specific dose estimates for adult patients at CT of the torso. Radiology 2012, 265, 841–847. [Google Scholar] [CrossRef]
- Tugwell-Allsup, J.; Owen, B.W.; England, A. Low-dose chest CT and the impact on nodule visibility. Radiography 2021, 27, 24–30. [Google Scholar] [CrossRef]
- Tækker, M.; Kristjánsdóttir, B.; Graumann, O.; Laursen, C.B.; Pietersen, P.I. Diagnostic accuracy of low-dose and ultra-low-dose CT in detection of chest pathology: A systematic review. Clin. Imaging 2021, 74, 139–148. [Google Scholar] [CrossRef]
- Ludes, C.; Schaal, M.; Labani, A.; Jeung, M.-Y.; Roy, C.; Ohana, M. Scanner thoracique ultra-basse dose la mort de la radiographie thoracique? Presse Med. 2016, 45, 291–301. [Google Scholar] [CrossRef]
- Schmidt, B.; Flohr, T. Principles and applications of dual source CT. Phys. Med. 2020, 79, 36–46. [Google Scholar] [CrossRef]
- Willemink, M.J.; Persson, M.; Pourmorteza, A.; Pelc, N.J.; Fleischmann, D. Photon-counting CT: Technical Principles and Clinical Prospects. Radiology 2018, 289, 293–312. [Google Scholar] [CrossRef] [PubMed]
- Flohr, T.; Petersilka, M.; Henning, A.; Ulzheimer, S.; Ferda, J.; Schmidt, B. Photon-counting CT review. Phys. Med. 2020, 79, 126–136. [Google Scholar] [CrossRef] [PubMed]
- Voelker, R. Advanced CT Technology Counts Photons to Produce Sharper Images. JAMA 2020, 326, 1667. [Google Scholar] [CrossRef] [PubMed]
- Leng, S.; Bruesewitz, M.; Tao, S.; Rajendran, K.; Halaweish, A.F.; Campeau, N.G.; Fletcher, J.G.; McCollough, C.H. Photon-counting Detector CT: System Design and Clinical Applications of an Emerging Technology. Radiographics 2019, 39, 729–743. [Google Scholar] [CrossRef]
- Kappler, S.; Hannemann, T.; Kraft, E.; Kreisler, B.; Niederloehner, D.; Stierstorfer, K.; Flohr, T. First results from a hybrid prototype CT scanner for exploring benefits of quantum-counting in clinical CT. In Medical Imaging 2012: Physics of Medical Imaging; 83130X; Pelc, N.J., Nishikawa, R.M., Whiting, B.R., Eds.; SPIE: New York, NY, USA, 2012. [Google Scholar]
- Symons, R.; Reich, D.S.; Bagheri, M.; Cork, T.E.; Krauss, B.; Ulzheimer, S.; Kappler, S.; Bluemke, D.A.; Pourmorteza, A. Photon-counting CT for vascular imaging of the head and neck: First in vivo human results. Investig. Radiol. 2018, 53, 135–142. [Google Scholar] [CrossRef]
- Symons, R.; Pourmorteza, A.; Sandfort, V.; Ahlman, M.A.; Cropper, T.; Mallek, M.; Kappler, S.; Ulzheimer, S.; Mahesh, M.; Jones, E.C.; et al. Feasibility of Dose-reduced Chest CT with Photon-counting Detectors: Initial Results in Humans. Radiology 2017, 285, 980–989. [Google Scholar] [CrossRef] [Green Version]

| Oncological Diseases | Absolute Value (Relative Value in %) |
|---|---|
| NSCLC/SCLC | 12 (12%)/7 (7%) |
| Colorectal carcinoma | 17 (17%) |
| Gastrooesophageal carcinoma | 15 (15%) |
| Pancreatic carcinoma | 10 (10%) |
| Hepatobiliary cancer | 8 (8%) |
| Lymphoma | 7 (7%) |
| Others (ovarian carcinoma, thymic carcinoma, etc.) | 24 (24%) |
| PCD-CT (Mean ± SD) | DSCT (Mean ± SD) | p-Value | |
|---|---|---|---|
| Age (in [y]) | 65.02 ± 11.38 | 64.65 ± 11.14 | <0.001 * |
| Weight (in [kg]) | 72.34 ± 14.71 | 72.26 ± 14.85 | 0.142 * |
| Height (in [m]) | 1.72 ± 0.084 | 1.72 ± 0.086 | 0.620 * |
| BMI (in []) | 24.43 ± 4.43 | 24.45 ± 4.53 | 0.304 * |
| Transverse diameter (in [cm]) | 34.67 ± 3.98 | 34.91 ± 4.17 | 0.141 ** |
| DSCT | PCD-CT | p-Value | Corrected p-Value | ||
|---|---|---|---|---|---|
| ADMIRE 1 | Q1 | Q3 | |||
| ROIascending_thoracic_aorta (Median ± SD) | 192.40 ± 42.28 | 282.05 ± 47.62 | 280.30 ± 45.34 | <0.001 | ** < 0.001 (Q3/DSCT) ** < 0.001 (Q1/DSCT) |
| ROIdescending_thoracic_aorta (Median ± SD) | 182.90 ± 44.57 | 274.10 ± 45.85 | 273.90 ± 46.27 | <0.001 | ** < 0.001 (Q3/DSCT) ** < 0.001 (Q1/DSCT) |
| ROIpulmonary_trunk (Median ± SD) | 208.25 ± 54.88 | 295.25 ± 77.71 | 294.65 ± 81.91 | <0.001 | ** < 0.001 (Q3/DSCT) ** < 0.001 (Q1/DSCT) |
| ROIlung_parenchyma (Median ± SD) | −888.65 ± 29.22 | −888.65 ± 30.95 | −891.60 ± 31.25 | 0.403 | |
| ROIpectoralis_muscle (Median ± SD) | 63.60 ± 11.62 | 57.25 ± 8.00 | 57.10 ± 7.55 | 0.002 | ** 0.011 (Q3/DSCT) ** 0.010 (Q1/DSCT) |
| ROIsubcutaneous_fat (Median ± SD) | −96.65 ± 34.73 | −108.25 ± 18.47 | −108.55 ± 18.67 | <0.001 | ** < 0.001 (Q3/DSCT) ** < 0.001 (Q1/DSCT) |
| SNRascending_thoracic_aorta (Mean ± SD) | 21.67 ± 5.98 | 19.44 ± 4.38 | 24.86 ± 5.36 | <0.001 * | ** Q3 > DSCT > Q1 (p < 0.001) |
| SNRdescending_thoracic_aorta (Median ± SD) | 19.79 ± 6.77 | 19.01 ± 4.60 | 25.87 ± 6.35 | <0.001 * | ** 0.002 (Q3/DSCT) ** < 0.001 (Q1/DSCT) |
| SNRpulmonary_artery (Median ± SD) | 20.81 ± 7.38 | 19.17 ± 5.38 | 25.45 ± 6.96 | <0.001 * | ** Q3 > DSCT > Q1 (p < 0.001) |
| SNRchest_muscle (Median ± SD) | 5.62 ± 1.89 | 4.66 ± 3.57 | 6.02 ± 1.65 | <0.001 * | ** Q3 > DSCT > Q1 (p < 0.001) |
| SNRtracheal_air (Median ± SD) | −110.72 ± 40.31 | −70.73 ± 25.48 | −84.14 ± 32.28 | <0.001 * | ** Q3 > DSCT > Q1 (p < 0.001) |
| SNRsubcutaneous_fat (Mean ± SD) | −8.30 ± 3.73 | −8.31 ± 2.52 | −10.59 ± 3.36 | <0.001 * | ** Q3 > DSCT > Q1 (p < 0.001) |
| SNRlung_parenchyma (Median ± SD) | −78.61 ± 24.46 | −70.21 ± 20.51 | −85.15 ± 26.63 | <0.001 | ** < 0.001 (Q1/DSCT) ** < 0.001 (Q3/DSCT) |
| CNRvessel (Median ± SD) | 11.98 ± 5.58 | 18.02 ± 6.36 | 22.48 ± 8.07 | <0.001 * | ** Q3 > Q1 > DSCT (p < 0.001) |
| CNRlung_parenchyma (Median ± SD) | −85.08 ± 22.61 | −75.00 ± 16.68 | −93.90 ± 26.44 | <0.001 * | ** Q3 > DSCT > Q1 (p < 0.001) |
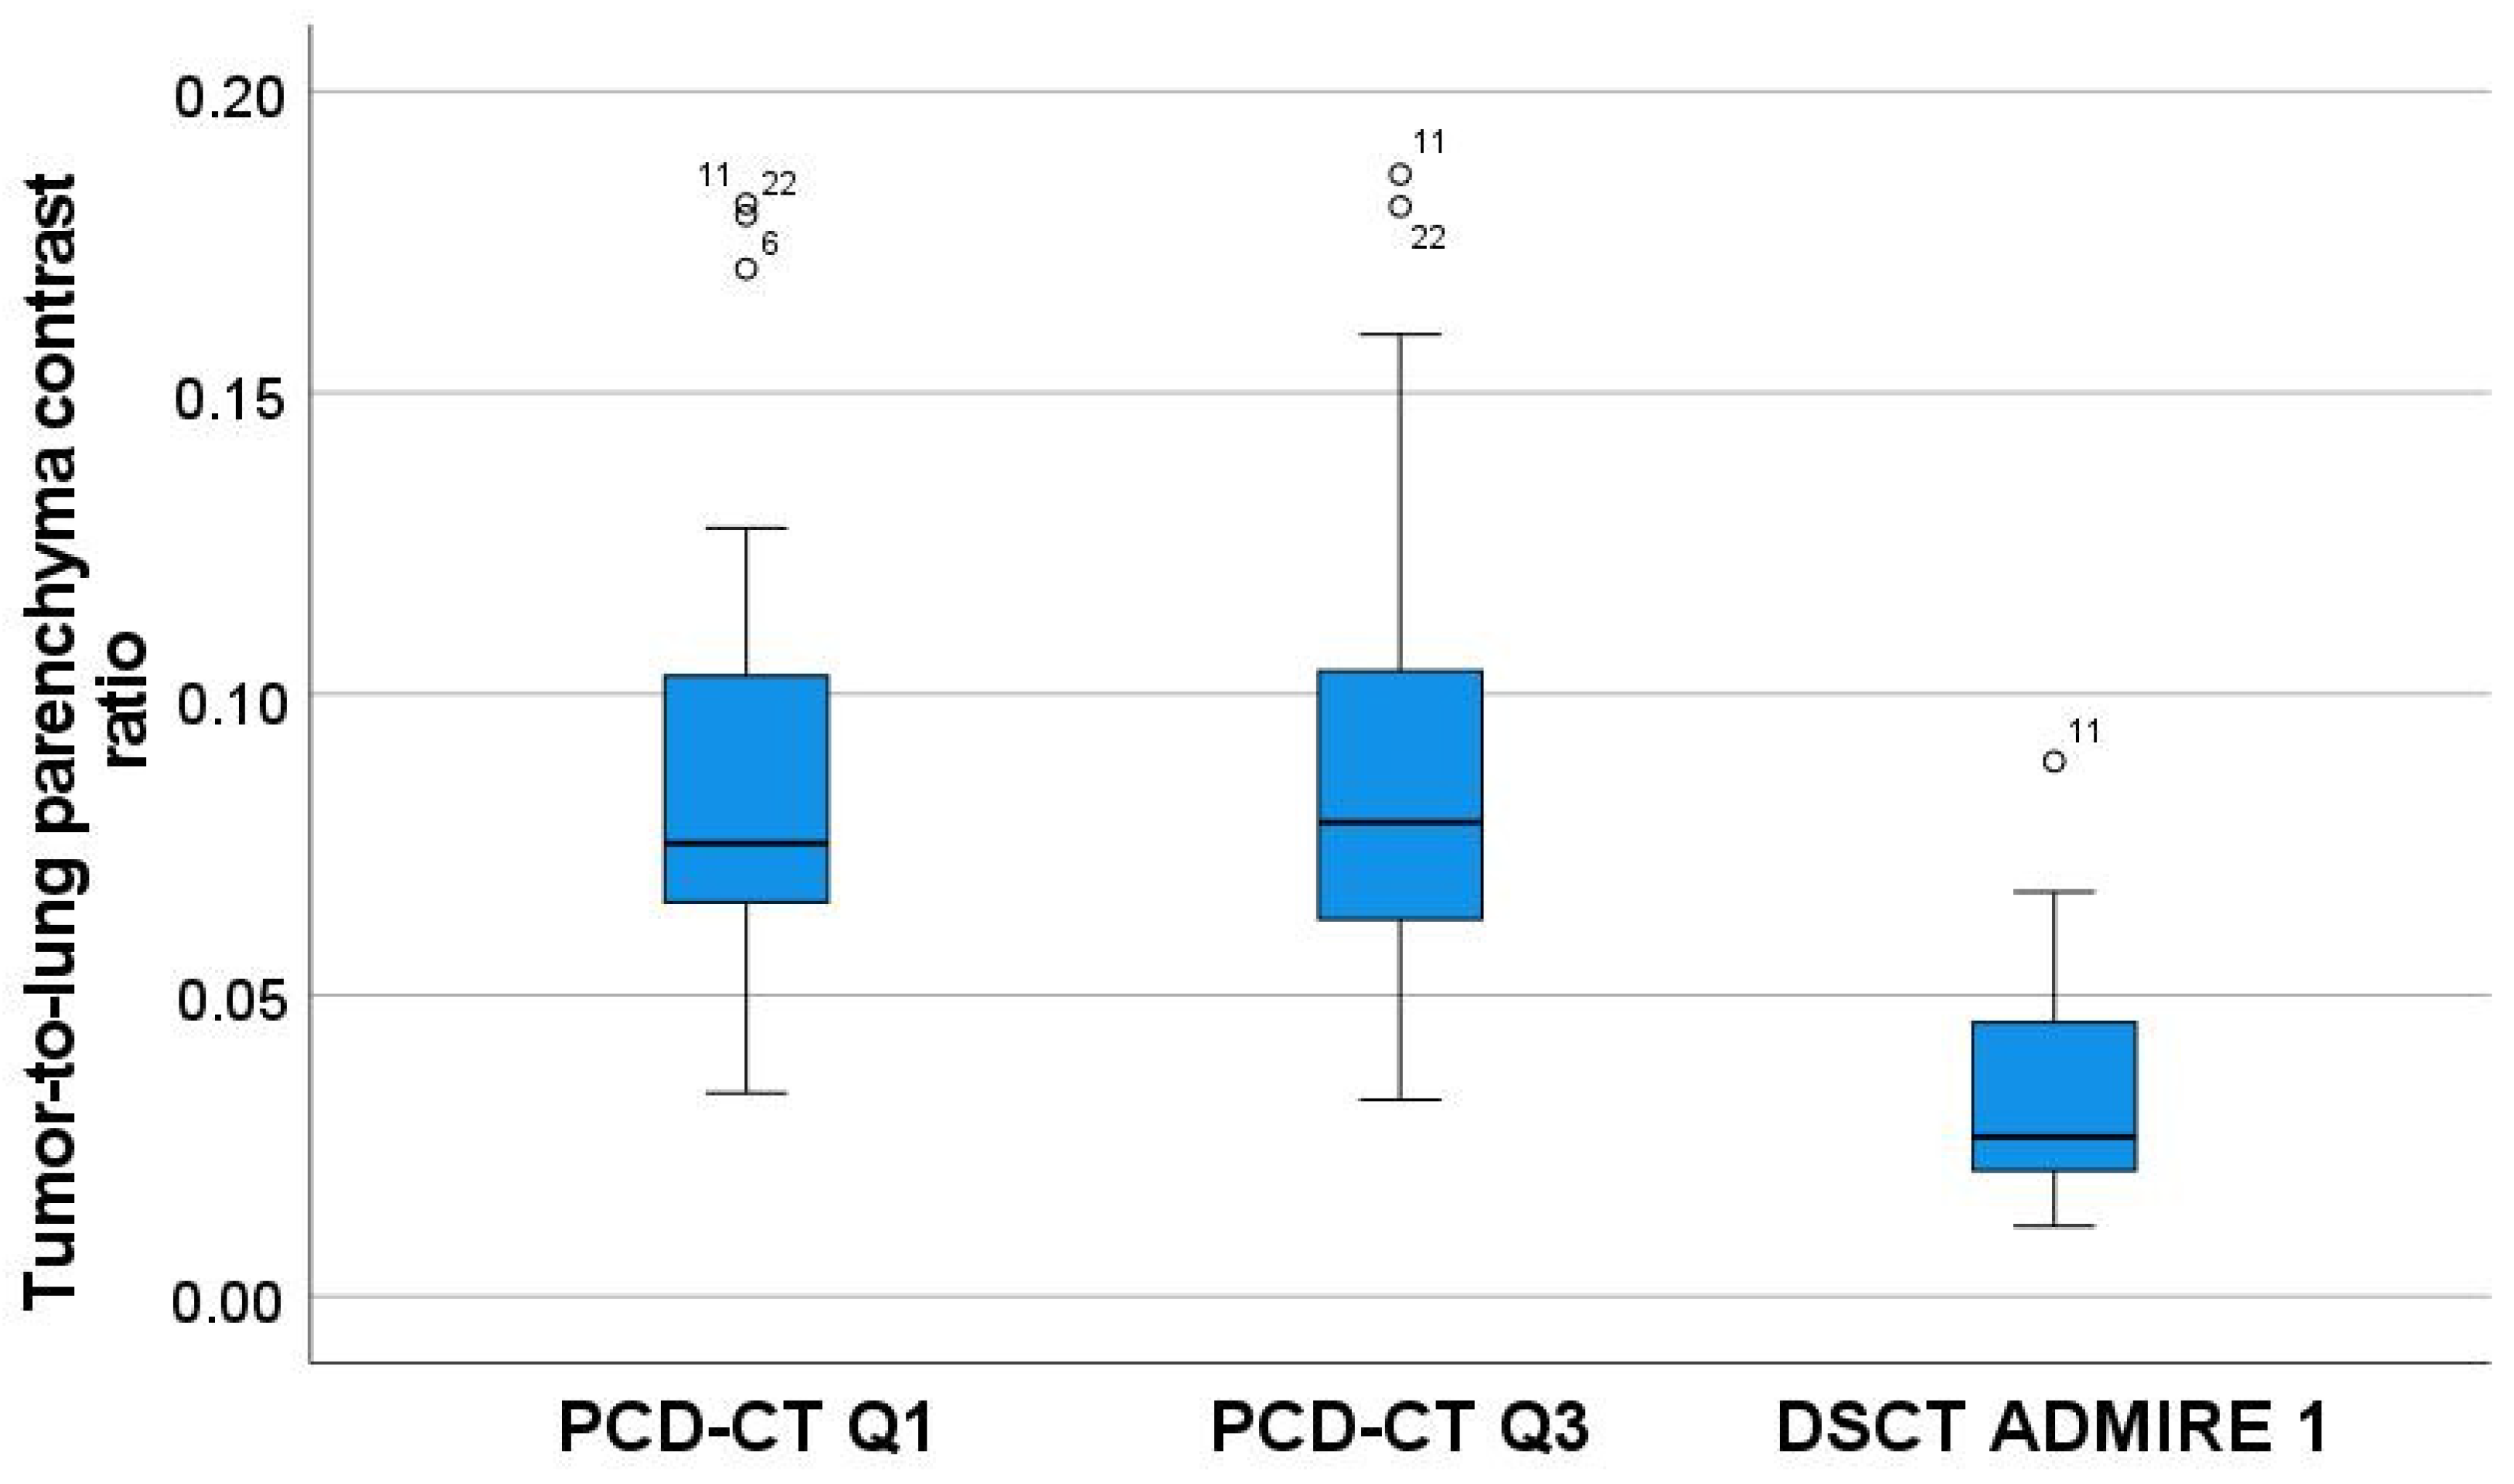
| Tumor-to-lung parenchyma contrast ratio (Median ± SD) | 0.03 ± 0.02 | 0.08 ± 0.04 | 0.08 ± 0.04 | <0.001 * | ** Q3 > DSCT (p < 0.001) ** Q1 > DSCT (p < 0.001) |
| DSCT | PCD-CT | p-Value | Corrected p-Value | |||
|---|---|---|---|---|---|---|
| Admire 1 | Q1 | Q3 | ||||
| Mediastinum | Image Noise Median (Min-Max) | 4 (3–5) | 3 (2–4) | 3 (2–4) | <0.001 * | ** DSCT > Q1 (p < 0.001) ** DSCT > Q3 (p = 0.014) |
| Image Contrast Median (Min-Max) | 3 (2–4) | 4 (2–4) | 4 (2–4) | <0.001 * | ** Q1 > DSCT (p < 0.001) ** Q3 > DSCT (p < 0.001) | |
| Image Sharpness Median (Min-Max) | 4 (2–5) | 3 (1–4) | 3 (2–5) | <0.001 * | ** DSCT > Q1 (p = 0.003) ** DSCT > Q3 (p = 0.024) | |
| Vessels | Image Noise Median (Min-Max) | 4 (3–5) | 4 (3–5) | 4 (3–5) | <0.001 * | No differences between the groups |
| Image Contrast Median (Min-Max) | 4 (2–5) | 5 (3–5) | 5 (3–5) | <0.001 * | ** Q1 > DSCT (p < 0.001) ** Q3 > DSCT (p < 0.001) | |
| Image Sharpness Median (Min-Max) | 4 (3–5) | 4 (3–5) | 4 (2–5) | 0.662 * | No differences between the groups | |
| Lung parenchyma | Image Noise Median (Min-Max) | 4 (3–4) | 3 (2–4) | 4 (3–5) | <0.001 * | ** Q3 > Q1 (p < 0.001) ** DSCT > Q1 (p < 0.001) |
| Image Contrast Median (Min-Max) | 4 (3–4) | 4 (3–5) | 4 (3–5) | <0.001 * | ** Q3 > DSCT (p = 0.027) | |
| Image Sharpness Median (Min-Max) | 4 (3–5) | 4 (3–5) | 4 (3–5) | 0.004 * | No differences between the groups | |
Publisher’s Note: MDPI stays neutral with regard to jurisdictional claims in published maps and institutional affiliations. |
© 2022 by the authors. Licensee MDPI, Basel, Switzerland. This article is an open access article distributed under the terms and conditions of the Creative Commons Attribution (CC BY) license (https://creativecommons.org/licenses/by/4.0/).
Share and Cite
Hagen, F.; Walder, L.; Fritz, J.; Gutjahr, R.; Schmidt, B.; Faby, S.; Bamberg, F.; Schoenberg, S.; Nikolaou, K.; Horger, M. Image Quality and Radiation Dose of Contrast-Enhanced Chest-CT Acquired on a Clinical Photon-Counting Detector CT vs. Second-Generation Dual-Source CT in an Oncologic Cohort: Preliminary Results. Tomography 2022, 8, 1466-1476. https://doi.org/10.3390/tomography8030119
Hagen F, Walder L, Fritz J, Gutjahr R, Schmidt B, Faby S, Bamberg F, Schoenberg S, Nikolaou K, Horger M. Image Quality and Radiation Dose of Contrast-Enhanced Chest-CT Acquired on a Clinical Photon-Counting Detector CT vs. Second-Generation Dual-Source CT in an Oncologic Cohort: Preliminary Results. Tomography. 2022; 8(3):1466-1476. https://doi.org/10.3390/tomography8030119
Chicago/Turabian StyleHagen, Florian, Lukas Walder, Jan Fritz, Ralf Gutjahr, Bernhard Schmidt, Sebastian Faby, Fabian Bamberg, Stefan Schoenberg, Konstantin Nikolaou, and Marius Horger. 2022. "Image Quality and Radiation Dose of Contrast-Enhanced Chest-CT Acquired on a Clinical Photon-Counting Detector CT vs. Second-Generation Dual-Source CT in an Oncologic Cohort: Preliminary Results" Tomography 8, no. 3: 1466-1476. https://doi.org/10.3390/tomography8030119
APA StyleHagen, F., Walder, L., Fritz, J., Gutjahr, R., Schmidt, B., Faby, S., Bamberg, F., Schoenberg, S., Nikolaou, K., & Horger, M. (2022). Image Quality and Radiation Dose of Contrast-Enhanced Chest-CT Acquired on a Clinical Photon-Counting Detector CT vs. Second-Generation Dual-Source CT in an Oncologic Cohort: Preliminary Results. Tomography, 8(3), 1466-1476. https://doi.org/10.3390/tomography8030119