
Evaluating the Quality of Optimal MRCP Image Using RT-2D-Compressed SENSE(CS)Turbo Spin Echo: Comparing Respiratory Triggering(RT)-2D-SENSE Turbo Spin Echo and Breath Hold-2D-Single-Shot Turbo Spin Echo


Abstract
1. Introduction
2. Materials and Methods
2.1. Study Subjects
2.2. Test Methods
2.3. Analysis Methods
2.4. Statistical Analysis
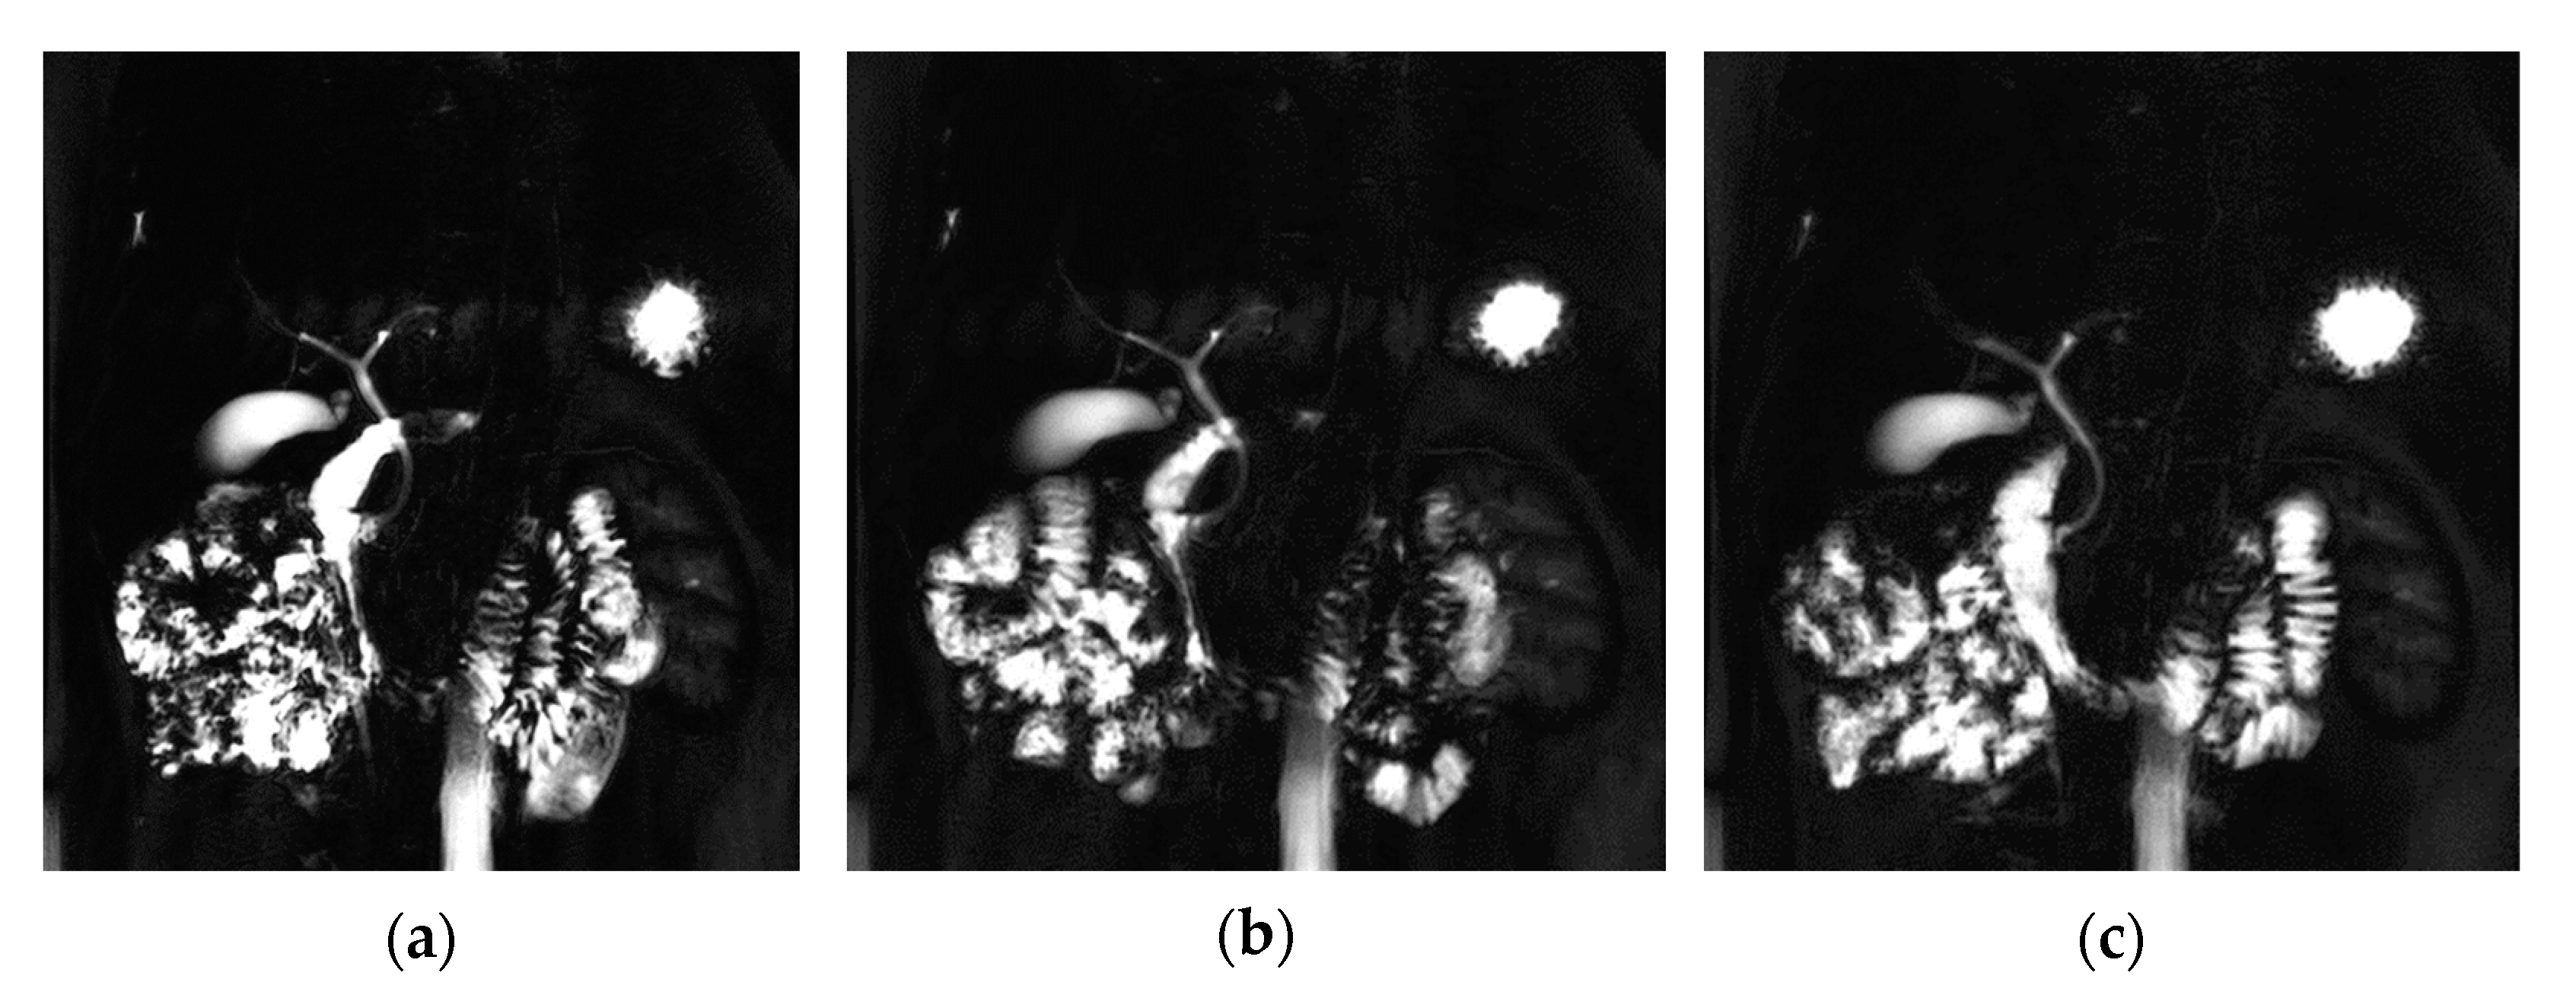
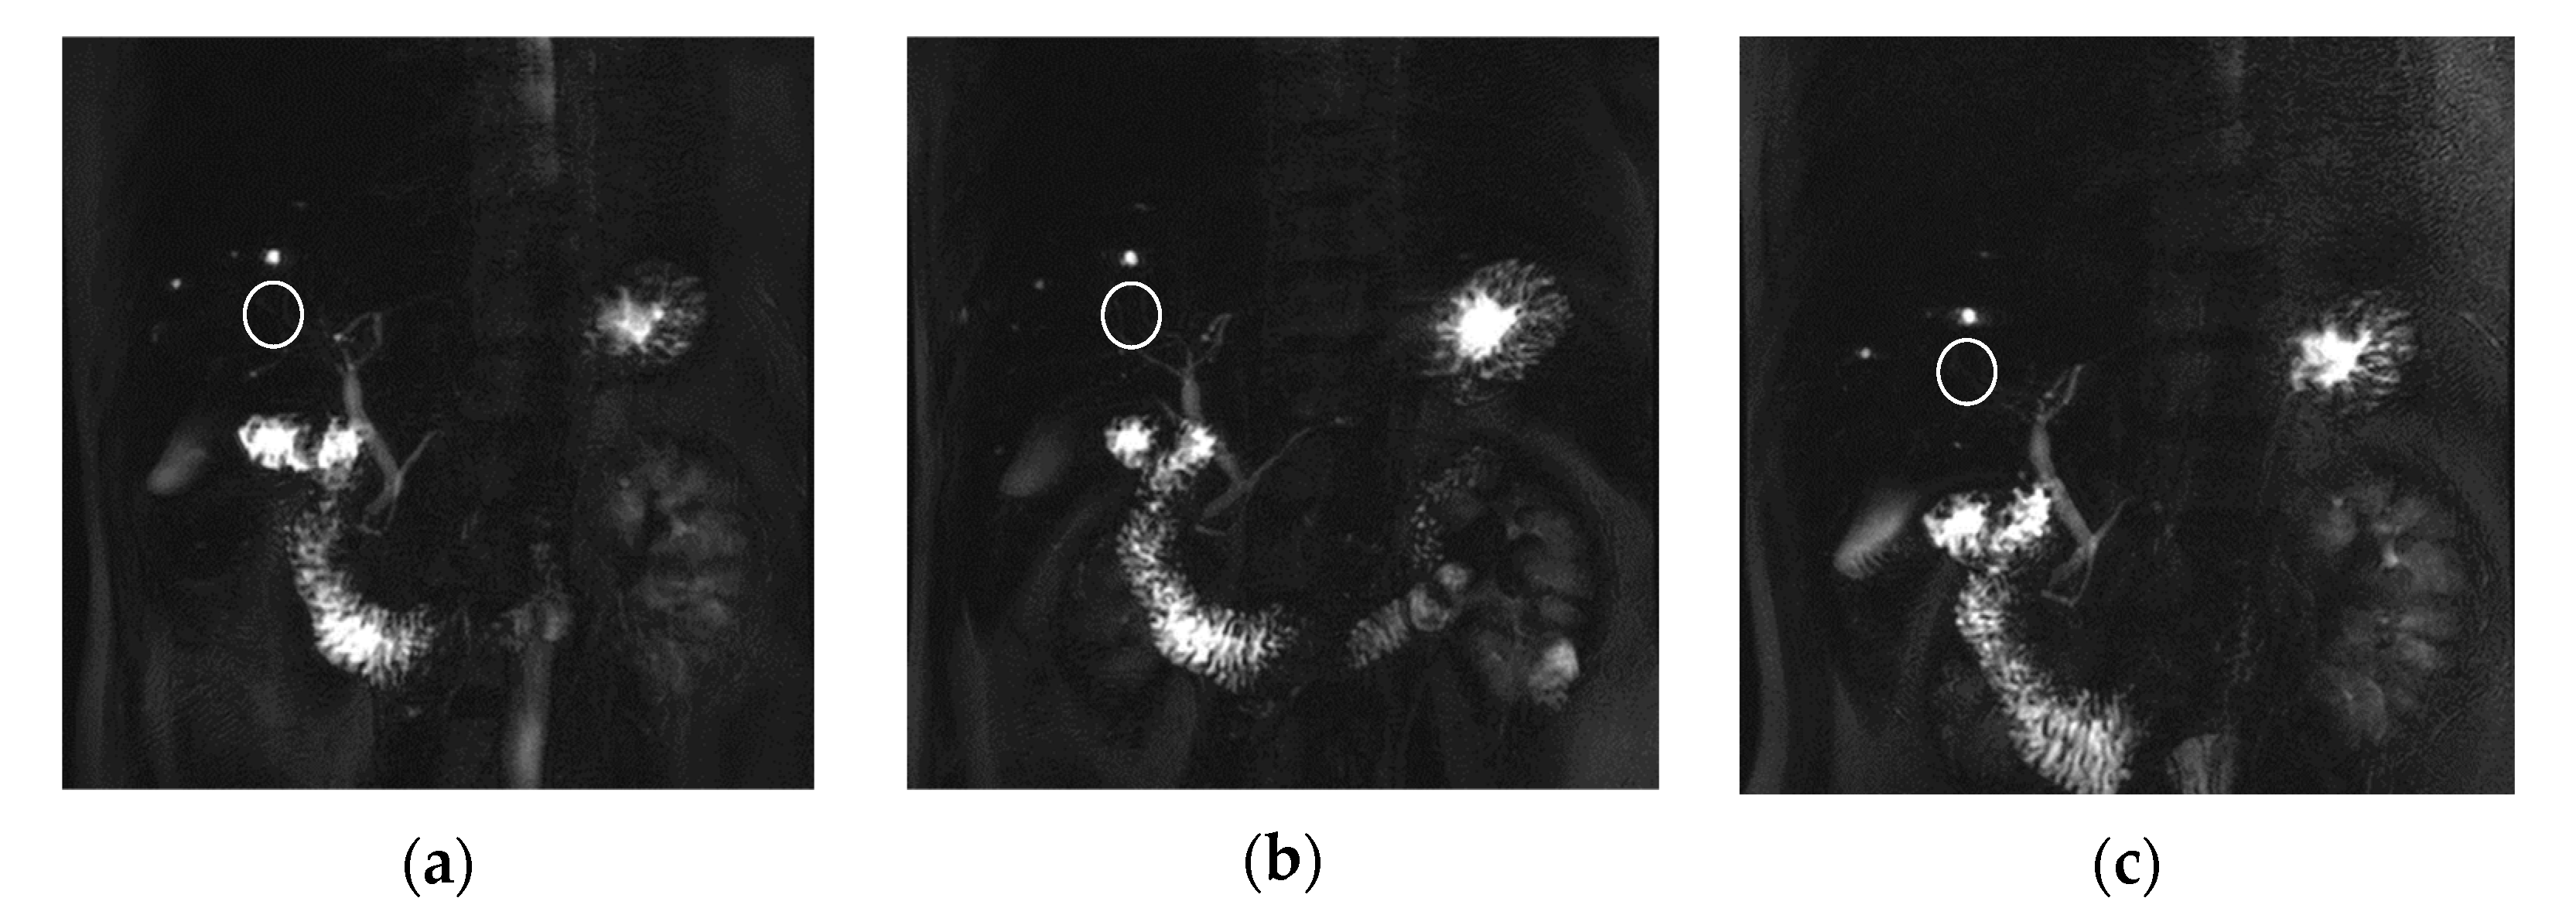
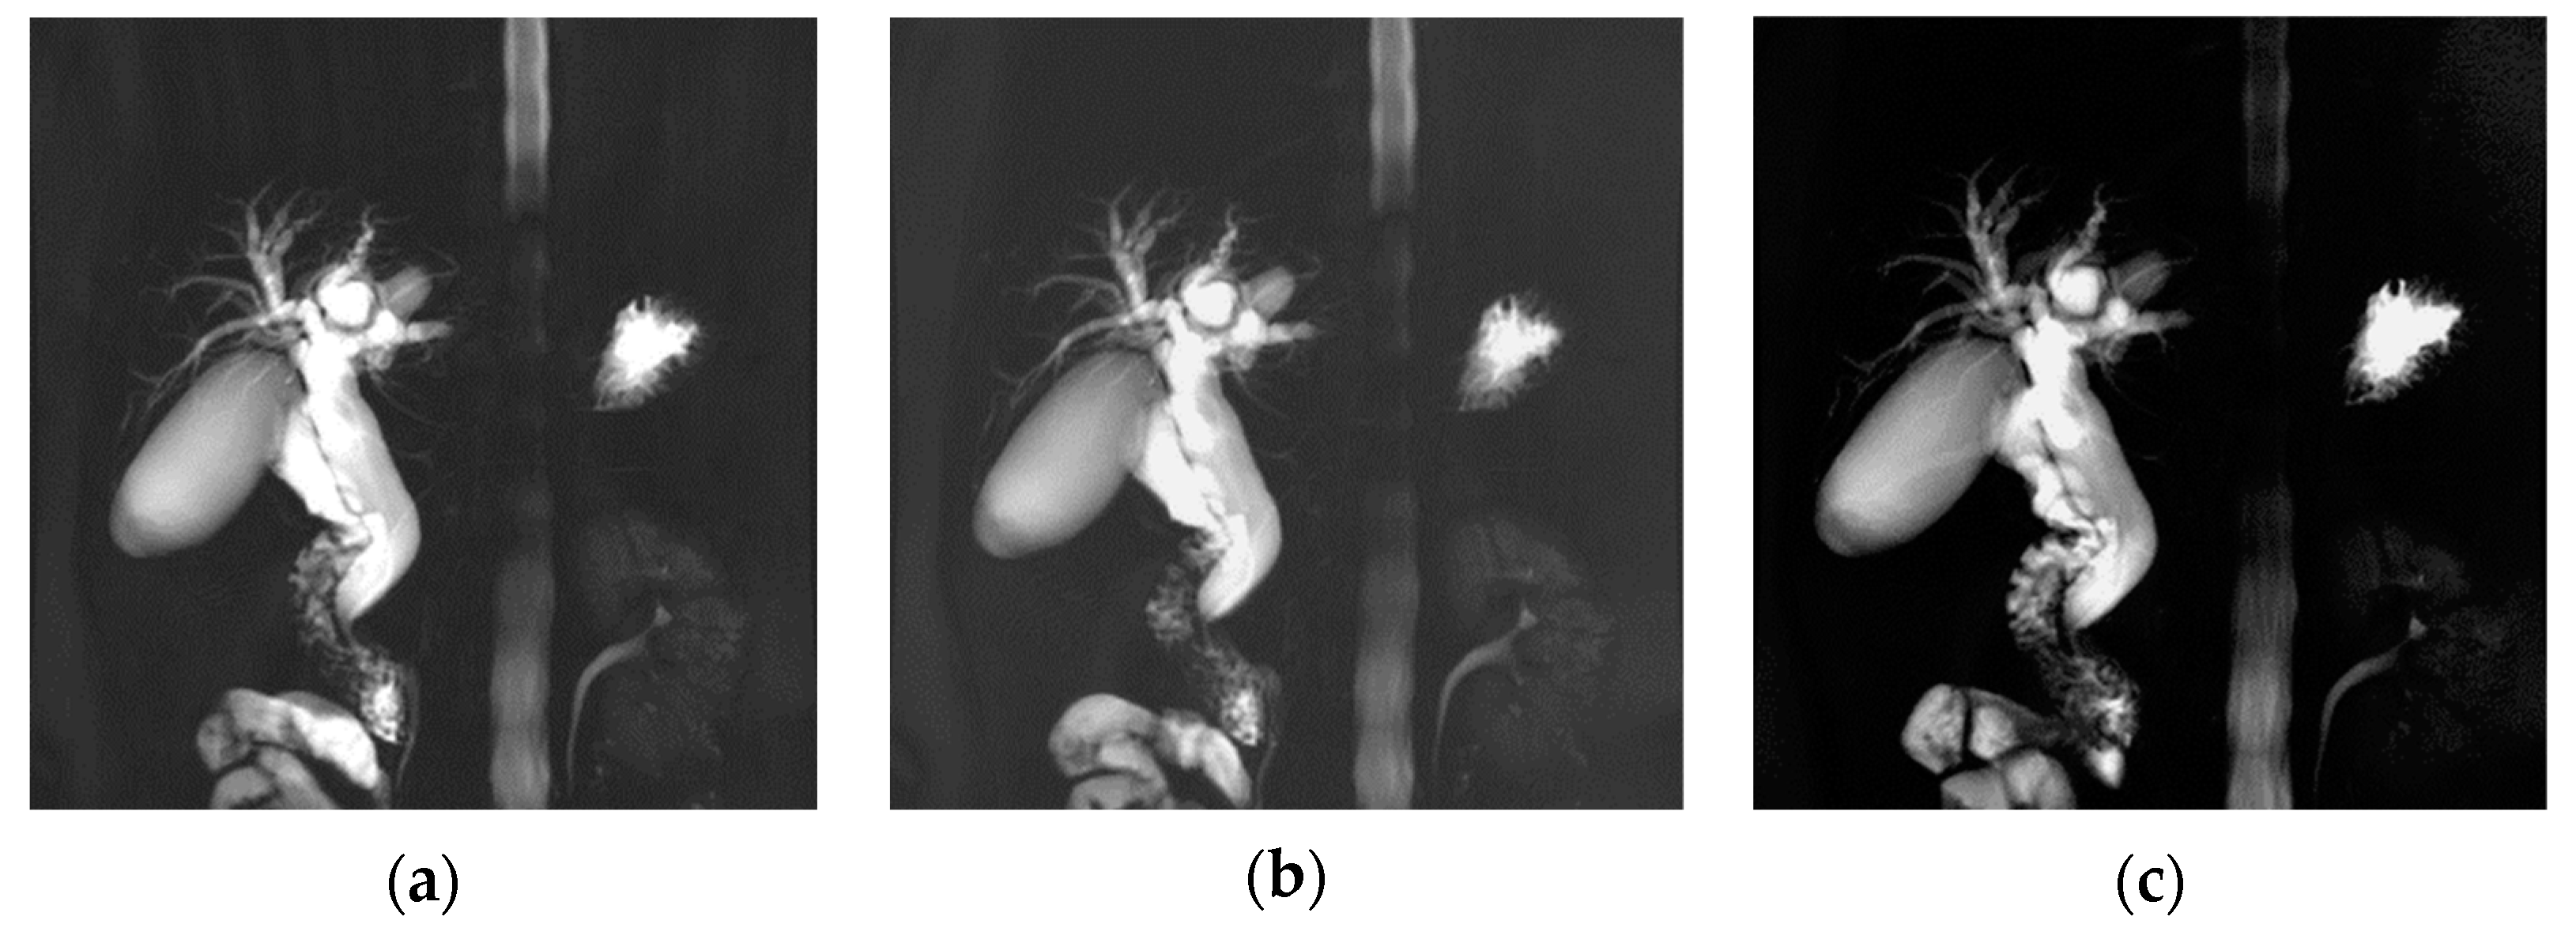
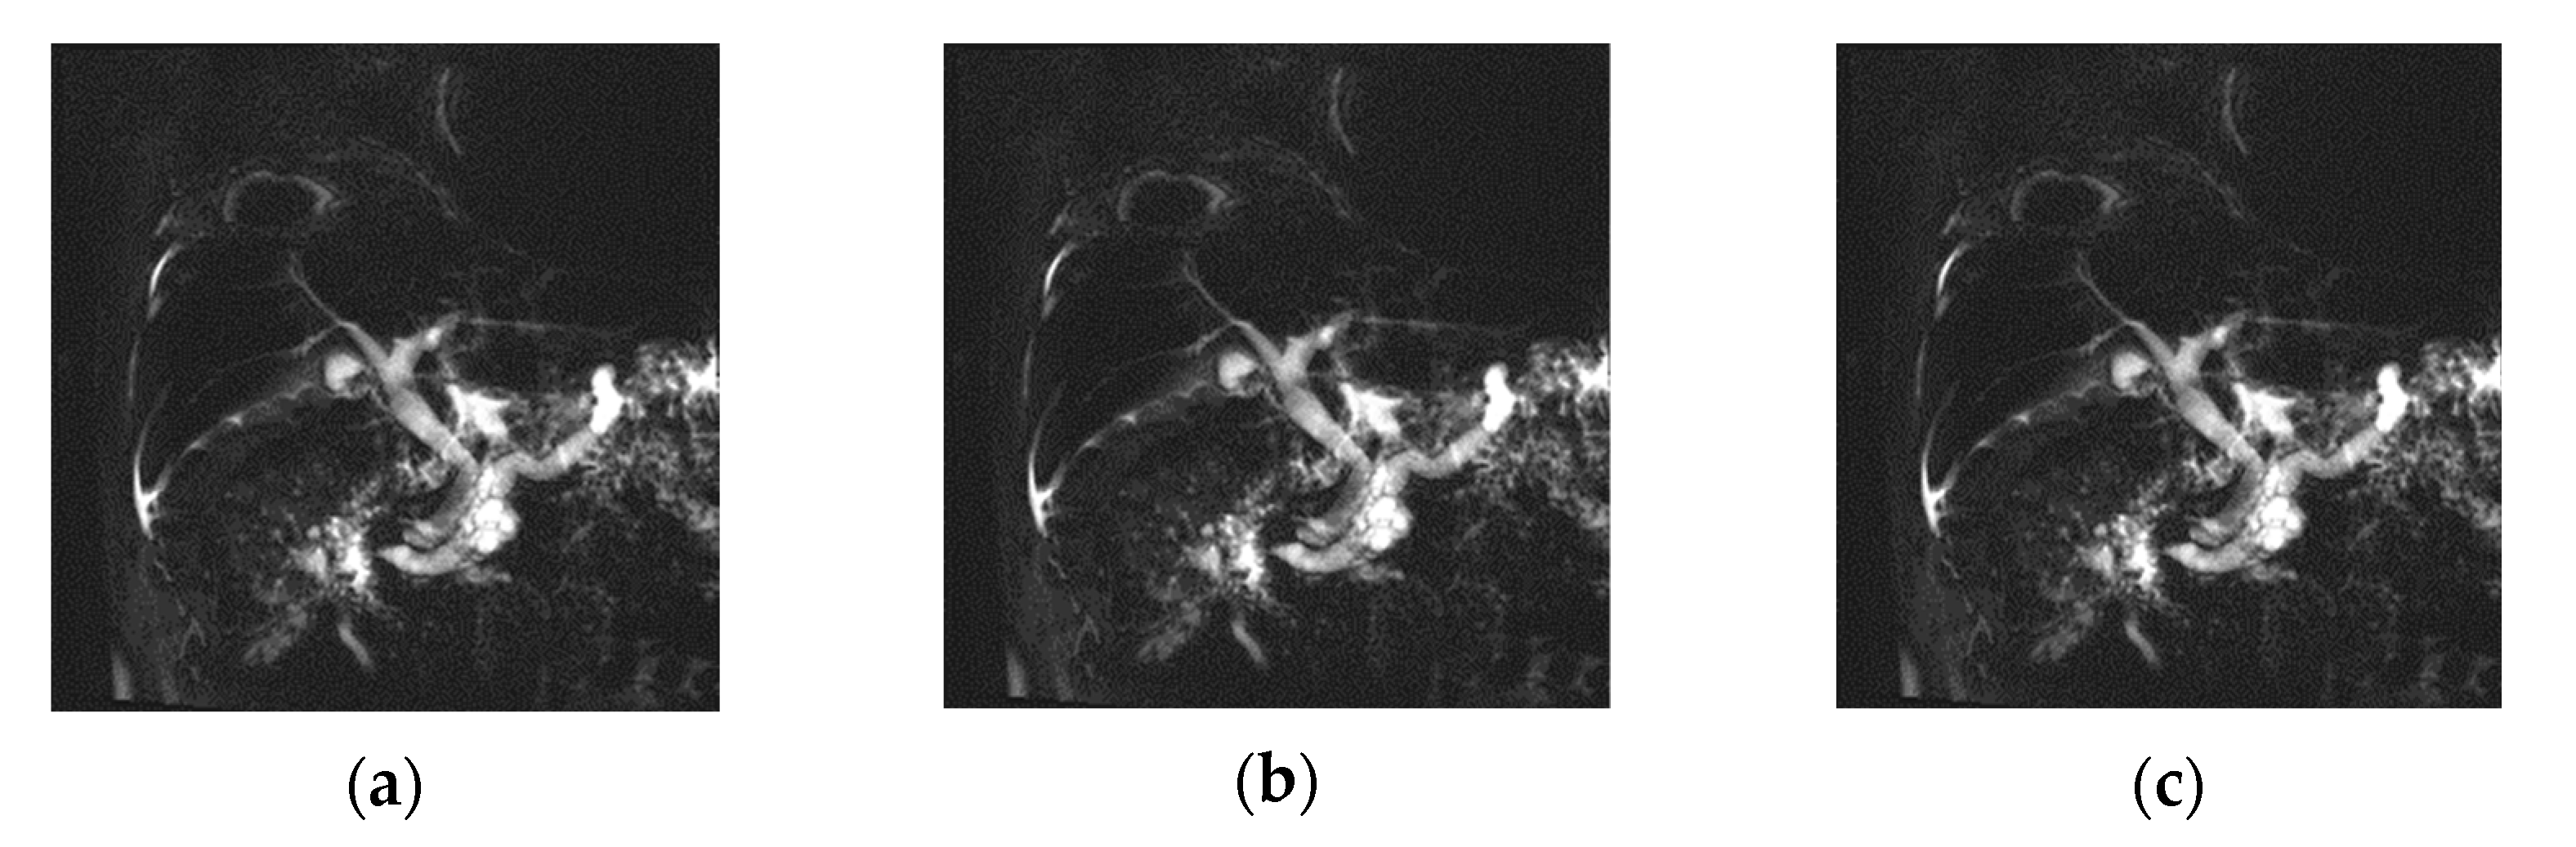
3. Results
3.1. Quantitative Analysis
3.2. Qualitative Analysis
4. Discussion
5. Conclusions
Author Contributions
Funding
Institutional Review Board Statement
Informed Consent Statement
Data Availability Statement
Conflicts of Interest
References
- Pandol, S.J.; Saluja, A.K.; Imrie, C.W.; Banks, P.A. Acute pancreatitis: Bench to the bedside. Gastroenterology 2007, 132, 1127–1151. [Google Scholar] [CrossRef] [PubMed]
- Park, D.H.; Kim, M.H.; Lee, S.S.; Kim, S.Y.; Kim, J.H.; Kim, H.J.; Kim, T.K. Usefulness and limitation of magnetic resonance cholangiopancreatography in patients with hepatolithiasis. Korean J. Gastroenterol. 2003, 42, 423–430. [Google Scholar] [PubMed]
- Baek, J.O.; Kim, Y.H.; Ahn, K.S.; Kang, K.J.; Lim, T.J. The Value of Preoperative Magnetic Resonance Cholangiopancreatography(MRCP) to Prevent Bile Duct Injury in Patients Who Will Perform Laparoscopic Cholecystectomy. J. Minim. Invasive Surg. 2012, 15, 68–74. [Google Scholar] [CrossRef]
- Jung, J.Y.; Lee, S.K.; Oh, H.C.; Lee, T.Y.; Kwon, S.H.; Lee, S.S.; Kim, M.H. The Role of Percutaneous Transhepatic Cholangioscopy(ptcs) In Patients with Hilar Stricture. Gut. Liver 2007, 1, 56–62. [Google Scholar] [CrossRef] [PubMed]
- Griffin, N.; Charles-Edwards, G.; Grant, L.A. Magneticresonance cholangiopancreatography: The ABC of MRCP. Insights Imaging 2012, 3, 11–21. [Google Scholar] [CrossRef] [PubMed]
- Chaâri, L.; Pesquet, J.C.; Benazza-Benyahia, A.; Ciuciu, P. A wavelet-based regularized reconstruction algorithm for SENSE parallel MRI with applications to neuroimaging. Med. Image Anal. 2011, 15, 185–201. [Google Scholar] [CrossRef] [PubMed]
- Pruessmann, K.P.; Weiger, M.; Scheidegger, M.B.; Boesiger, P. SENSE: Sensitivity encoding for fast MRI. Magn. Reson. Med. 1999, 42, 952–962. [Google Scholar] [CrossRef]
- Geerts-Ossevoort, L.; de Weerdt, E.; Duijndam, A.; van Ijperen, G.; Peeters, H.; Doneva, M.; Nijenhuis, M.; Huang, A. Compressed SENSE. Speed Done Right. Every Time; PHILIPS MR Clinical Applicaton; PHILIPS: Amsterdam, The Netherlands, 2018. [Google Scholar]
- Deshmane, A.; Gulani, V.; Griswold, M.A.; Seiberlich, N. Parallel MR imaging. J. Magn. Reson. Imaging 2012, 36, 55–72. [Google Scholar] [CrossRef]
- Sartoretti, T.; Reischauer, C.; Sartoretti, E.; Binkert, C.; Najafi, A.; Sartoretti-Schefer, S. Common artefacts encountered on images acquired with combined compressed sensing and SENSE. Insights Imaging 2018, 9, 1107–1115. [Google Scholar] [CrossRef]
- Miyazaki, T.; Yamashita, Y.; Tsuchigame, T.; Yamamoto, H.; Urata, J.; Takahashi, M. MR cholangiopancreatography using HASTE (half-Fourier acquisition single-shot turbo spin-echo) sequences. Am. J. Roentgenol. 1996, 166, 1297–1303. [Google Scholar] [CrossRef]
- Hosseinzadeh, K.; Furlan, A.; Almusa, O. 2D Thick-Slab MR Cholangiopancreatography: Does Parallel Imaging with Sensitivity Encoding Improve Image Quality and Duct Visualization? Am. J. Roentgenol. 2008, 190, 327–334. [Google Scholar] [CrossRef] [PubMed]
- Yun, E.J.; Choi, C.S.; Yoon, D.Y.; Yoon, Y.C.; Park, S.J.; Seo, Y.L.; Lim, K.J. MR cholangiopancreatography: Comparison between single-shot turbo spin-echo pulse sequence and three-dimensional turbo spin-echo pulse sequence with SENSE technique. J. Korean Radiol. Soc. 2003, 49, 483–488. [Google Scholar] [CrossRef][Green Version]
- Zins, M. Breath-holding 3D MRCP: The time is now? Eur. Radiol. 2018, 28, 3719–3720. [Google Scholar] [CrossRef] [PubMed]
- Albert, G.; Riemann, J.F. ERCP and MRCP-when and why. Best Pract. Res. Clin. Gastroenterol. 2002, 16, 399–419. [Google Scholar] [CrossRef] [PubMed]
- Darge, K.; Anupindi, S. Pancreatitis and the role of US, MRCP and ERCP. Pediatr. Radiol. 2009, 39, 153–157. [Google Scholar] [CrossRef] [PubMed]
- Nagata, S.; Goshima, S.; Noda, Y.; Kawai, N.; Kajita, K.; Kawada, H.; Tanahashi, Y.; Matsuo, M. Magnetic resonance cholangiopancreatography using optimized integrated combination with parallel imaging and compressed sensing technique. Abdom. Radiol. 2019, 44, 1766–1772. [Google Scholar] [CrossRef]
- Manimala, M.V.R.; Dhanunjaya Naidu, C.; Giri Prasad, M.N. Sparse MR Image Reconstruction Considering Rician Noise Models: A CNN Approach. Wirel. Pers. Commun. 2021, 16, 491–511. [Google Scholar] [CrossRef]
- Lee, J.H.; Lee, S.S.; Kim, J.Y.; Kim, I.S.; Byun, J.H.; Park, S.H.; Lee, M.G. Parallel imaging improves the image quality and duct visibility of breathhold two-dimensional thick-slab MR cholangiopancreatography. J. Magn. Reson. Imaging 2014, 39, 269–275. [Google Scholar] [CrossRef]
- Jang, W.; Song, J.S.; Kim, S.H.; Yang, J.D. Comparison of Compressed Sensing and Gradient and Spin-Echo in Breath-Hold 3D MR Cholangiopancreatography: Qualitative and Quantitative Analysis. Diagnostics 2021, 11, 634. [Google Scholar] [CrossRef]
- Chevallier, O.; Escande, H.; Ambarki, K.; Weiland, E.; Kuehn, B.; Guillen, K.; Manfredi, S.; Gehin, S.; Blanc, J.; Loffroy, R. Single-Breath-Hold MRI-SPACE Cholangiopancreatography with Compressed Sensing versus Conventional Respiratory-Triggered MRI-SPACE Cholangiopancreatography at 3Tesla: Comparison of Image Quality and Diagnostic Confidence. Diagnostics 2021, 11, 1886. [Google Scholar] [CrossRef]
- Hwang, D.W.; Jang, J.Y.; Lee, S.E.; Lim, C.S.; Lee, K.U.; Kim, S.W. Clinicopathologic analysis of surgically proven intraductal papillary mucinous neoplasms of the pancreas in SNUH: A 15-year experience at a single academic institution. Langenbecks Arch. Surg. 2012, 397, 93–102. [Google Scholar] [CrossRef] [PubMed]
- Chu, M.L.; Chien, C.P.; Wu, W.C.; Chung, H.W. Gradient- and spin-echo (GRASE) MR imaging: A long-existing technology that may find wide applications in modern era. Quant. Imaging Med. Surg. 2019, 9, 1477–1484. [Google Scholar] [CrossRef] [PubMed]


| Parameters | 2D-SENSE TSE | 2D-CS TSE | 2D-SSh TSE |
|---|---|---|---|
| TR a (ms) | 4093 | 4093 | 10696 |
| TE b (ms) | 920 | 920 | 920 |
| Slice Thickness (mm) | 50 | 50 | 50 |
| NEX | 1 | 1 | 1 |
| FOV (mm) | 270 × 270 | 270 × 270 | 270 × 270 |
| Matrix | 256 × 256 | 256 × 256 | 256 × 256 |
| Scan Time (s) | 58 | 46 | 132 |
| Respiration | RT c | RT c | BH d |
| SENSE, Reduction | Yes, 1 | No, No | No, No |
| CS, Reduction | No, No | Yes, 1.1, 1.2, 1.3, 1.4, 1.5 | No, No |
| Denoising Level | No, Weak, Medium, Strong |
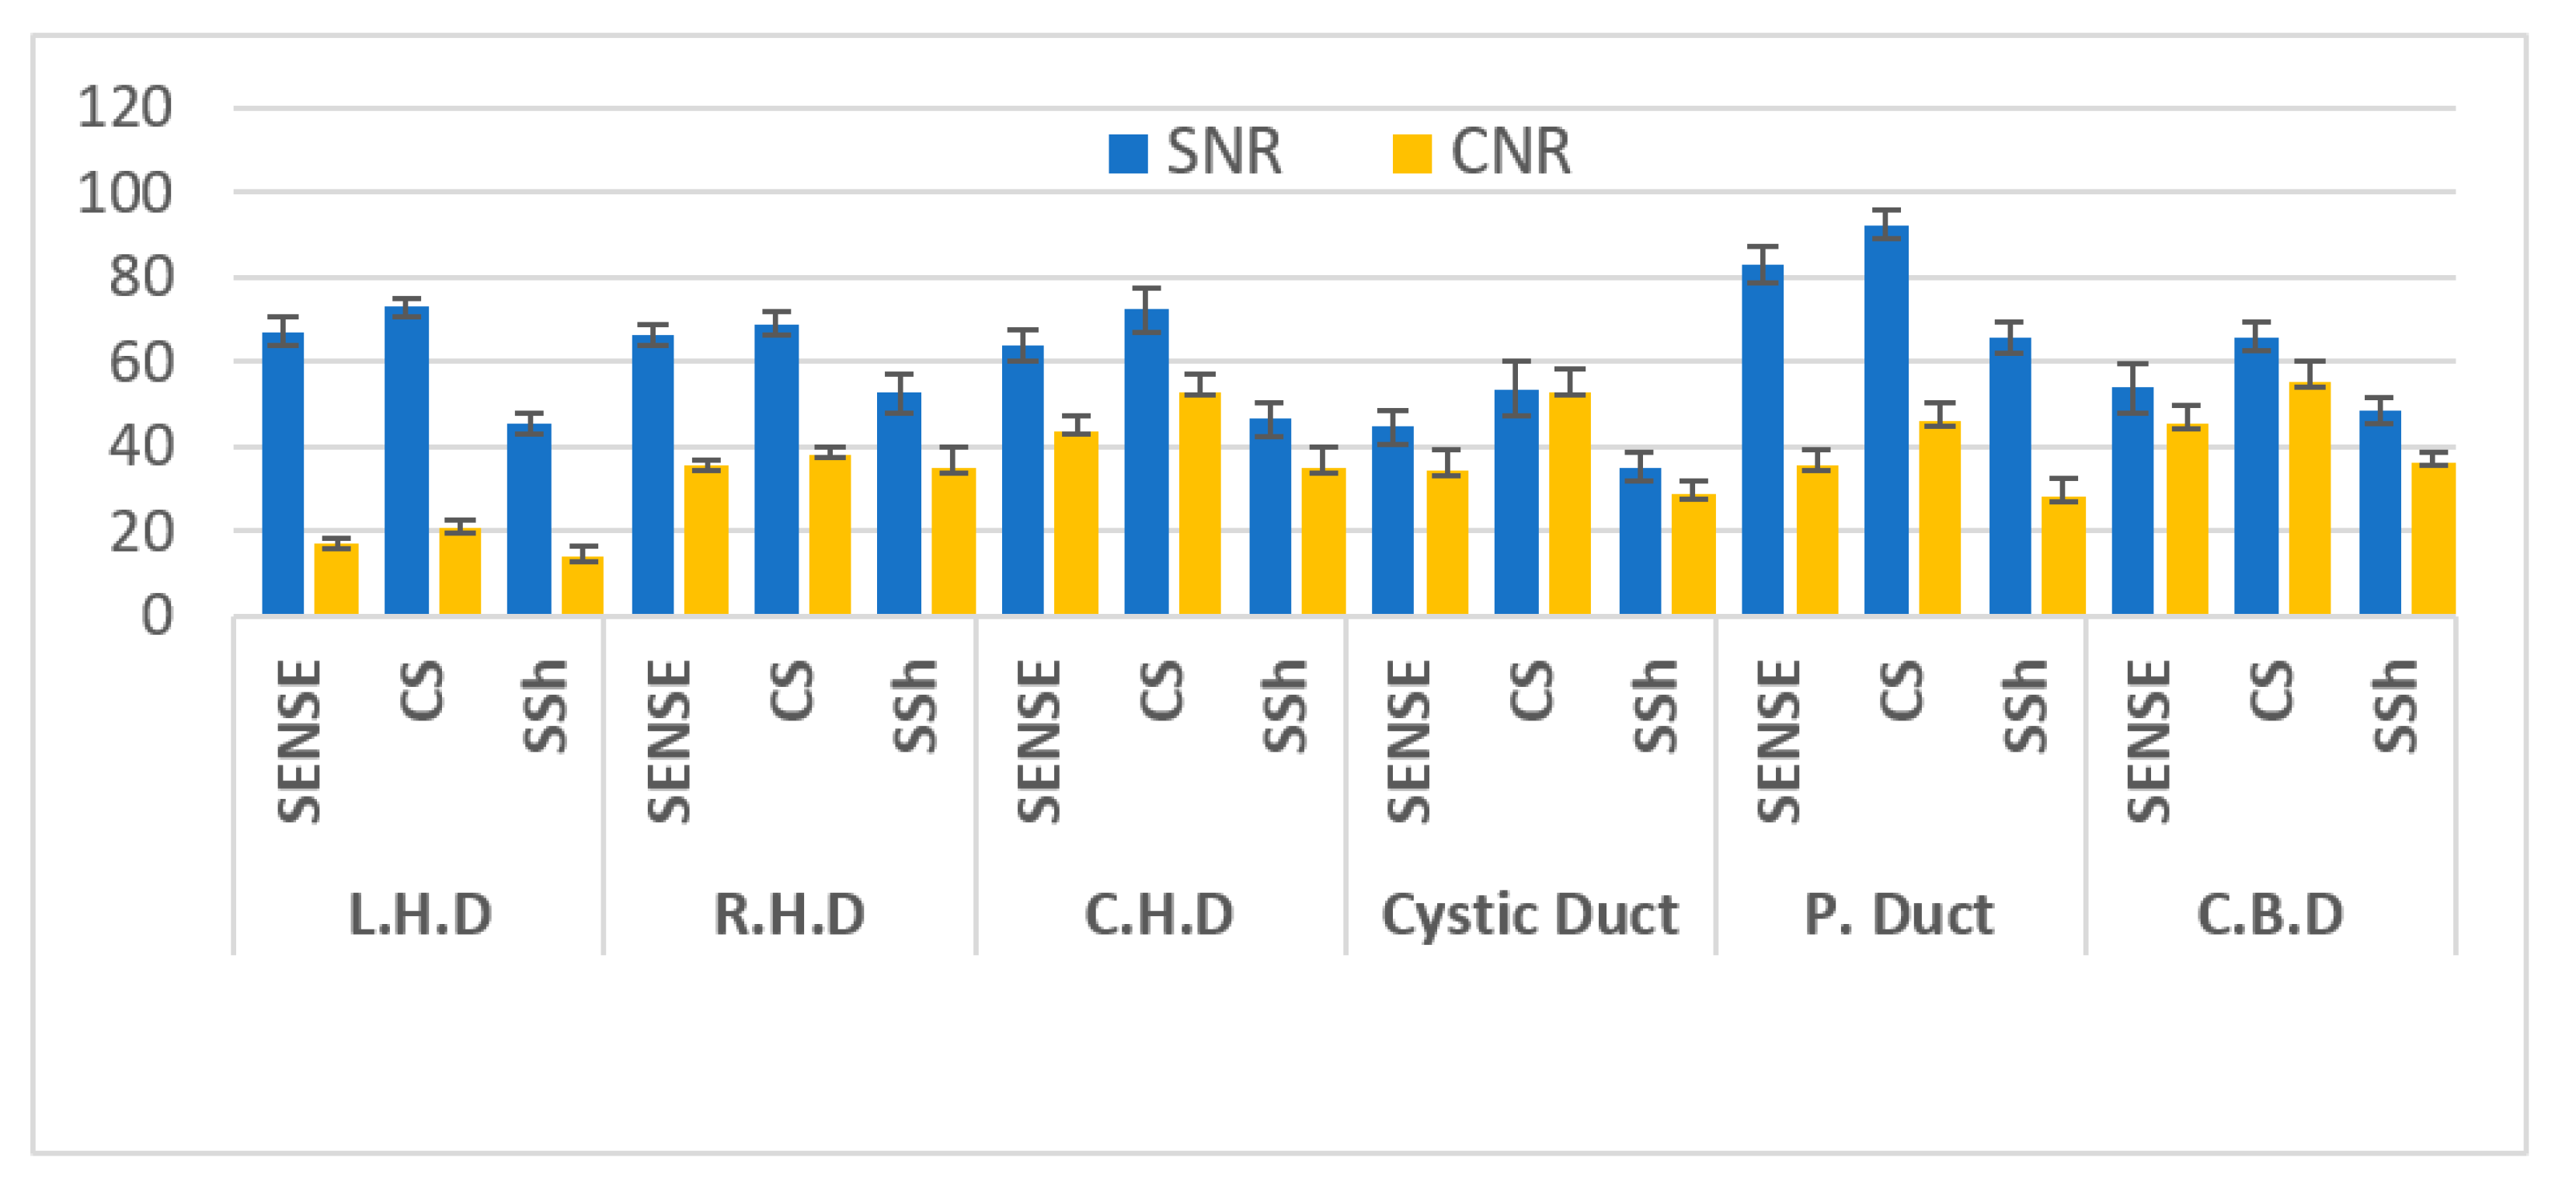
| Location | MRI Sequences | SNR | p-Value | CNR | p-Value |
|---|---|---|---|---|---|
| L.H.D | RT-2D-SENSE a TSE | 67.19 ± 3.34 | <0.001 | 16.84 ± 1.63 | <0.001 |
| RT-2D-CS b TSE | 72.80 ± 2.35 | (b > a > c) | 20.78 ± 1.92 | (b > a > c) | |
| BH-2D-SSh c TSE | 45.23 ± 2.40 | 14.02 ± 2.60 | |||
| R.H.D | RT-2D-SENSE TSE | 66.30 ± 2.26 | <0.001 | 35.52 ± 1.16 | <0.115 |
| RT-2D-CS TSE | 68.92 ± 2.86 | (a > c, b > c) | 38.11 ± 1.88 | ||
| BH-2D-SSh TSE | 52.63 ± 4.52 | 34.80 ± 4.91 | |||
| C.H.D | RT-2D-SENSE TSE | 63.89 ± 3.61 | <0.001 | 43.73 ± 3.63 | <0.001 |
| RT-2D-CS TSE | 72.24 ± 5.23 | (b > a > c) | 52.95 ± 4.24 | (b > a > c) | |
| BH-2D-SSh TSE | 46.43 ± 3.98 | 34.82 ± 5.07 | |||
| Cystic Duct | RT-2D-SENSE TSE | 44.57 ± 4.08 | <0.001 | 34.12 ± 4.82 | <0.001 |
| RT-2D-CS TSE | 53.50 ± 6.37 | (b > a > c) | 53.01 ± 5.25 | (b > a, b > c) | |
| BH-2D-SSh TSE | 35.21 ± 3.48 | 28.68 ± 3.07 | |||
| P. Duct | RT-2D-SENSE TSE | 83.04 ± 4.48 | <0.001 | 35.47 ± 3.89 | <0.001 |
| RT-2D-CS TSE | 92.25 ± 3.41 | (b > a > c) | 46.01 ± 4.38 | (b > a > c) | |
| BH-2D-SSh TSE | 65.56 ± 3.70 | 28.09 ± 4.47 | |||
| C.B.D | RT-2D-SENSE TSE | 53.76 ± 5.73 | <0.001 | 45.26 ± 4.14 | <0.001 |
| RT-2D-CS TSE | 65.97 ± 3.63 | (b > a, b > c) | 55.03 ± 5.26 | (b > a > c) | |
| BH-2D-SSh TSE | 48.42 ± 2.87 | 36.45 ± 2.22 |
| Location | 2D SENSE a TSE | 2D CS b TSE | 2D SSh c TSE | p-Value |
|---|---|---|---|---|
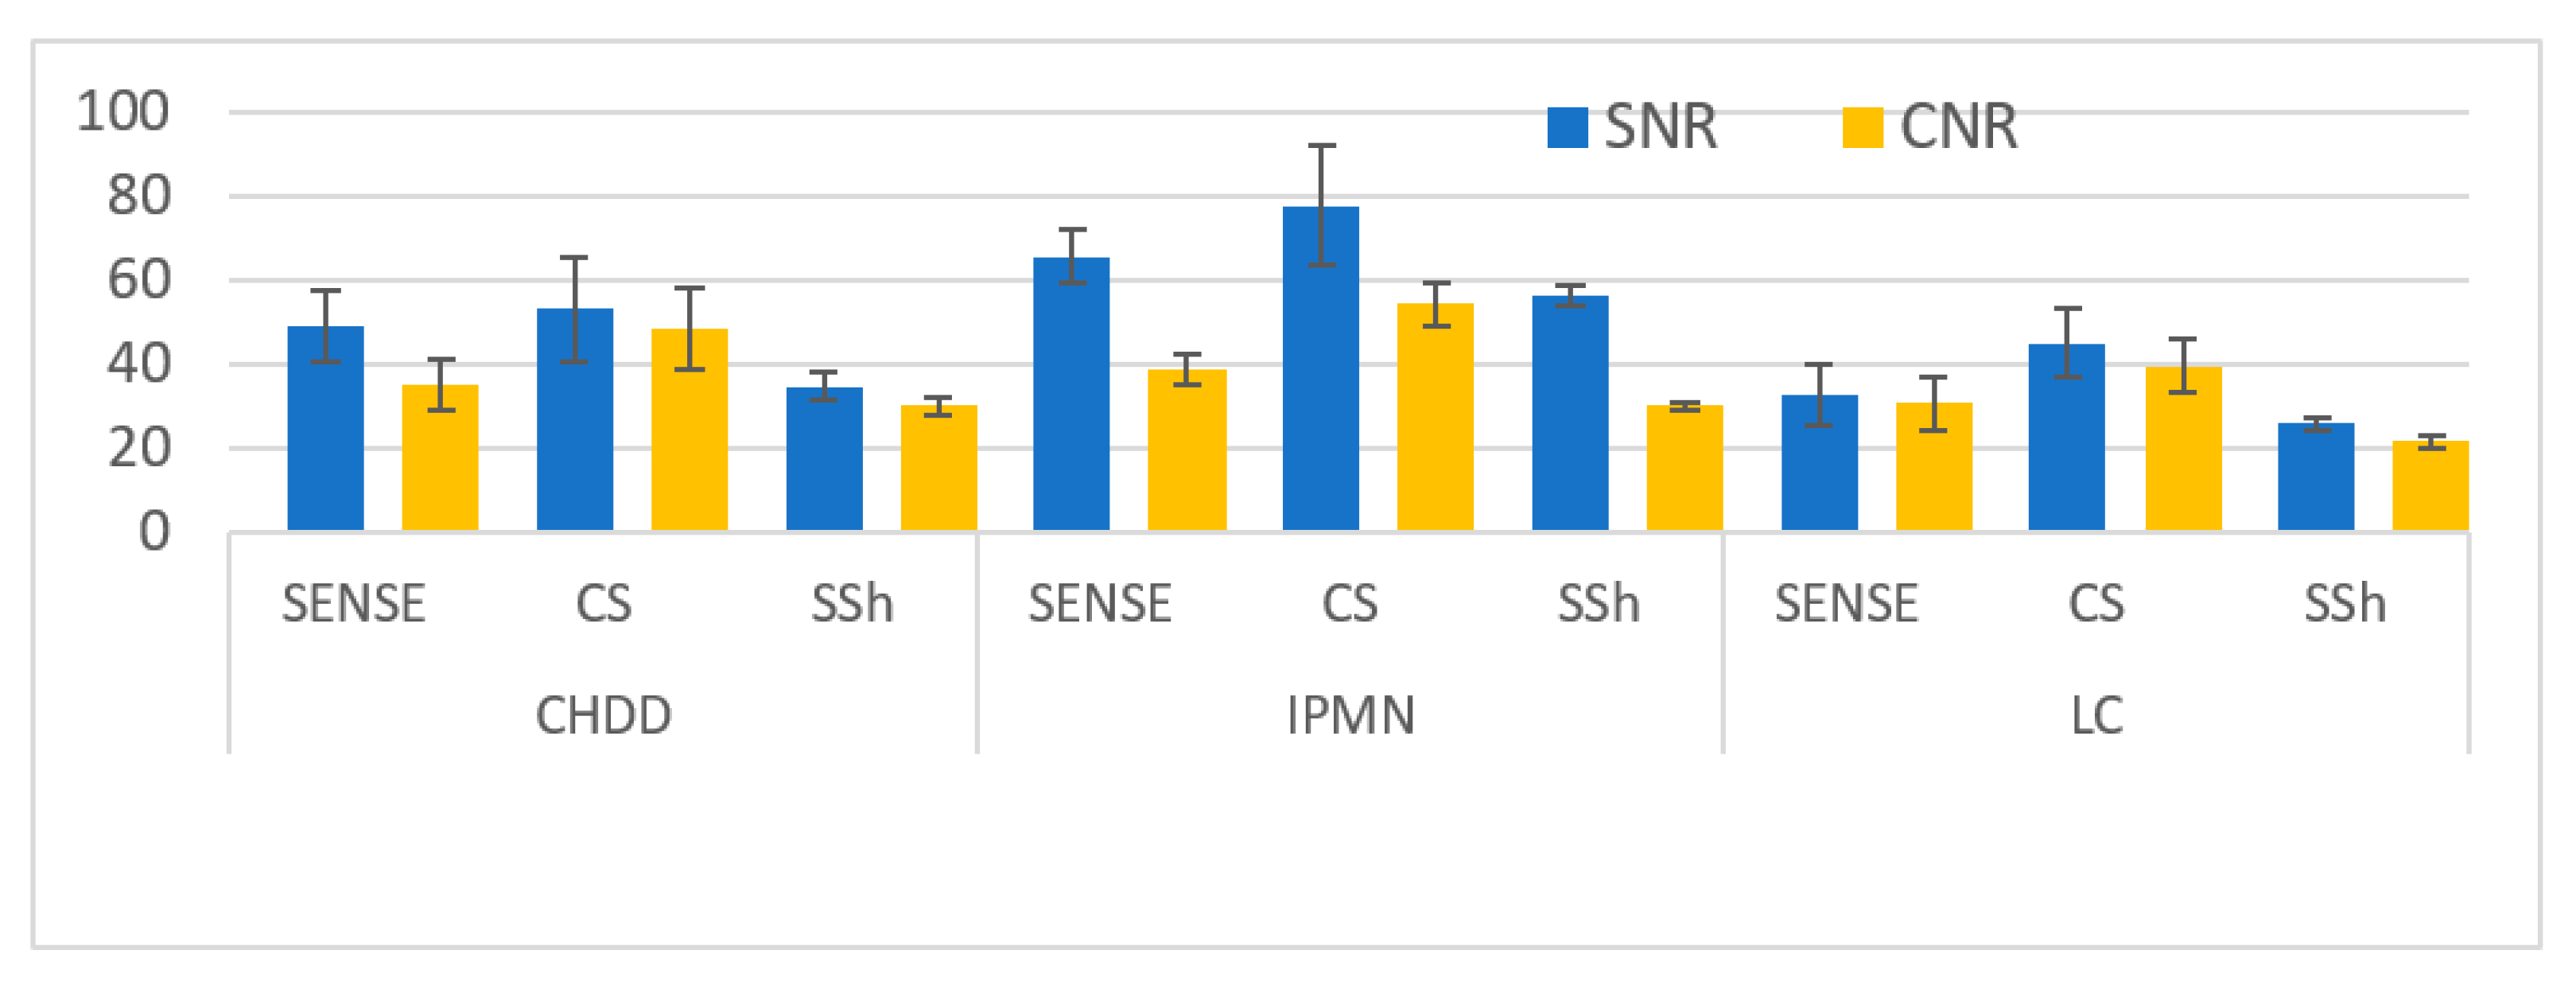
| CHDD (n = 7) ≥ 2 mm SNR and CNR | 48.82 ± 8.29 35.07 ± 6.11 | 52.93 ± 12.47 48.24 ± 9.55 | 34.60 ± 3.44 29.82 ± 2.18 | <0.001 <0.001 |
| IPMN (n = 7) 1 ≤ 2 mm SNR and CNR | 65.85 ± 6.11 38.62 ± 3.52 | 77.71± 14.26 54.12 ± 5.19 | 56.09 ± 2.22 30.05 ± 0.91 | <0.001 <0.001 |
| LC (n = 6) ≤ 1 mm SNR and CNR | 32.64 ± 7.44 30.43 ± 6.42 | 44.91 ± 8.13 39.39 ± 6.47 | 25.56 ± 1.67 21.35 ± 1.35 | <0.001 <0.001 |
| Location | RT-2D-SENSE a TSE | RT-2D-CS b TSE | BH-2D-SSh c TSE | p-Value |
|---|---|---|---|---|
| Sharpness of duct | 3 (2–5) | 4 (2–5) | 4 (2–5) | <0.001 |
| Overall image quality | 3 (2–5) | 4 (2–5) | 5 (2–5) | <0.001 |
| Moving artifact | 3 (2–5) | 4 (3–5) | 4 (4–5) | <0.001 |
Publisher’s Note: MDPI stays neutral with regard to jurisdictional claims in published maps and institutional affiliations. |
© 2022 by the authors. Licensee MDPI, Basel, Switzerland. This article is an open access article distributed under the terms and conditions of the Creative Commons Attribution (CC BY) license (https://creativecommons.org/licenses/by/4.0/).
Share and Cite
Goo, E.-H.; Kim, S.-S. Evaluating the Quality of Optimal MRCP Image Using RT-2D-Compressed SENSE(CS)Turbo Spin Echo: Comparing Respiratory Triggering(RT)-2D-SENSE Turbo Spin Echo and Breath Hold-2D-Single-Shot Turbo Spin Echo. Tomography 2022, 8, 1374-1385. https://doi.org/10.3390/tomography8030111
Goo E-H, Kim S-S. Evaluating the Quality of Optimal MRCP Image Using RT-2D-Compressed SENSE(CS)Turbo Spin Echo: Comparing Respiratory Triggering(RT)-2D-SENSE Turbo Spin Echo and Breath Hold-2D-Single-Shot Turbo Spin Echo. Tomography. 2022; 8(3):1374-1385. https://doi.org/10.3390/tomography8030111
Chicago/Turabian StyleGoo, Eun-Hoe, and Sung-Soo Kim. 2022. "Evaluating the Quality of Optimal MRCP Image Using RT-2D-Compressed SENSE(CS)Turbo Spin Echo: Comparing Respiratory Triggering(RT)-2D-SENSE Turbo Spin Echo and Breath Hold-2D-Single-Shot Turbo Spin Echo" Tomography 8, no. 3: 1374-1385. https://doi.org/10.3390/tomography8030111
APA StyleGoo, E.-H., & Kim, S.-S. (2022). Evaluating the Quality of Optimal MRCP Image Using RT-2D-Compressed SENSE(CS)Turbo Spin Echo: Comparing Respiratory Triggering(RT)-2D-SENSE Turbo Spin Echo and Breath Hold-2D-Single-Shot Turbo Spin Echo. Tomography, 8(3), 1374-1385. https://doi.org/10.3390/tomography8030111