Computerized Decision Support for Bladder Cancer Treatment Response Assessment in CT Urography: Effect on Diagnostic Accuracy in Multi-Institution Multi-Specialty Study
Abstract
:1. Introduction
2. Materials and Methods
2.1. Data Set
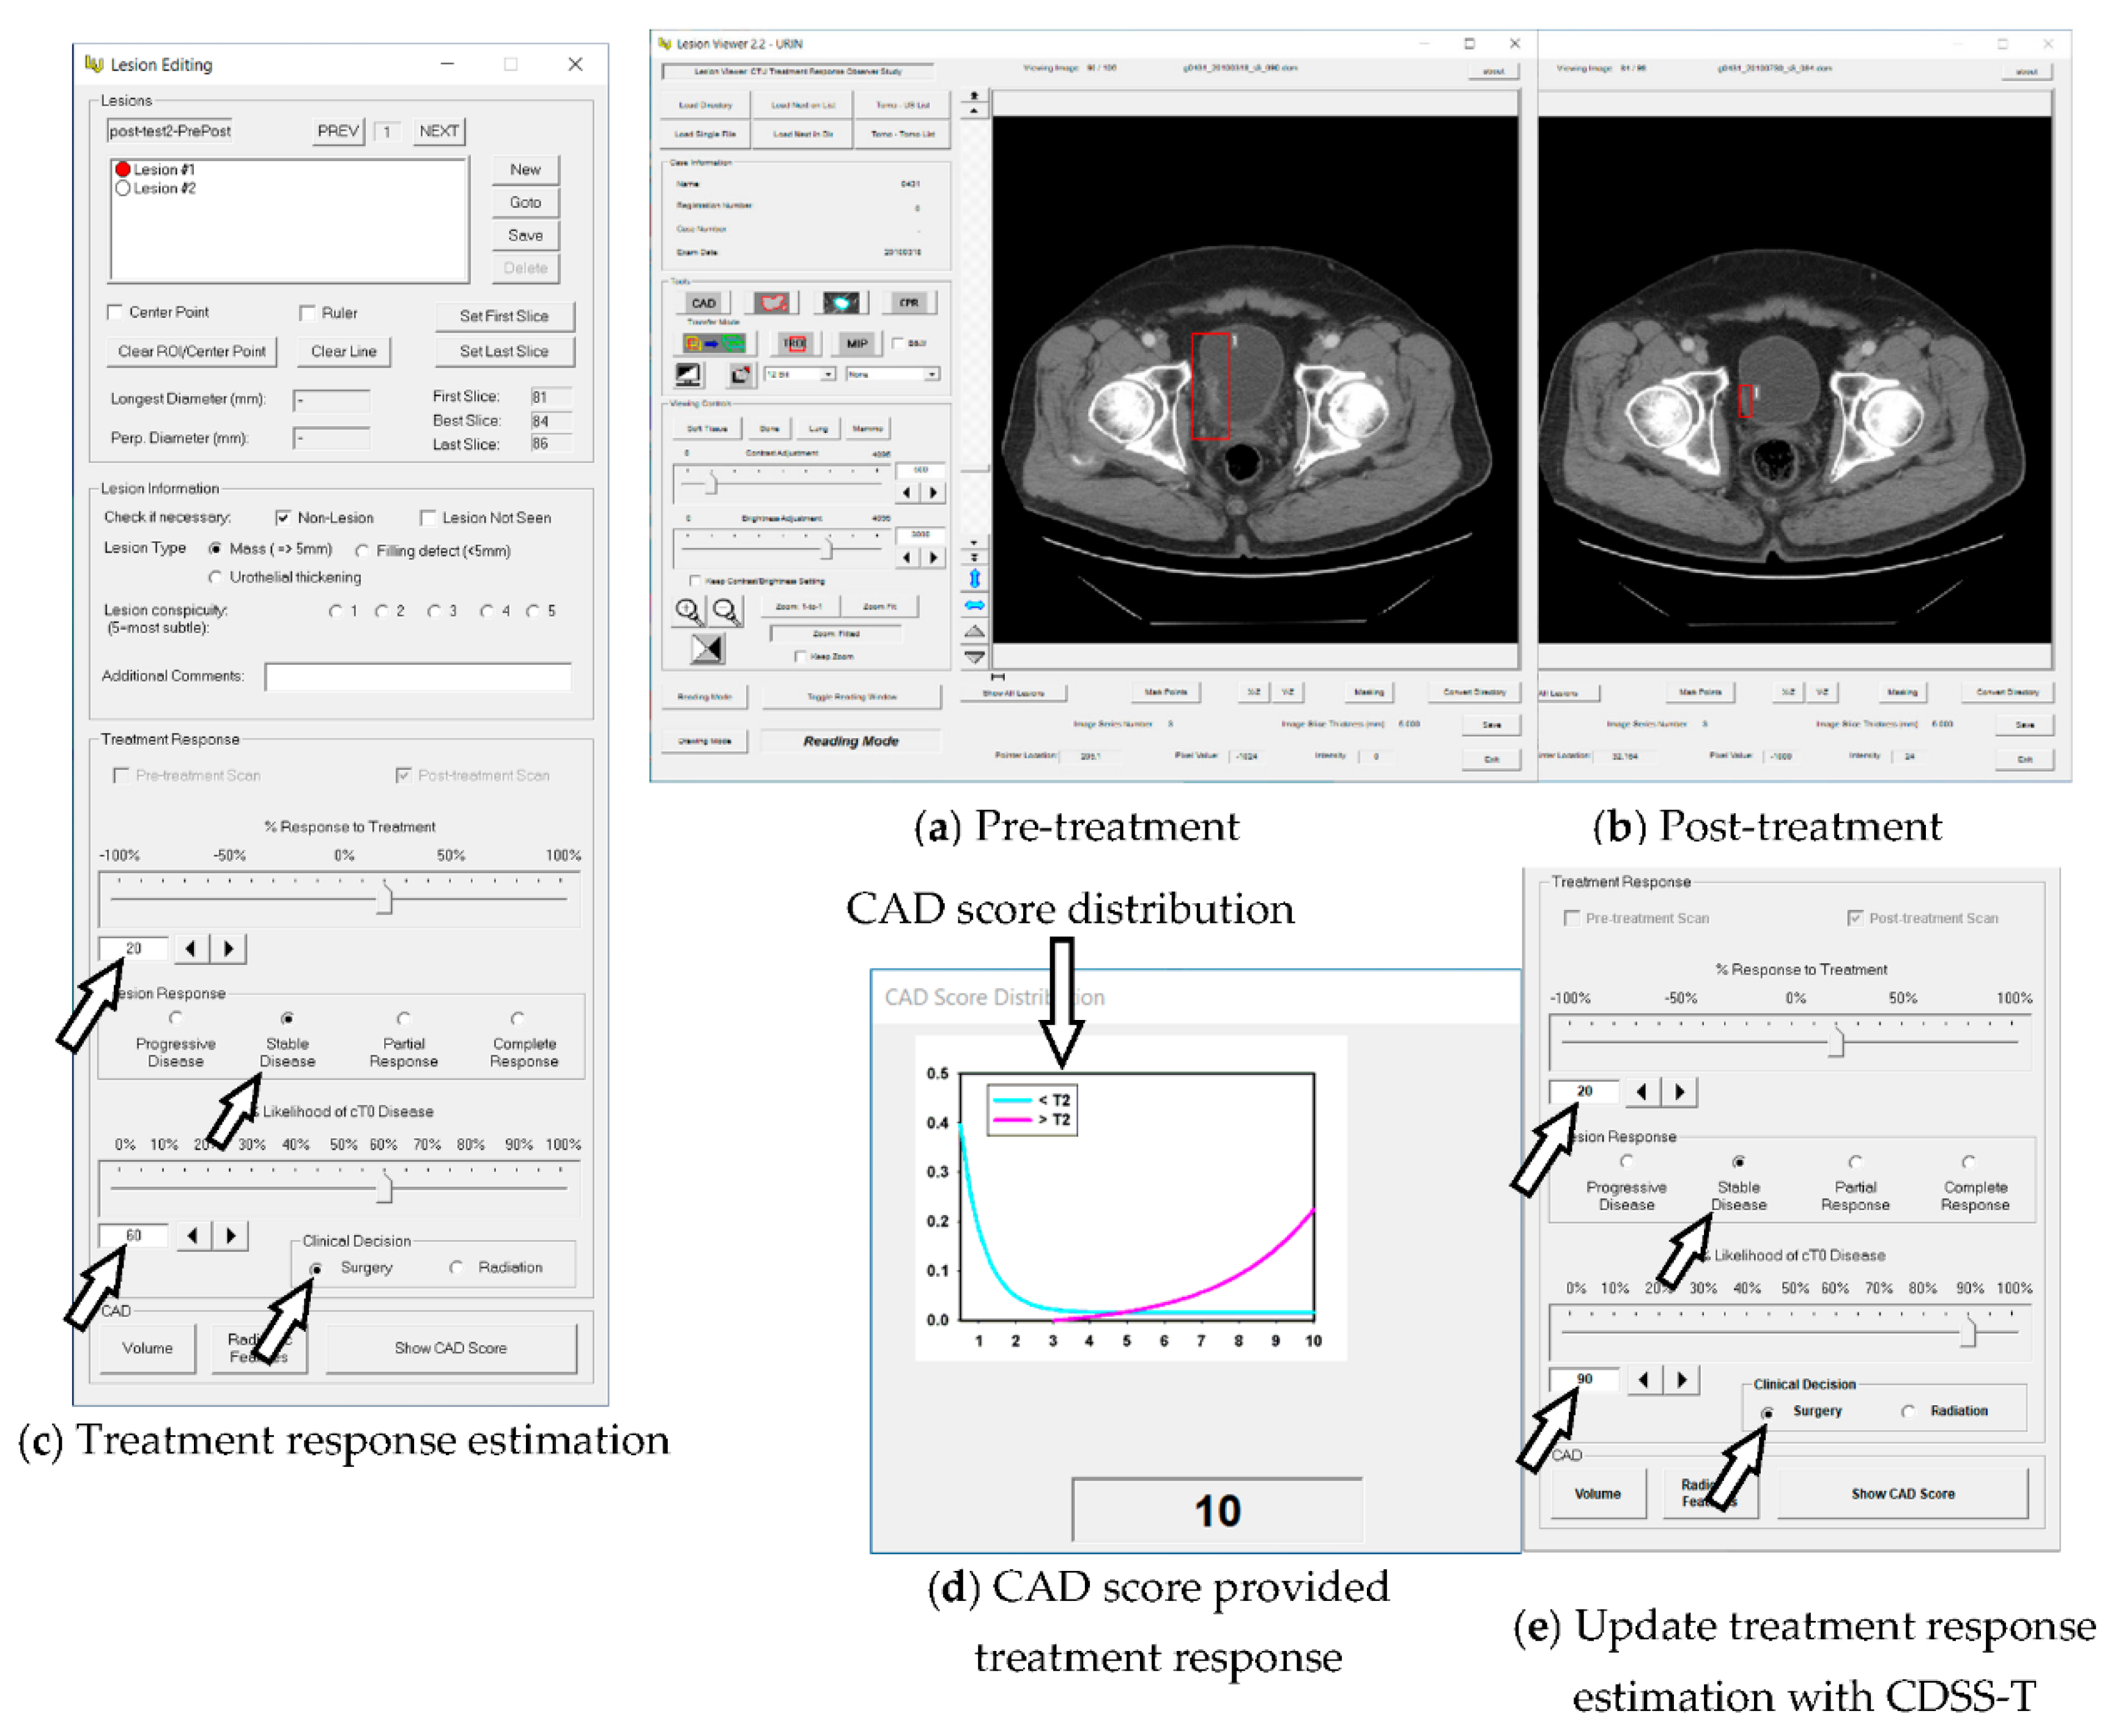
2.2. Computerized AI-Based Decision Support System for Treatment Response Assessment (CDSS-T)
2.3. DL-CNN Assessment Model
2.4. Radiomics Assessment Model
2.5. CAD Score
2.6. Observer Performance Study
2.7. Statistical Analysis
3. Results
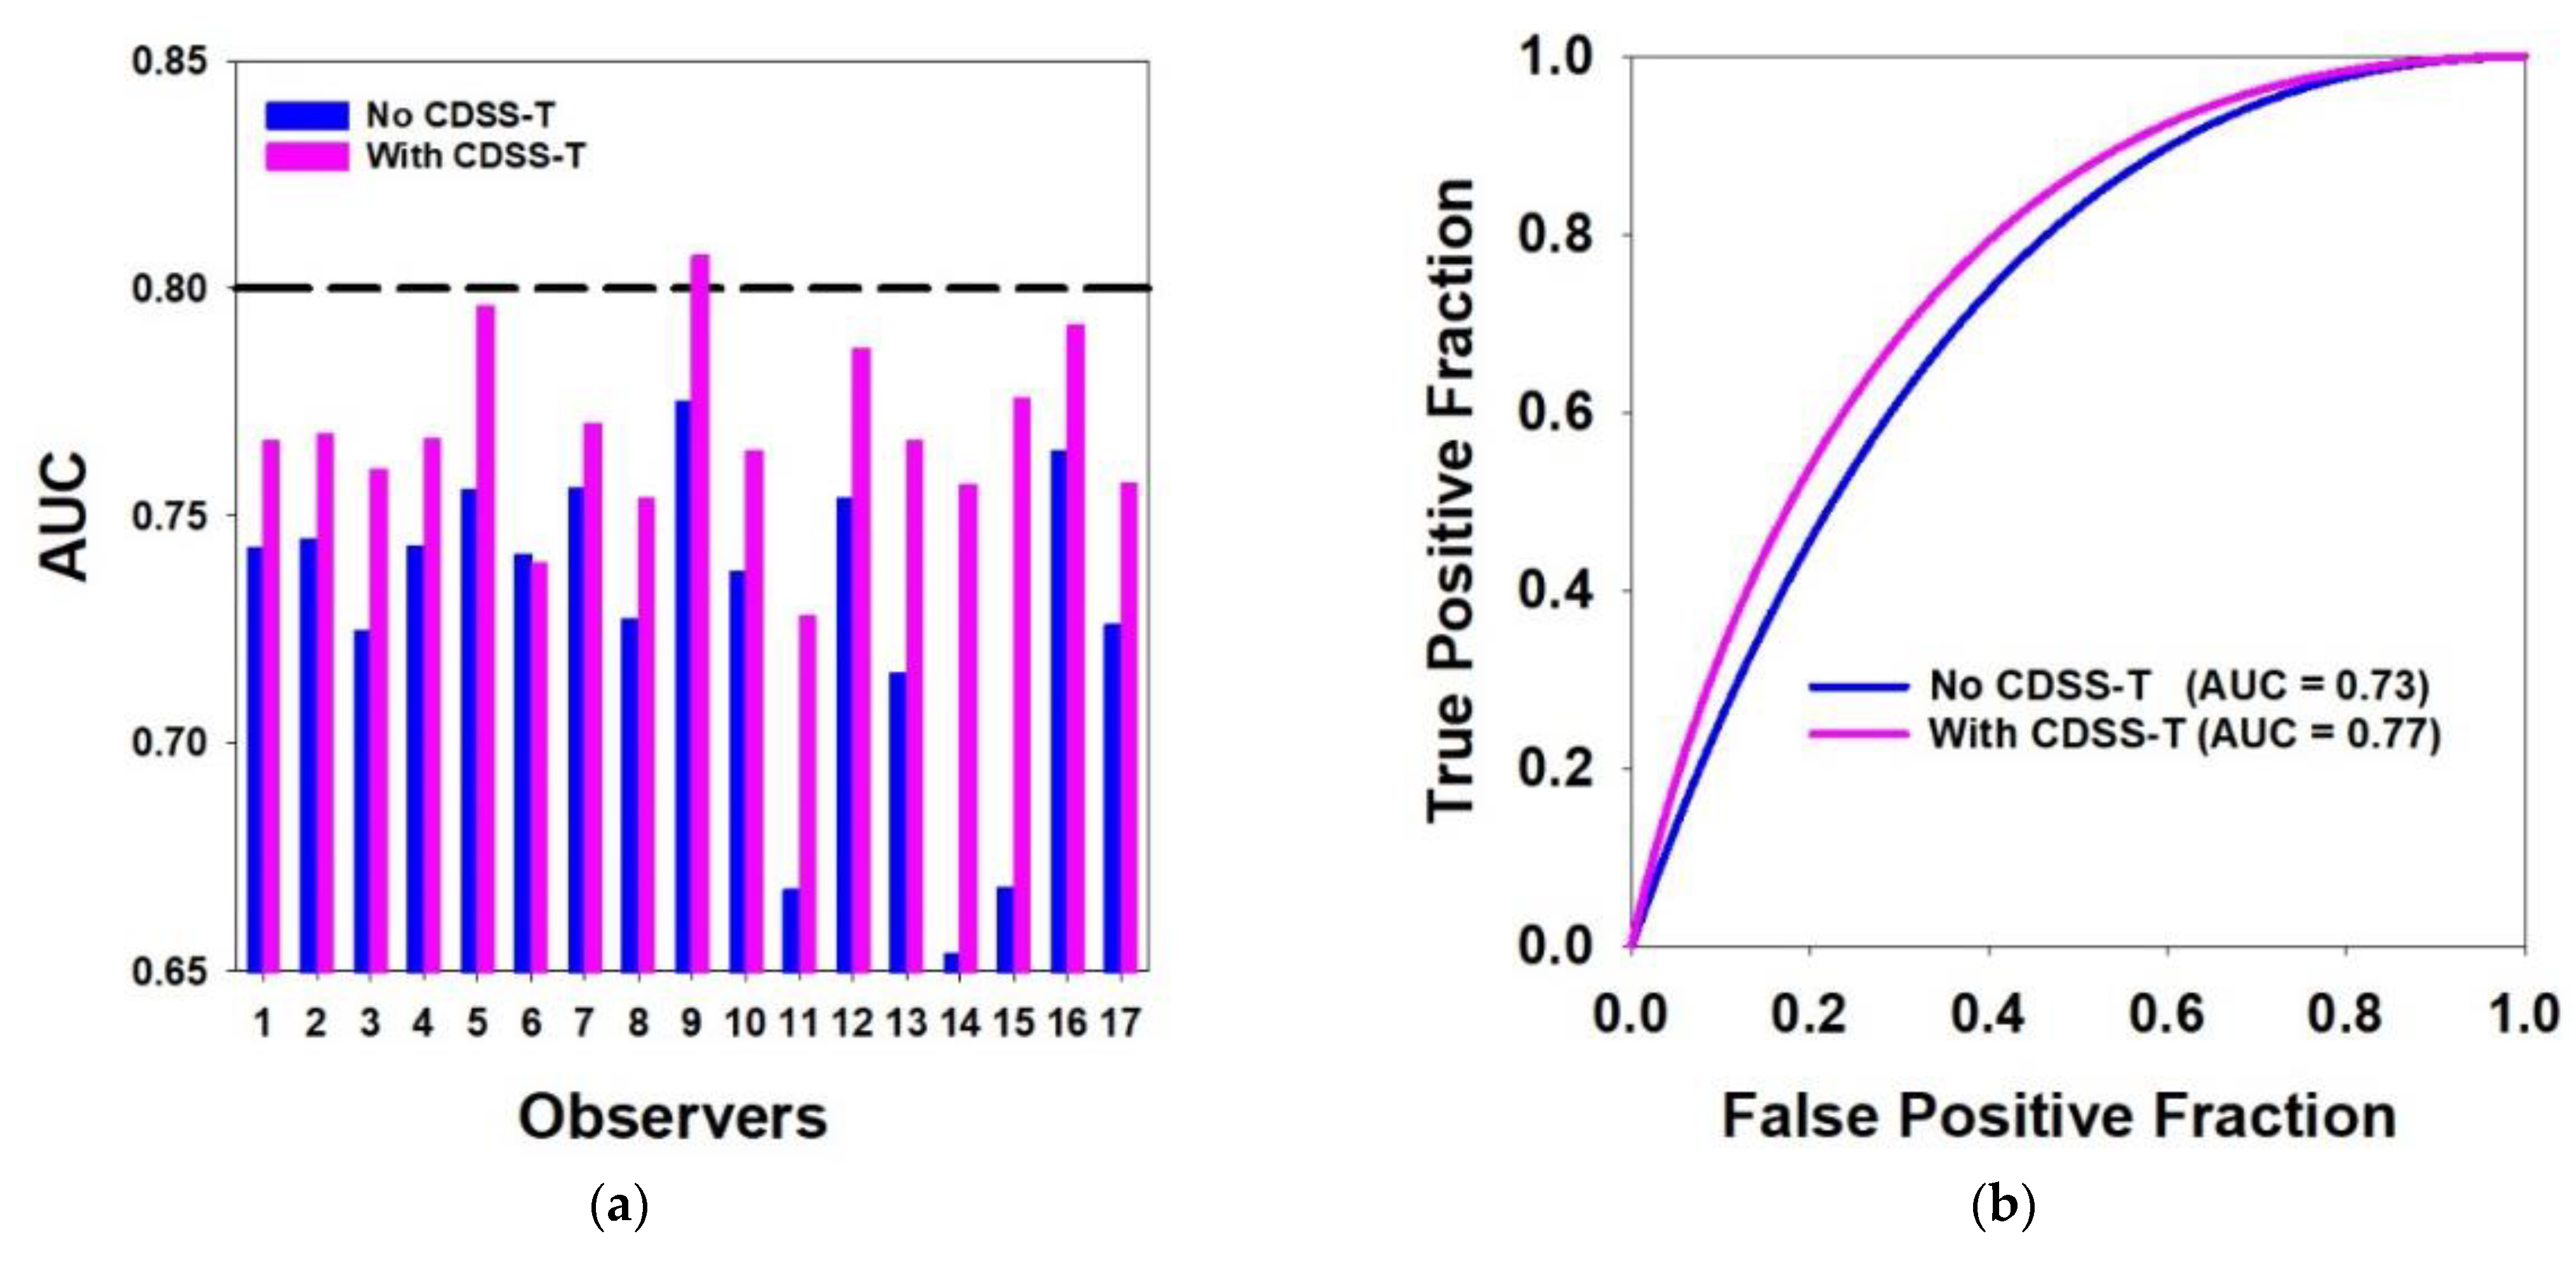
3.1. Overall Results for All Cancers
3.2. Easy vs. Difficult Cancer Subsets
3.3. Experienced vs. Inexperienced Observers
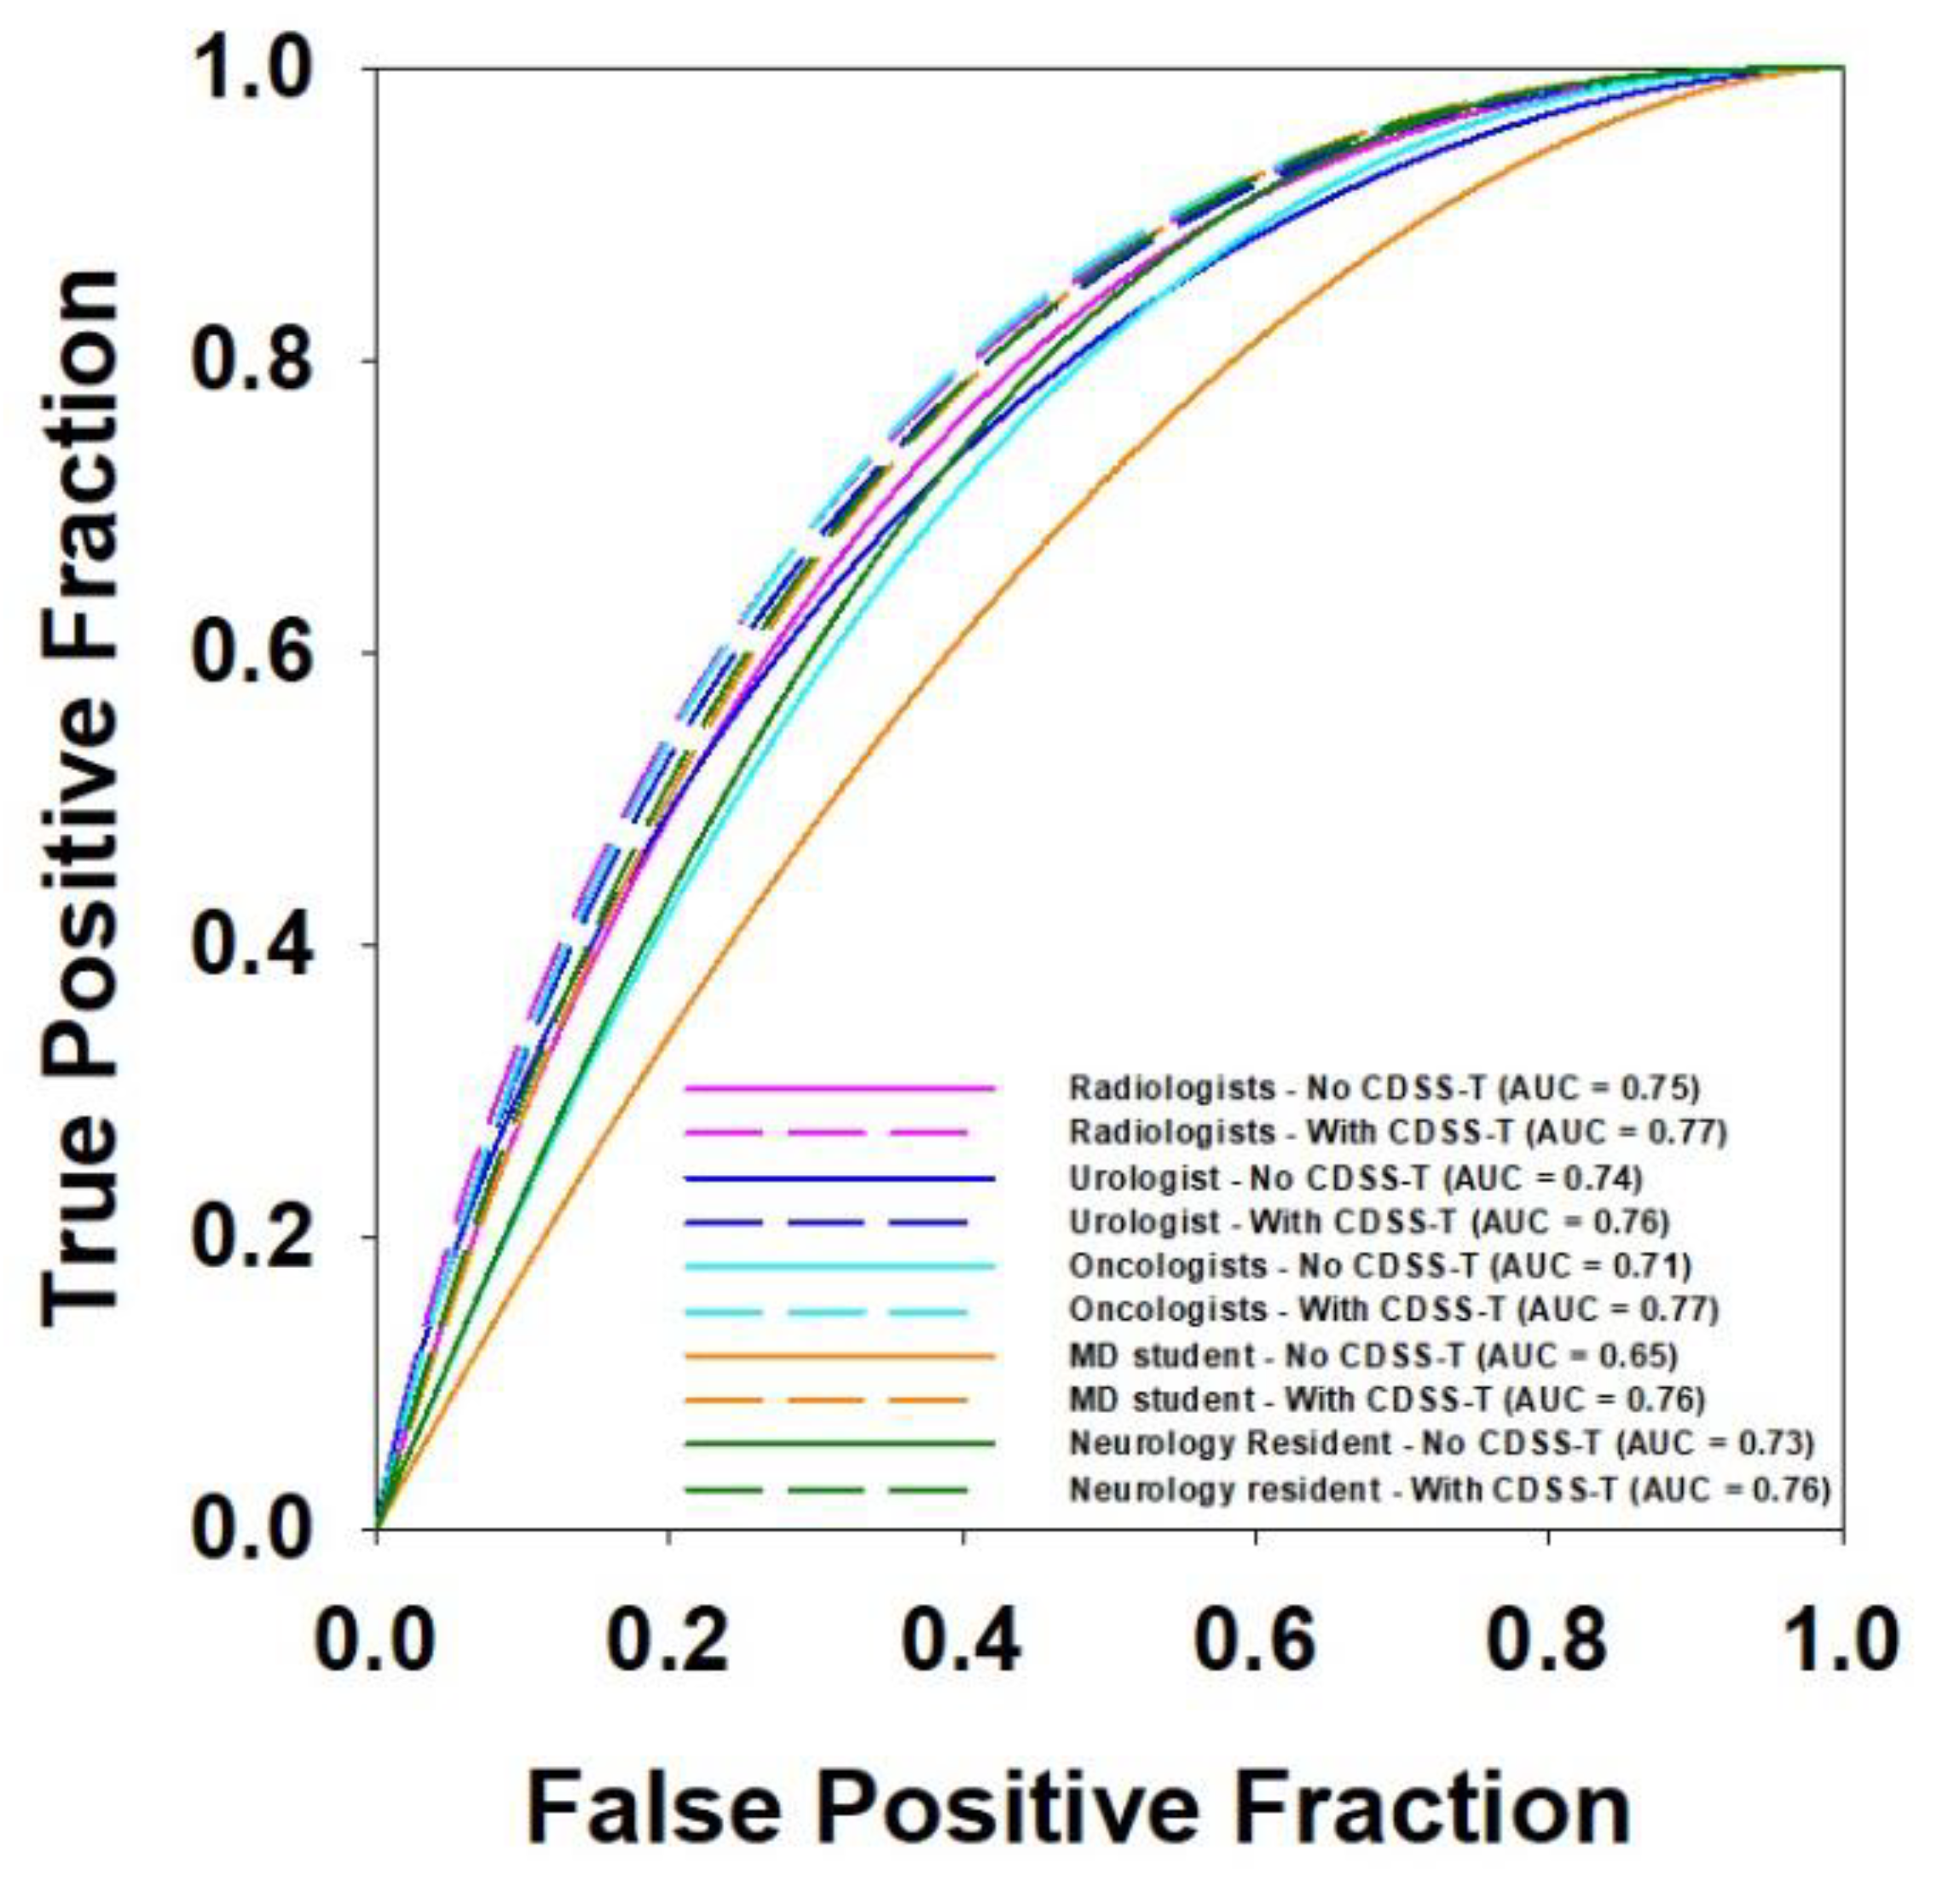
3.4. Multi-Specialty Observers
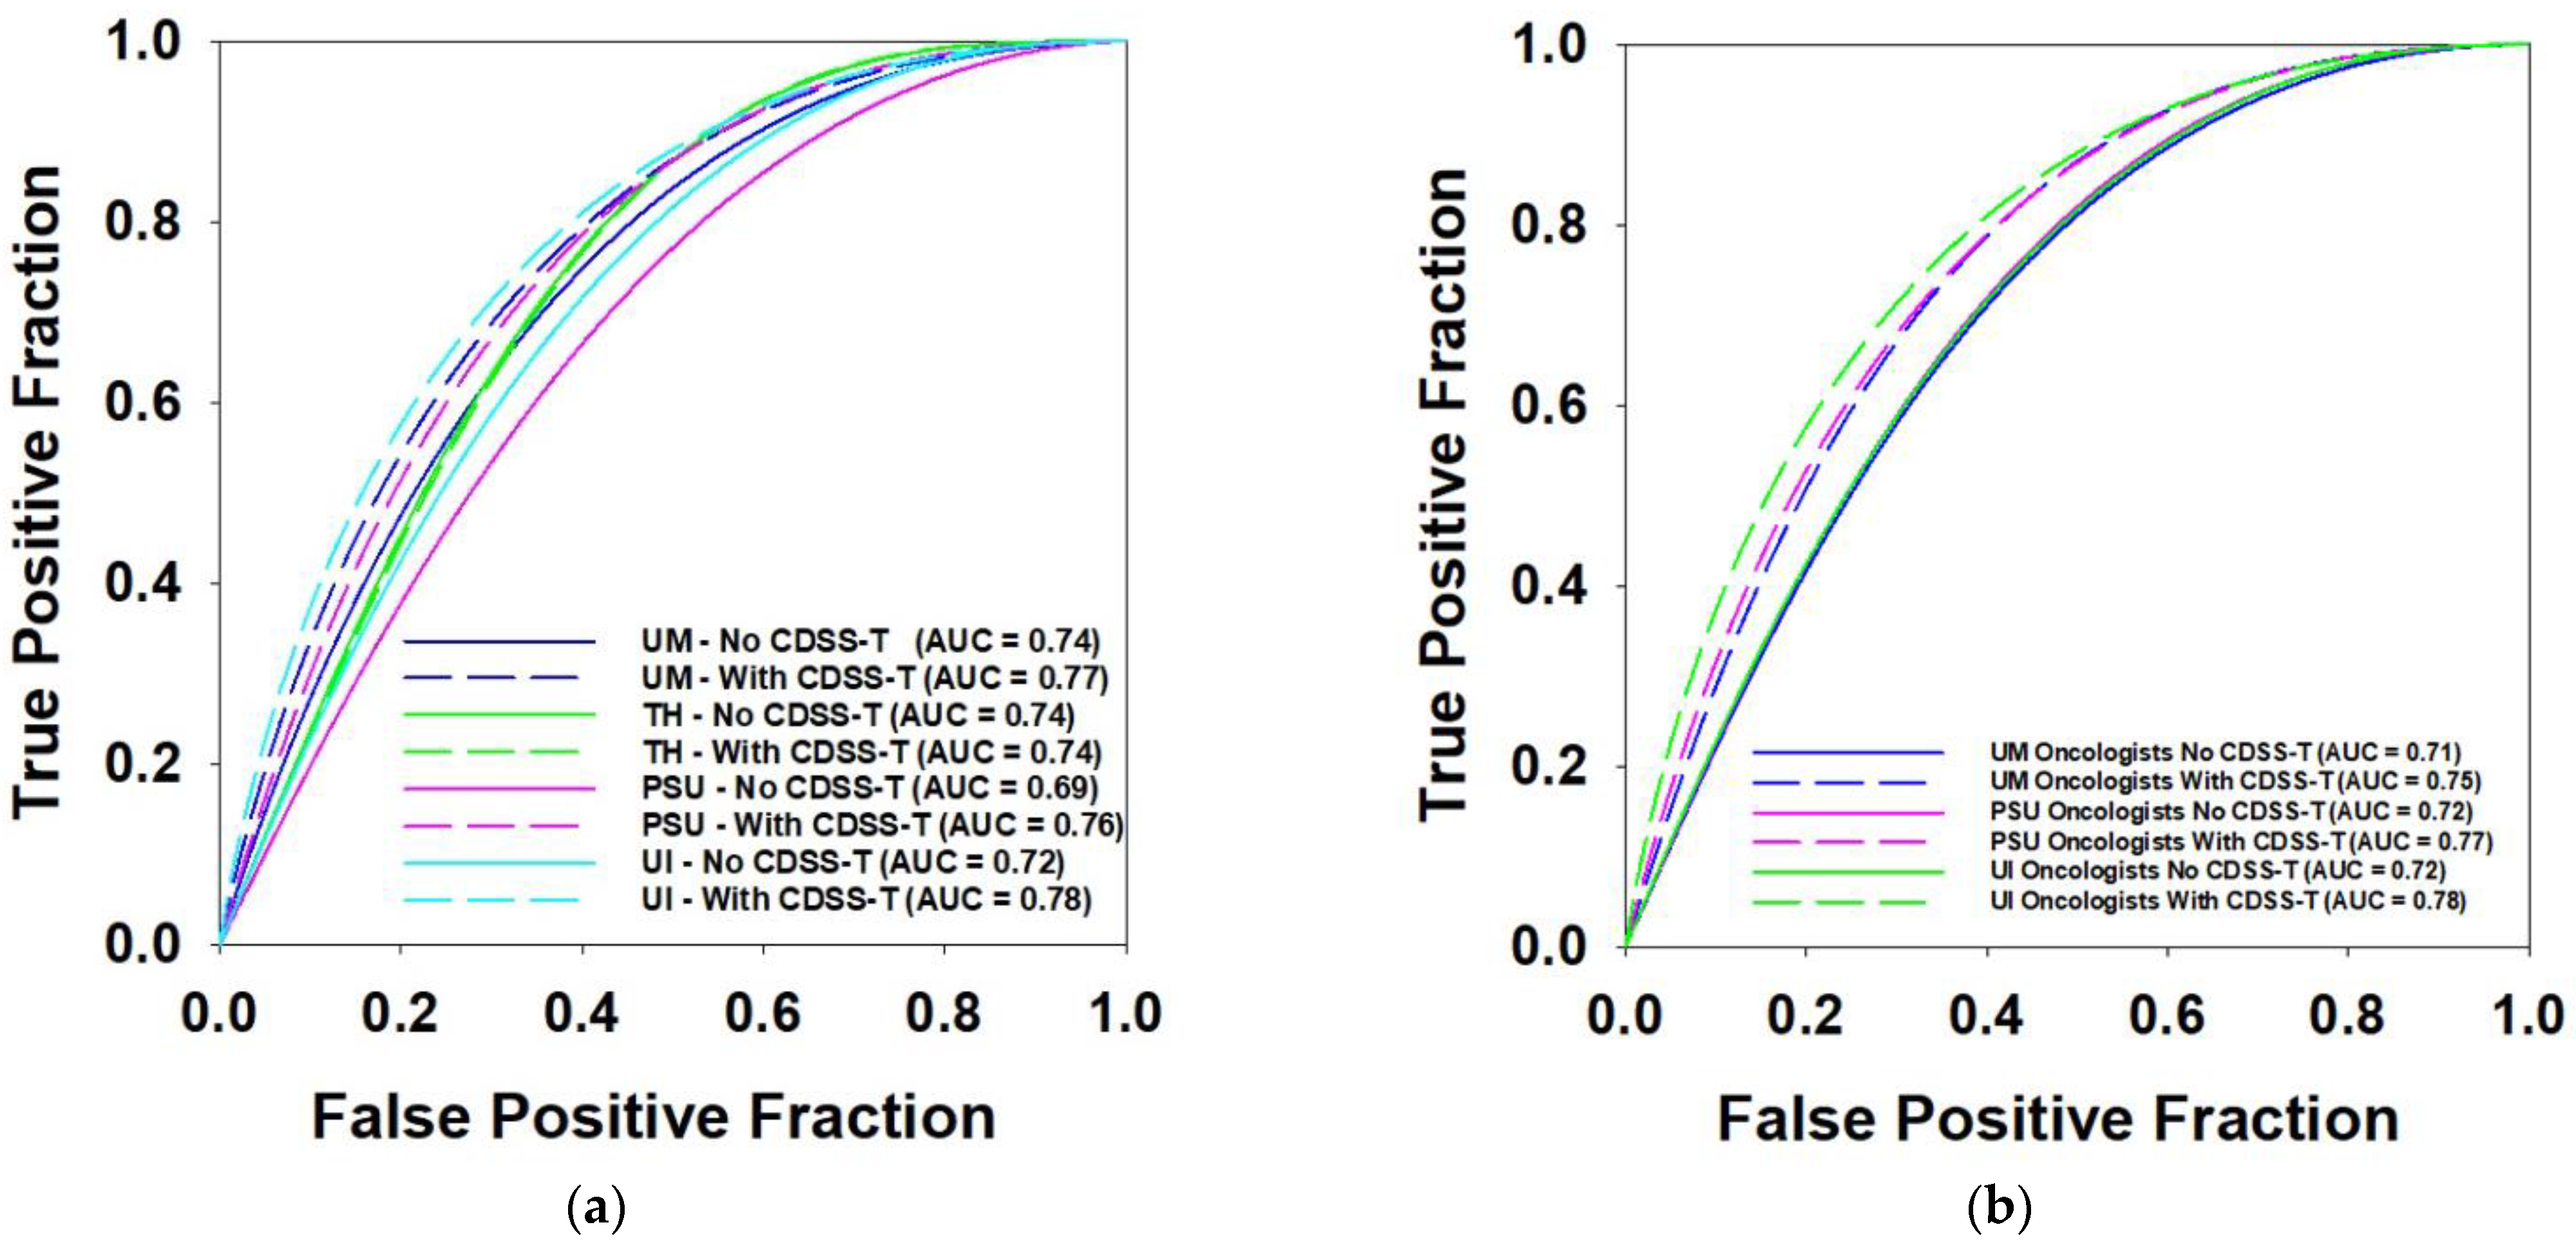
3.5. Multi-Institution Observers
3.6. Inter- and Intra-Observer Variability
3.6.1. Bland–Altman Analysis
3.6.2. Krippendorff’s Alpha Method
4. Discussion
5. Conclusions
Author Contributions
Funding
Institutional Review Board Statement
Informed Consent Statement
Data Availability Statement
Conflicts of Interest
Abbreviations
References
- American Cancer Society. Cancer Facts & Figures 2021; American Cancer Society: Atlanta, GA, USA, 2021. [Google Scholar]
- Fagg, S.L.; Dawson-Edwards, P.; Hughes, M.; Latief, T.; Rolfe, E.; Fielding, J. Cis-diamminedichloroplatinum (DDP) as Initial Treatment of lnvasive Bladder Cancer. Br. J. Urol. 1984, 56, 296–300. [Google Scholar] [CrossRef] [PubMed]
- Raghavan, D.; Pearson, B.; Coorey, G.; Arnold, D.; Smith, J.; Donovan, J.; Langdon, P.; Woods, W. Intravenous cis-platinum for invasive bladder cancer: Safety and feasibility of a new approach. Med. J. Aust. 1984, 140, 276–278. [Google Scholar] [CrossRef] [PubMed]
- Meeks, J.J.; Bellmunt, J.; Bochner, B.H.; Clarke, N.W.; Daneshmand, S.; Galsky, M.D.; Hahn, N.M.; Lerner, S.P.; Mason, M.; Powles, T. A systematic review of neoadjuvant and adjuvant chemotherapy for muscle-invasive bladder cancer. Eur. Urol. 2012, 62, 523–533. [Google Scholar] [CrossRef] [PubMed]
- Witjes, J.; Wullink, M.; Oosterhof, G.; De Mulder, P. Toxicity and results of MVAC (methotrexate, vinblastine, adriamycin and cisplatin) chemotherapy in advanced urothelial carcinoma. Eur. Urol. 1997, 31, 414–419. [Google Scholar] [CrossRef] [PubMed]
- Cha, K.H.; Hadjiiski, L.M.; Cohan, R.H.; Chan, H.-P.; Caoili, E.M.; Davenport, M.S.; Samala, R.K.; Weizer, A.Z.; Alva, A.; Kirova-Nedyalkova, G. Diagnostic accuracy of CT for prediction of bladder cancer treatment response with and without computerized decision support. Acad. Radiol. 2019, 26, 1137–1145. [Google Scholar] [CrossRef] [PubMed]
- Cha, K.H.; Hadjiiski, L.; Chan, H.-P.; Weizer, A.Z.; Alva, A.; Cohan, R.H.; Caoili, E.M.; Paramagul, C.; Samala, R.K. Bladder cancer treatment response assessment in CT using radiomics with deep-learning. Sci. Rep. 2017, 7, 8738. [Google Scholar] [CrossRef] [PubMed]
- Hadjiiski, L.M.; Cha, K.H.; Cohan, R.H.; Chan, H.-P.; Caoili, E.M.; Davenport, M.S.; Samala, R.K.; Weizer, A.Z.; Alva, A.; Kirova-Nedyalkova, G. Intraobserver variability in bladder cancer treatment response assessment with and without computerized decision support. Tomography 2020, 6, 194–202. [Google Scholar] [CrossRef] [PubMed]
- Hadjiiski, L.M.; Joshi, M.; Alva, A.; Chan, H.-P.; Cohan, R.H.; Caoili, E.M.; Kirova-Nedyalkova, G.; Davenport, M.S.; Shankar, P.R.; Francis, I.R. Multi-institutional observer performance study for bladder cancer treatment response assessment in CT urography with and without computerized decision support. In Proceedings of the SPIE 11597 Medical Imaging 2021: Computer-Aided Diagnosis, Online, 18 February 2021; Springer: Singapore, 2021. [Google Scholar] [CrossRef]
- Hadjiiski, L.; Chan, H.-P.; Caoili, E.M.; Cohan, R.H.; Wei, J.; Zhou, C. Auto-initialized cascaded level set (AI-CALS) segmentation of bladder lesions on multidetector row CT urography. Acad. Radiol. 2013, 20, 148–155. [Google Scholar] [CrossRef] [PubMed] [Green Version]
- Sahiner, B.; Chan, H.P.; Petrick, N.; Helvie, M.A.; Hadjiiski, L.M. Improvement of mammographic mass characterization using spiculation measures and morphological features. Med. Phys. 2001, 28, 1455–1465. [Google Scholar] [CrossRef] [PubMed]
- Way, T.W.; Hadjiiski, L.M.; Sahiner, B.; Chan, H.P.; Cascade, P.N.; Kazerooni, E.A.; Bogot, N.; Zhou, C. Computer-aided diagnosis of pulmonary nodules on CT scans: Segmentation and classification using 3D active contours. Med. Phys. 2006, 33, 2323–2337. [Google Scholar] [CrossRef] [PubMed] [Green Version]
- Way, T.W.; Sahiner, B.; Chan, H.P.; Hadjiiski, L.; Cascade, P.N.; Chughtai, A.; Bogot, N.; Kazerooni, E. Computer-aided diagnosis of pulmonary nodules on CT scans: Improvement of classification performance with nodule surface features. Med. Phys. 2009, 36, 3086–3098. [Google Scholar] [CrossRef] [PubMed] [Green Version]
- Eisenhauer, E.A.; Therasse, P.; Bogaerts, J.; Schwartz, L.H.; Sargent, D.; Ford, R.; Dancey, J.; Arbuck, S.; Gwyther, S.; Mooney, M. New response evaluation criteria in solid tumours: Revised RECIST guideline (version 1.1). Eur. J. Cancer 2009, 45, 228–247. [Google Scholar] [CrossRef] [PubMed]
- Berbaum, K.S.; Metz, C.E.; Pesce, L.L.; Schartz, K.M. DBM MRMC 2.1, Beta Version 2. Available online: http://perception.radiology.uiowa.edu; http://xray.bsd.uchicago.edu/krl/ (accessed on 1 January 2021).
- Gallas, B.D.; Bandos, A.; Samuelson, F.W.; Wagner, R.F. A framework for random-effects ROC analysis: Biases with the bootstrap and other variance estimators. Commun. Stat. Theory Methods 2009, 38, 2586–2603. [Google Scholar] [CrossRef]
- Krippendorff, K. Measuring the reliability of qualitative text analysis data. Qual. Quant. 2004, 38, 787–800. [Google Scholar] [CrossRef] [Green Version]
- Petrick, N.; Sahiner, B.; Armato III, S.G.; Bert, A.; Correale, L.; Delsanto, S.; Freedman, M.T.; Fryd, D.; Gur, D.; Hadjiiski, L. Evaluation of computer-aided detection and diagnosis systems. Med. Phys. 2013, 40, 087001. [Google Scholar] [CrossRef] [PubMed] [Green Version]


| Characteristics | Notes | Detail | Total Number | |
|---|---|---|---|---|
| Patient gender and age | 100 males | Mean: 63 years Range: 43–84 years | 123 patients | |
| 23 females | Mean: 63 years Range: 37–82 years | |||
| Average maximum diameter (mm) | Completely responding cancers (T0 stage) | Pre-treatment: 30.1 Post-treatment: 14.3 | 157 cancer pairs | |
| Incompletely responding cancers (>T0 stage) | Pre-treatment: 43.0 Post-treatment: 31.2 | |||
| Cancer stage | Pre-treatment | Post-treatment | 157 cancer pairs | |
| T0 | 0 | 40 | ||
| T1 | 8 | 37 | ||
| T2 | 76 | 23 | ||
| T3 | 63 | 38 | ||
| T4 | 10 | 19 | ||
| Specialty | Observer Number | Proficiency | Institution | |||
|---|---|---|---|---|---|---|
| UM | UI | PSU | TH | |||
| Abdominal Radiologist | 5 | Experienced | 4 | - | - | 1 |
| Diagnostic Radiology Resident | 4 | Inexperienced | 4 | - | - | - |
| Urologist | 1 | Experienced | 1 | - | - | - |
| Oncologist | 5 | Experienced | 2 | 2 | 1 | - |
| Medical Student | 1 | Inexperienced | - | - | 1 | - |
| Neurology Fellow | 1 | Inexperienced | 1 | - | - | - |
| Observer # | AUC without CDSS-T | AUC with CDSS-T | Individual p Value |
|---|---|---|---|
| 1 | 0.74 | 0.77 | 0.155 |
| 2 | 0.75 | 0.77 | 0.260 |
| 3 | 0.73 | 0.76 | 0.013 * |
| 4 | 0.74 | 0.77 | 0.128 |
| 5 | 0.76 | 0.80 | 0.010 * |
| 6 | 0.74 | 0.74 | 0.861 |
| 7 | 0.76 | 0.77 | 0.541 |
| 8 | 0.73 | 0.75 | 0.135 |
| 9 | 0.78 | 0.81 | 0.191 |
| 10 | 0.74 | 0.76 | 0.244 |
| 11 | 0.67 | 0.73 | 0.014 * |
| 12 | 0.75 | 0.79 | 0.095 |
| 13 | 0.72 | 0.77 | 0.027 * |
| 14 | 0.65 | 0.76 | 0.020 * |
| 15 | 0.67 | 0.78 | 0.003 * |
| 16 | 0.76 | 0.79 | 0.026 * |
| 17 | 0.73 | 0.76 | 0.083 |
| Mean AUC | 0.73 | 0.77 | 0.002 *,$ |
| Standard Deviation | 0.04 | 0.02 | - |
| AUC of CDSS-T | Average AUC without CDSS-T | Average AUC with CDSS-T | p Value | # of Physicians | |
|---|---|---|---|---|---|
| Easy Subset | 0.88 | 0.80 | 0.84 | 0.016 * | 17 physicians |
| Difficult Subset | 0.67 | 0.58 | 0.62 | 0.148 | |
| Easy Subset | 0.88 | 0.83 | 0.85 | 0.033 * | 9 radiologists |
| Difficult Subset | 0.67 | 0.59 | 0.61 | 0.379 | |
| Easy Subset | 0.88 | 0.78 | 0.84 | 0.051 | 5 oncologists |
| Difficult Subset | 0.67 | 0.57 | 0.63 | 0.009 * |
| AUC of CDSS-T | Average AUC without CDSS-T | Average AUC with CDSS-T | p Value | # of Physicians | |
|---|---|---|---|---|---|
| Experienced Physicians | 0.80 | 0.73 | 0.77 | 0.007 * | 5 abdominal radiologists, 1 urologist, and 5 oncologists |
| Inexperienced Physicians | 0.73 | 0.77 | 0.019 * | 5 residents and 1 medical student | |
| Experienced Radiologists | 0.75 | 0.77 | 0.060 | 5 abdominal radiologists | |
| Inexperienced Radiologists | 0.74 | 0.77 | 0.007 * | 4 radiology residents | |
| UM Experienced Radiologists | 0.75 | 0.77 | 0.018 * | 4 abdominal radiologists from UM | |
| UM Inexperienced Radiologists | 0.74 | 0.77 | 0.007 * | 4 radiology residents from UM |
| AUC of CDSS-T | Average AUC without CDSS-T | Average AUC with CDSS-T | p Value | # of Physicians | |
|---|---|---|---|---|---|
| Radiologists | 0.80 | 0.75 | 0.77 | 0.014 * | 9 |
| Urologist | 0.74 | 0.76 | 0.244 | 1 | |
| Oncologists | 0.71 | 0.77 | 0.011 * | 5 | |
| Medical Student | 0.65 | 0.76 | 0.020 * | 1 | |
| Neurology Fellow | 0.73 | 0.76 | 0.083 | 1 |
| AUC of CDSS-T | Average AUC without CDSS-T | Average AUC with CDSS-T | p Value | # of Physicians | |
|---|---|---|---|---|---|
| UM Physicians | 0.8 | 0.74 | 0.77 | 0.002 * | 12 |
| TH Physician | 0.74 | 0.74 | 0.861 | 1 | |
| PSU Physicians | 0.69 | 0.76 | 0.117 | 2 | |
| UI Physicians | 0.72 | 0.78 | 0.326 | 2 | |
| UM Oncologists | 0.71 | 0.76 | 0.071 | 2 | |
| PSU Oncologist | 0.72 | 0.77 | 0.027 * | 1 | |
| UI Oncologists | 0.72 | 0.78 | 0.326 | 2 |
| Observer # | AUC Original Evaluation | AUC Repeated Evaluation | ||
|---|---|---|---|---|
| Without CDSS-T | With CDSS-T | Without CDSS-T | With CDSS-T | |
| 1 | 0.75 ± 0.08 | 0.76 ± 0.08 | 0.8 ± 0.07 | 0.79 ± 0.07 |
| 2 | 0.88 ± 0.05 | 0.91 ± 0.04 | 0.88 ± 0.05 | 0.92 ± 0.03 |
| 3 | 0.65 ± 0.10 | 0.72 ± 0.10 | 0.67 ± 0.10 | 0.72 ± 0.09 |
| 4 | 0.71 ± 0.09 | 0.71 ± 0.09 | 0.69 ± 0.09 | 0.71 ± 0.08 |
| 5 | 0.70 ± 0.07 | 0.78 ± 0.06 | 0.82 ± 0.06 | 0.83 ± 0.05 |
| 6 | 0.82 ± 0.07 | 0.85 ± 0.07 | 0.81 ± 0.07 | 0.81 ± 0.07 |
| 7 | 0.75 ± 0.08 | 0.77 ± 0.08 | 0.84 ± 0.05 | 0.87 ± 0.05 |
| 8 | 0.74 ± 0.09 | 0.77 ± 0.08 | 0.81 ± 0.08 | 0.8 ± 0.08 |
| 9 | 0.81 ± 0.06 | 0.85 ± 0.05 | 0.8 ± 0.06 | 0.85 ± 0.05 |
| 10 | 0.79 ± 0.08 | 0.84 ± 0.07 | 0.8 ± 0.07 | 0.87 ± 0.07 |
| 11 | 0.65 ± 0.08 | 0.75 ± 0.08 | 0.73 ± 0.07 | 0.78 ± 0.07 |
| 12 | 0.81 ± 0.07 | 0.85 ± 0.07 | 0.75 ± 0.08 | 0.76 ± 0.07 |
| 13 | 0.81 ± 0.06 | 0.89 ± 0.04 | 0.77 ± 0.07 | 0.83 ± 0.06 |
| 14 | 0.59 ± 0.10 | 0.82 ± 0.07 | 0.69 ± 0.10 | 0.81 ± 0.07 |
| 15 | 0.73 ± 0.07 | 0.88 ± 0.06 | 0.64 ± 0.10 | 0.83 ± 0.07 |
| 16 | 0.86 ± 0.05 | 0.93 ± 0.03 | 0.87 ± 0.05 | 0.87 ± 0.05 |
| 17 | 0.63 ± 0.08 | 0.69 ± 0.08 | 0.68 ± 0.10 | 0.76 ± 0.09 |
| Mean AUC | 0.75 | 0.81 | 0.77 | 0.81 |
| Standard Deviation | 0.08 | 0.07 | 0.07 | 0.06 |
| Statistical significance in the difference of AUC: | ||||
| AUC (orig.without) versus AUC (orig.with): p = 0.003 * | ||||
| AUC (repeat.without) versus AUC (repeat.with): p = 0.006 * | ||||
| AUC (orig.without) versus AUC (repeat.without): p = 0.217 | ||||
| AUC (orig.with) versus AUC (repeat.with): p = 0.692 | ||||
Publisher’s Note: MDPI stays neutral with regard to jurisdictional claims in published maps and institutional affiliations. |
© 2022 by the authors. Licensee MDPI, Basel, Switzerland. This article is an open access article distributed under the terms and conditions of the Creative Commons Attribution (CC BY) license (https://creativecommons.org/licenses/by/4.0/).
Share and Cite
Sun, D.; Hadjiiski, L.; Alva, A.; Zakharia, Y.; Joshi, M.; Chan, H.-P.; Garje, R.; Pomerantz, L.; Elhag, D.; Cohan, R.H.; et al. Computerized Decision Support for Bladder Cancer Treatment Response Assessment in CT Urography: Effect on Diagnostic Accuracy in Multi-Institution Multi-Specialty Study. Tomography 2022, 8, 644-656. https://doi.org/10.3390/tomography8020054
Sun D, Hadjiiski L, Alva A, Zakharia Y, Joshi M, Chan H-P, Garje R, Pomerantz L, Elhag D, Cohan RH, et al. Computerized Decision Support for Bladder Cancer Treatment Response Assessment in CT Urography: Effect on Diagnostic Accuracy in Multi-Institution Multi-Specialty Study. Tomography. 2022; 8(2):644-656. https://doi.org/10.3390/tomography8020054
Chicago/Turabian StyleSun, Di, Lubomir Hadjiiski, Ajjai Alva, Yousef Zakharia, Monika Joshi, Heang-Ping Chan, Rohan Garje, Lauren Pomerantz, Dean Elhag, Richard H. Cohan, and et al. 2022. "Computerized Decision Support for Bladder Cancer Treatment Response Assessment in CT Urography: Effect on Diagnostic Accuracy in Multi-Institution Multi-Specialty Study" Tomography 8, no. 2: 644-656. https://doi.org/10.3390/tomography8020054
APA StyleSun, D., Hadjiiski, L., Alva, A., Zakharia, Y., Joshi, M., Chan, H.-P., Garje, R., Pomerantz, L., Elhag, D., Cohan, R. H., Caoili, E. M., Kerr, W. T., Cha, K. H., Kirova-Nedyalkova, G., Davenport, M. S., Shankar, P. R., Francis, I. R., Shampain, K., Meyer, N., ... Matuszak, M. (2022). Computerized Decision Support for Bladder Cancer Treatment Response Assessment in CT Urography: Effect on Diagnostic Accuracy in Multi-Institution Multi-Specialty Study. Tomography, 8(2), 644-656. https://doi.org/10.3390/tomography8020054


