
Microscopic Fractional Anisotropy Detects Cognitive Training-Induced Microstructural Brain Changes

 ,
,
Abstract
:1. Introduction
2. Materials and Methods
2.1. Participants
2.2. Procedures
2.3. Cognitive Training
2.3.1. ANT
2.3.2. DBT
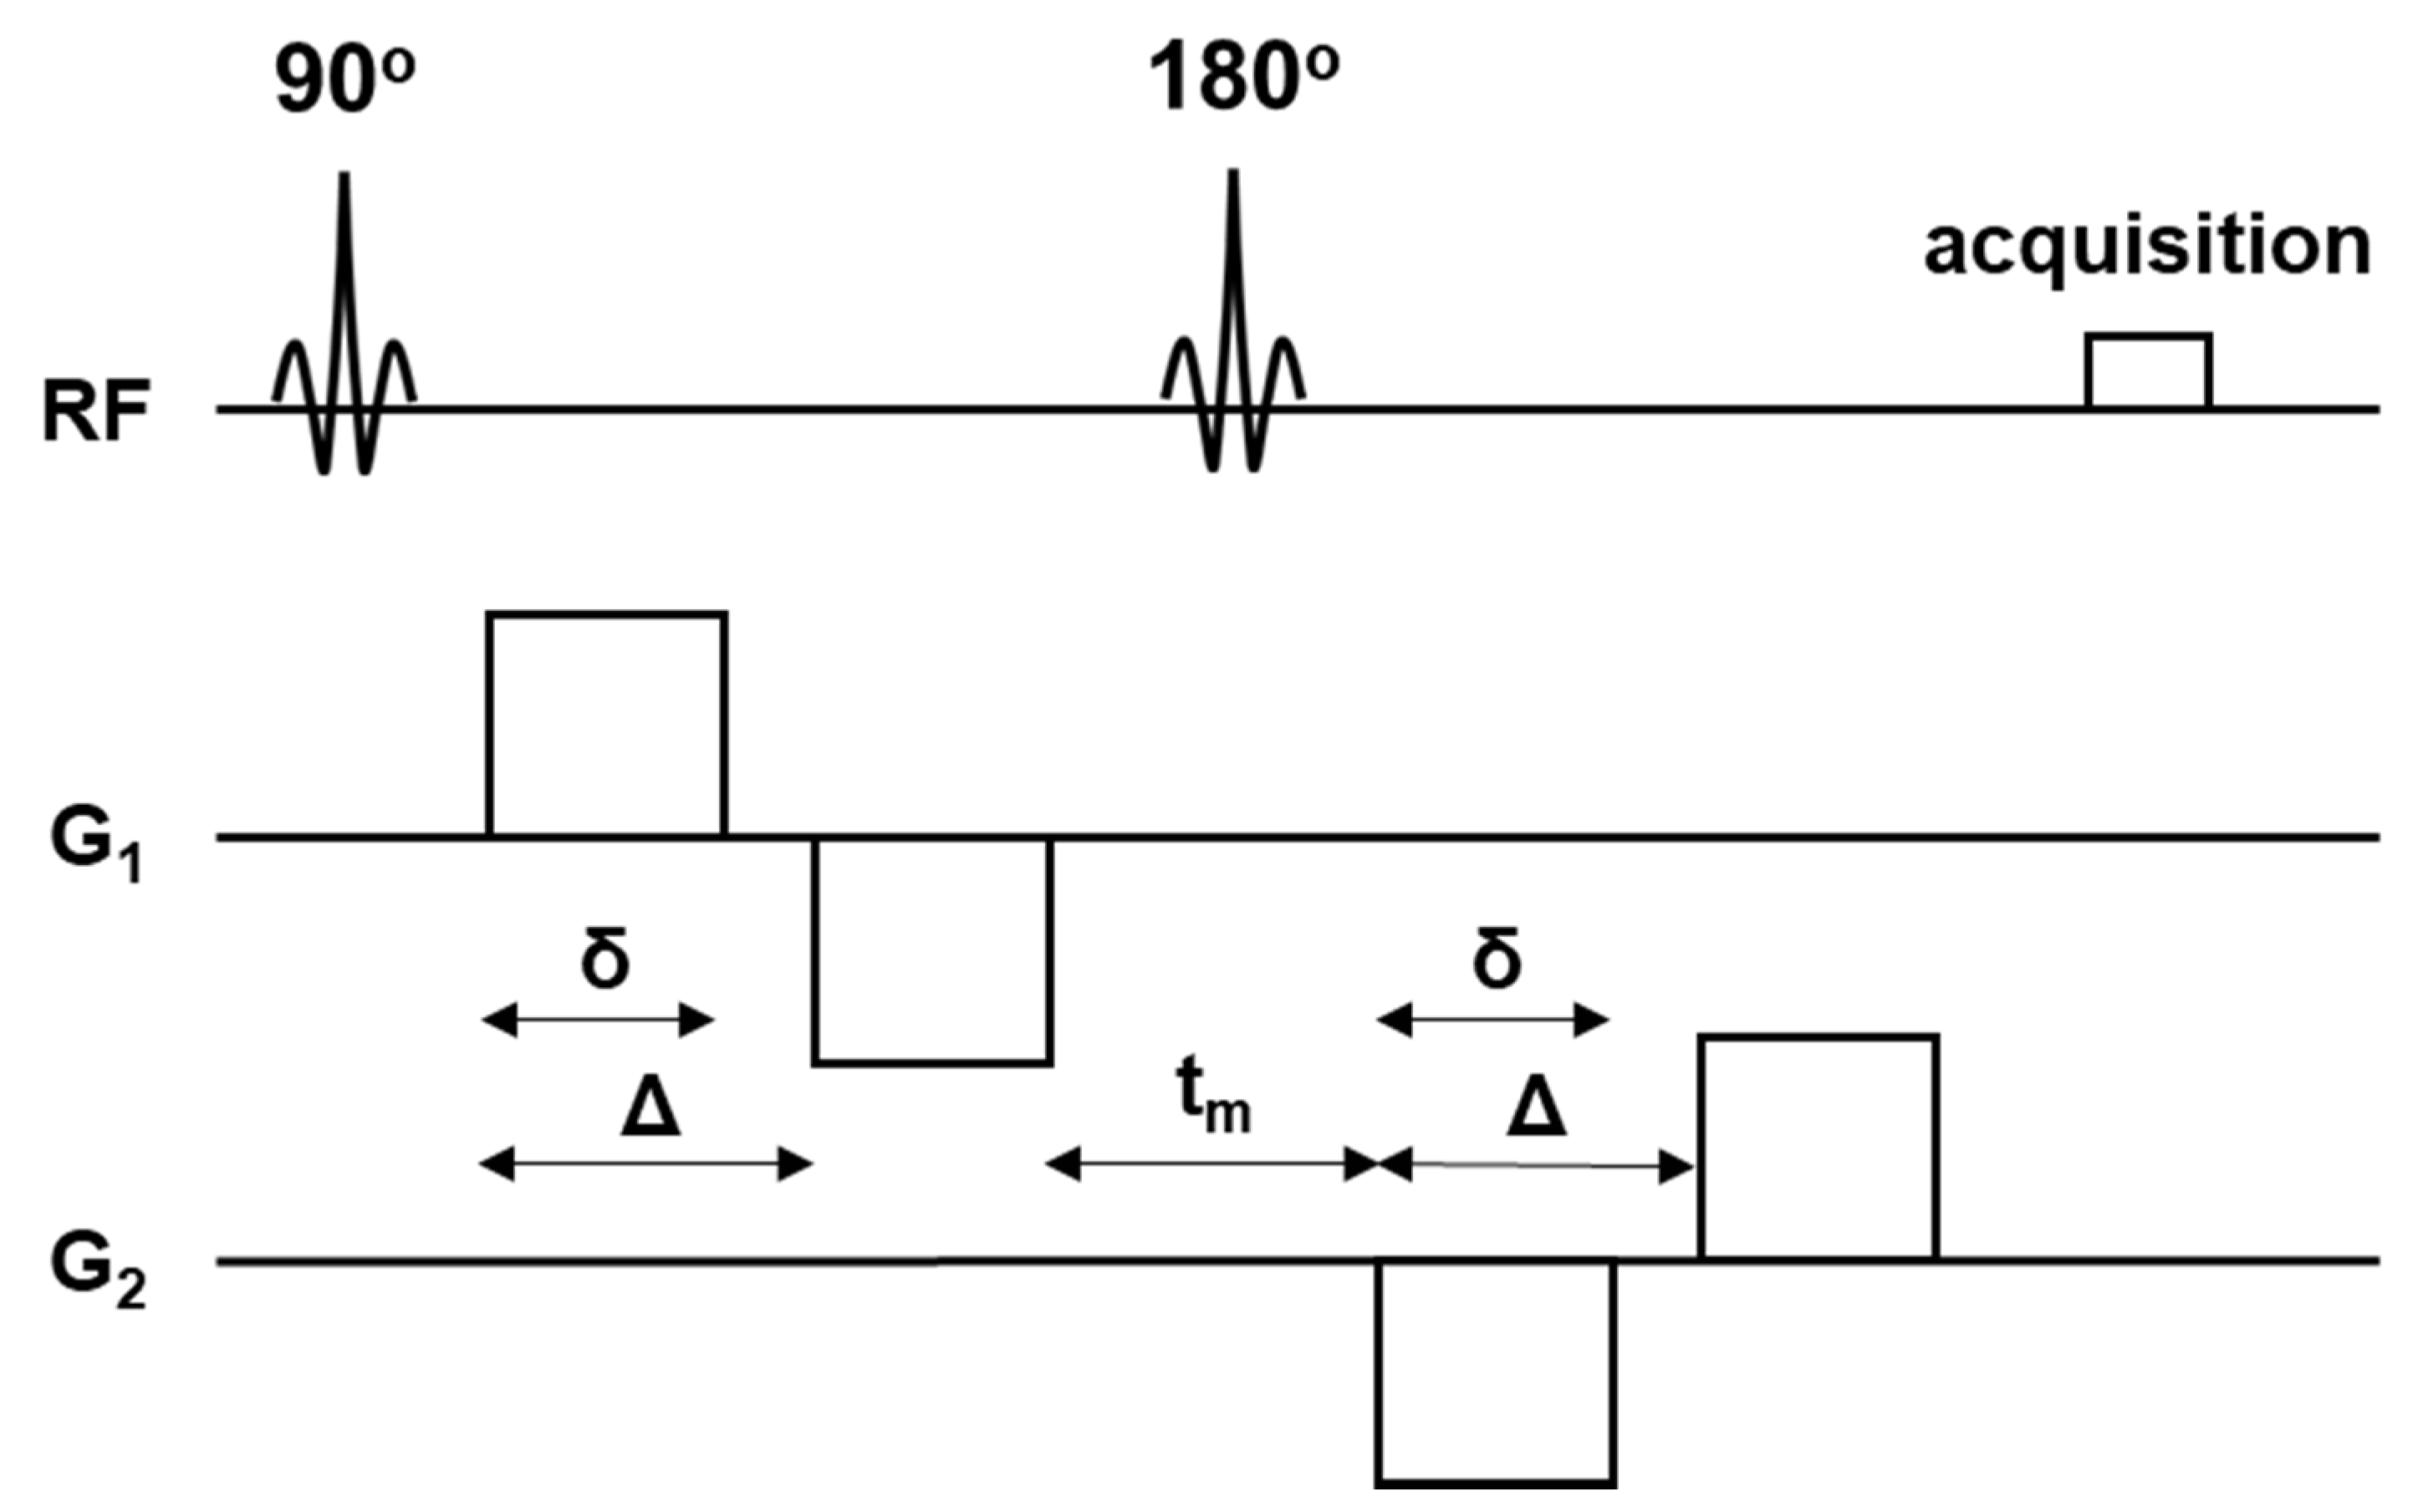
2.4. MR Imaging
2.5. Data Processing
2.6. Statistical Analysis
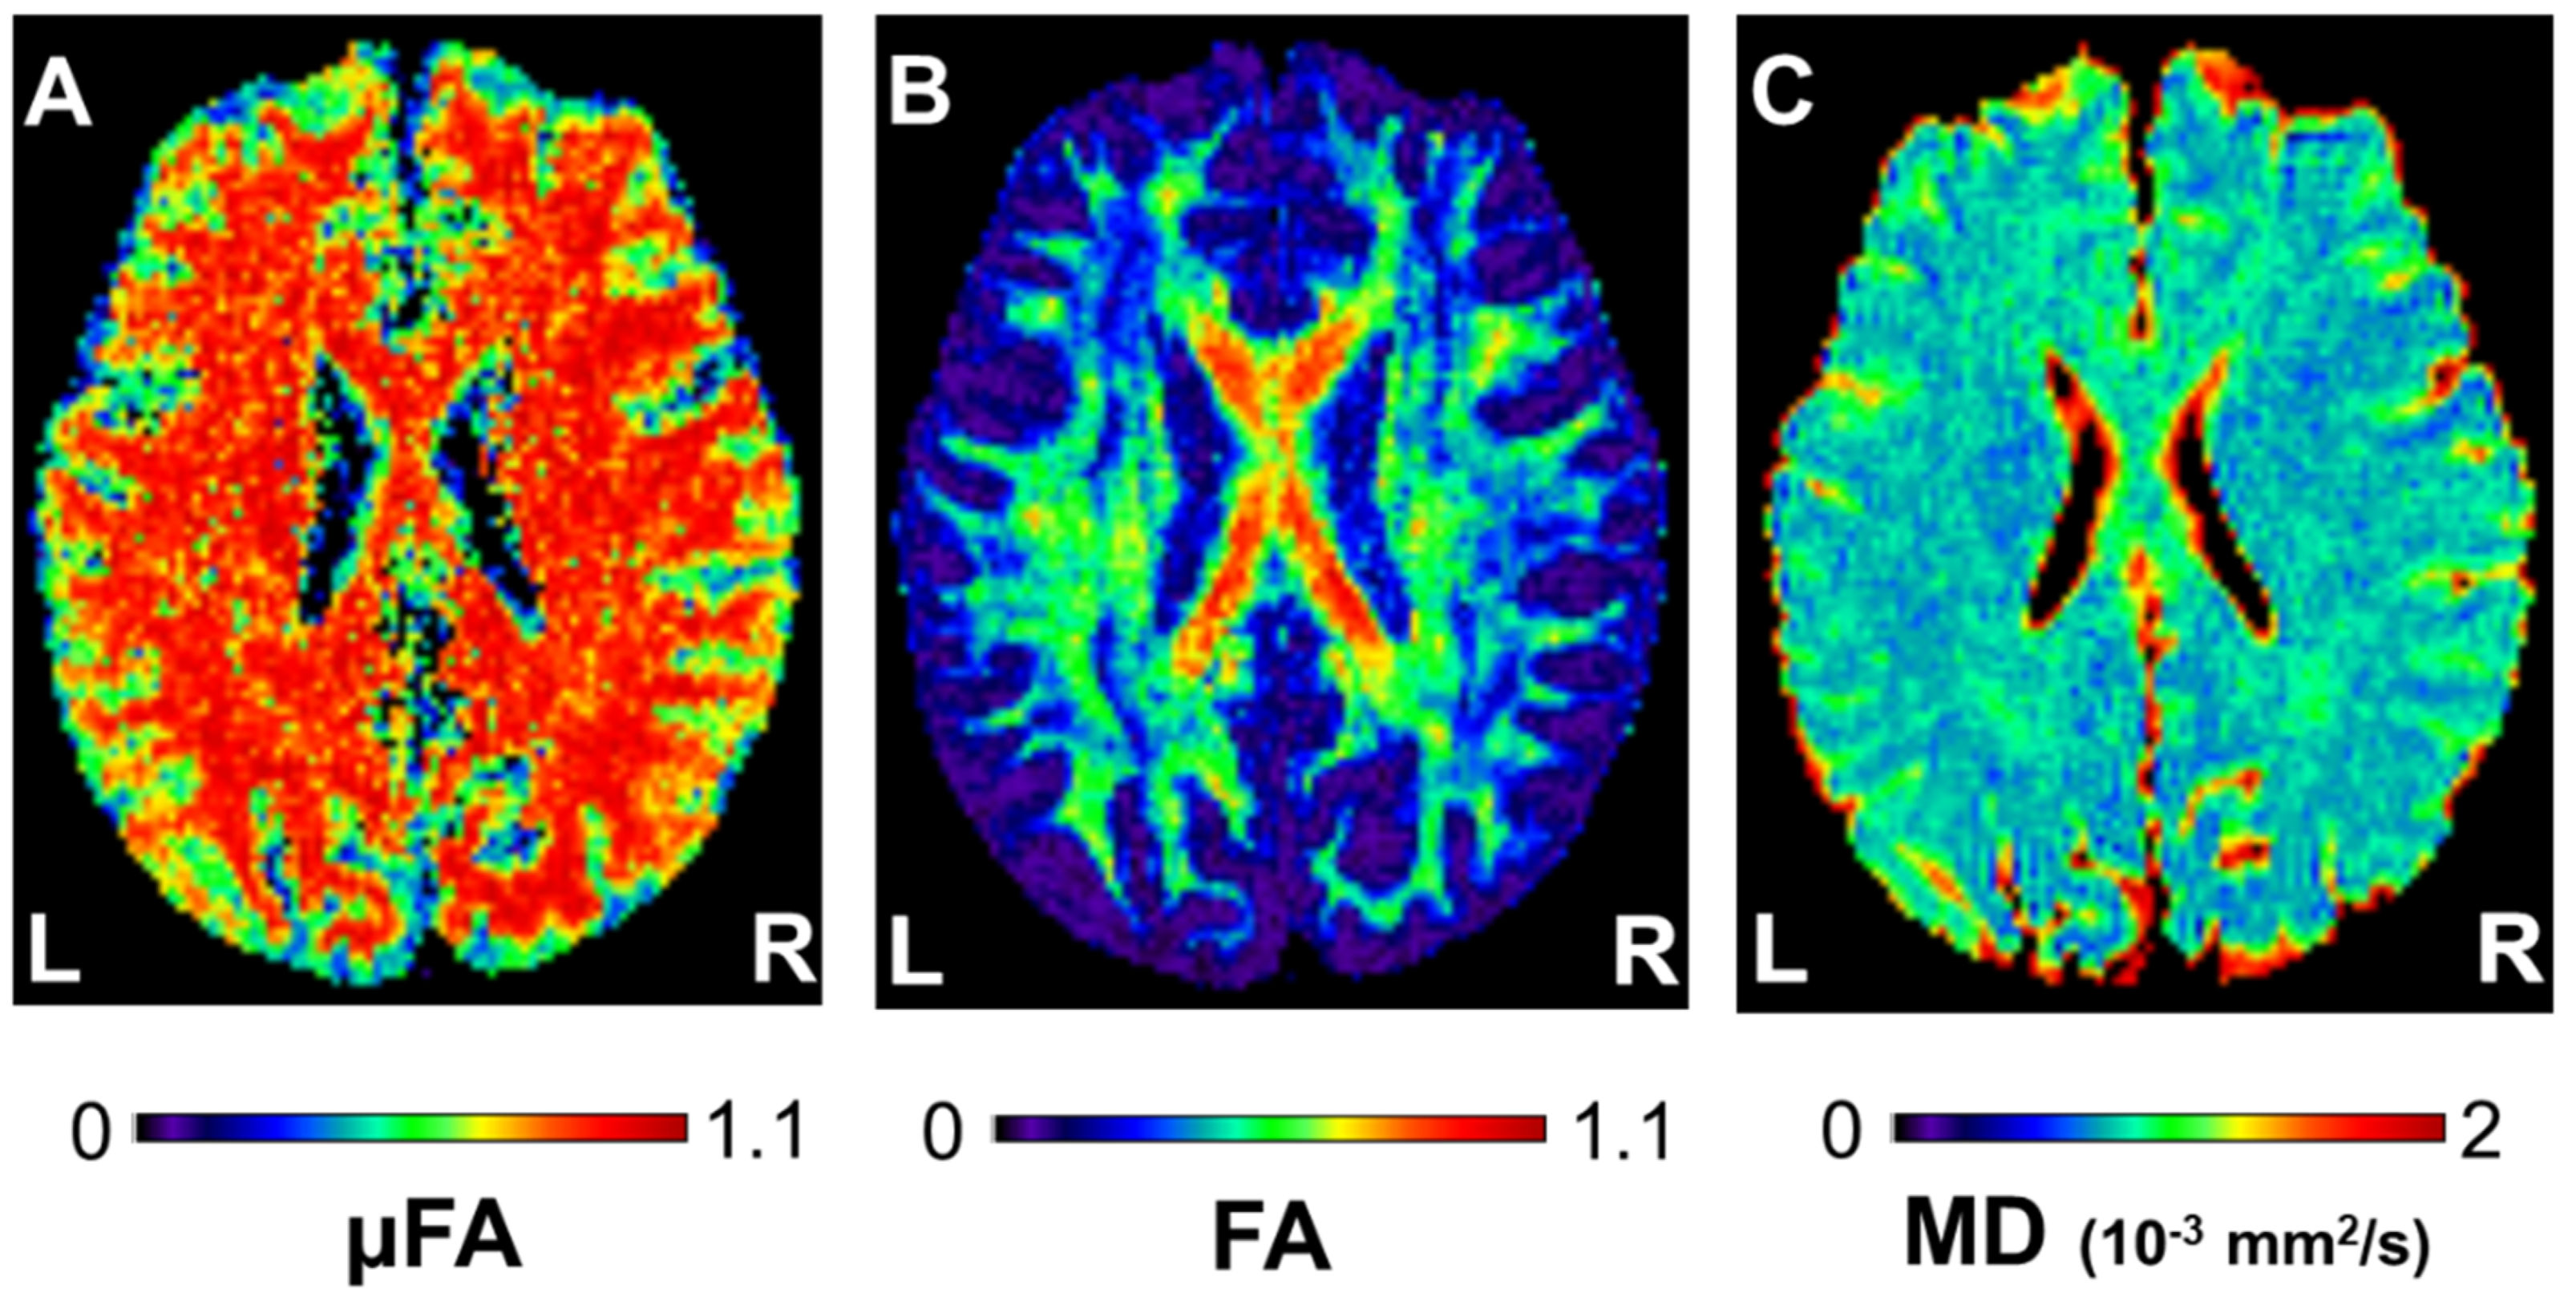
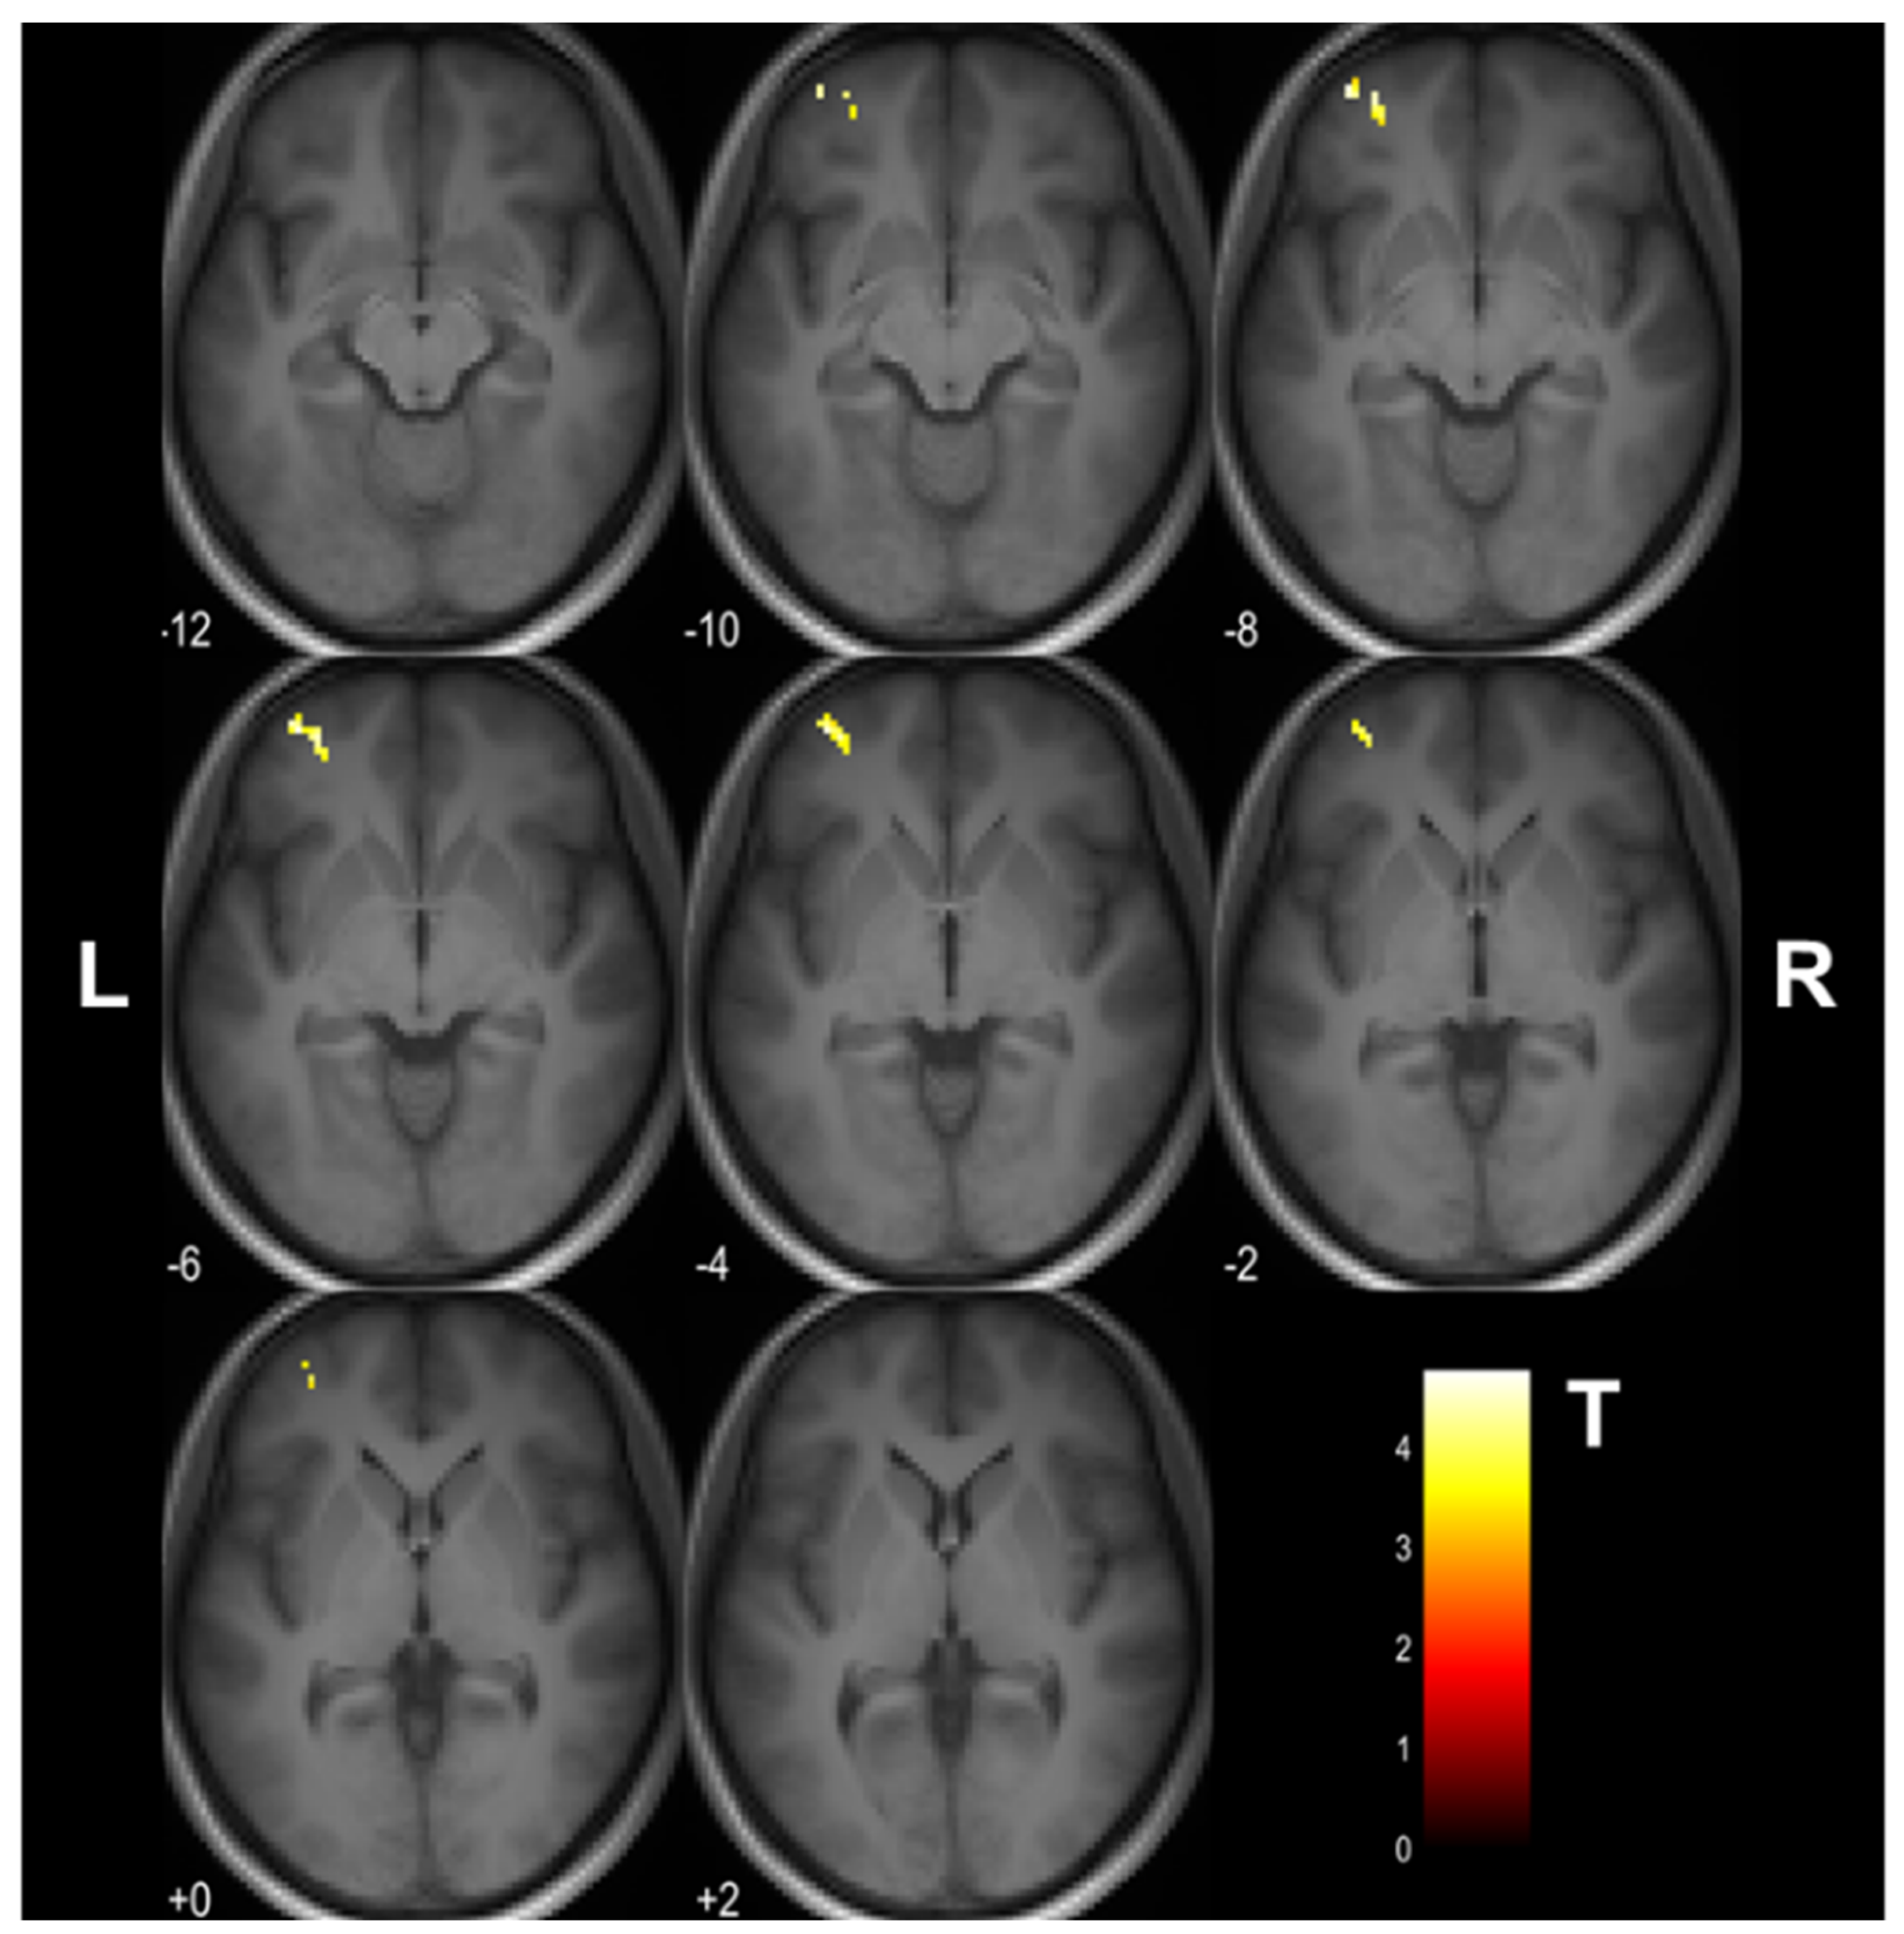
3. Results
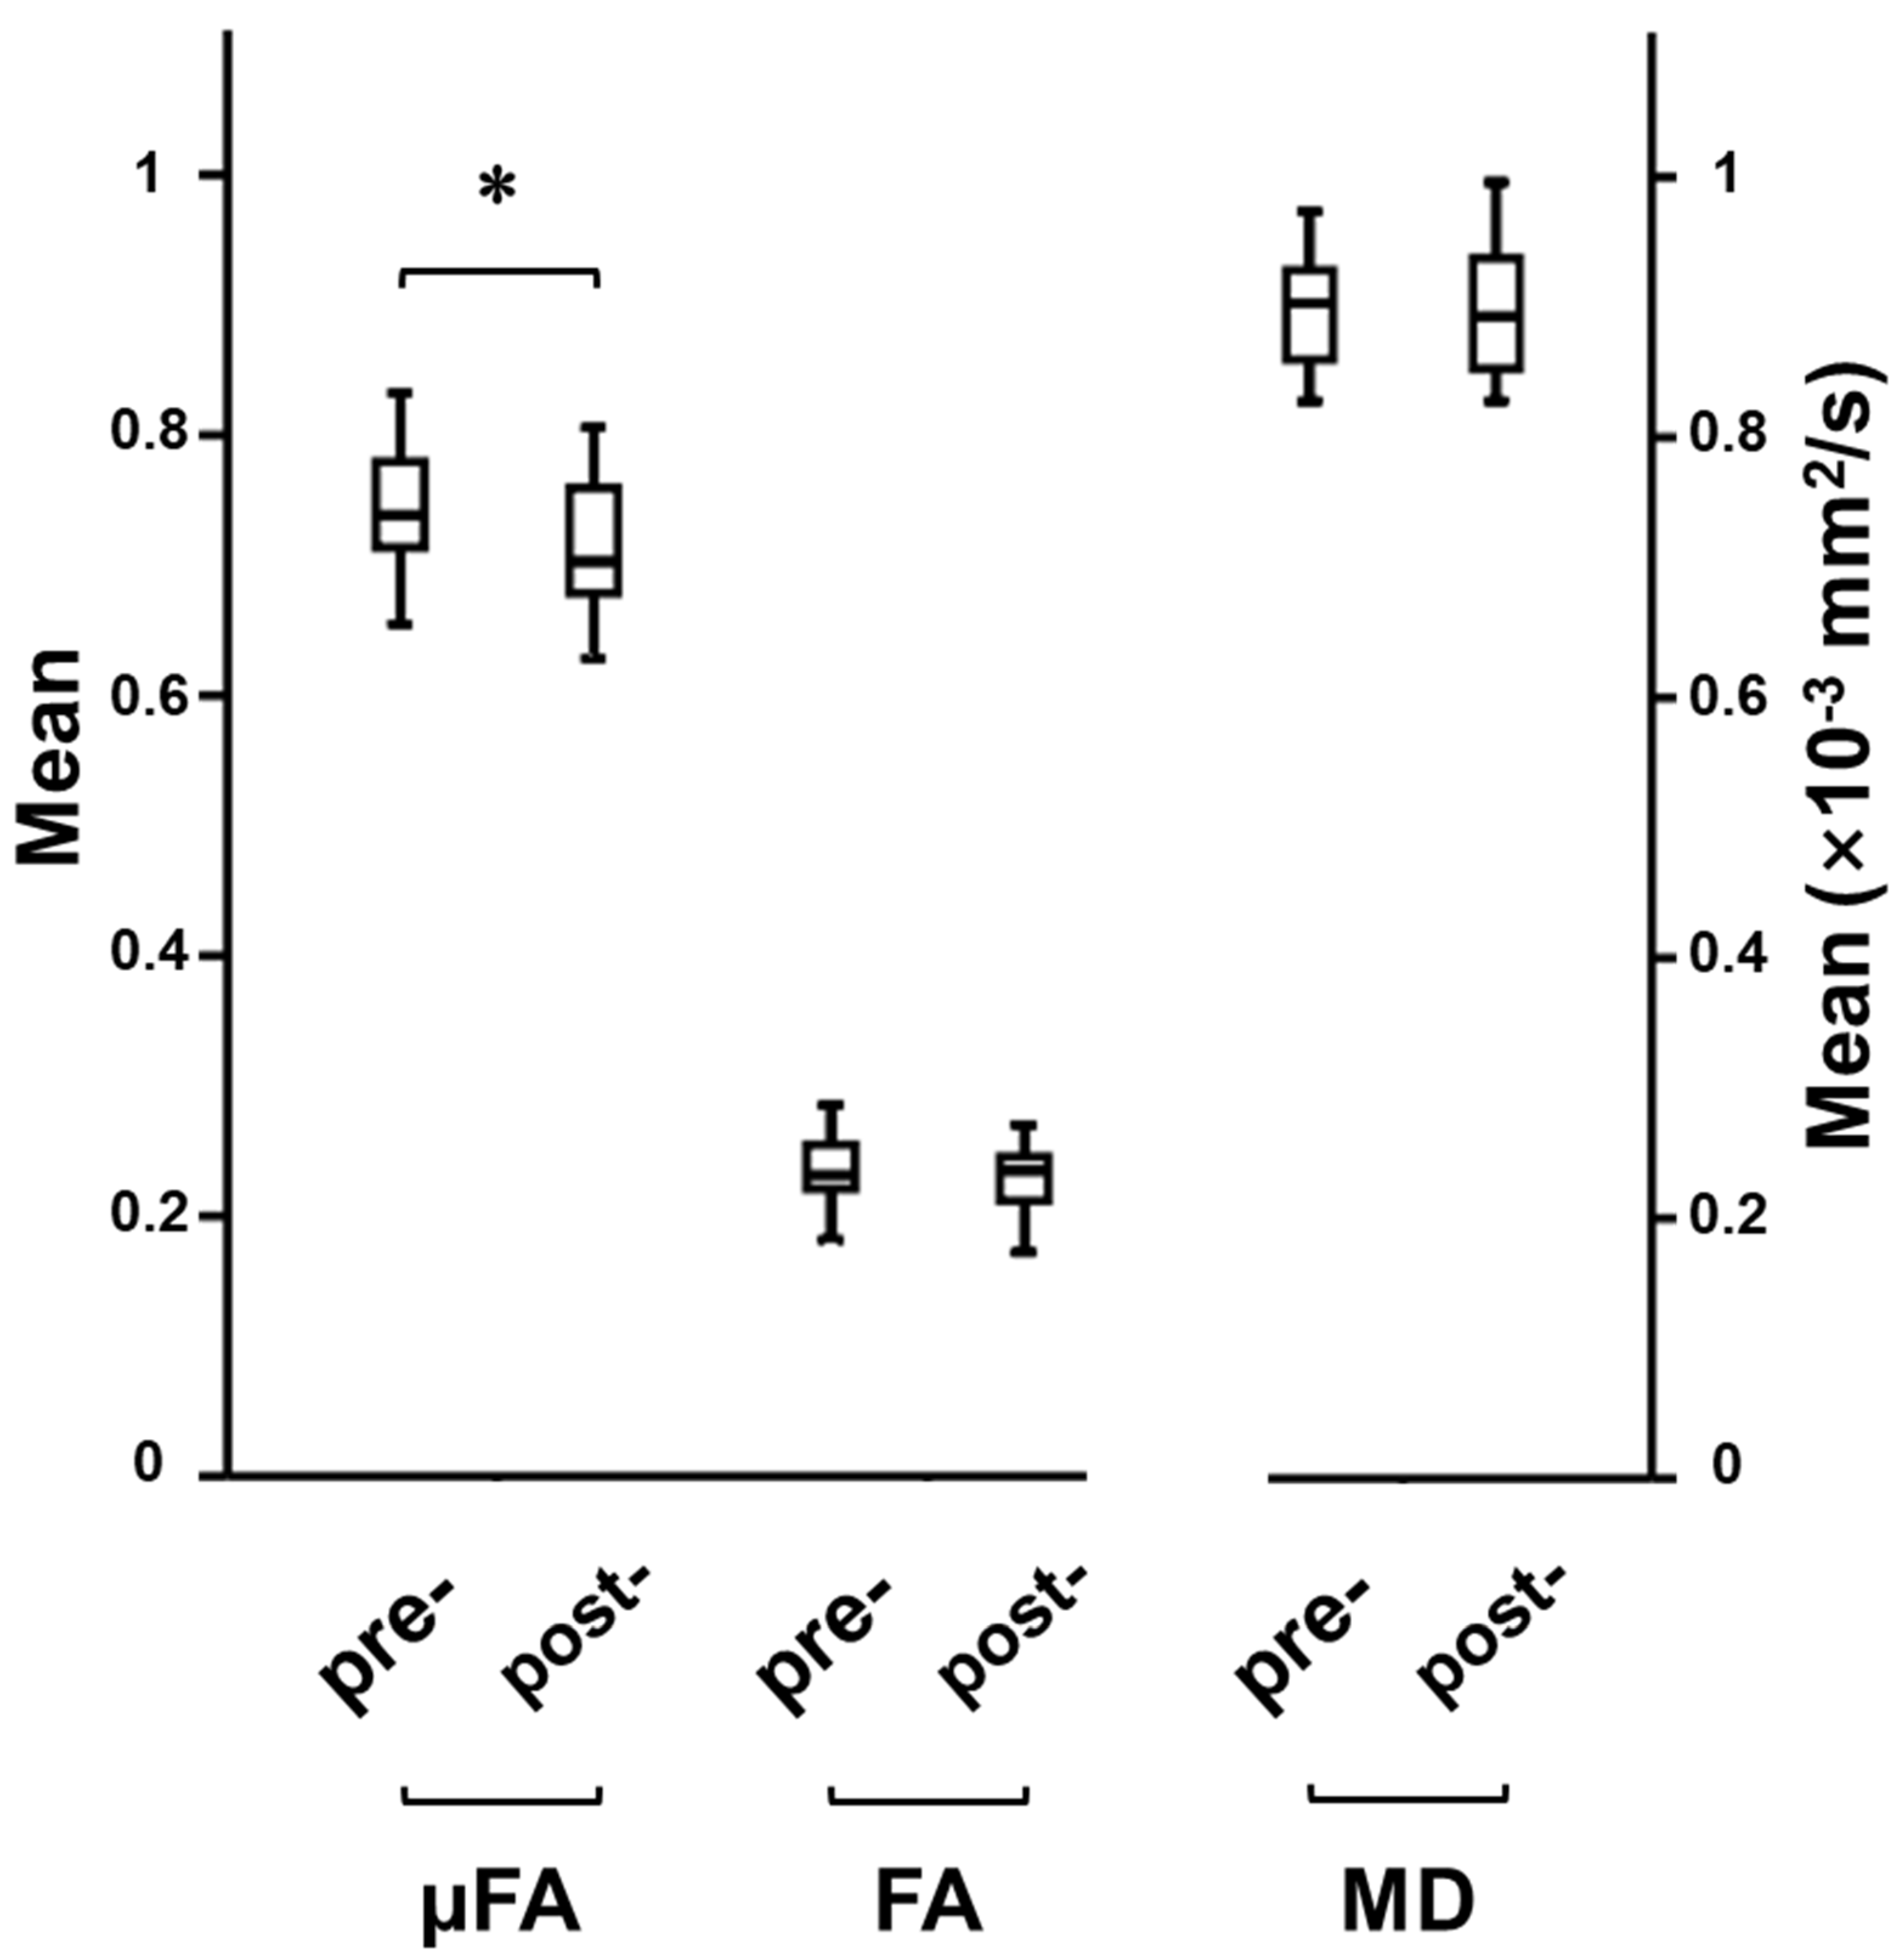
3.1. Cognitive Training-Induced Imaging Finding Changes
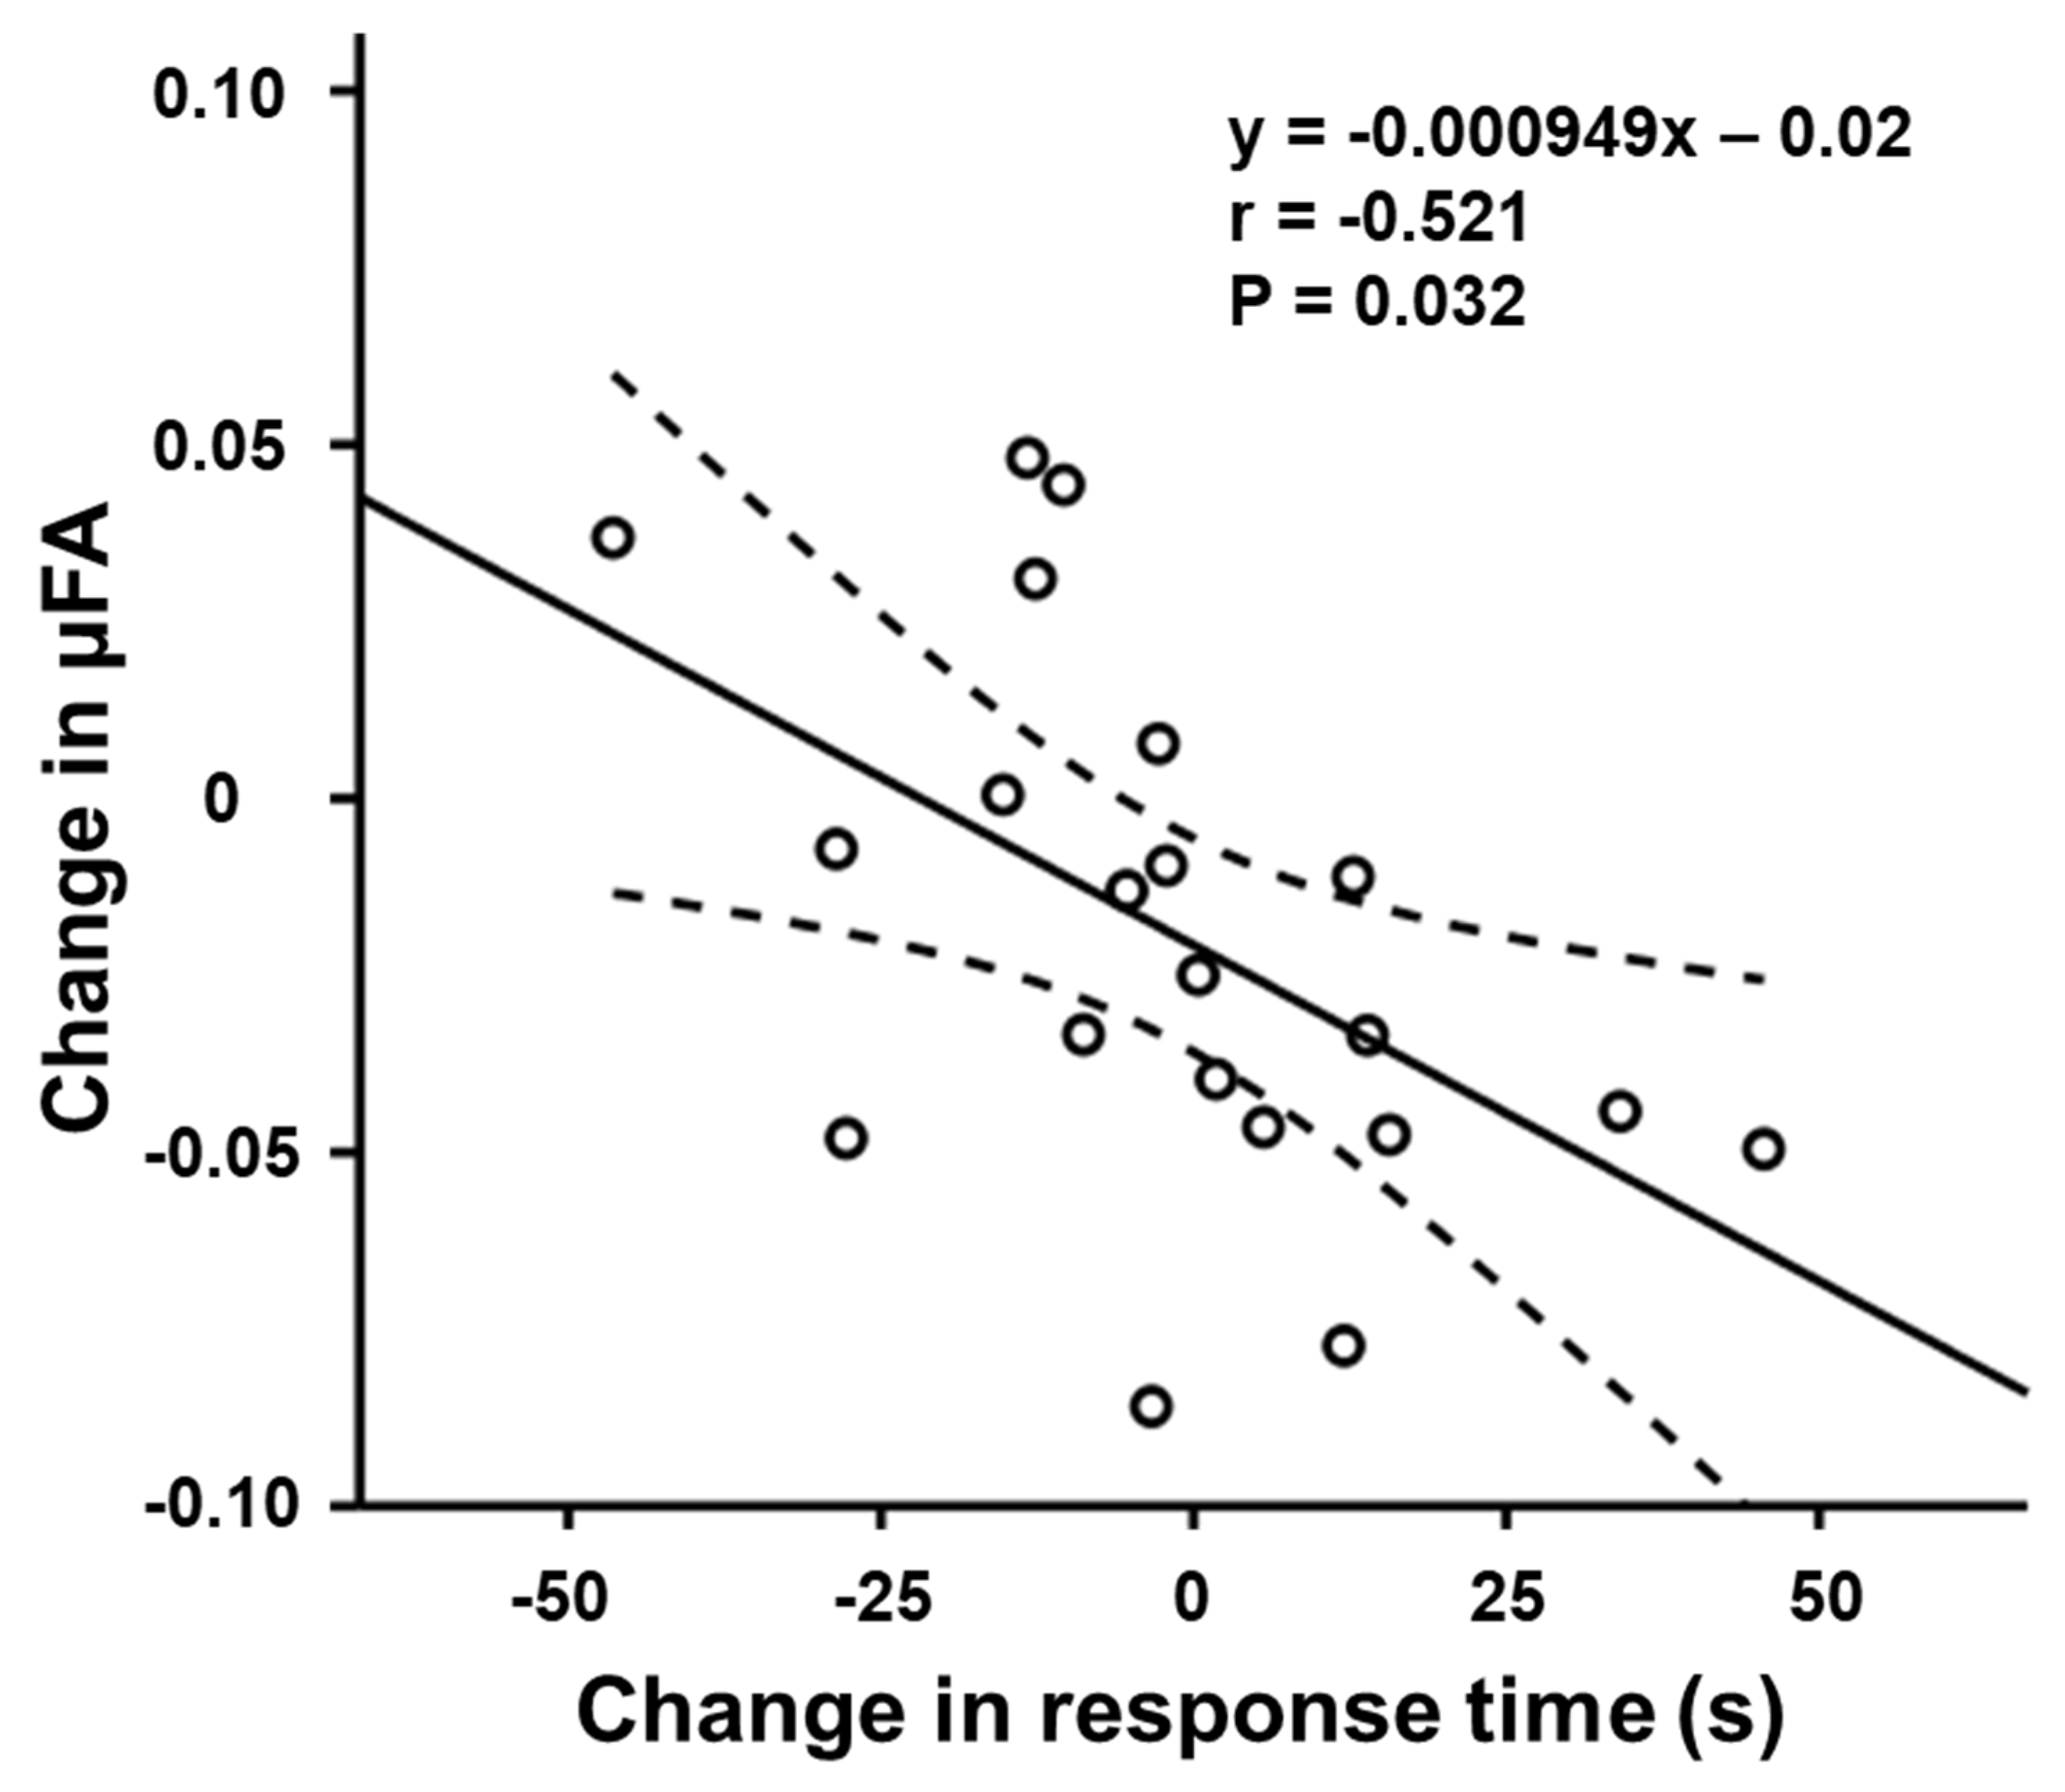
3.2. Relationship between μFA and Task Performance
4. Discussion
5. Conclusions
Author Contributions
Funding
Institutional Review Board Statement
Informed Consent Statement
Data Availability Statement
Conflicts of Interest
References
- Ghio, M.; Locatelli, M.; Tettamanti, A.; Perani, D.; Gatti, R.; Tettamanti, M. Cognitive training with action-related verbs induces neural plasticity in the action representation system as assessed by gray matter brain morphometry. Neuropsychologia 2018, 114, 186–194. [Google Scholar] [CrossRef]
- Verhelst, H.; Giraldo, D.; Vander Linden, C.; Vingerhoets, G.; Jeurissen, B.; Caeyenberghs, K. Cognitive Training in Young Patients with Traumatic Brain Injury: A Fixel-Based Analysis. Neurorehabil. Neural Repair 2019, 33, 813–824. [Google Scholar] [CrossRef]
- Lampit, A.; Hallock, H.; Suo, C.; Naismith, S.L.; Valenzuela, M. Cognitive training-induced short-term functional and long-term structural plastic change is related to gains in global cognition in healthy older adults: A pilot study. Front. Aging Neurosci. 2015, 7, 14. [Google Scholar] [CrossRef]
- Sachdev, R.N.; Egli, M.; Stonecypher, M.; Wiley, R.G.; Ebner, F.F. Enhancement of cortical plasticity by behavioral training in acetylcholine-depleted adult rats. J. Neurophysiol. 2000, 84, 1971–1981. [Google Scholar] [CrossRef]
- Kubska, Z.R.; Kamiński, J. How Human Single-Neuron Recordings Can Help Us Understand Cognition: Insights from Memory Studies. Brain Sci. 2021, 11, 443. [Google Scholar] [CrossRef]
- Crespi, C.; Laureiro-Martínez, D.; Dodich, A.; Cappa, S.F.; Brusoni, S.; Zollo, M.; Falini, A.; Canessa, N. Improving innovative decision-making: Training-induced changes in fronto-parietal networks. Brain Cogn. 2018, 128, 46–55. [Google Scholar] [CrossRef]
- Blumenfeld-Katzir, T.; Pasternak, O.; Dagan, M.; Assaf, Y. Diffusion MRI of structural brain plasticity induced by a learning and memory task. PLoS ONE 2011, 6, e20678. [Google Scholar] [CrossRef] [Green Version]
- Tha, K.K.; Terae, S.; Nakagawa, S.; Inoue, T.; Kitagawa, N.; Kako, Y.; Nakato, Y.; Akter Popy, K.; Fujima, N.; Zaitsu, Y.; et al. Impaired integrity of the brain parenchyma in non-geriatric patients with major depressive disorder revealed by diffusion tensor imaging. Psychiatry Res. 2013, 212, 208–215. [Google Scholar] [CrossRef] [Green Version]
- Tha, K.K.; Terae, S.; Yabe, I.; Miyamoto, T.; Soma, H.; Zaitsu, Y.; Fujima, N.; Kudo, K.; Sasaki, H.; Shirato, H. Microstructural white matter abnormalities of multiple system atrophy: In vivo topographic illustration by using diffusion-tensor MR imaging. Radiology 2010, 255, 563–569. [Google Scholar] [CrossRef]
- Lasič, S.; Szczepankiewicz, F.; Eriksson, S.; Nilsson, M.; Topgaard, D. Microanisotropy imaging: Quantification of microscopic diffusion anisotropy and orientational order parameter by diffusion MRI with magic-angle spinning of the q-vector. Front. Phys. 2014, 2, 11. [Google Scholar] [CrossRef]
- Mitra, P.P. Multiple wave-vector extensions of the NMR pulsed-field-gradient spin-echo diffusion measurement. Phys. Rev. B. Condens. Matter. 1995, 51, 15074–15078. [Google Scholar] [CrossRef] [PubMed]
- Ozarslan, E. Compartment shape anisotropy (CSA) revealed by double pulsed field gradient MR. J. Magn. Reson. 2009, 199, 56–67. [Google Scholar] [CrossRef] [PubMed] [Green Version]
- Lawrenz, M.; Brassen, S.; Finsterbusch, J. Microscopic diffusion anisotropy in the human brain: Age-related changes. Neuroimage 2016, 141, 313–325. [Google Scholar] [CrossRef] [PubMed]
- Yang, G.; Tian, Q.; Leuze, C.; Wintermark, M.; McNab, J.A. Double diffusion encoding MRI for the clinic. Magn. Reson. Med. 2018, 80, 507–520. [Google Scholar] [CrossRef]
- Kamiya, K.; Kamagata, K.; Ogaki, K.; Hatano, T.; Ogawa, T.; Takeshige-Amano, H.; Murata, S.; Andica, C.; Murata, K.; Feiweier, T.; et al. Brain White-Matter Degeneration Due to Aging and Parkinson Disease as Revealed by Double Diffusion Encoding. Front. Neurosci. 2020, 14, 584510. [Google Scholar] [CrossRef]
- Szczepankiewicz, F.; Lasič, S.; van Westen, D.; Sundgren, P.C.; Englund, E.; Westin, C.F.; Ståhlberg, F.; Lätt, J.; Topgaard, D.; Nilsson, M. Quantification of microscopic diffusion anisotropy disentangles effects of orientation dispersion from microstructure: Applications in healthy volunteers and in brain tumors. Neuroimage 2015, 104, 241–252. [Google Scholar] [CrossRef] [Green Version]
- Rebok, G.W.; Ball, K.; Guey, L.T.; Jones, R.N.; Kim, H.Y.; King, J.W.; Marsiske, M.; Morris, J.N.; Tennstedt, S.L.; Unverzagt, F.W.; et al. Ten-year effects of the advanced cognitive training for independent and vital elderly cognitive training trial on cognition and everyday functioning in older adults. J. Am. Geriatr. Soc. 2014, 62, 16–24. [Google Scholar] [CrossRef]
- Faul, F.; Erdfelder, E.; Buchner, A.; Lang, A.G. Statistical power analyses using G*Power 3.1: Tests for correlation and regression analyses. Behav. Res. Methods. 2009, 41, 1149–1160. [Google Scholar] [CrossRef] [Green Version]
- Fan, J.; McCandliss, B.D.; Sommer, T.; Raz, A.; Posner, M.I. Testing the efficiency and independence of attentional networks. J. Cogn. Neurosci. 2002, 14, 340–347. [Google Scholar] [CrossRef]
- Forster, K.I.; Forster, J.C. DMDX: A Windows display program with millisecond accuracy. Behav. Res. Methods Instrum. Comput. 2003, 35, 116–124. [Google Scholar] [CrossRef] [Green Version]
- Jaeggi, S.M.; Buschkuehl, M.; Jonides, J.; Perrig, W.J. Improving fluid intelligence with training on working memory. Proc. Natl. Acad. Sci. USA 2008, 105, 6829–6833. [Google Scholar] [CrossRef] [PubMed] [Green Version]
- Basser, P.J.; Pierpaoli, C. Microstructural and physiological features of tissues elucidated by quantitative-diffusion-tensor MRI. J. Magn. Reson. B 1996, 111, 209–219. [Google Scholar] [CrossRef] [PubMed]
- Rorden, C.; Karnath, H.O.; Bonilha, L. Improving lesion-symptom mapping. J. Cogn. Neurosci. 2007, 19, 1081–1088. [Google Scholar] [CrossRef] [PubMed]
- Schneider, C.A.; Rasband, W.S.; Eliceiri, K.W. NIH Image to ImageJ: 25 years of image analysis. Nat. Methods. 2012, 9, 671–675. [Google Scholar] [CrossRef] [PubMed]
- McFarquhar, M. Testable Hypotheses for Unbalanced Neuroimaging Data. Front. Neurosci. 2016, 10, 270. [Google Scholar] [CrossRef] [Green Version]
- Shemesh, N. Axon Diameters and Myelin Content Modulate Microscopic Fractional Anisotropy at Short Diffusion Times in Fixed Rat Spinal Cord. Front. Phys. 2018, 6, 49. [Google Scholar] [CrossRef]
- Cramer, S.C.; Sur, M.; Dobkin, B.H.; O’Brien, C.; Sanger, T.D.; Trojanowski, J.Q.; Rumsey, J.M.; Hicks, R.; Cameron, J.; Chen, D.; et al. Harnessing neuroplasticity for clinical applications. Brain 2011, 134, 1591–1609. [Google Scholar] [CrossRef] [PubMed]
- Taubert, M.; Draganski, B.; Anwander, A.; Müller, K.; Horstmann, A.; Villringer, A.; Ragert, P. Dynamic properties of human brain structure: Learning-related changes in cortical areas and associated fiber connections. J. Neurosci. 2010, 30, 11670–11677. [Google Scholar] [CrossRef] [Green Version]
- Laughlin, S.B.; Sejnowski, T.J. Communication in neuronal networks. Science 2003, 301, 1870–1874. [Google Scholar] [CrossRef] [Green Version]
- Shemesh, N.; Cohen, Y. Microscopic and compartment shape anisotropies in gray and white matter revealed by angular bipolar double-PFG MR. Magn. Reson. Med. 2011, 65, 1216–1227. [Google Scholar] [CrossRef]
- Ikenouchi, Y.; Kamagata, K.; Andica, C.; Hatano, T.; Ogawa, T.; Takeshige-Amano, H.; Kamiya, K.; Wada, A.; Suzuki, M.; Fujita, S.; et al. Evaluation of white matter microstructure in patients with Parkinson’s disease using microscopic fractional anisotropy. Neuroradiology 2020, 62, 197–203. [Google Scholar] [CrossRef] [PubMed]
- Thiel, C.M.; Zilles, K.; Fink, G.R. Cerebral correlates of alerting; orienting and reorienting of visuospatial attention: An event-related fMRI study. Neuroimage 2004, 21, 318–328. [Google Scholar] [CrossRef]
- Cao, Q.; Zang, Y.; Zhu, C.; Cao, X.; Sun, L.; Zhou, X.; Wang, Y. Alerting deficits in children with attention deficit/hyperactivity disorder: Event-related fMRI evidence. Brain Res. 2008, 1219, 159–168. [Google Scholar] [CrossRef] [PubMed]
- Petit, L.; Zago, L.; Mellet, E.; Jobard, G.; Crivello, F.; Joliot, M.; Mazoyer, B.; Tzourio-Mazoyer, N. Strong rightward lateralization of the dorsal attentional network in left-handers with right sighting-eye: An evolutionary advantage. Hum. Brain Mapp. 2015, 36, 1151–1164. [Google Scholar] [CrossRef] [PubMed]
- Jensen, J.H.; Helpern, J.A.; Ramani, A.; Lu, H.; Kaczynski, K. Diffusional kurtosis imaging: The quantification of non-gaussian water diffusion by means of magnetic resonance imaging. Magn. Reson. Med. 2005, 53, 1432–1440. [Google Scholar] [CrossRef] [PubMed]
- Zhang, H.; Schneider, T.; Wheeler-Kingshott, C.A.; Alexander, D.C. NODDI: Practical in vivo neurite orientation dispersion and density imaging of the human brain. Neuroimage 2012, 61, 1000–1016. [Google Scholar] [CrossRef]


| Items | Training Group (Mean ± SD) | Control Group (Mean ± SD) | ||||||
|---|---|---|---|---|---|---|---|---|
| Initial Assessment | Re-Assessment | Change | Initial Assessment | Re-Assessment | Change | |||
| ANT | RTalerting (ms) | 56.86 ± 27.50 | 48.95 ± 32.83 | −7.90 ± 20.58 | 65.25 ± 14.91 | 61.00 ± 24.02 | −4.25 ± 27.08 | |
| RTno-cue (ms) | 560.43 ± 39.08 ** | 529.19 ± 36.53 ** | −31.24 ± 24.82 | 550.25 ± 30.87 | 550.50 ± 28.56 | 0.25 ± 18.74 | ||
| RTcenter-cue (ms) | 503.57 ± 26.40 ** | 480.24 ± 28.20 ** | −23.33 ± 22.92 | 485.00 ± 25.88 | 489.50 ± 30.89 | 4.50 ± 17.64 | ||
| RTorienting (ms) | 34.57 ± 21.27 | 32.90 ± 28.42 | −1.67 ± 23.97 | 19.50 ± 13.27 | 29.75 ± 13.73 | 10.25 ± 17.46 | ||
| RTcenter-cue (ms) | 503.57 ± 26.40 ** | 480.24 ± 28.20 ** | −23.33 ± 22.92 | 485.00 ± 25.88 | 489.50 ± 30.89 | 4.50 ± 17.64 | ||
| RTspatial-cue (ms) | 469.00 ± 33.14 ** | 447.33 ± 35.63 ** | −21.67 ± 21.82 | 465.50 ± 26.80 | 459.75 ± 30.44 | −5.75 ± 11.73 | ||
| RTexecutive control (ms) | 58.38 ± 23.16 ** | 36.92 ± 24.64 ** | −21.46 ± 15.13 | 59.92 ± 29.16 | 54.54 ± 18.50 | −5.37 ± 17.64 | ||
| RTincongruent (ms) | 569.38 ± 42.87 ** | 522.51 ± 35.17 ** | −46.87 ± 21.86 | 560.17 ± 51.99 | 554.46 ± 43.09 | −5.71 ± 21.20 | ||
| RTcongruent (ms) | 511.00 ± 30.28 ** | 485.59 ± 28.91 ** | −25.41 ± 18.65 | 500.25 ± 26.50 | 499.92 ± 27.61 | −0.33 ± 11.57 | ||
| DBT | Error rate (%) | 37.38 ± 15.24 ** | 7.84 ± 7.89 ** | −29.54 ± 10.24 | 43.75 ± 13.74 * | 40.50 ± 12.92 * | −3.25 ± 3.43 | |
| Item | Training Group | Control Group | |||
|---|---|---|---|---|---|
| Correlation Efficient (r) | Significance (p) | Correlation Efficient (r) | Significance (p) | ||
| ANT | RTalerting (ms) | −0.163 | 0.533 | 0.314 | 0.686 |
| RTorienting(ms) | −0.521 | 0.032 | −0.310 | 0.690 | |
| RTexecutive control (ms) | −0.093 | 0.721 | 0.199 | 0.801 | |
| DBT | Error rate (%) | 0.147 | 0.573 | −0.880 | 0.120 |
Publisher’s Note: MDPI stays neutral with regard to jurisdictional claims in published maps and institutional affiliations. |
© 2022 by the authors. Licensee MDPI, Basel, Switzerland. This article is an open access article distributed under the terms and conditions of the Creative Commons Attribution (CC BY) license (https://creativecommons.org/licenses/by/4.0/).
Share and Cite
Li, X.; Sawamura, D.; Hamaguchi, H.; Urushibata, Y.; Feiweier, T.; Ogawa, K.; Tha, K.K. Microscopic Fractional Anisotropy Detects Cognitive Training-Induced Microstructural Brain Changes. Tomography 2022, 8, 33-44. https://doi.org/10.3390/tomography8010004
Li X, Sawamura D, Hamaguchi H, Urushibata Y, Feiweier T, Ogawa K, Tha KK. Microscopic Fractional Anisotropy Detects Cognitive Training-Induced Microstructural Brain Changes. Tomography. 2022; 8(1):33-44. https://doi.org/10.3390/tomography8010004
Chicago/Turabian StyleLi, Xinnan, Daisuke Sawamura, Hiroyuki Hamaguchi, Yuta Urushibata, Thorsten Feiweier, Keita Ogawa, and Khin Khin Tha. 2022. "Microscopic Fractional Anisotropy Detects Cognitive Training-Induced Microstructural Brain Changes" Tomography 8, no. 1: 33-44. https://doi.org/10.3390/tomography8010004
APA StyleLi, X., Sawamura, D., Hamaguchi, H., Urushibata, Y., Feiweier, T., Ogawa, K., & Tha, K. K. (2022). Microscopic Fractional Anisotropy Detects Cognitive Training-Induced Microstructural Brain Changes. Tomography, 8(1), 33-44. https://doi.org/10.3390/tomography8010004