
Practical Application of DaTQUANT with Optimal Threshold for Diagnostic Accuracy of Dopamine Transporter SPECT


 , ,
, , 
Abstract
:1. Introduction
2. Materials and Methods
2.1. Study Population
2.2. Quantification Software
2.3. Statistics
3. Results
3.1. Demographics
3.2. Single Variate Models
3.3. Multi-Variate Models
3.4. Cross Group Results
4. Discussion
5. Conclusions
Author Contributions
Funding
Institutional Review Board Statement
Informed Consent Statement
Data Availability Statement
Acknowledgments
Conflicts of Interest
References
- Perju-Dumbrava, L.D.; Kovacs, G.G.; Pirker, S.; Jellinger, K.; Hoffmann, M.; Asenbaum, S.; Pirker, W. Dopamine transporter imaging in autopsy-confirmed Parkinson’s disease and multiple system atrophy. Mov. Disord. 2011, 27, 65–71. [Google Scholar] [CrossRef] [PubMed]
- Colloby, S.J.; McParland, S.; O’Brien, J.; Attems, J. Neuropathological correlates of dopaminergic imaging in Alzheimer’s disease and Lewy body dementias. Brain 2012, 135, 2798–2808. [Google Scholar] [CrossRef] [Green Version]
- Tatsch, K. Imaging of the dopaminergic system in differential diagnosis of dementia. Eur. J. Nucl. Med. Mol. Imaging 2008, 35, 51–57. [Google Scholar] [CrossRef] [PubMed]
- Seibyl, J.; Russell, D.; Jennings, D.; Marek, K. The molecular basis of dopaminergic brain imaging in Parkinson’s disease. Q. J. Nucl. Med. Mol. Imaging 2012, 56, 4–16. [Google Scholar]
- Chouker, M.; Tatsch, K.; Linke, R.; Pogarell, O.; Hahn, K.; Schwarz, J. Striatal dopamine transporter binding in early to moderately advanced Parkinson’s disease: Monitoring of disease progression over 2 years. Nucl. Med. Commun. 2001, 22, 721–725. [Google Scholar] [CrossRef] [PubMed]
- Bega, D.; Kuo, P.H.; Chalkidou, A.; Grzeda, M.T.; Macmillan, T.; Brand, C.; Sheikh, Z.H.; Antonini, A. Clinical utility of DaTscan in patients with suspected Parkinsonian syndrome: A systematic review and meta-analysis. Npj Park. Dis. 2021, 7, 43. [Google Scholar] [CrossRef]
- Stokkel, M.P.M.; Dibbets-Schneider, P.; Koestering, E.; Dragoiescu, C.; Blokland, K.A.K. Reproducibility of a standardized quantita-tive analysis using fixed regions of interest to differentiate movement disorders on 123I-FP-CIT SPECT. J. Nucl. Med. Technol. 2007, 35, 21–26. [Google Scholar] [PubMed]
- Zubal, I.G.; Early, M.; Yuan, O.; Jennings, D.; Marek, K.; Seibyl, J.P. Optimized, Automated Striatal Uptake Analysis Applied to SPECT Brain Scans of Parkinson’s Disease Patients. J. Nucl. Med. 2007, 48, 857–864. [Google Scholar] [CrossRef] [PubMed] [Green Version]
- Ottaviani, S.; Tinazzi, M.; Pasquin, I.; Nothdurfter, W.; Tomelleri, G.; Fincati, E.; Nordera, G.; Moretto, G.; Fiaschi, A.; Smania, N.; et al. Comparative analysis of visual and semi-quantitative assessment of striatal [123I]FP-CIT-SPET binding in Parkinson’s disease. Neurol. Sci. 2006, 27, 397–401. [Google Scholar] [CrossRef] [PubMed]
- Werner, R.A.; Marcus, C.; Sheikhbahaei, S.; Solnes, L.B.; Leal, J.P.; Du, Y.; Rowe, S.P.; Higuchi, T.; Buck, A.K.; Lapa, C.; et al. Visual and Semiquantitative Accuracy in Clinical Baseline 123I-Ioflupane SPECT/CT Imaging. Clin. Nucl. Med. 2019, 44, 1–3. [Google Scholar] [CrossRef] [PubMed] [Green Version]
- Booij, J.; Dubroff, J.; Pryma, D.; Yu, J.Q.; Agarwal, R.; Lakhani, P.; Kuo, P.H. Diagnostic performance of the visual reading of (123)I-ioflupane SPECT images when assessed with or without quantification in patients with movement disorders or dementia. J. Nucl. Med. 2017, 58, 1821–1826. [Google Scholar] [CrossRef] [Green Version]
- Tinaz, S.; Chow, C.; Kuo, P.H.; Krupinski, E.A.; Blumenfeld, H.; Louis, E.D.; Zubal, G. Semiquantitative Analysis of Dopamine Transporter Scans in Patients with Parkinson Disease. Clin. Nucl. Med. 2018, 43, e1–e7. [Google Scholar] [CrossRef] [PubMed]
- Kuo, P.H.; Avery, R.; Krupinski, E.A.; Lei, H.; Bauer, A.; Sherman, S.; McMillan, N.; Seibyl, J.; Zubal, G. Receiver-Operator-Characteristic Analysis of an Automated Program for Analyzing Striatal Uptake of 123I-Ioflupane SPECT images: Calibration Using Visual Reads. J. Nucl. Med. Technol. 2013, 41, 26–31. [Google Scholar] [CrossRef] [Green Version]
- Subramaniam, R.M.; Frey, K.A.; Hunt, C.H.; Mercier, G.A.; Solnes, L.B.; Colletti, P.M.; Lu, Y.; Savir-Baruch, B.; Williams, H.T. ACR–ACNM Practice Parameter for the Performance of Dopamine Transporter (DaT) Single Photon Emission Computed Tomography (SPECT) Imaging for Movement Disorders. Clin. Nucl. Med. 2017, 42, 847–852. [Google Scholar] [CrossRef] [PubMed]
- Kupsch, A.R.; Bajaj, N.; Weiland, F.; Tartaglione, A.; Klutmann, S.; Buitendyk, M.; Sherwin, P.; Tate, A.; Grachev, I.D. Impact of DaTSCAN SPECT imaging in clinical management, diagnosis, confidence of diagnosis, quality of life, health resource use and safety in patients with clinically uncertain parkinsonian syndromes: A prospective 1-year follow-up of an open-label controlled study. J. Neurol. Neurosurg. Psychiatry 2012, 83, 620–628. [Google Scholar] [PubMed]
- Marshall, V.L.; Reininger, C.B.; Marquardt, M.; Patterson, J.; Hadley, D.M.; Oertel, W.H.; Benamer, H.T.S.; Kemp, P.; Burn, D.; Tolosa, E.; et al. Parkinson’s disease is overdiagnosed clinically at baseline in diagnostically uncertain cases: A 3-year European multicenter study with repeat [123I]FP-CIT SPECT. Mov. Disord. 2009, 24, 500–508. [Google Scholar] [CrossRef]
- McKeith, I.; O’Brien, J.; Walker, Z.; Tatsch, K.; Booij, J.; Darcourt, J.; Padovani, A.; Giubbini, R.; Bonuccelli, U.; Volterrani, D.; et al. Sensitivity and specificity of dopamine transporter imaging with 123I-FP-CIT SPECT in dementia with Lewy bodies: A phase III, multicentre study. Lancet Neurol. 2007, 6, 305–313. [Google Scholar] [CrossRef]
- Jiang, W.; Varma, S.; Simon, R. Calculating Confidence Intervals for Prediction Error in Microarray Classification Using Resampling. Stat. Appl. Genet. Mol. Biol. 2008, 7. [Google Scholar] [CrossRef] [PubMed]
- Agresti, A.; Coull, B.A. Approximate is Better than “Exact” for Interval Estimation of Binomial Proportions. Am. Stat. 1998, 52, 119–126. [Google Scholar] [CrossRef]
- Pagano, G.; Niccolini, F.; Politis, M. Imaging in Parkinson’s disease. Clin. Med. 2016, 16, 371–375. [Google Scholar] [CrossRef] [PubMed]
- Shigekiyo, T.; Arawaka, S. Laterality of specific binding ratios on DAT-SPECT for differential diagnosis of degenerative parkin-sonian syndromes. Sci. Rep. 2020, 10, 15761. [Google Scholar] [CrossRef] [PubMed]
- Kuo, P.H.; Lei, H.H.; Avery, R.; Krupinski, E.A.; Bauer, A.; Sherman, S.; McMillan, N.; Seibyl, J.; Zubal, G.I. Evaluation of an Objective Striatal Analysis Program for Determining Laterality in Uptake of 123I-Ioflupane SPECT Images: Comparison to Clinical Symptoms and to Visual Reads. J. Nucl. Med. Technol. 2014, 42, 105–108. [Google Scholar] [CrossRef] [PubMed] [Green Version]
- Yousaf, T.; Dervenoulas, G.; Valkimadi, P.E.; Politis, M. Neuroimaging in Lewy body dementia. J. Neurol. 2018, 266, 1–26. [Google Scholar] [CrossRef] [PubMed] [Green Version]
- Walker, Z.; Moreno, E.; Thomas, A.; Inglis, F.; Tabet, N.; Rainer, M.; Pizzolato, G.; Padovani, A. Clinical usefulness of dopamine transporter SPECT imaging with 123 I-FP-CIT in pa-tients with possible dementia with Lewy bodies: Randomised study. Br. J. Psychiatry 2015, 206, 145–152. [Google Scholar] [CrossRef] [PubMed] [Green Version]
- Walker, Z.; Costa, D.C.; Walker, R.W.H.; Lee, L.; Livingston, G.; Jaros, E.; Perry, R.; McKeith, I.; Katona, C.L.E. Striatal dopamine transporter in dementia with Lewy bodies and Parkinson disease: A comparison. Neurology 2004, 62, 1568–1572. [Google Scholar] [CrossRef] [PubMed]
- Matsuda, H.; Murata, M.; Mukai, Y.; Sako, K.; Ono, H.; Toyama, H.; Inui, Y.; Taki, Y.; Shimomura, H.; Nagayama, H.; et al. Japanese multicenter database of healthy controls for [123I]FP-CIT SPECT. Eur. J. Nucl. Med. Mol. Imaging 2018, 45, 1405–1416. [Google Scholar] [CrossRef] [PubMed] [Green Version]
- Mushtaq, R.; Kay, M.D.; Steinmeyer, L.; Warhadpande, D.; Kuo, P.H. Pearls and pitfalls of quantitative software analysis of dopa-mine transporter SPECT. Clin. Nucl. Med. 2020, 45, e469–e476. [Google Scholar] [CrossRef]


| Patient Characteristic | SC | MC | PPMI | Total |
|---|---|---|---|---|
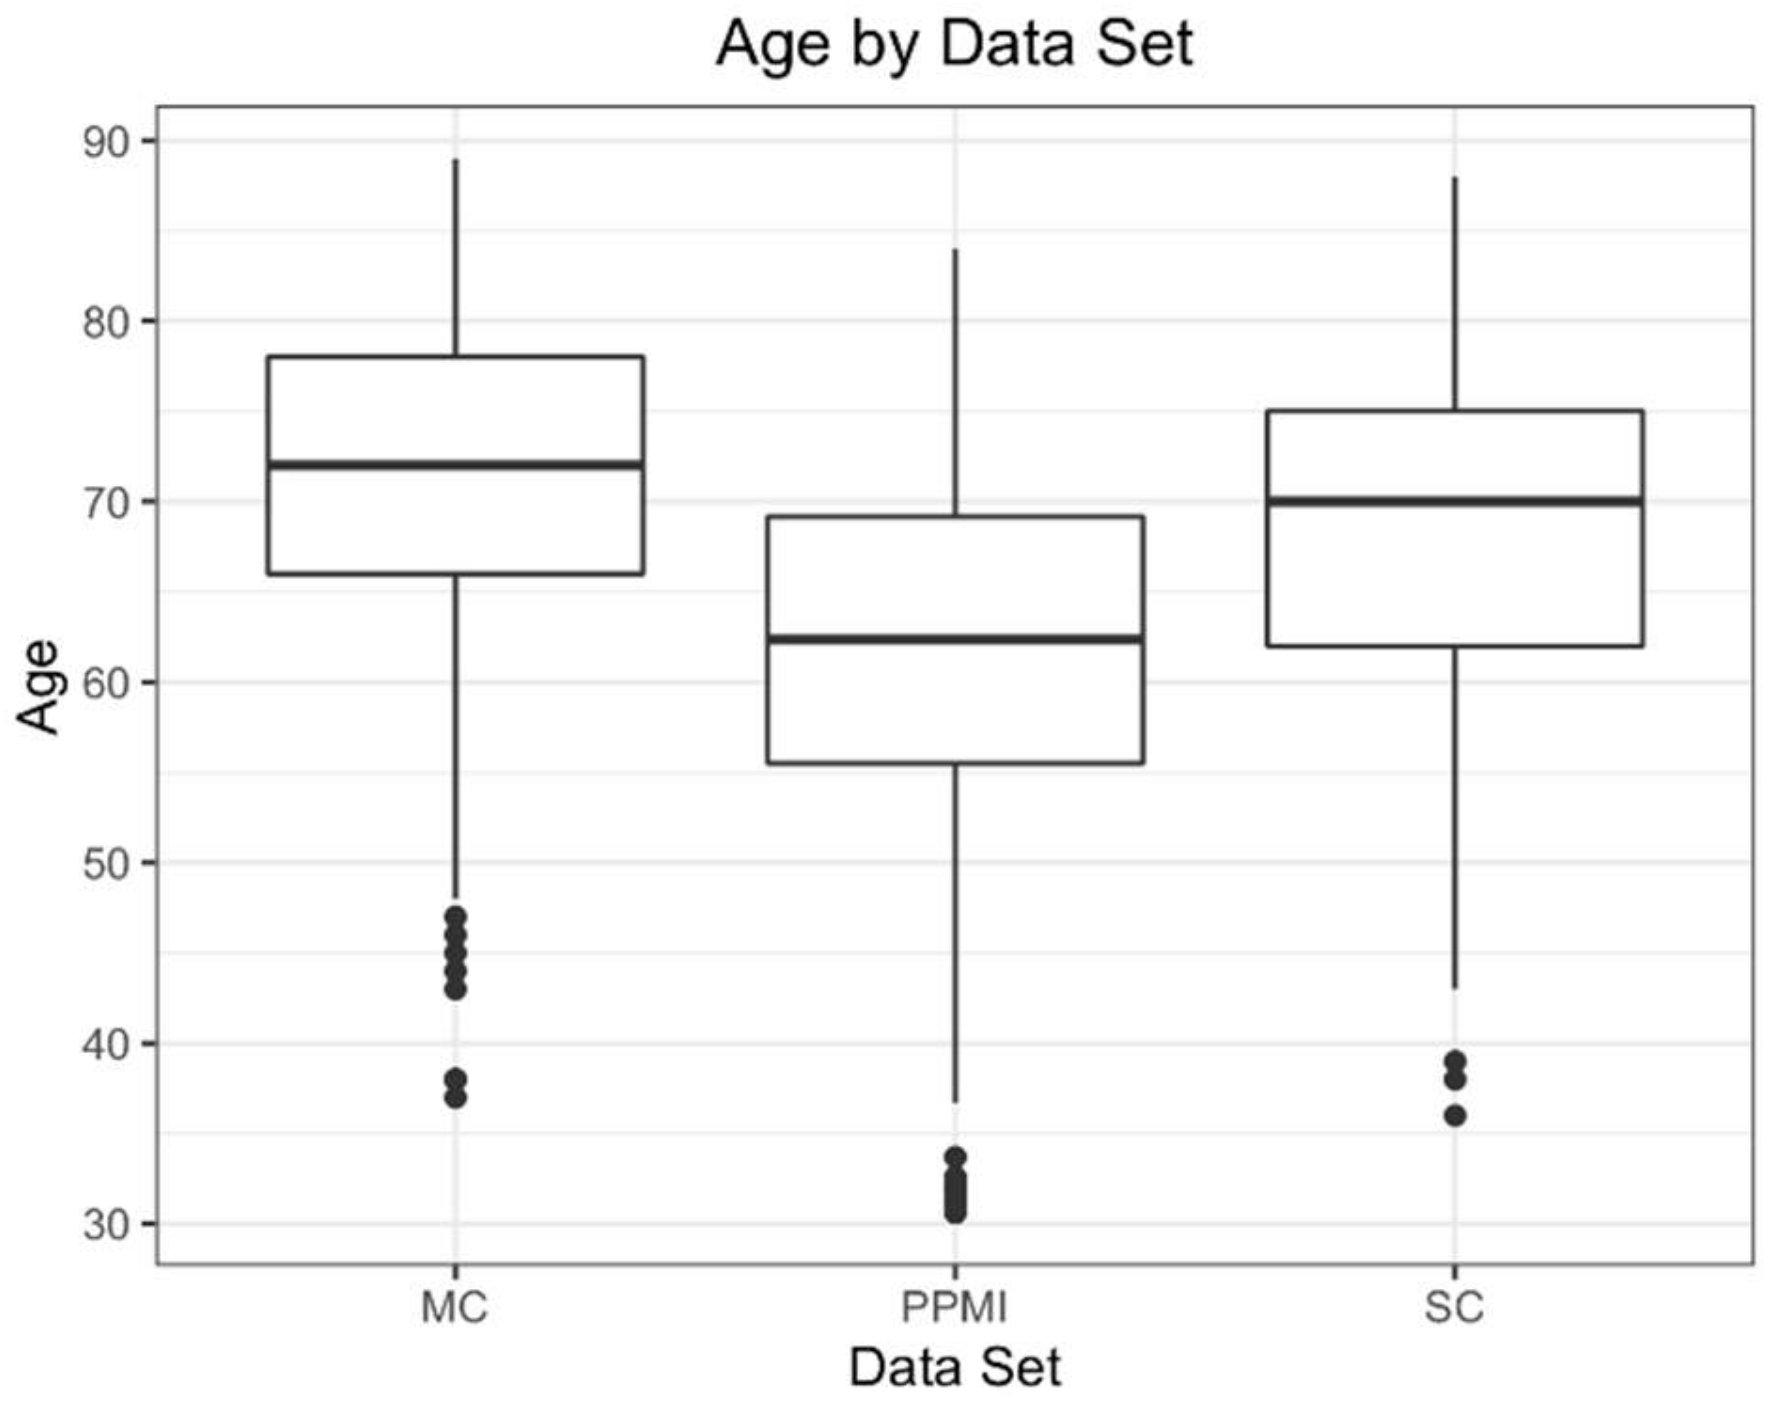
| Mean Age (years) | 67 ± 11 | 71 ± 10 | 62 ± 10 | 66 ± 11 |
| Gender | ||||
| Male | 67 (52%) | 169 (56%) | 249 (67%) | 485 (60%) |
| Female | 62 (48%) | 134 (44%) | 121 (33%) | 317 (40%) |
| Study Group | Summary Measure | Variable; Threshold | Accuracy | Sensitivity | Specificity |
|---|---|---|---|---|---|
| SC | SBR | Post. Putamen *; ≤0.94 † | 0.91 [0.85, 0.95] | 0.92 | 0.88 |
| z-score | Post. Putamen; ≤−1.9 | 0.90 [0.83, 0.96] | 0.91 | 0.88 | |
| Percent Deviation | Post. Putamen ‡; ≤−0.36 § | 0.90 [0.84, 0.95] | 0.91 | 0.88 | |
| MC | SBR | Post. Putamen; ≤0.90 | 0.85 [0.80, 0.90] | 0.82 | 0.88 |
| z-score | Post. Putamen; ≤−1.73 ‖ | 0.84 [0.80, 0.89] | 0.80 | 0.89 | |
| Percent Deviation | Post. Putamen; ≤−0.39 | 0.85 [0.81, 0.89] | 0.82 | 0.89 | |
| PPMI | SBR | Post. Putamen; ≤1.01 | 0.95 [0.92, 0.97] | 0.91 | 0.97 |
| z-score | Post. Putamen; ≤−1.68 | 0.94 [0.91, 0.96] | 0.91 | 0.95 | |
| Percent Deviation | Post. Putamen; ≤−0.32 | 0.94 [0.91, 0.97] | 0.92 | 0.95 |
| Study Group | Summary Measure | Variables | Accuracy | Sensitivity | Specificity |
|---|---|---|---|---|---|
| SC | SBR | Putamen, Post Putamen, Caudate Asymmetry | 0.92 [0.85, 0.98] | 0.92 | 0.92 |
| z-score | Putamen, Post Putamen, Putamen Asymmetry | 0.91 [0.84, 0.96] | 0.92 | 0.88 | |
| Percent Deviation | Striatum, Post Putamen, Striatum Asymmetry | 0.92 [0.86, 0.98] | 0.92 | 0.92 | |
| MC | SBR | Striatum, Post Putamen | 0.85 [0.81, 0.90] | 0.79 | 0.91 |
| z-score | Striatum, Caudate | 0.85 [0.81, 0.89] | 0.80 | 0.90 | |
| Percent Deviation | Post Putamen, Putamen Asymmetry | 0.85 [0.81, 0.89] | 0.82 | 0.89 | |
| PPMI | SBR | Striatum, Caudate, Putamen Asymmetry | 0.95 [0.93, 0.98] | 0.92 | 0.98 |
| z-score | Striatum, Caudate, Striatum Asymmetry | 0.95 [0.92, 0.97] | 0.92 | 0.97 | |
| Percent Deviation | Post Putamen, P:C | 0.95 [0.92, 0.97] | 0.91 | 0.98 |
| Study Group | Variable; Summary Measure Threshold | SC Test | MC Test | PPMI Test | ||||||
|---|---|---|---|---|---|---|---|---|---|---|
| Acc | Sens | Spec | Acc | Sens | Spec | Acc | Sens | Spec | ||
| SC | Post. Putamen *; SBR ≤ 0.94 † | 0.91 [0.85, 0.95] | 0.92 | 0.88 | 0.83 [0.79, 0.87] | 0.83 | 0.84 | 0.94 [0.91, 0.96] | 0.89 | 0.97 |
| Post. Putamen; z-score ≤ −1.9 | 0.90 [0.83, 0.96] | 0.91 | 0.88 | 0.85 [0.80, 0.88] | 0.78 | 0.91 | 0.92 [0.89, 0.95] | 0.89 | 0.95 | |
| Post. Putamen ‡; % Deviation ≤ −0.36 § | 0.90 [0.84, 0.95] | 0.91 | 0.88 | 0.86 [0.82, 0.90] | 0.83 | 0.89 | 0.94 [0.91, 0.96] | 0.91 | 0.95 | |
| MC | Post. Putamen; SBR ≤ 0.90 | 0.90 [0.84, 0.94] | 0.90 | 0.90 | 0.85 [0.80, 0.90] | 0.82 | 0.88 | 0.93 [0.90, 0.95] | 0.87 | 0.97 |
| Post. Putamen; z-score ≤ −1.73 ‖ | 0.89 [0.83, 0.93] | 0.91 | 0.86 | 0.84 [0.80, 0.89] | 0.80 | 0.89 | 0.93 [0.90, 0.95] | 0.91 | 0.95 | |
| Post. Putamen; % deviation ≤ −0.39 | 0.90 [0.84, 0.94] | 0.91 | 0.88 | 0.85 [0.81, 0.89] | 0.82 | 0.89 | 0.94 [0.91, 0.96] | 0.91 | 0.96 | |
| PPMI | Post. Putamen; SBR ≤ 1.01 | 0.91 [0.85, 0.95] | 0.94 | 0.88 | 0.82 [0.77, 0.86] | 0.83 | 0.80 | 0.95 [0.92, 0.97] | 0.91 | 0.97 |
| Post. Putamen; z-score ≤ −1.68 | 0.89 [0.83, 0.93] | 0.91 | 0.86 | 0.84 [0.80, 0.88] | 0.80 | 0.88 | 0.94 [0.91, 0.96] | 0.91 | 0.95 | |
| Post. Putamen; % deviation ≤ −0.32 | 0.89 [0.83, 0.93] | 0.92 | 0.84 | 0.83 [0.79, 0.87] | 0.83 | 0.84 | 0.94 [0.91, 0.97] | 0.92 | 0.95 | |
Publisher’s Note: MDPI stays neutral with regard to jurisdictional claims in published maps and institutional affiliations. |
© 2021 by the authors. Licensee MDPI, Basel, Switzerland. This article is an open access article distributed under the terms and conditions of the Creative Commons Attribution (CC BY) license (https://creativecommons.org/licenses/by/4.0/).
Share and Cite
Neill, M.; Fisher, J.M.; Brand, C.; Lei, H.; Sherman, S.J.; Chou, Y.-H.; Kuo, P.H. Practical Application of DaTQUANT with Optimal Threshold for Diagnostic Accuracy of Dopamine Transporter SPECT. Tomography 2021, 7, 980-989. https://doi.org/10.3390/tomography7040081
Neill M, Fisher JM, Brand C, Lei H, Sherman SJ, Chou Y-H, Kuo PH. Practical Application of DaTQUANT with Optimal Threshold for Diagnostic Accuracy of Dopamine Transporter SPECT. Tomography. 2021; 7(4):980-989. https://doi.org/10.3390/tomography7040081
Chicago/Turabian StyleNeill, Matthew, Julia M. Fisher, Christine Brand, Hong Lei, Scott J. Sherman, Ying-Hui Chou, and Phillip H. Kuo. 2021. "Practical Application of DaTQUANT with Optimal Threshold for Diagnostic Accuracy of Dopamine Transporter SPECT" Tomography 7, no. 4: 980-989. https://doi.org/10.3390/tomography7040081
APA StyleNeill, M., Fisher, J. M., Brand, C., Lei, H., Sherman, S. J., Chou, Y.-H., & Kuo, P. H. (2021). Practical Application of DaTQUANT with Optimal Threshold for Diagnostic Accuracy of Dopamine Transporter SPECT. Tomography, 7(4), 980-989. https://doi.org/10.3390/tomography7040081