
Stability of Radiomic Features across Different Region of Interest Sizes—A CT and MR Phantom Study


Abstract
1. Introduction
2. Materials and Methods
2.1. Phantom and Image Acquisition
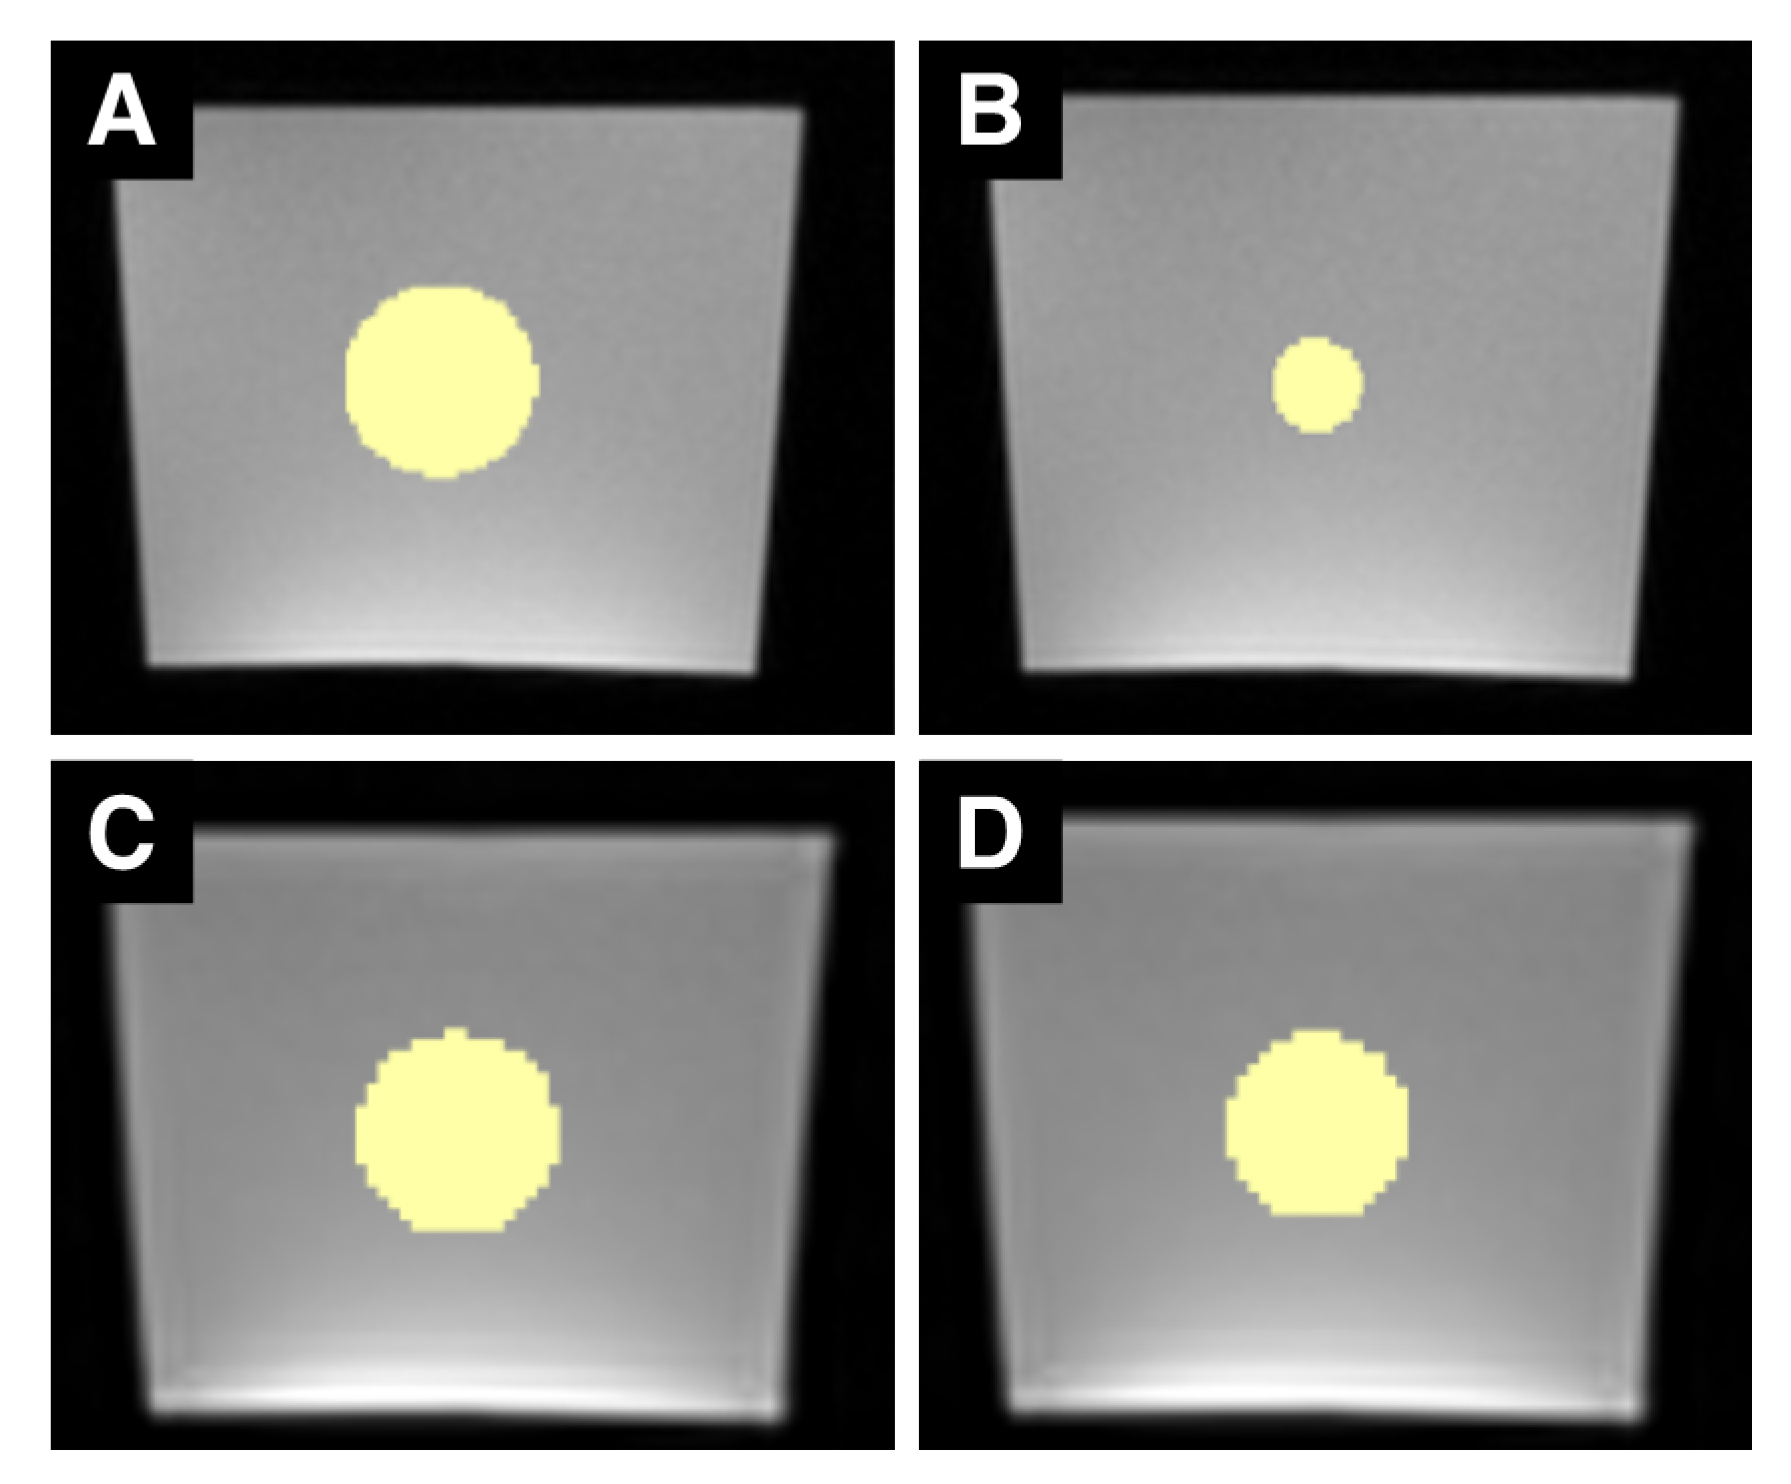
2.2. Image Analysis
2.3. Statistical Analysis
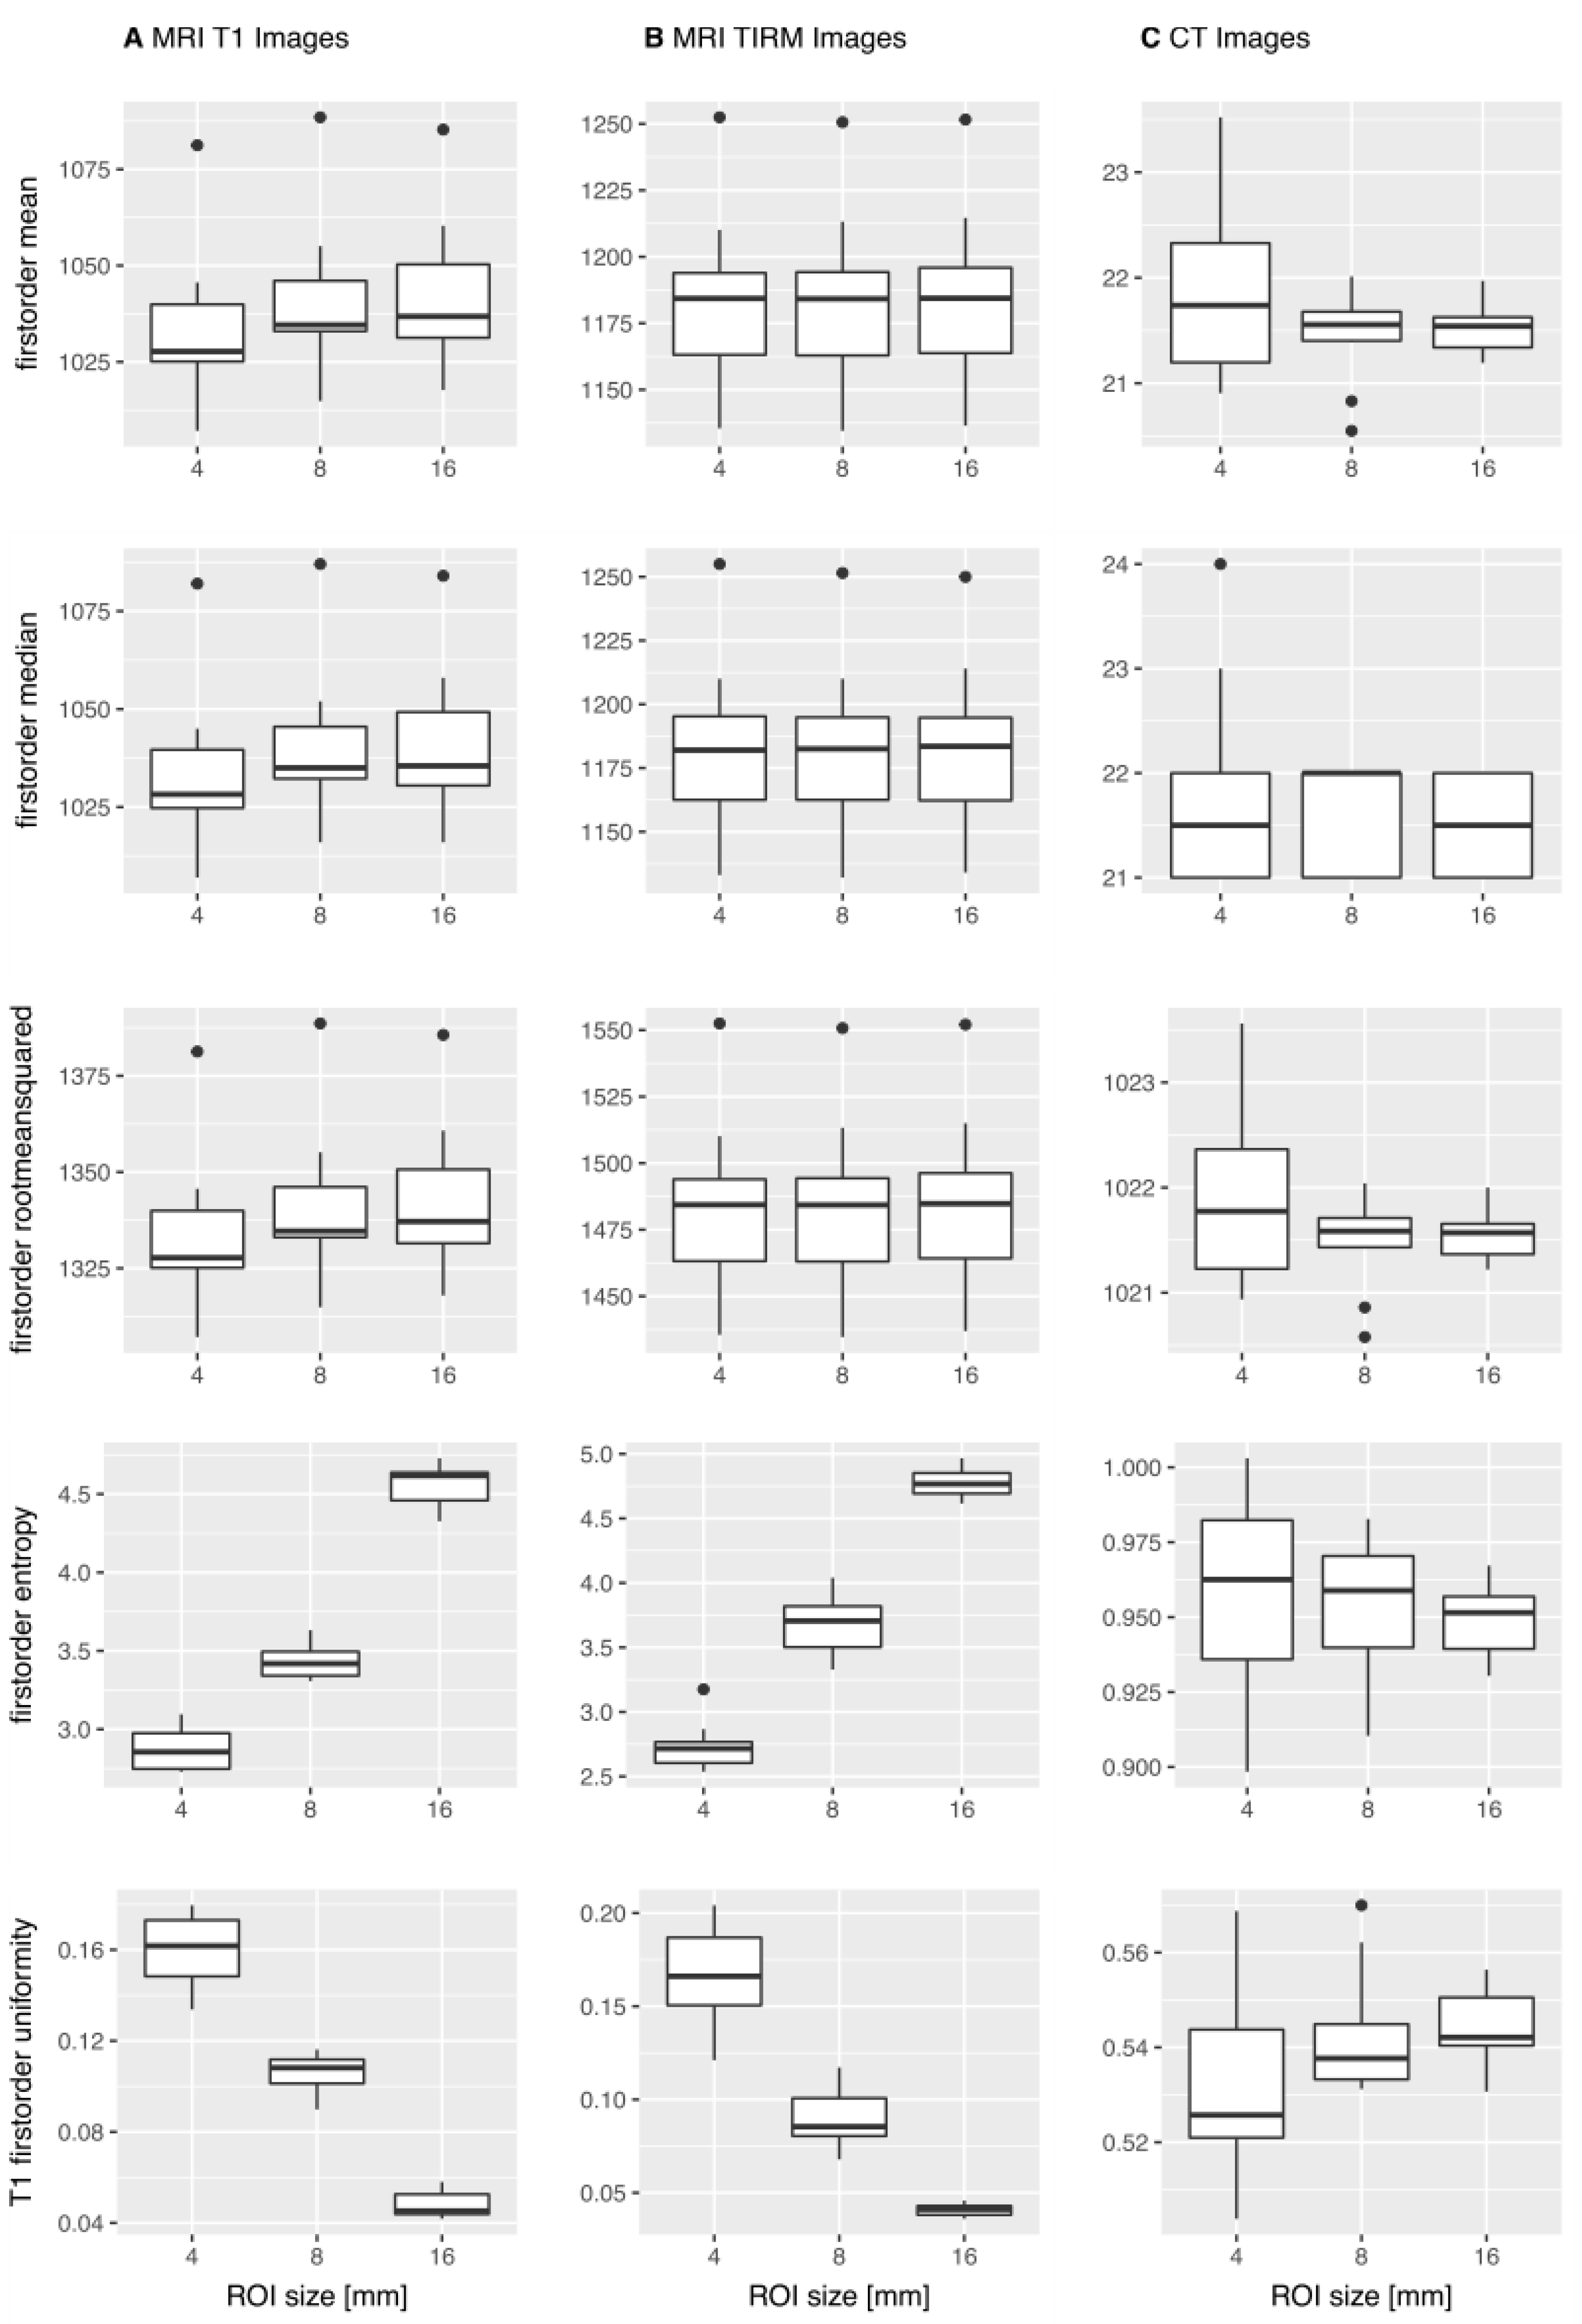
3. Results
3.1. MWU-Test
3.1.1. T1w MR Images
3.1.2. T2w TIRM Images
3.1.3. CT Images
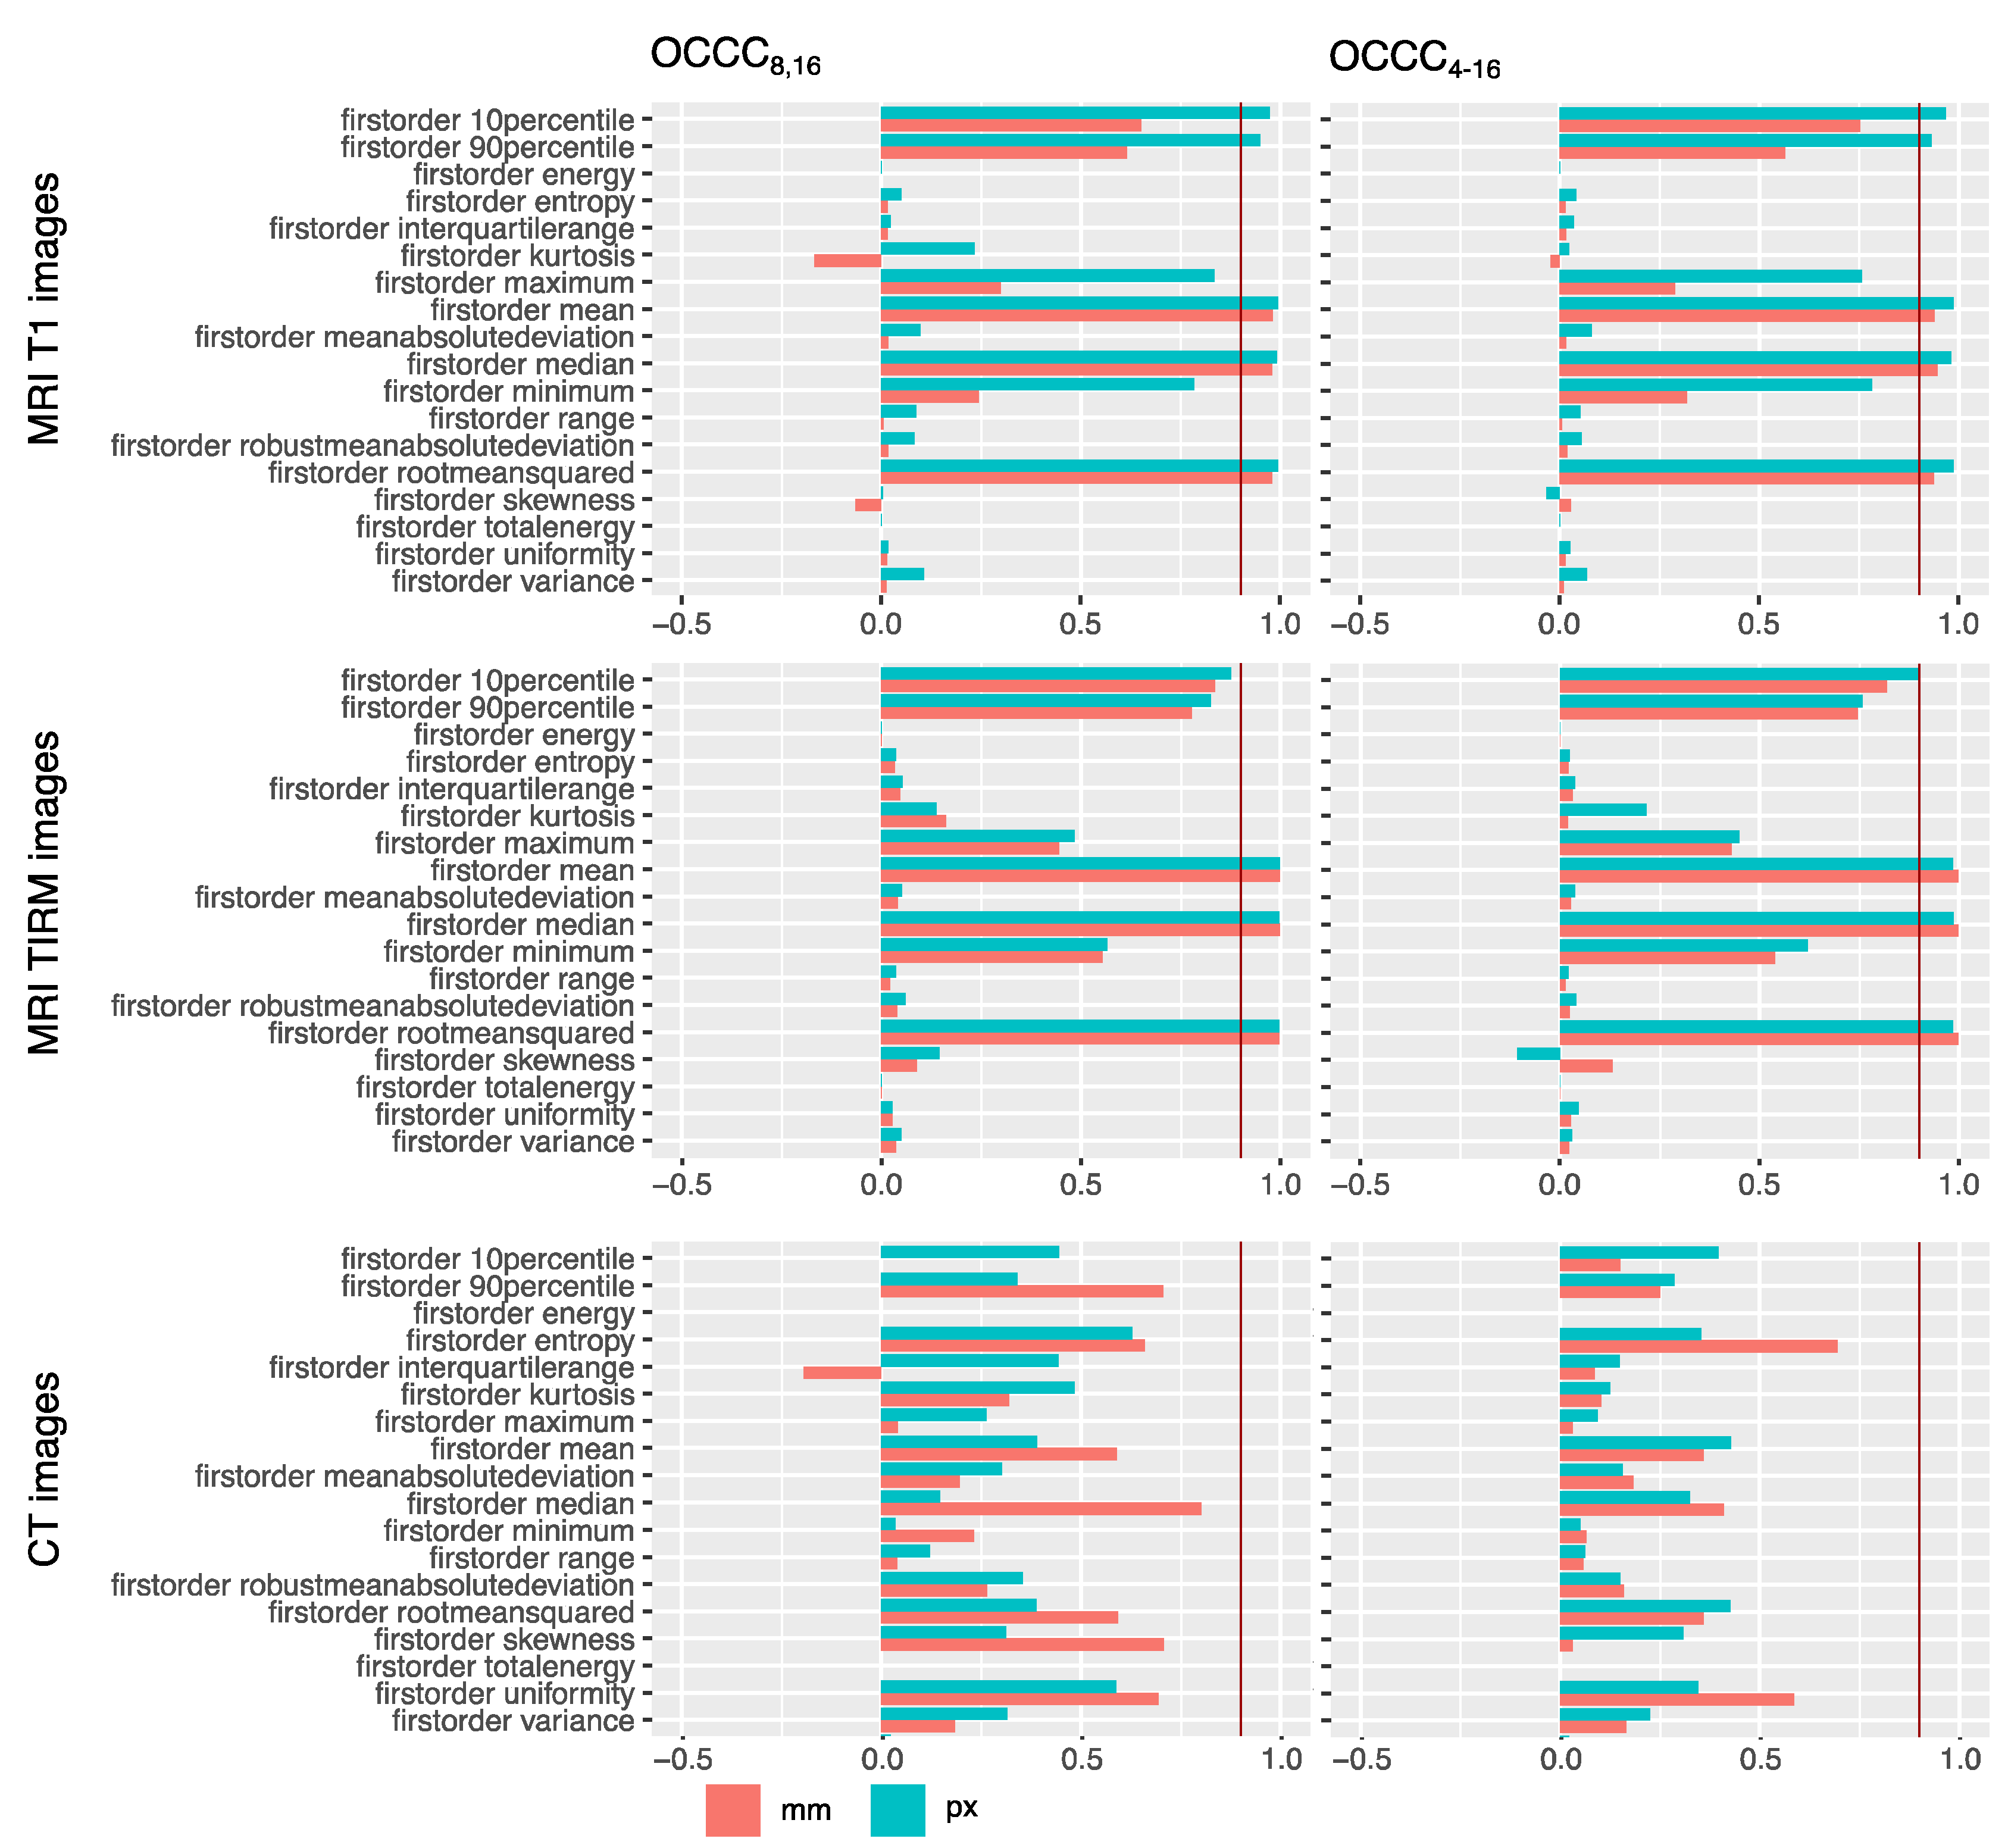
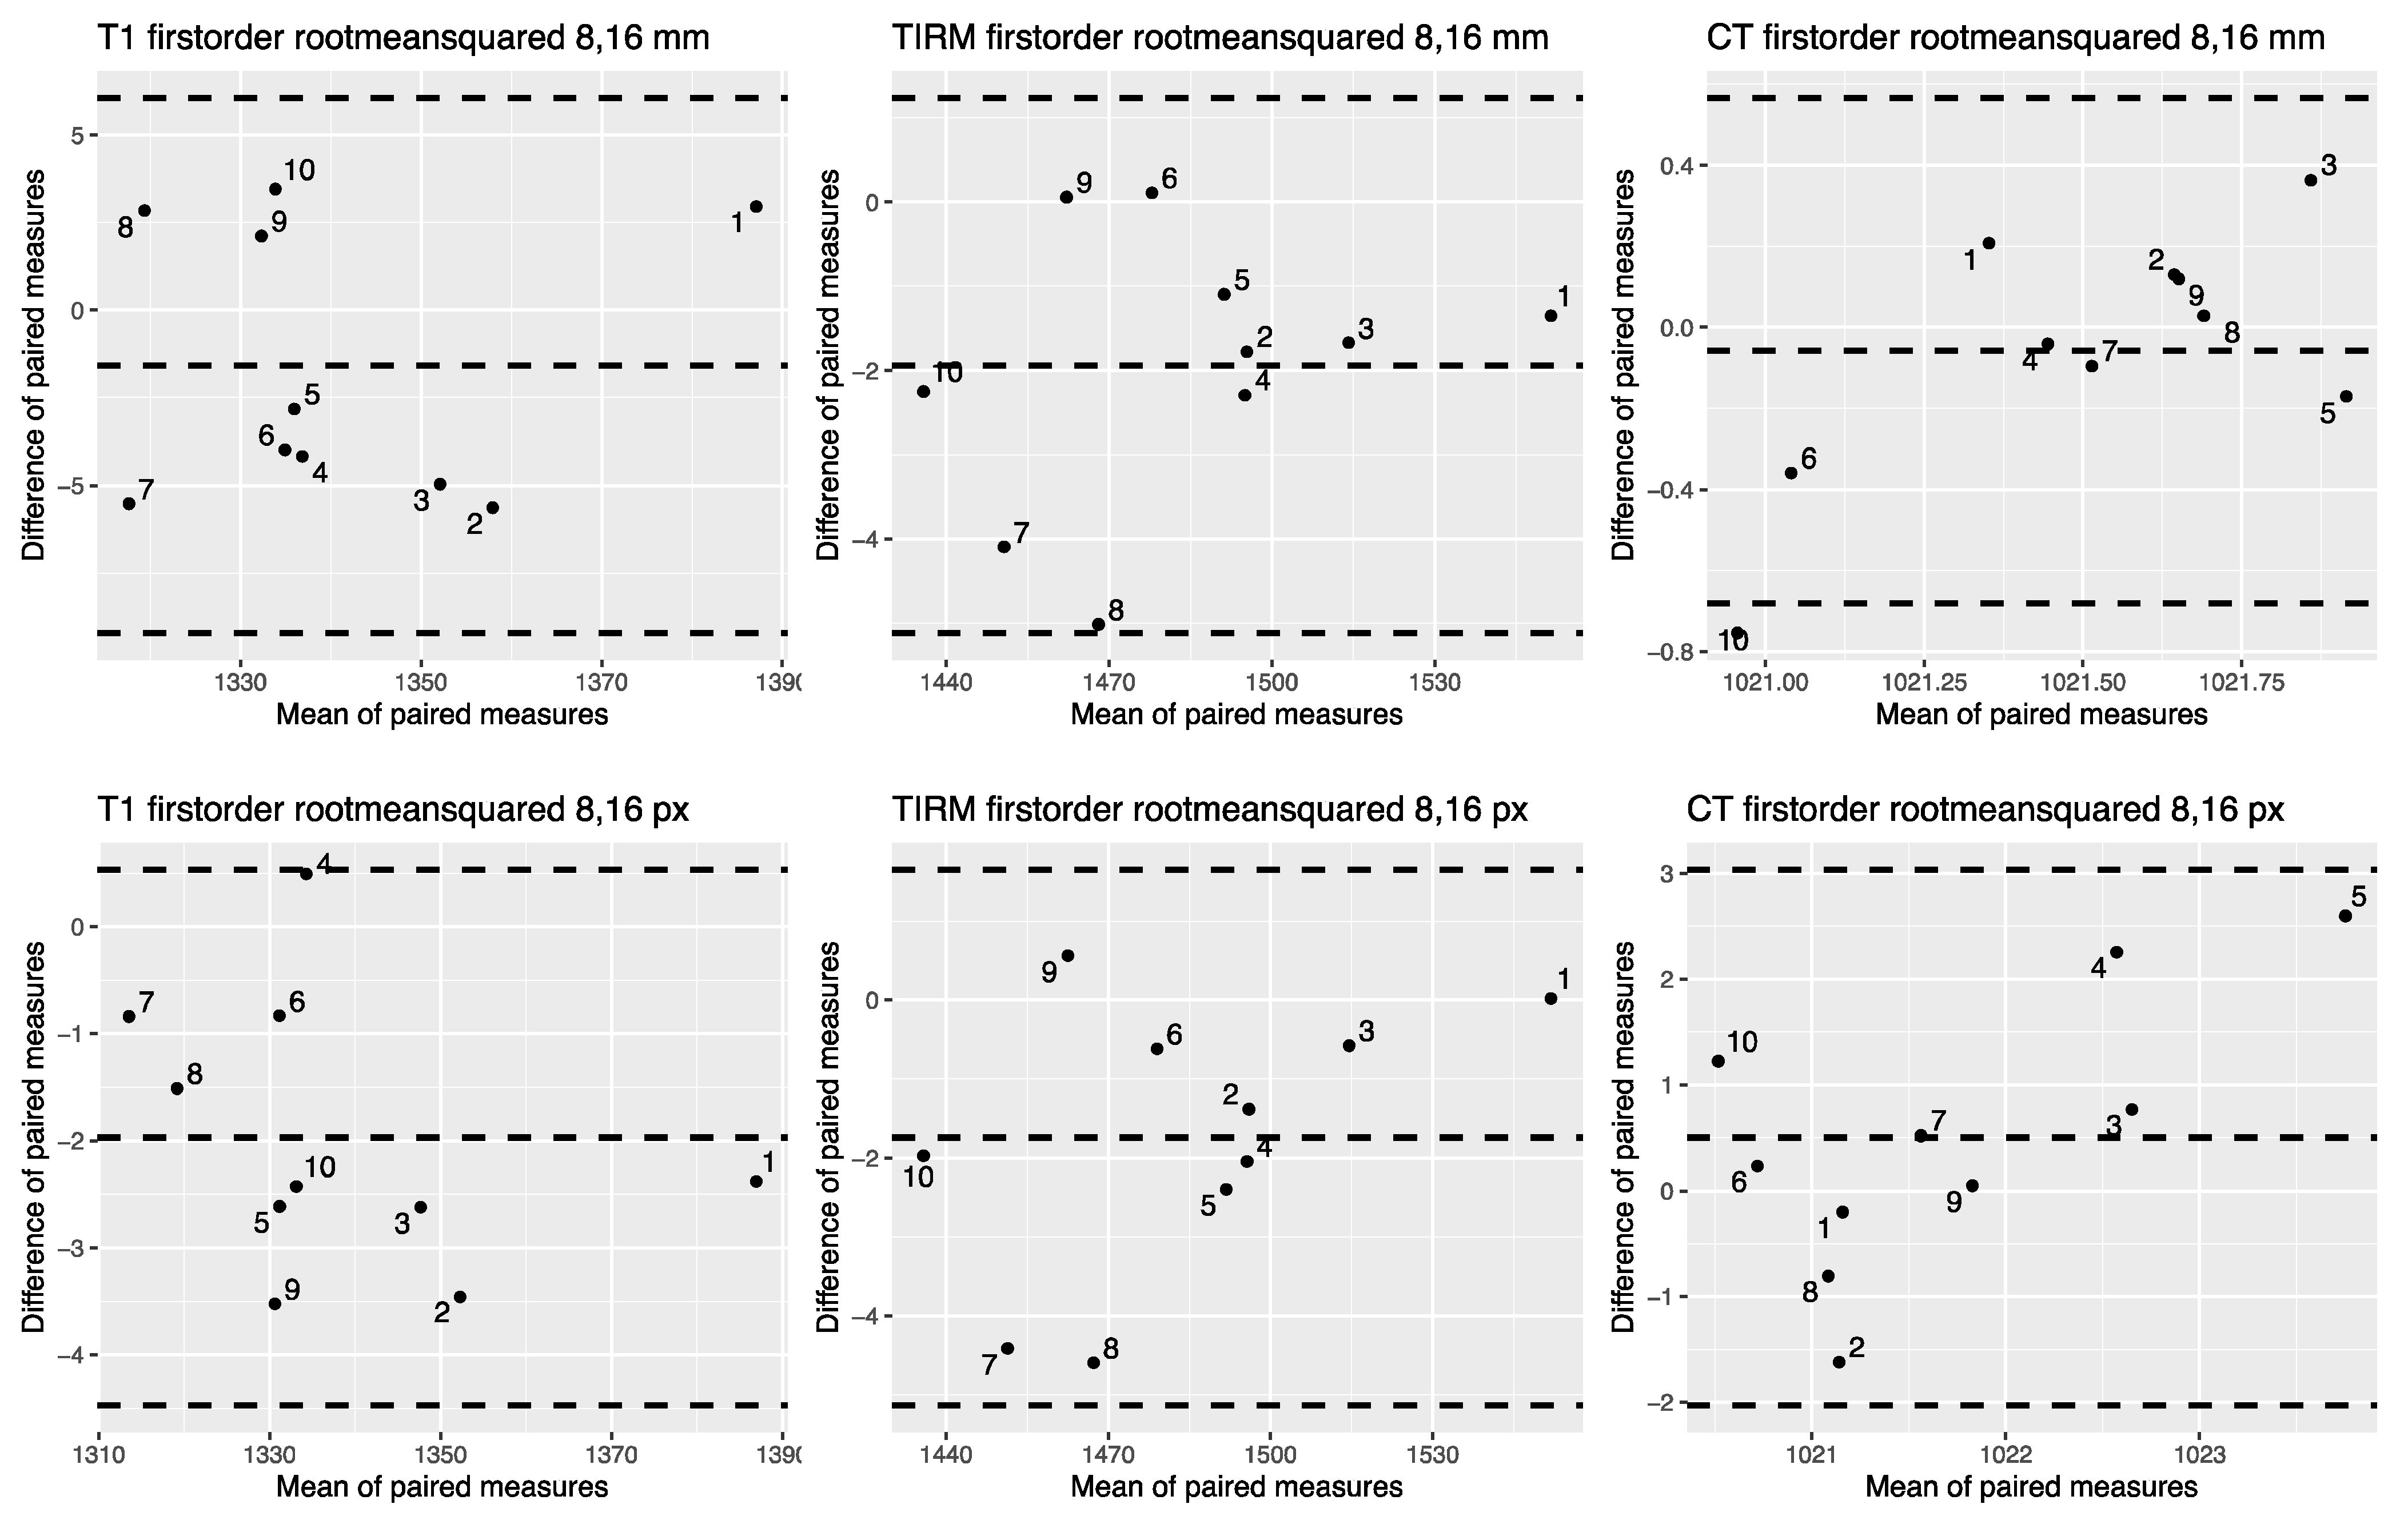
3.2. OCCCs
3.3. Intra- and Interrater Agreement
3.4. Summary of the Results
4. Discussion
5. Conclusions
Supplementary Materials
Author Contributions
Funding
Institutional Review Board Statement
Informed Consent Statement
Acknowledgments
Conflicts of Interest
References
- Ng, F.; Kozarski, R.; Ganeshan, B.; Goh, V. Assessment of tumor heterogeneity by CT texture analysis: Can the largest cross-sectional area be used as an alternative to whole tumor analysis? Eur. J. Radiol. 2013, 82, 342–348. [Google Scholar] [CrossRef] [PubMed]
- PyRadiomics Community. Available online: https://pyradiomics.readthedocs.io/en/latest/features.html#id3 (accessed on 21 February 2021).
- Rizzo, S.; Botta, F.; Raimondi, S.; Origgi, D.; Fanciullo, C.; Morganti, A.G.; Bellomi, M. Radiomics: The facts and the challenges of image analysis. Eur. Radiol. Exp. 2018, 2, 36. [Google Scholar] [CrossRef]
- Vaidya, M.; Creach, K.M.; Frye, J.; Dehdashti, F.; Bradley, J.D.; El Naqa, I. Combined PET/CT image characteristics for radiotherapy tumor response in lung cancer. Radiother. Oncol. 2012, 102, 239–245. [Google Scholar] [CrossRef]
- Zwanenburg, A.; Leger, S.; Vallières, M.; Löck, S. Image biomarker standardisation initiative. arXiv 2016, arXiv:1612.07003. [Google Scholar]
- Lambin, P.; Leijenaar, R.T.H.; Deist, T.M.; Peerlings, J.; de Jong, E.E.C.; van Timmeren, J.; Sanduleanu, S.; Larue, R.; Even, A.J.G.; Jochems, A.; et al. Radiomics: The bridge between medical imaging and personalized medicine. Nat. Rev. Clin. Oncol. 2017, 14, 749–762. [Google Scholar] [CrossRef] [PubMed]
- Bobholz, S.A.; Lowman, A.K.; Barrington, A.; Brehler, M.; McGarry, S.; Cochran, E.J.; Connelly, J.; Mueller, W.M.; Agarwal, M.; O’Neill, D.; et al. Radiomic Features of Multiparametric MRI Present Stable Associations With Analogous Histological Features in Patients With Brain Cancer. Tomography 2020, 6, 160–169. [Google Scholar] [CrossRef]
- Woolen, S.; Virkud, A.; Hadjiiski, L.; Cha, K.; Chan, H.P.; Swiecicki, P.; Worden, F.; Srinivasan, A. Prediction of Disease Free Survival in Laryngeal and Hypopharyngeal Cancers Using CT Perfusion and Radiomic Features: A Pilot Study. Tomography 2021, 7, 10–19. [Google Scholar] [CrossRef]
- Zhang, Y.; Li, X.; Lv, Y.; Gu, X. Review of Value of CT Texture Analysis and Machine Learning in Differentiating Fat-Poor Renal Angiomyolipoma from Renal Cell Carcinoma. Tomography 2020, 6, 325–332. [Google Scholar] [CrossRef] [PubMed]
- Kang, H.; Kim, E.E.; Shokouhi, S.; Tokita, K.; Shin, H.W. Texture Analysis of F-18 Fluciclovine PET/CT to Predict Biochemically Recurrent Prostate Cancer: Initial Results. Tomography 2020, 6, 301–307. [Google Scholar] [CrossRef] [PubMed]
- Wood, M.L. Variability and Standardization of Quantitative Imaging. Invest. Radiol. 2020, 55, 617–618. [Google Scholar] [CrossRef]
- Baessler, B.; Weiss, K.; Pinto Dos Santos, D. Robustness and Reproducibility of Radiomics in Magnetic Resonance Imaging: A Phantom Study. Investig. Radiol. 2019, 54, 221–228. [Google Scholar] [CrossRef]
- Tofts, P.S.; Collins, D.J. Multicentre imaging measurements for oncology and in the brain. Br. J. Radiol. 2011, 84, S213–S226. [Google Scholar] [CrossRef] [PubMed]
- Hagiwara, A.; Fujita, S.; Ohno, Y.; Aoki, S. Variability and Standardization of Quantitative Imaging: Monoparametric to Multiparametric Quantification, Radiomics, and Artificial Intelligence. Investig. Radiol. 2020, 55, 601–616. [Google Scholar] [CrossRef]
- Balagurunathan, Y.; Gu, Y.; Wang, H.; Kumar, V.; Grove, O.; Hawkins, S.; Kim, J.; Goldgof, D.B.; Hall, L.O.; Gatenby, R.A.; et al. Reproducibility and Prognosis of Quantitative Features Extracted from CT Images. Transl. Oncol. 2014, 7, 72–87. [Google Scholar] [CrossRef] [PubMed]
- Kalpathy-Cramer, J.; Mamomov, A.; Zhao, B.; Lu, L.; Cherezov, D.; Napel, S.; Echegaray, S.; Rubin, D.; McNitt-Gray, M.; Lo, P.; et al. Radiomics of Lung Nodules: A Multi-Institutional Study of Robustness and Agreement of Quantitative Imaging Features. Tomography 2016, 2, 430–437. [Google Scholar] [CrossRef] [PubMed]
- Shafiq-ul-Hassan, M.; Zhang, G.G.; Latifi, K.; Ullah, G.; Hunt, D.C.; Balagurunathan, Y.; Abdalah, M.A.; Schabath, M.B.; Goldgof, D.G.; Mackin, D. Intrinsic dependencies of CT radiomic features on voxel size and number of gray levels. Med. Phys. 2017, 44, 1050–1062. [Google Scholar] [CrossRef]
- Mackin, D.; Fave, X.; Zhang, L.; Fried, D.; Yang, J.; Taylor, B.; Rodriguez-Rivera, E.; Dodge, C.; Jones, A.K.; Court, L. Measuring Computed Tomography Scanner Variability of Radiomics Features. Investig. Radiol. 2015, 50, 757–765. [Google Scholar] [CrossRef]
- Rai, R.; Holloway, L.C.; Brink, C.; Field, M.; Christiansen, R.L.; Sun, Y.; Barton, M.B.; Liney, G.P. Multicenter evaluation of MRI-based radiomic features: A phantom study. Med. Phys. 2020, 47, 3054–3063. [Google Scholar] [CrossRef]
- Zhang, L.; Fried, D.V.; Fave, X.J.; Hunter, L.A.; Yang, J.; Court, L.E. IBEX: An open infrastructure software platform to facilitate collaborative work in radiomics. Med. Phys. 2015, 42, 1341–1353. [Google Scholar] [CrossRef]
- Traverso, A.; Kazmierski, M.; Shi, Z.; Kalendralis, P.; Welch, M.; Nissen, H.D.; Jaffray, D.; Dekker, A.; Wee, L. Stability of radiomic features of apparent diffusion coefficient (ADC) maps for locally advanced rectal cancer in response to image pre-processing. Phys. Med. 2019, 61, 44–51. [Google Scholar] [CrossRef]
- McNitt-Gray, M.; Napel, S.; Jaggi, A.; Mattonen, S.A.; Hadjiiski, L.; Muzi, M.; Goldgof, D.; Balagurunathan, Y.; Pierce, L.A.; Kinahan, P.E.; et al. Standardization in Quantitative Imaging: A Multicenter Comparison of Radiomic Features from Different Software Packages on Digital Reference Objects and Patient Data Sets. Tomography 2020, 6, 118–128. [Google Scholar] [CrossRef]
- Lu, L.; Liang, Y.; Schwartz, L.H.; Zhao, B. Reliability of Radiomic Features Across Multiple Abdominal CT Image Acquisition Settings: A Pilot Study Using ACR CT Phantom. Tomography 2019, 5, 226–231. [Google Scholar] [CrossRef]
- Berenguer, R.; Pastor-Juan, M.D.R.; Canales-Vazquez, J.; Castro-Garcia, M.; Villas, M.V.; Mansilla Legorburo, F.; Sabater, S. Radiomics of CT Features May Be Nonreproducible and Redundant: Influence of CT Acquisition Parameters. Radiology 2018, 288, 407–415. [Google Scholar] [CrossRef]
- Lu, L.; Sun, S.H.; Afran, A.; Yang, H.; Lu, Z.F.; So, J.; Schwartz, L.H.; Zhao, B. Identifying Robust Radiomics Features for Lung Cancer by Using In-Vivo and Phantom Lung Lesions. Tomography 2021, 7, 55–64. [Google Scholar] [CrossRef] [PubMed]
- van Timmeren, J.E.; Leijenaar, R.T.H.; van Elmpt, W.; Wang, J.; Zhang, Z.; Dekker, A.; Lambin, P. Test-Retest Data for Radiomics Feature Stability Analysis: Generalizable or Study-Specific? Tomography 2016, 2, 361–365. [Google Scholar] [CrossRef]
- Jafari-Khouzani, K.; Paynabar, K.; Hajighasemi, F.; Rosen, B. Effect of Region of Interest Size on the Repeatability of Quantitative Brain Imaging Biomarkers. IEEE Trans. Biomed. Eng. 2019, 66, 864–872. [Google Scholar] [CrossRef] [PubMed]
- Choi, W.; Riyahi, S.; Kligerman, S.J.; Liu, C.J.; Mechalakos, J.G.; Lu, W. Technical Note: Identification of CT Texture Features Robust to Tumor Size Variations for Normal Lung Texture Analysis. Int. J. Med. Phys. Clin. Eng. Radiat. Oncol. 2018, 7, 330–338. [Google Scholar] [CrossRef]
- Roy, S.; Whitehead, T.D.; Quirk, J.D.; Salter, A.; Ademuyiwa, F.O.; Li, S.; An, H.; Shoghi, K.I. Optimal co-clinical radiomics: Sensitivity of radiomic features to tumour volume, image noise and resolution in co-clinical T1-weighted and T2-weighted magnetic resonance imaging. EBioMedicine 2020, 59, 102963. [Google Scholar] [CrossRef] [PubMed]
- Traverso, A.; Kazmierski, M.; Zhovannik, I.; Welch, M.; Wee, L.; Jaffray, D.; Dekker, A.; Hope, A. Machine learning helps identifying volume-confounding effects in radiomics. Phys. Med. 2020, 71, 24–30. [Google Scholar] [CrossRef]
- Mayerhoefer, M.E.; Szomolanyi, P.; Jirak, D.; Berg, A.; Materka, A.; Dirisamer, A.; Trattnig, S. Effects of magnetic resonance image interpolation on the results of texture-based pattern classification: A phantom study. Investig. Radiol. 2009, 44, 405–411. [Google Scholar] [CrossRef]
- van Griethuysen, J.J.M.; Fedorov, A.; Parmar, C.; Hosny, A.; Aucoin, N.; Narayan, V.; Beets-Tan, R.G.H.; Fillion-Robin, J.C.; Pieper, S.; Aerts, H. Computational Radiomics System to Decode the Radiographic Phenotype. Cancer Res. 2017, 77, e104–e107. [Google Scholar] [CrossRef]
- Noortman, W.A.; Vriens, D.; Slump, C.H.; Bussink, J.; Meijer, T.W.H.; de Geus-Oei, L.F.; van Velden, F.H.P. Adding the temporal domain to PET radiomic features. PLoS ONE 2020, 15, e0239438. [Google Scholar] [CrossRef] [PubMed]
- Haralick, R.M.; Shanmugam, K.; Dinstein, I.H. Textural features for image classification. IEEE Trans. Syst. Man Cybern. 1973, 6, 610–621. [Google Scholar] [CrossRef]
- R Development Core Team. R: A Language and Environment for Statistical Computing; R Foundation for Statistical Computing: Vienna, Austria, 2016. [Google Scholar]
- Lin, L.I. A concordance correlation coefficient to evaluate reproducibility. Biometrics 1989, 45, 255–268. [Google Scholar] [CrossRef] [PubMed]
- Barnhart, H.X.; Haber, M.; Song, J. Overall concordance correlation coefficient for evaluating agreement among multiple observers. Biometrics 2002, 58, 1020–1027. [Google Scholar] [CrossRef]
- Package “epiR”. Available online: https://CRAN.R-project.org/package=epiR (accessed on 21 February 2021).
- Koo, T.K.; Li, M.Y. A Guideline of Selecting and Reporting Intraclass Correlation Coefficients for Reliability Research. J. Chiropr. Med. 2016, 15, 155–163. [Google Scholar] [CrossRef]
- Caramella, C.; Allorant, A.; Orlhac, F.; Bidault, F.; Asselain, B.; Ammari, S.; Jaranowski, P.; Moussier, A.; Balleyguier, C.; Lassau, N.; et al. Can we trust the calculation of texture indices of CT images? A phantom study. Med. Phys. 2018, 45, 1529–1536. [Google Scholar] [CrossRef]
- Nardone, V.; Reginelli, A.; Guida, C.; Belfiore, M.P.; Biondi, M.; Mormile, M.; Banci Buonamici, F.; Di Giorgio, E.; Spadafora, M.; Tini, P.; et al. Delta-radiomics increases multicentre reproducibility: A phantom study. Med. Oncol. 2020, 37, 38. [Google Scholar] [CrossRef] [PubMed]
- Paul, R.; Shafiq-Ul Hassan, M.; Moros, E.G.; Gillies, R.J.; Hall, L.O.; Goldgof, D.B. Deep Feature Stability Analysis Using CT Images of a Physical Phantom Across Scanner Manufacturers, Cartridges, Pixel Sizes, and Slice Thickness. Tomography 2020, 6, 250–260. [Google Scholar] [CrossRef]


| Parameter | T1w GRE | T2w TIRM |
|---|---|---|
| TR/TE (ms) | 250/3.43 | 9000/85 |
| Flip angle (°) | 70 | 150 |
| Slice thickness (mm) | 5 | 4 |
| Matrix | 512 × 410 | 256 × 218 |
| Field of view (mm) | 240 × 240 | 230 × 230 |
| Parameter | |
|---|---|
| Tube voltage (kVp) | 120 |
| X-ray tube current (mA) | 50 |
| Exposure time (s) | 0.5 |
| Single collimation width | 0.5 |
| Total collimation width | 100 |
| Reconstruction kernel | Body |
| Slice thickness (mm) | 0.5 |
| Pixel spacing (mm) | 0.430\0.430 |
| Matrix | 512 × 512 |
| Field of view (mm) | 220 × 220 |
| Intrarater | |||
|---|---|---|---|
| Parameter | ICC | 95% CI | p |
| Energy | 1.000 | 1.000–1.000 | <0.001 |
| Total energy | 1.000 | 1.000–1.000 | <0.001 |
| Entropy | 0.998 | 0.997–0.998 | <0.001 |
| Minimum | 1.000 | 1.000–1.000 | <0.001 |
| Maximum | 1.000 | 1.000–1.000 | <0.001 |
| Mean | 1.000 | 1.000–1.000 | <0.001 |
| Median | 1.000 | 1.000–1.000 | <0.001 |
| IQR | 0.990 | 0.989–0.991 | <0.001 |
| Range | 0.997 | 0.997–0.997 | <0.001 |
| MAD | 0.996 | 0.995–0.996 | <0.001 |
| RMAD | 0.993 | 0.992–0.994 | <0.001 |
| RMS | 1.000 | 1.000–1.000 | <0.001 |
| Skewness | 0.726 | 0.695–0.755 | <0.001 |
| Kurtosis | 0.482 | 0.422–0.536 | <0.001 |
| Variance | 0.993 | 0.992–0.993 | <0.001 |
| Uniformity | 0.992 | 0.991–0.993 | <0.001 |
| 10th percentile | 1.000 | 1.000–1.000 | <0.001 |
| 90th percentile | 1.000 | 1.000–1.000 | <0.001 |
| Interrater | |||
| Parameter | ICC | 95% CI | p |
| Energy | 1.000 | 1.000–1.000 | <0.001 |
| Total energy | 1.000 | 1.000–1.000 | <0.001 |
| Entropy | 0.994 | 0.993–0.995 | <0.001 |
| Minimum | 1.000 | 1.000–1.000 | <0.001 |
| Maximum | 1.000 | 1.000–1.000 | <0.001 |
| Mean | 1.000 | 1.000–1.000 | <0.001 |
| Median | 1.000 | 1.000–1.000 | <0.001 |
| IQR | 0.981 | 0.987–0.984 | <0.001 |
| Range | 0.987 | 0.985–0.989 | <0.001 |
| MAD | 0.983 | 0.979–0.985 | <0.001 |
| RMAD | 0.982 | 0.979–0.985 | <0.001 |
| RMS | 1.000 | 1.000–1.000 | <0.001 |
| Skewness | 0.525 | 0.471–0.575 | <0.001 |
| Kurtosis | 0.319 | 0.240–0.389 | <0.001 |
| Variance | 0.962 | 0.956–0.966 | <0.001 |
| Uniformity | 0.988 | 0.986–0.990 | <0.001 |
| 10th percentile | 1.000 | 1.000–1.000 | <0.001 |
Publisher’s Note: MDPI stays neutral with regard to jurisdictional claims in published maps and institutional affiliations. |
© 2021 by the authors. Licensee MDPI, Basel, Switzerland. This article is an open access article distributed under the terms and conditions of the Creative Commons Attribution (CC BY) license (https://creativecommons.org/licenses/by/4.0/).
Share and Cite
Jensen, L.J.; Kim, D.; Elgeti, T.; Steffen, I.G.; Hamm, B.; Nagel, S.N. Stability of Radiomic Features across Different Region of Interest Sizes—A CT and MR Phantom Study. Tomography 2021, 7, 238-252. https://doi.org/10.3390/tomography7020022
Jensen LJ, Kim D, Elgeti T, Steffen IG, Hamm B, Nagel SN. Stability of Radiomic Features across Different Region of Interest Sizes—A CT and MR Phantom Study. Tomography. 2021; 7(2):238-252. https://doi.org/10.3390/tomography7020022
Chicago/Turabian StyleJensen, Laura J., Damon Kim, Thomas Elgeti, Ingo G. Steffen, Bernd Hamm, and Sebastian N. Nagel. 2021. "Stability of Radiomic Features across Different Region of Interest Sizes—A CT and MR Phantom Study" Tomography 7, no. 2: 238-252. https://doi.org/10.3390/tomography7020022
APA StyleJensen, L. J., Kim, D., Elgeti, T., Steffen, I. G., Hamm, B., & Nagel, S. N. (2021). Stability of Radiomic Features across Different Region of Interest Sizes—A CT and MR Phantom Study. Tomography, 7(2), 238-252. https://doi.org/10.3390/tomography7020022