


Bio-Inspired Spotted Hyena Optimizer with Deep Convolutional Neural Network-Based Automated Food Image Classification

Abstract
:1. Introduction
- (a)
- The development of an automated SHODCNN-FIC algorithm, including Xception feature extraction, SHO-based parameter tuning, and ELM-based classification for food classification. To the best of the authors’ knowledge, the SHODCNN-FIC approach has never been reported in the literature.
- (b)
- The development of a new technique, i.e., SHODCNN-FIC, by combining bio-inspired optimization and DL for automatic food image classification. The proposed technique is highly useful in many real-time applications involving dietary analysis and restaurant menu management.
- (c)
- The SHODCNN-FIC leverages the power of deep learning using the DCNN-based Xception model for extracting the feature vectors from food images. Furthermore, the optimum fine-tuning of the hyperparameters for the Xception model, using the SHO technique, improves the performance of the DL model by fine-tuning its parameters.
- (d)
- The application of the ELM model for the actual detection and classification of food images. ELM is known for its high accuracy and fast training features in different machine-learning tasks.
2. Related Works
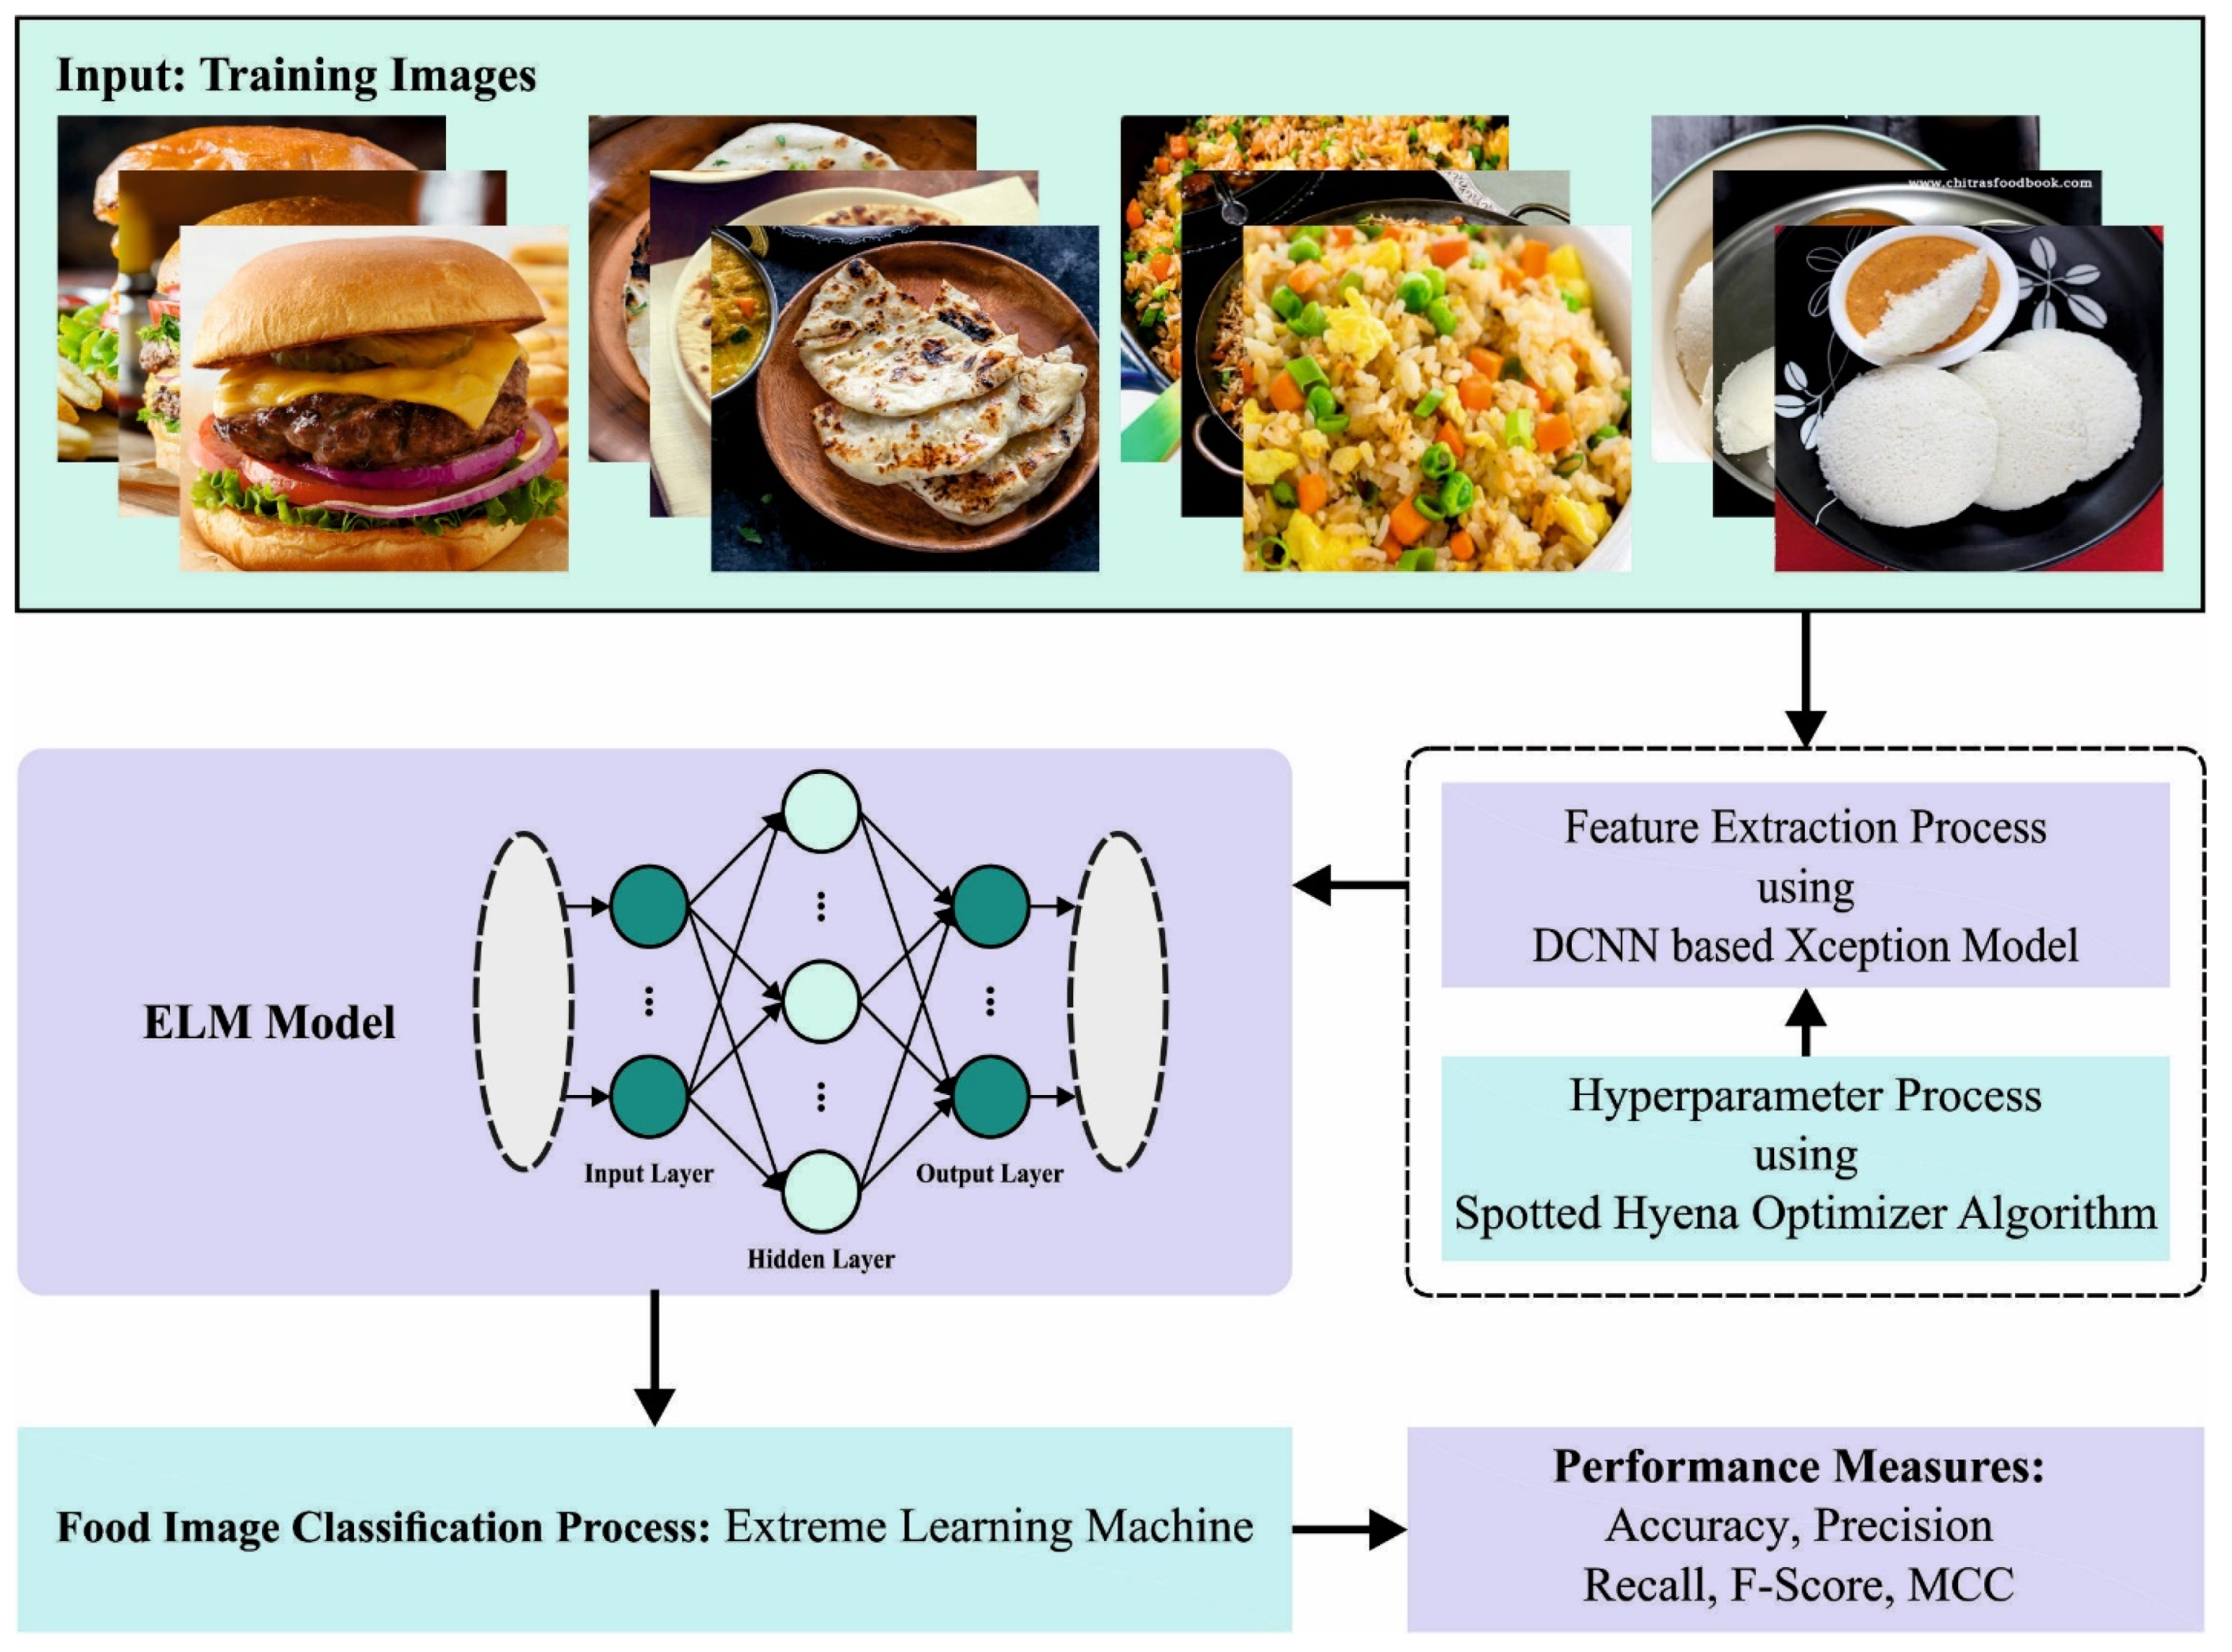
3. The Proposed Model
3.1. Feature Extraction Using Xception Model
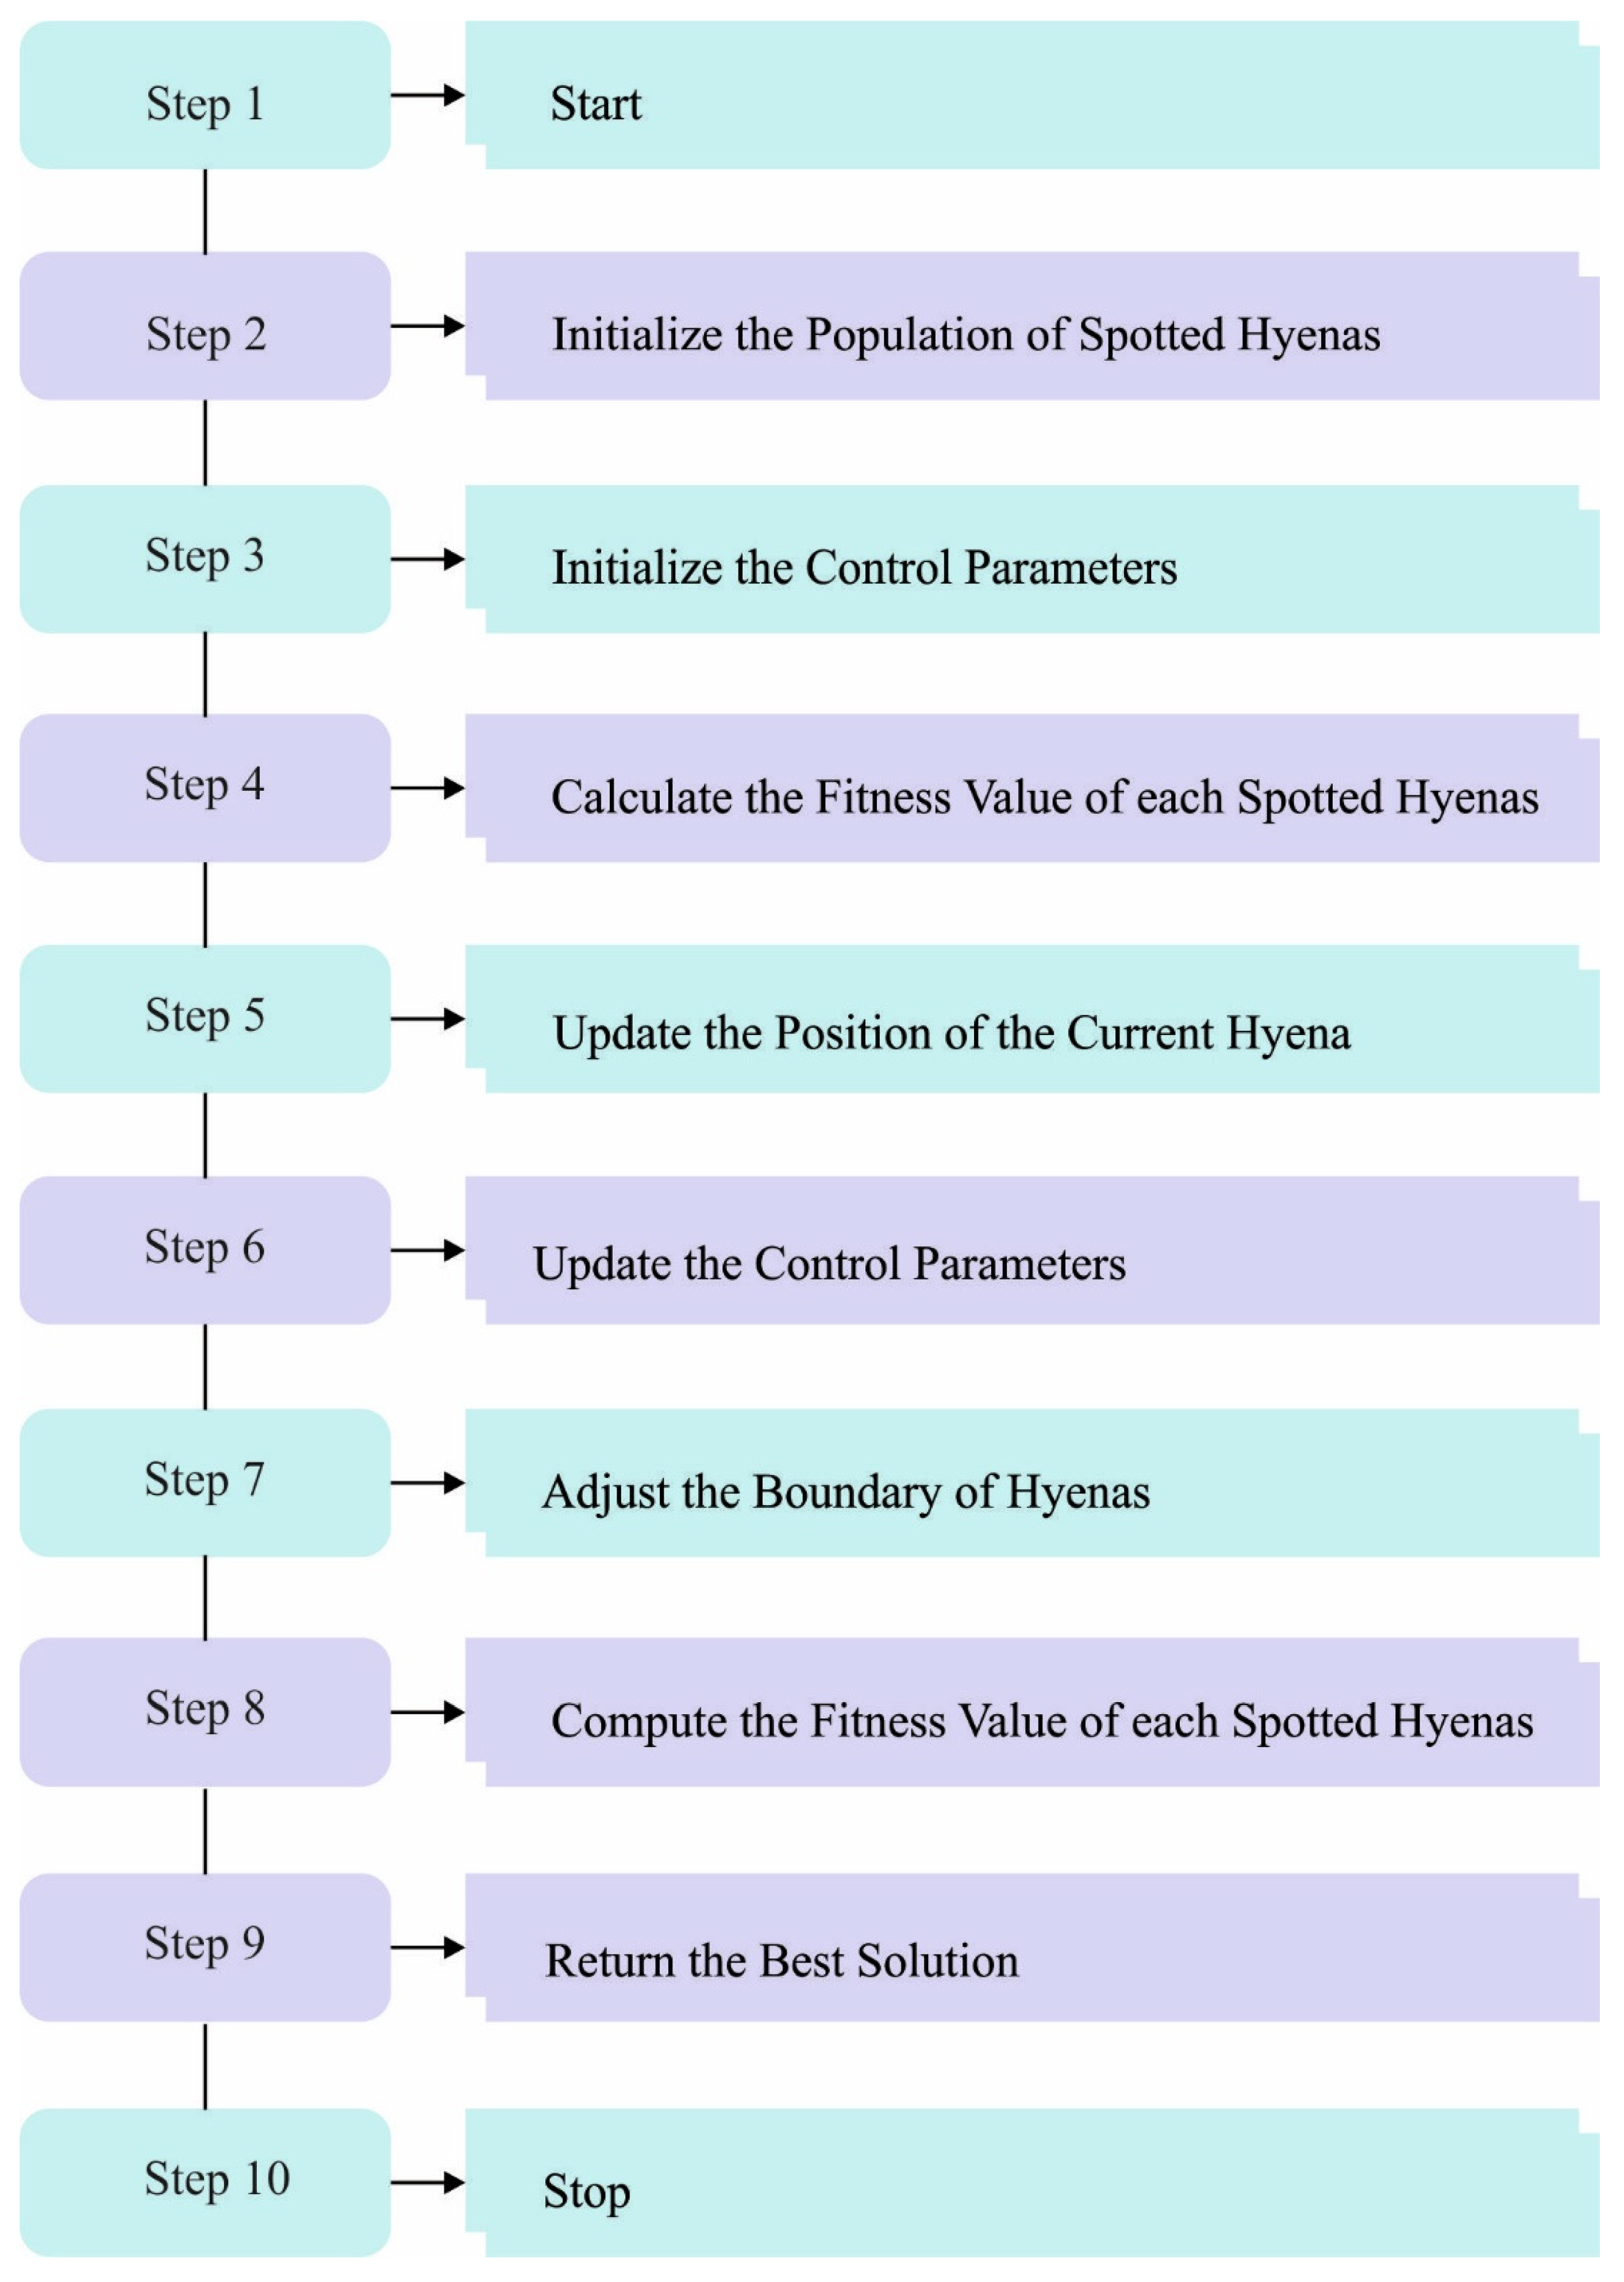
3.2. Hyperparameter Tuning Using the SHO Algorithm
3.3. Image Classification Using the ELM Model
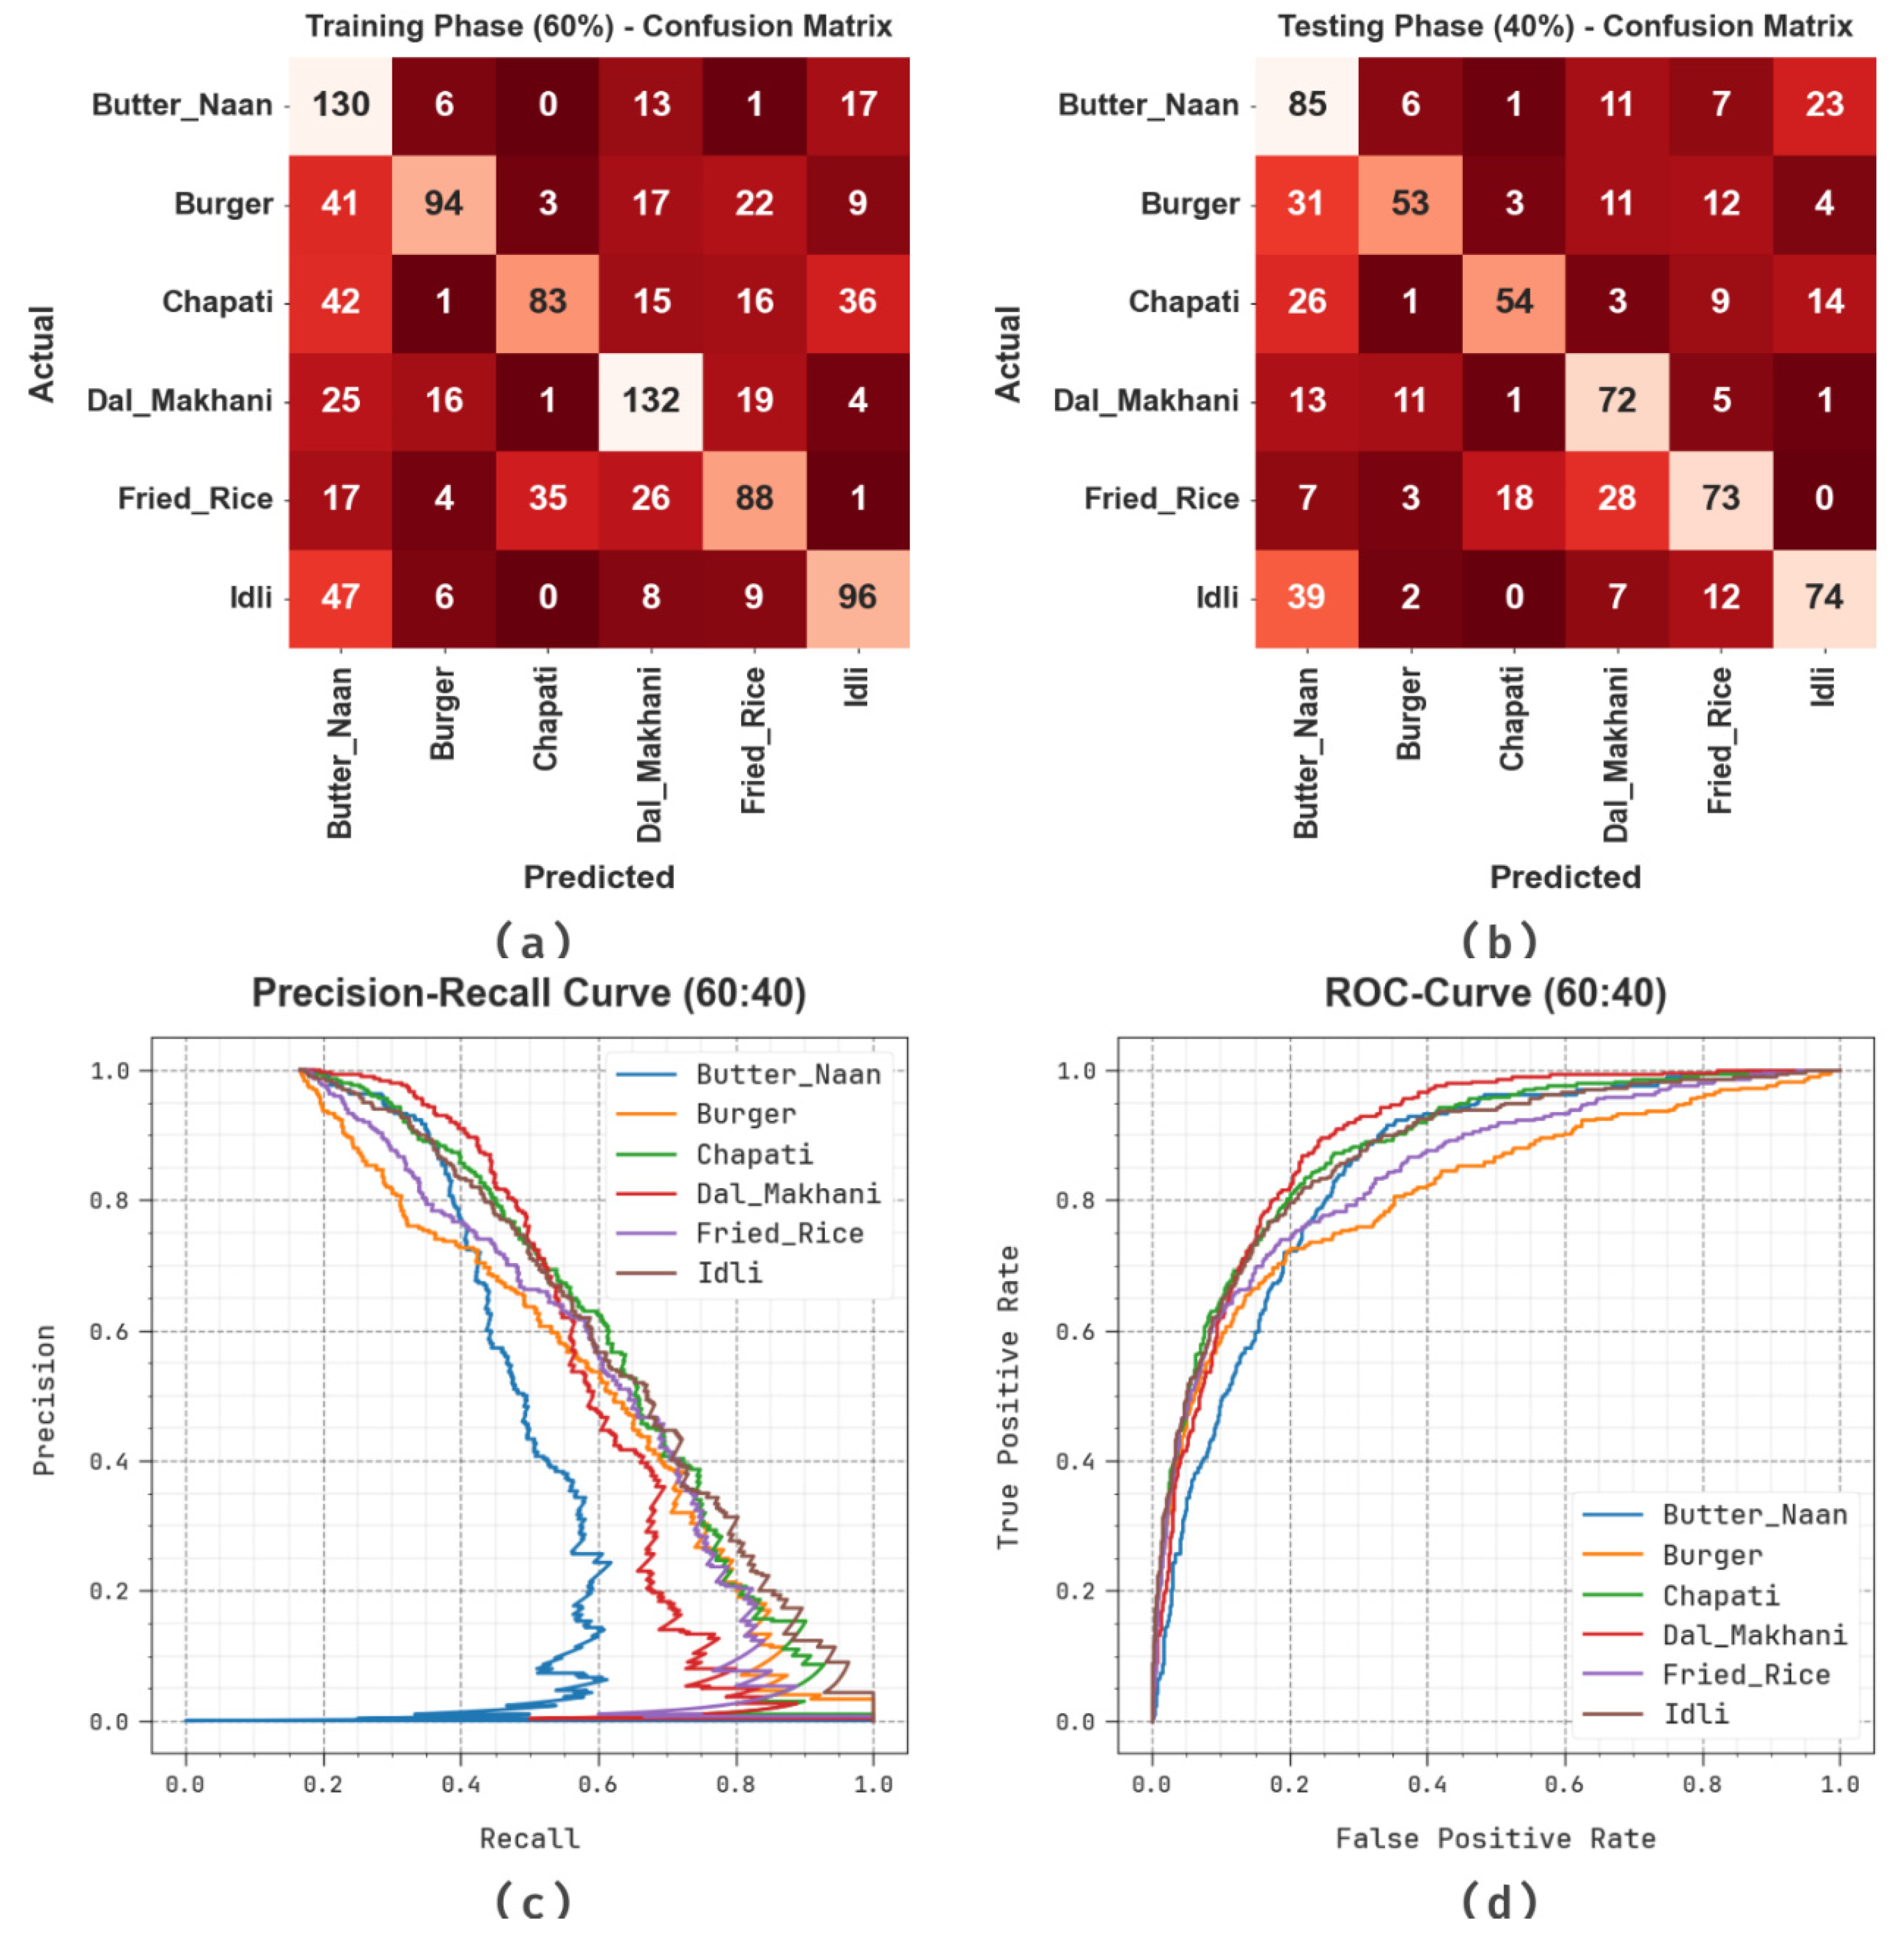
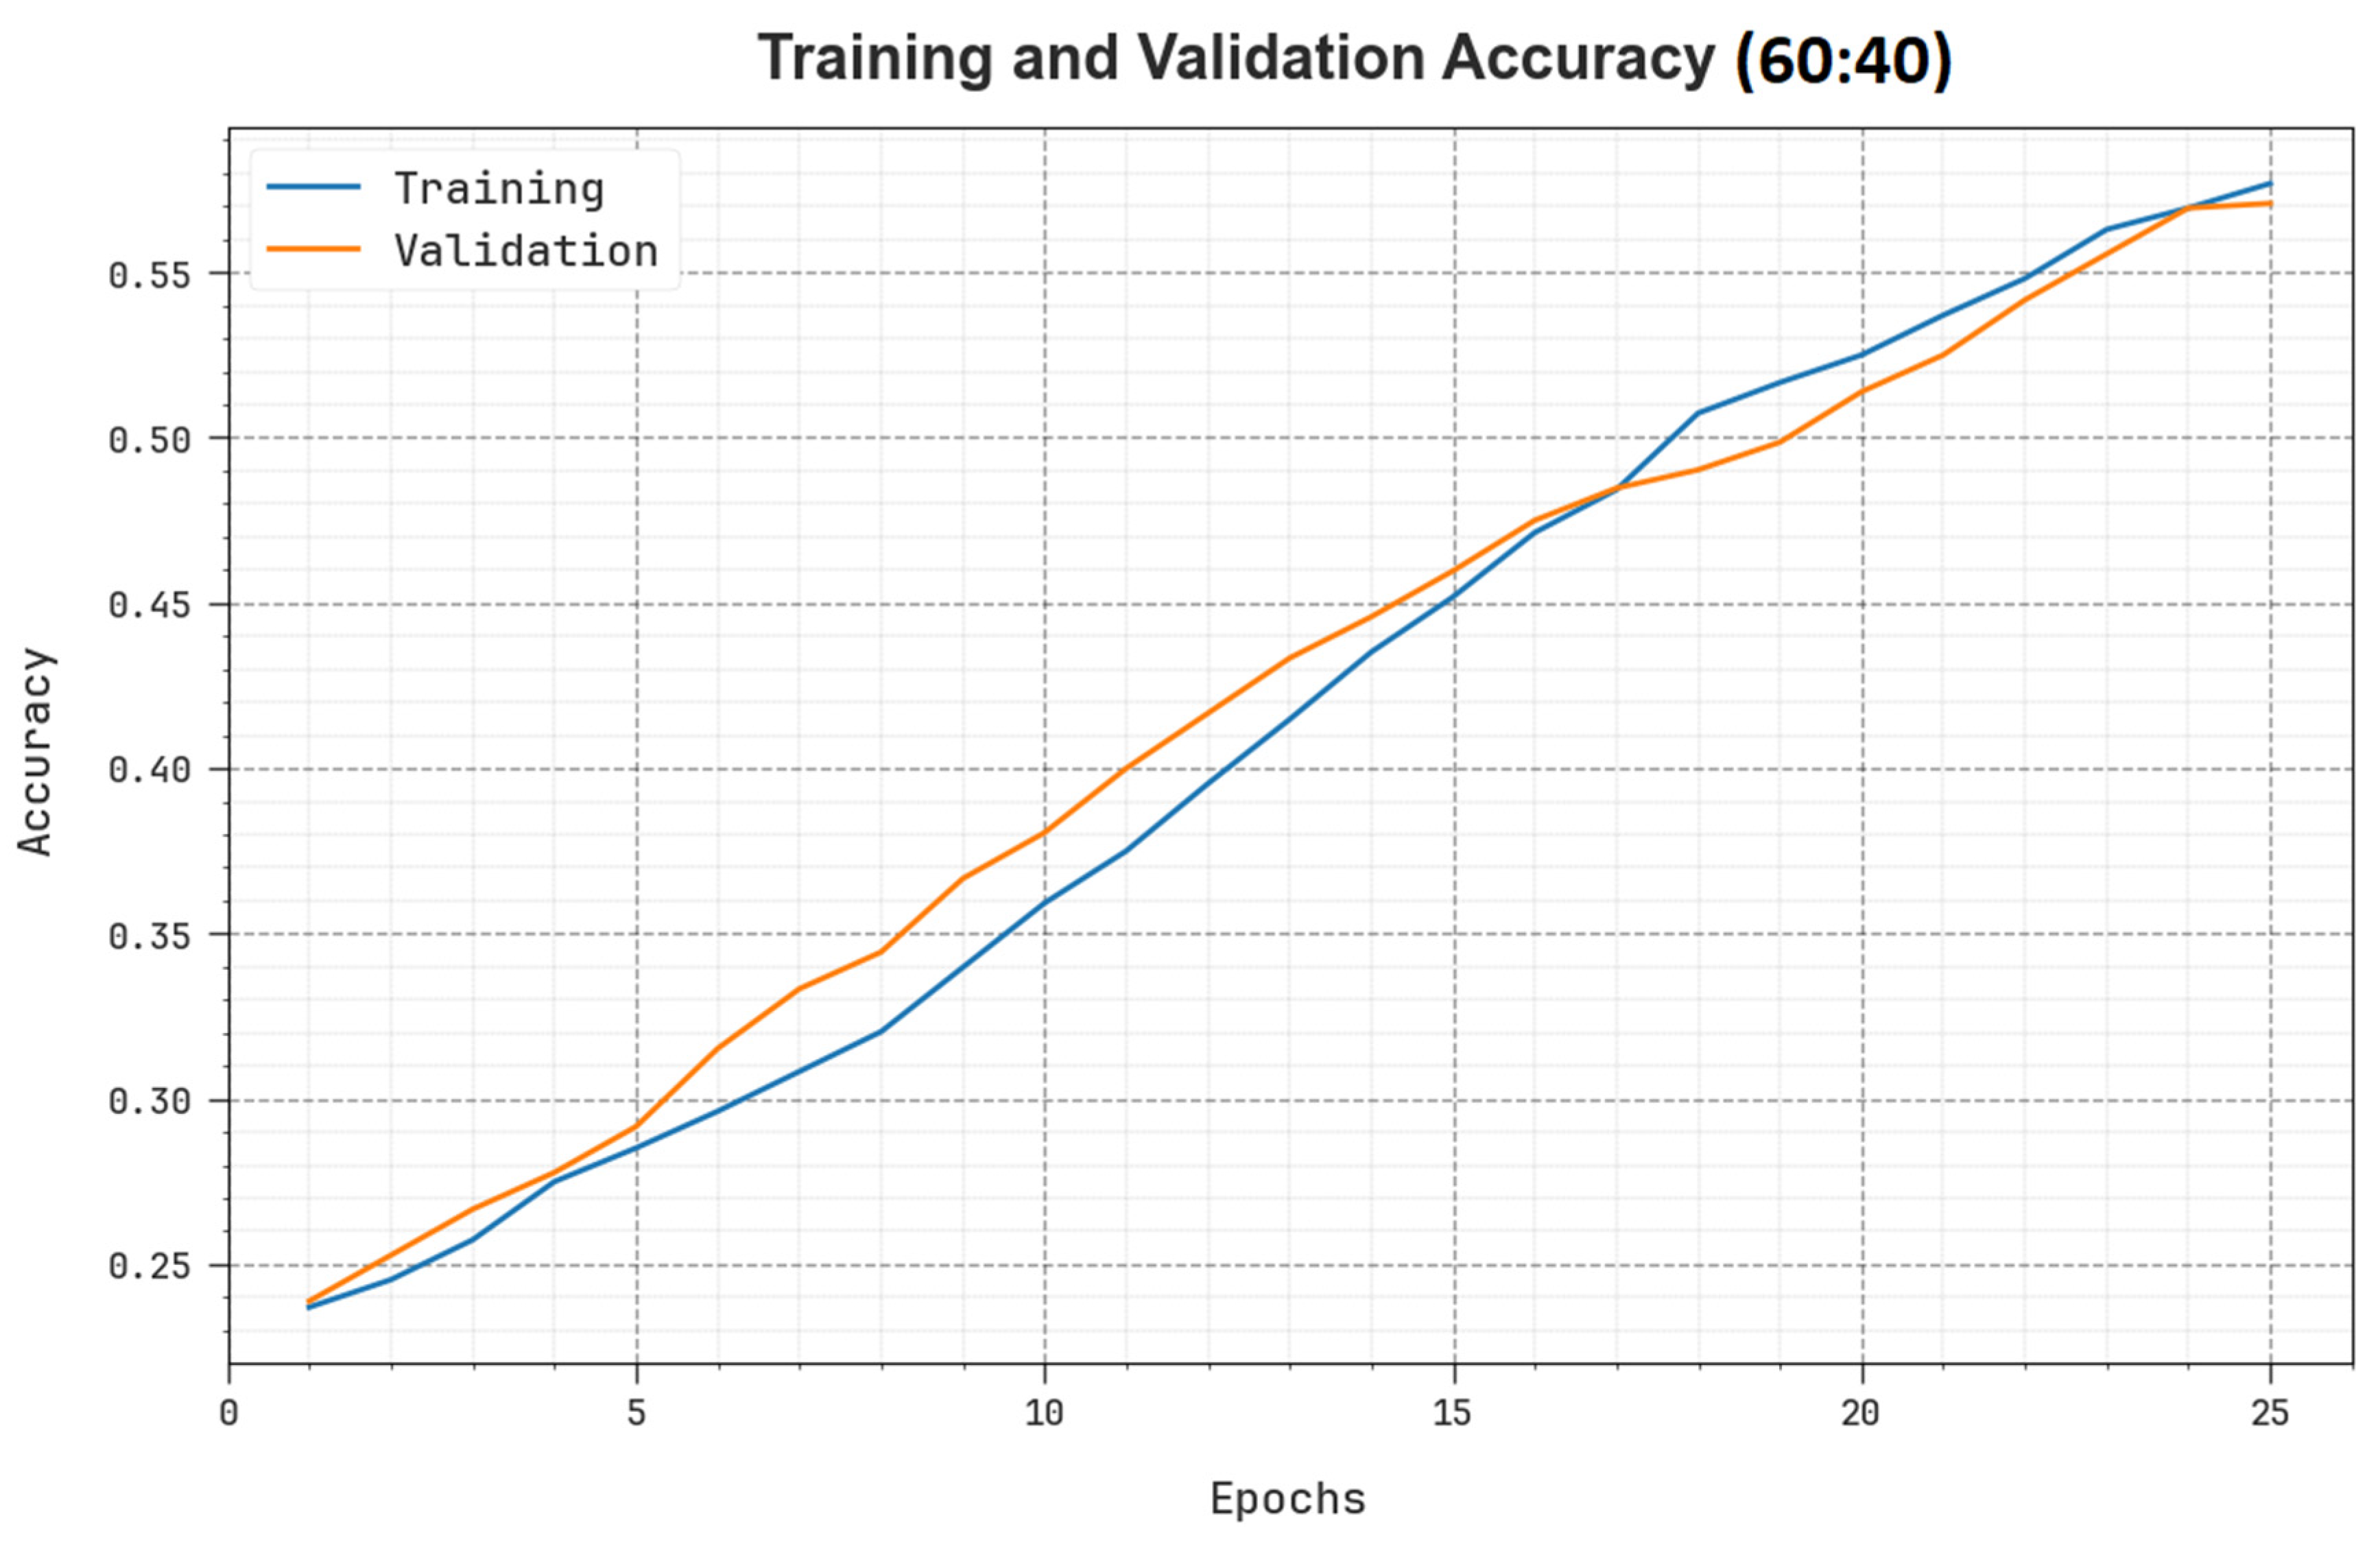
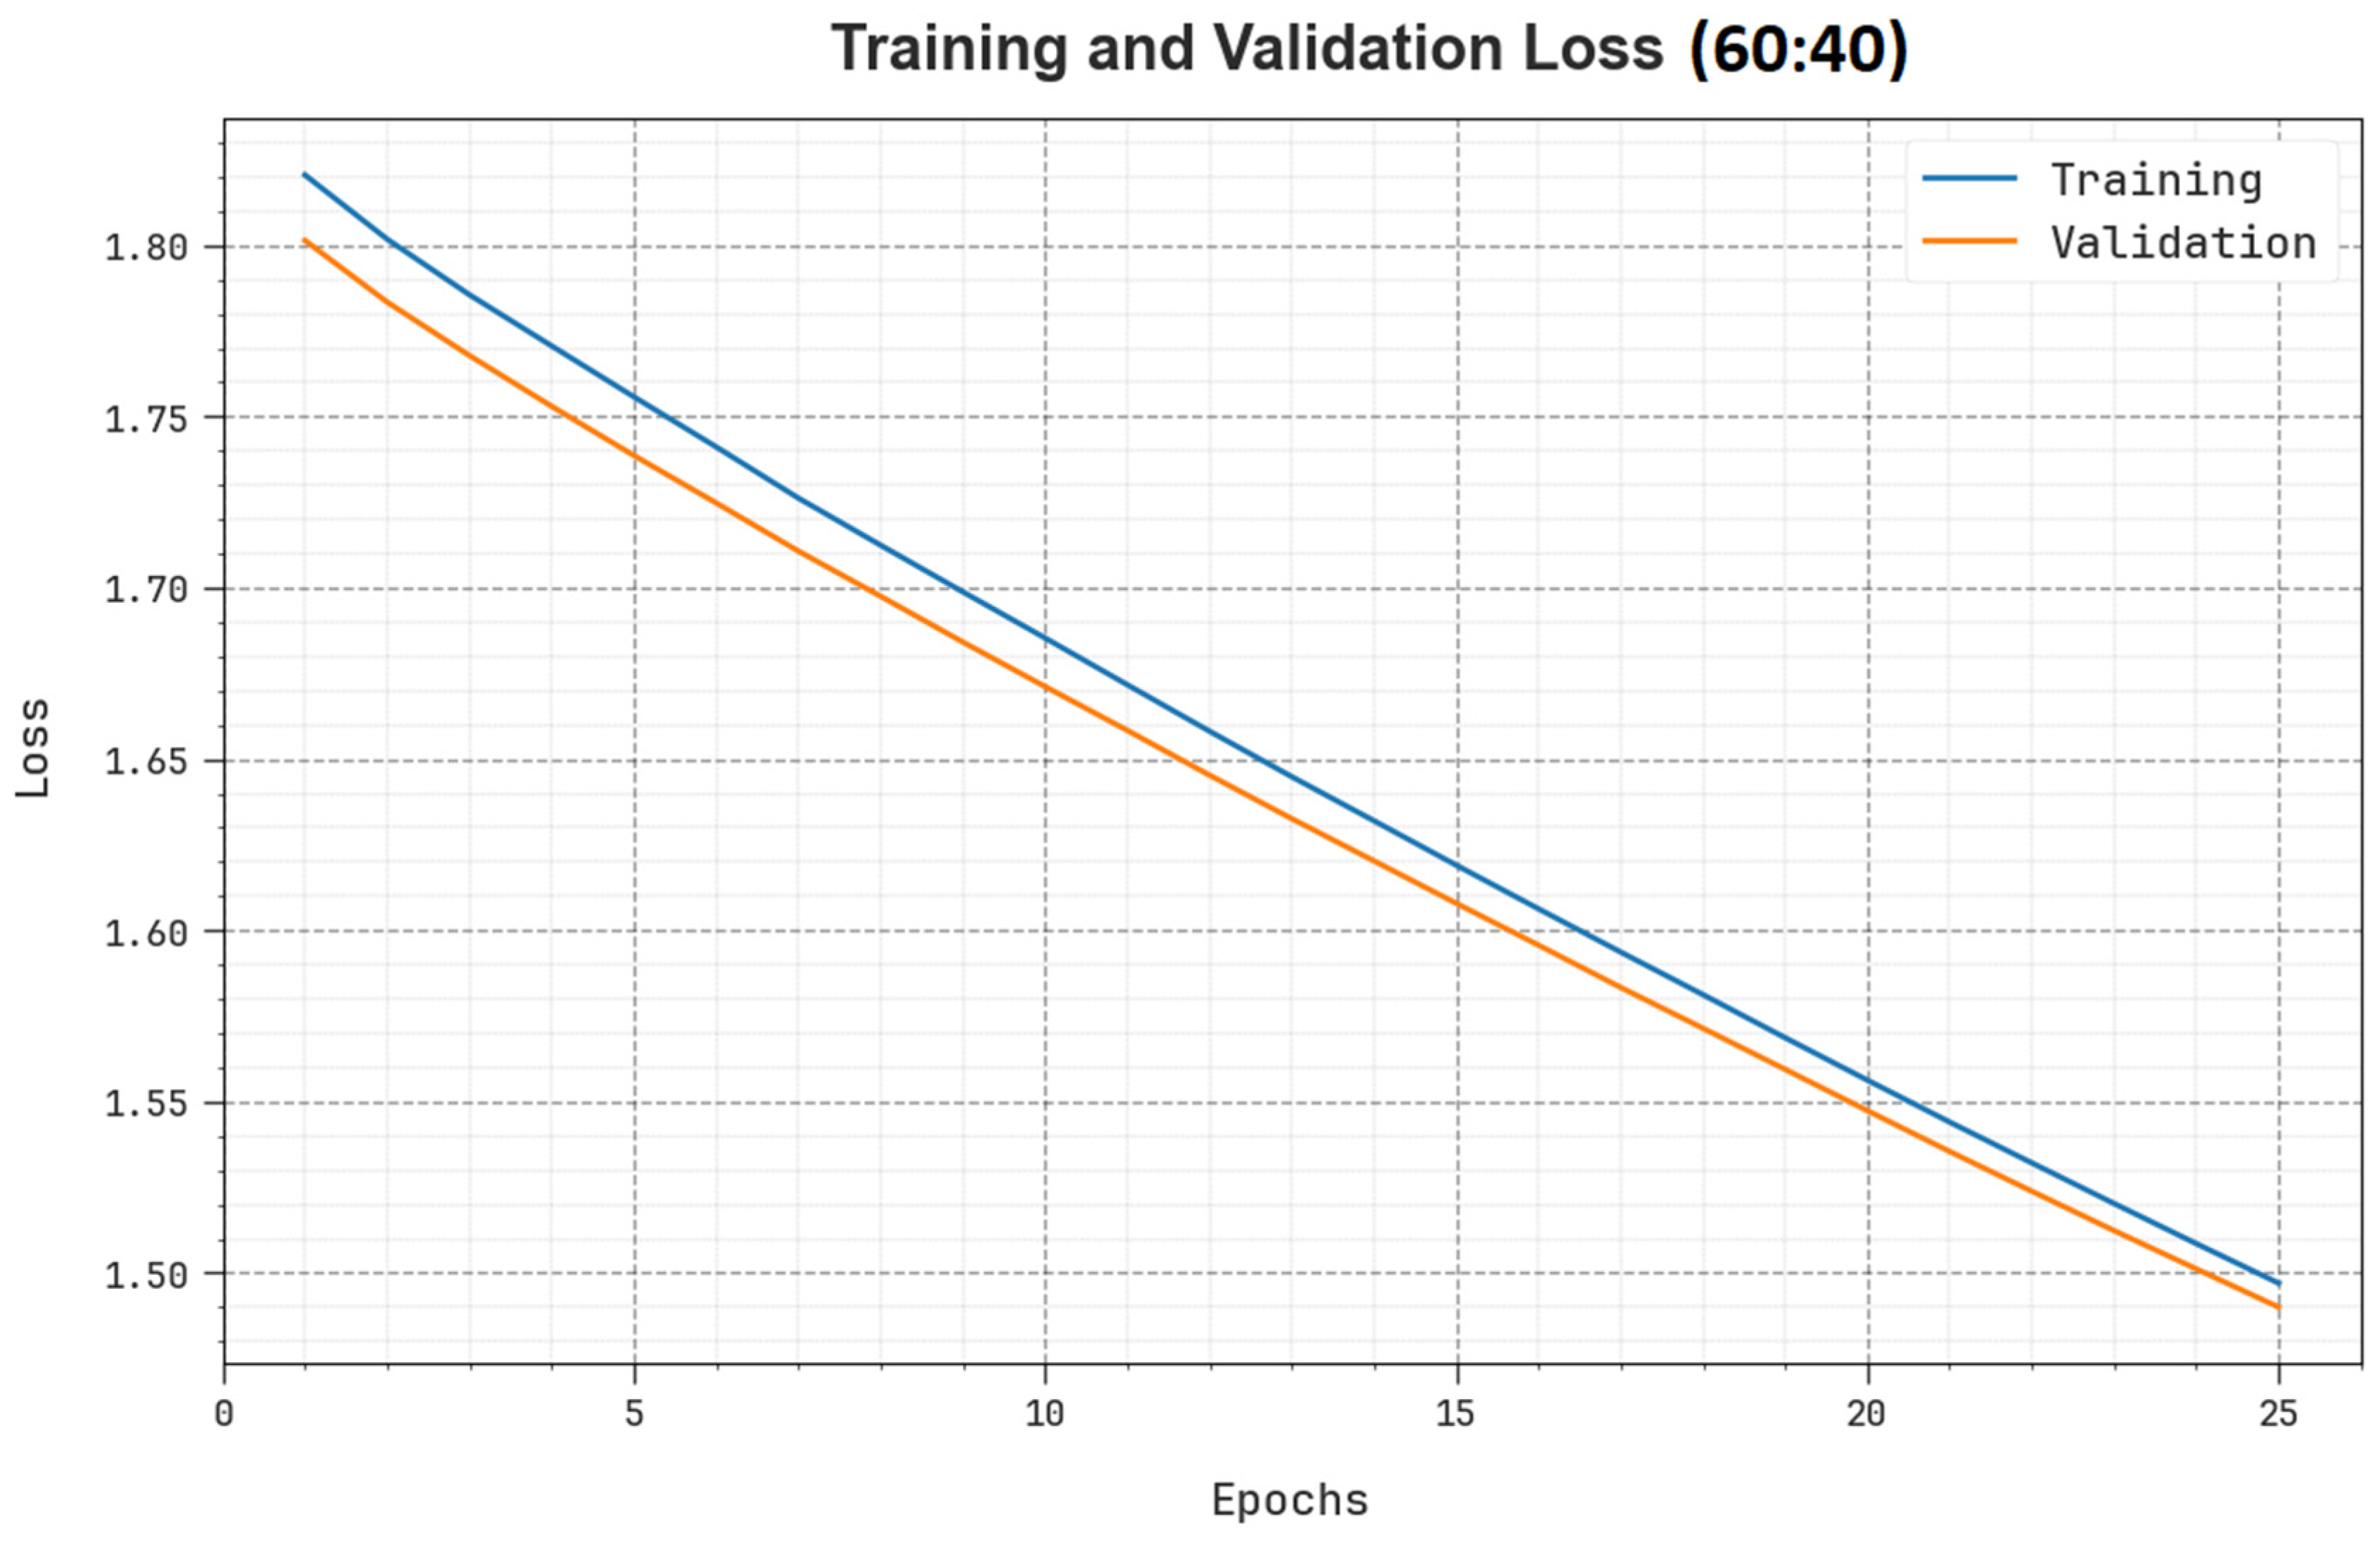
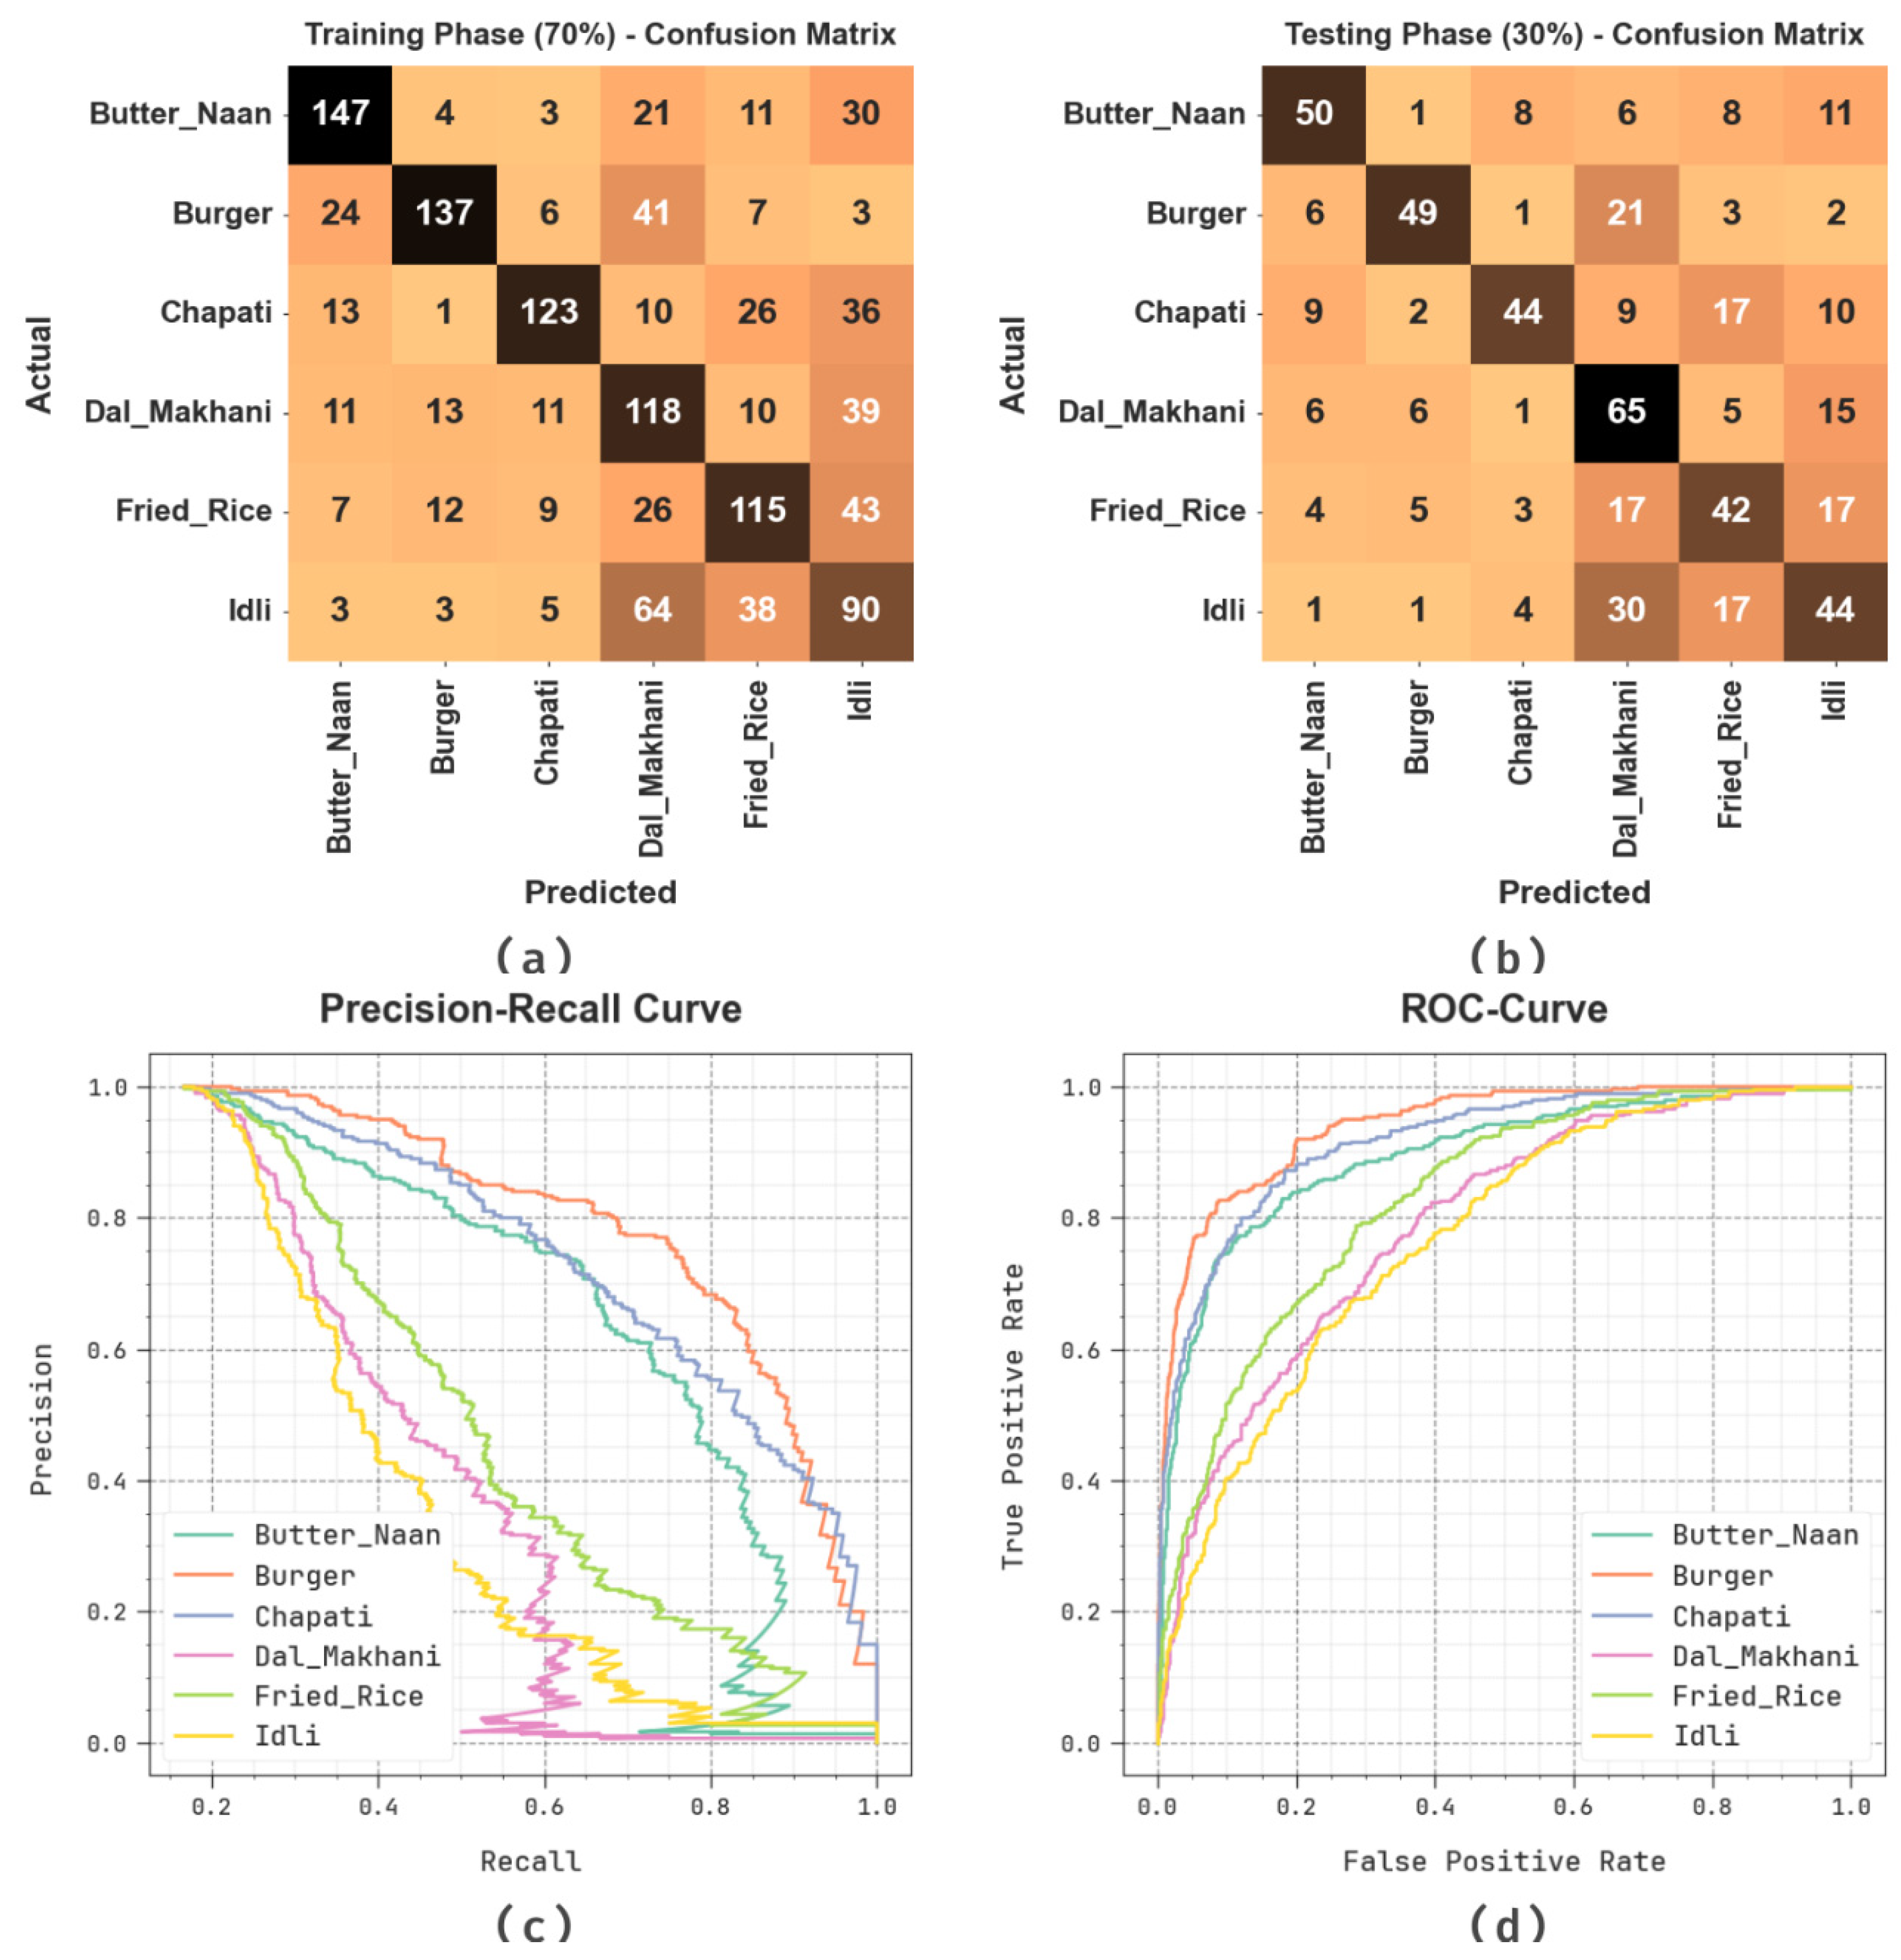
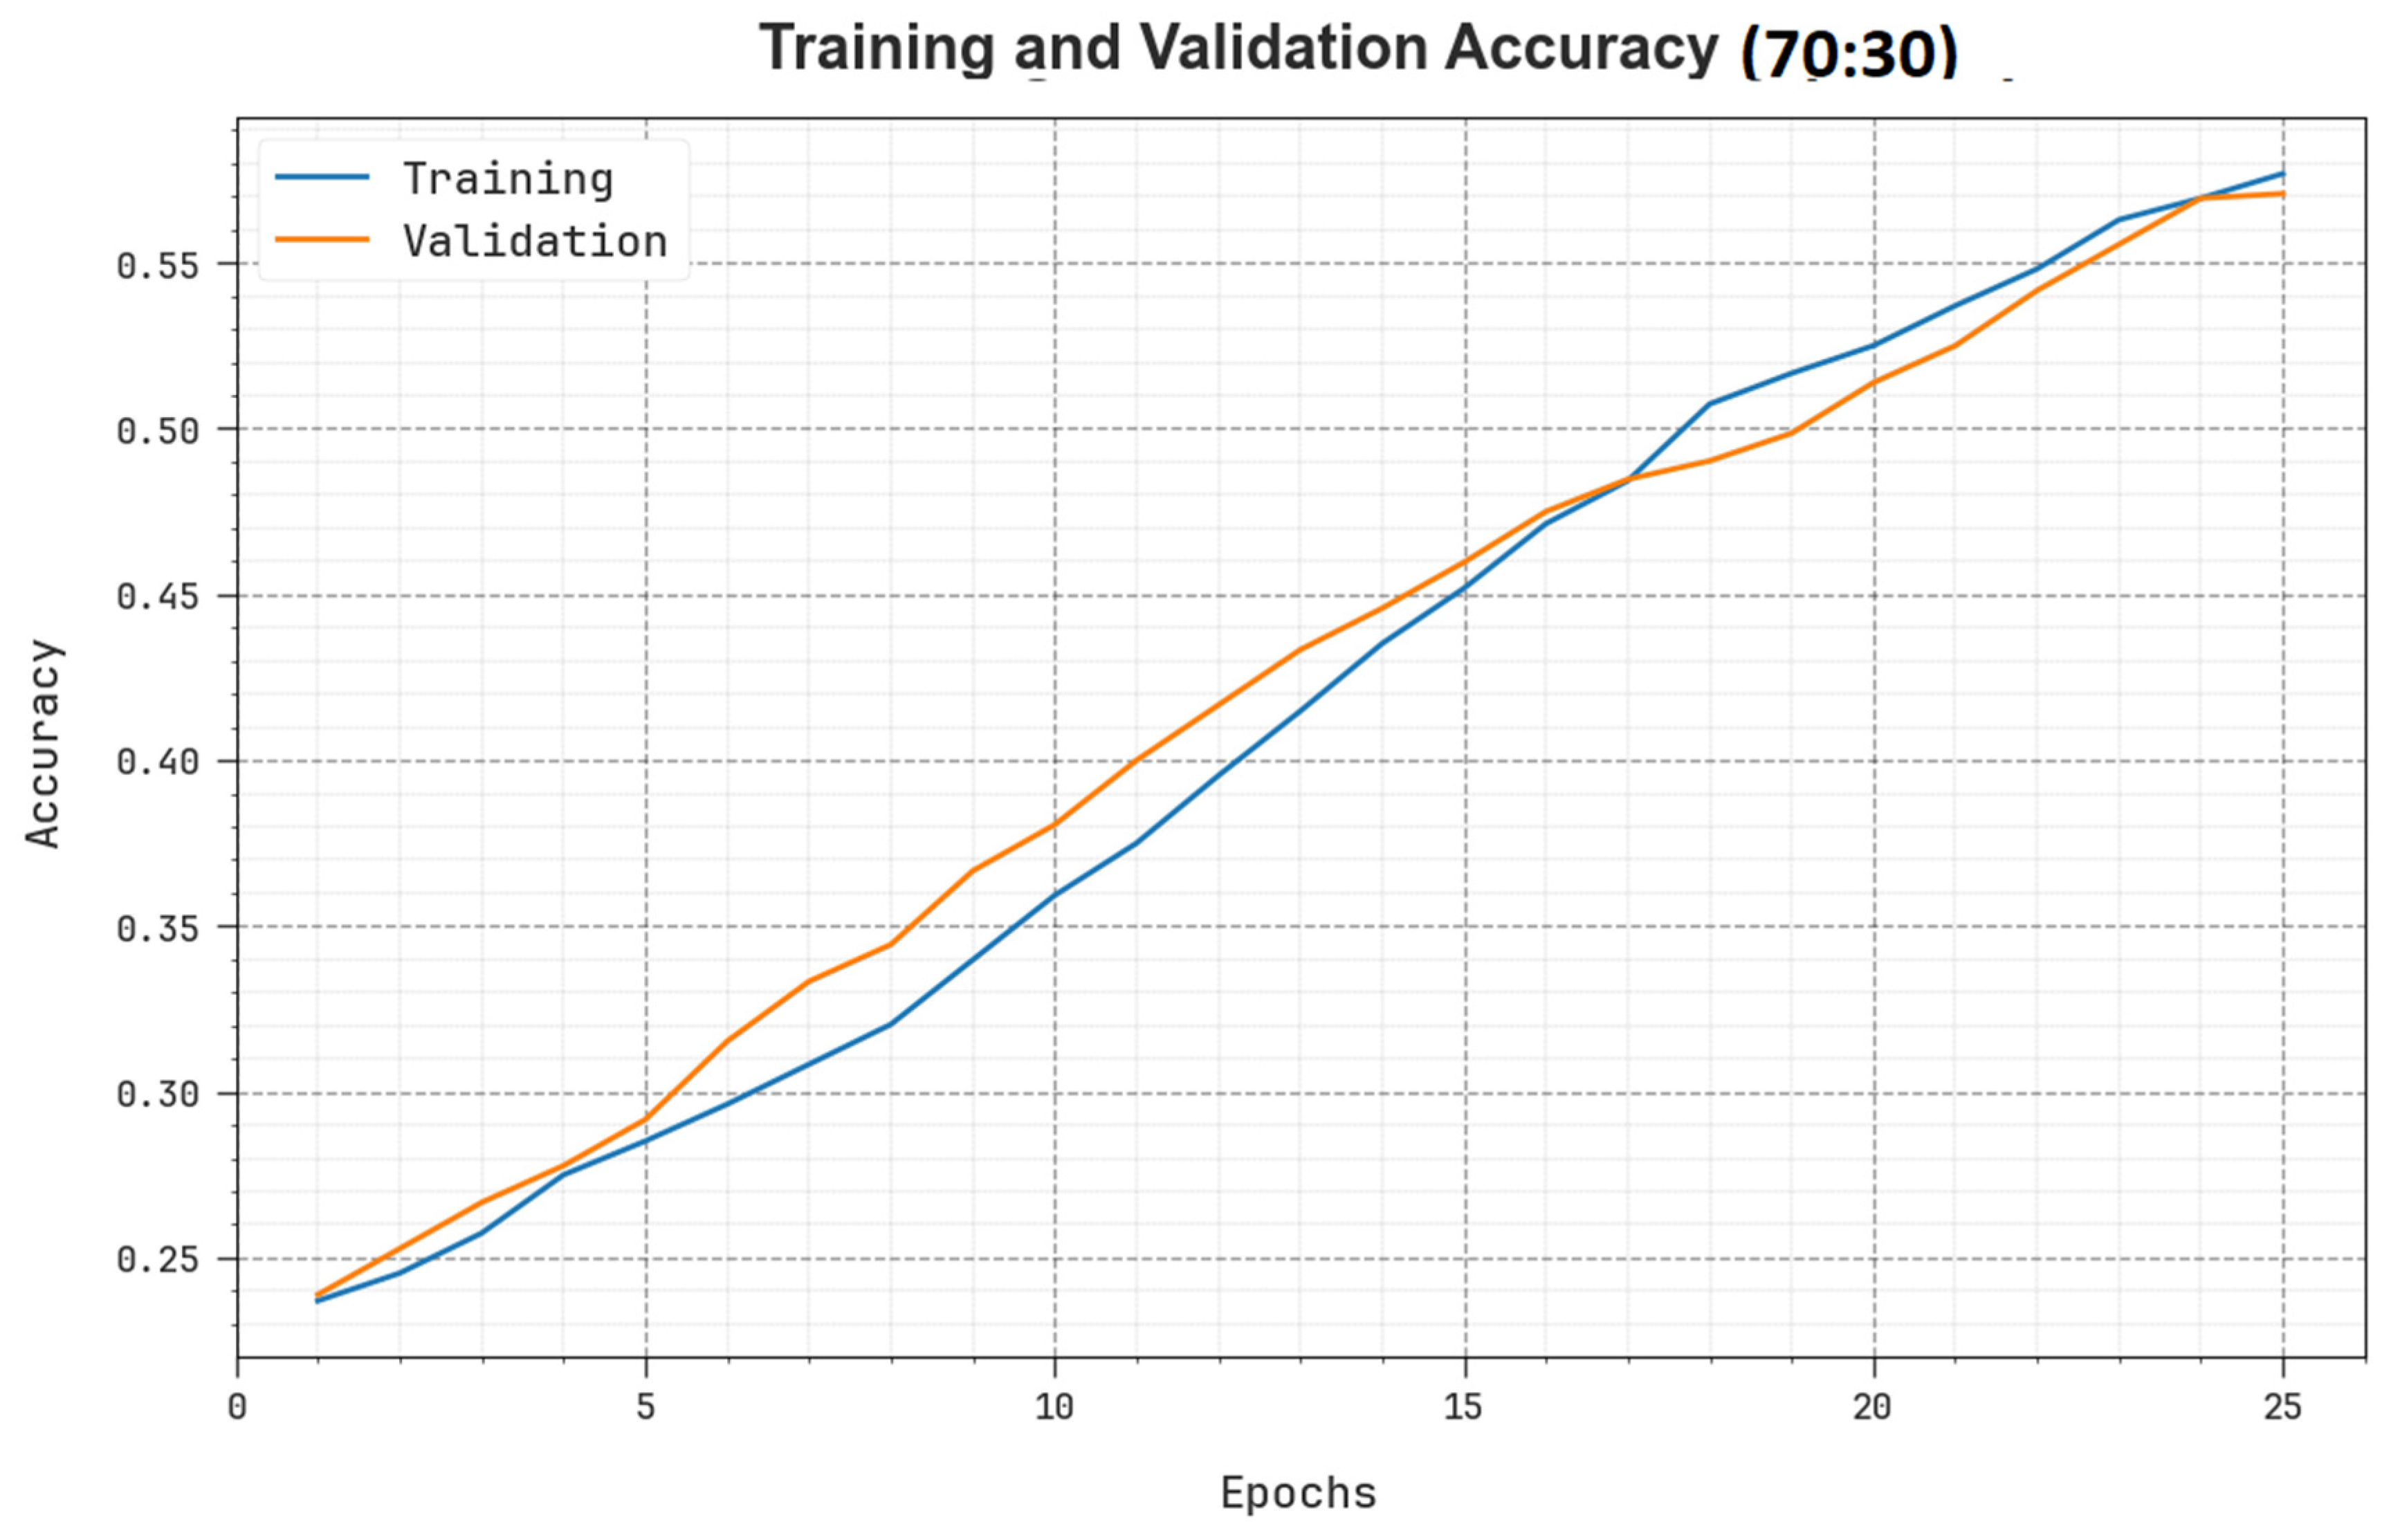
4. Results and Discussion
5. Conclusions
Author Contributions
Funding
Institutional Review Board Statement
Data Availability Statement
Conflicts of Interest
References
- VijayaKumari, G.; Vutkur, P.; Vishwanath, P. Food classification using transfer learning technique. Glob. Transit. Proc. 2022, 3, 225–229. [Google Scholar]
- Termritthikun, C.; Jamtsho, Y.; Muneesawang, P.; Zhao, J.; Lee, I. Evolutionary neural architecture search based on efficient CNN models population for image classification. Multimed. Tools Appl. 2023, 82, 23917–23943. [Google Scholar] [CrossRef]
- Chun, M.; Jeong, H.; Lee, H.; Yoo, T.; Jung, H. Development of Korean Food Image Classification Model Using Public Food Image Dataset and Deep Learning Methods. IEEE Access 2022, 10, 128732–128741. [Google Scholar] [CrossRef]
- Chen, W.; Song, R. A new deep learning-based food recognition system for the mobile terminal. In Proceedings of the 2023 IEEE 12th Data-Driven Control and Learning Systems Conference (DDCLS), Xiangtan, China, 12–14 May 2023; IEEE: Piscataway, NJ, USA, 2003; pp. 112–117. [Google Scholar]
- He, L.; Cai, Z.; Ouyang, D.; Bai, H. Food Recognition Model Based on Deep Learning and Attention Mechanism. In Proceedings of the 2022 8th International Conference on Big Data Computing and Communications (BigCom), Xiamen, China, 6–7 August 2022; IEEE: Piscataway, NJ, USA, 2022; pp. 206–216. [Google Scholar]
- Li, J.; Chen, W.; Zhu, Y.; Xuan, K.; Li, H.; Zeng, N. Intelligent detection and behavior tracking under ammonia nitrogen stress. Neurocomputing 2023, 59, 126809. [Google Scholar] [CrossRef]
- Wu, P.; Wang, Z.; Li, H.; Zeng, N. KD-PAR: A knowledge distillation-based pedestrian attribute recognition model with multi-label mixed feature learning network. Expert Syst. Appl. 2023, 237, 121305. [Google Scholar] [CrossRef]
- Liu, M.; Wang, Z.; Li, H.; Wu, P.; Alsaadi, F.E.; Zeng, N. AA-WGAN: Attention augmented Wasserstein generative adversarial network with application to fundus retinal vessel segmentation. Comput. Biol. Med. 2023, 158, 106874. [Google Scholar] [CrossRef] [PubMed]
- Mezgec, S.; Seljak, B.K. Deep neural networks for image-based dietary assessment. JoVE J. Vis. Exp. 2021, 169, e61906. [Google Scholar]
- Nr, D.; Gk, D.S.; Kumar Pareek, D.P. A Framework for Food recognition and predicting its Nutritional value through Convolution neural network. In Proceedings of the International Conference on Innovative Computing & Communication (ICICC) 2022, Delhi, India, 19–20 February 2022. [Google Scholar]
- Alahmari, S.S.; Salem, T. Food State Recognition Using Deep Learning. IEEE Access 2022, 10, 130048–130057. [Google Scholar] [CrossRef]
- Tasci, E. Voting combinations-based ensemble of fine-tuned convolutional neural networks for food image recognition. Multimedia Tools Appl. 2020, 79, 30397–30418. [Google Scholar] [CrossRef]
- Du, J.; Coumba, B.Y.; Jin, X. Senegalese Food Recognition for Tourism Information Using Convolution Neural Network. In Proceedings of the 2021 5th International Conference on Electronic Information Technology and Computer Engineering, Xiamen, China, 22–24 October 2021; pp. 1177–1182. [Google Scholar]
- Shah, B.; Bhavsar, H. Depth-restricted convolutional neural network—A model for Gujarati food image classification. Vis. Comput. 2023, 1–16. [Google Scholar] [CrossRef]
- Chopra, M.; Purwar, A. Food Image Recognition by Optimizing CNN with PSO and GA. In Proceedings of the 2022 Fourteenth International Conference on Contemporary Computing 2022, Noida, India, 4–6 August 2022; pp. 37–42. [Google Scholar]
- Liu, H.; Gong, H.; Ding, X. Food image recognition algorithm based on improved VGG16. In Proceedings of the 2021 IEEE 2nd International Conference on Information Technology, Big Data and Artificial Intelligence (ICIBA), Chongqing, China, 17–19 December 2021; IEEE: Piscataway, NJ, USA, 2021; Volume 2, pp. 899–903. [Google Scholar]
- Chopra, M.; Purwar, A. Food recognition using enhanced squirrel search optimisation algorithm and convolutional neural network. Int. J. Data Anal. Tech. Strateg. 2023, 15, 238–254. [Google Scholar] [CrossRef]
- Yadav, S.; Chand, S. Automated food image classification using deep learning approach. In Proceedings of the 2021 7th International Conference on Advanced Computing and Communication Systems (ICACCS), Coimbatore, India, 19–20 March 2021; IEEE: Piscataway, NJ, USA, 2021; Volume 1, pp. 542–545. [Google Scholar]
- Chaitanya, A.; Shetty, J.; Chiplunkar, P. Food Image Classification and Data Extraction Using Convolutional Neural Network and Web Crawlers. Procedia Comput. Sci. 2023, 218, 143–152. [Google Scholar] [CrossRef]
- Pan, L.; Li, C.; Pouyanfar, S.; Chen, R.; Zhou, Y. A Novel Combinational Convolutional Neural Network for Automatic Food-Ingredient Classification. Comput. Mater. Contin. 2020, 62, 731–746. [Google Scholar] [CrossRef]
- Shermila, P.J.; Ahilan, A.; Shunmugathammal, M.; Marimuthu, J. DEEPFIC: Food item classification with calorie calculation using dragonfly deep learning network. Signal Image Video Process. 2023, 17, 3731–3739. [Google Scholar] [CrossRef]
- Ogundokun, R.O.; Li, A.; Babatunde, R.S.; Umezuruike, C.; Sadiku, P.O.; Abdulahi, A.T.; Babatunde, A.N. Enhancing Skin Cancer Detection and Classification in Dermoscopic Images through Concatenated MobileNetV2 and Xception Models. Bioengineering 2023, 10, 979. [Google Scholar] [CrossRef] [PubMed]
- Dhiman, G.; Kumar, V. Spotted hyena optimizer: A novel bio-inspired based metaheuristic technique for engineering applications. Adv. Eng. Softw. 2017, 114, 48–70. [Google Scholar] [CrossRef]
- Yang, X.; Cheng, L. Hyperspectral Image Pixel Classification based on Golden Sine and Chaotic Spotted Hyena Optimization Algorithm. IEEE Access. 2023, 11, 89757–89768. [Google Scholar] [CrossRef]
- Dong, X.; Xu, H.; Cao, H.; Cui, T.; Sun, Y. Temperature Compensation of Wind Tunnel Balance Signal Detection System Based on IGWO-ELM. Sensors 2023, 23, 7224. [Google Scholar] [CrossRef] [PubMed]
- Available online: https://www.kaggle.com/datasets/l33tc0d3r/indian-food-classification (accessed on 17 July 2023).


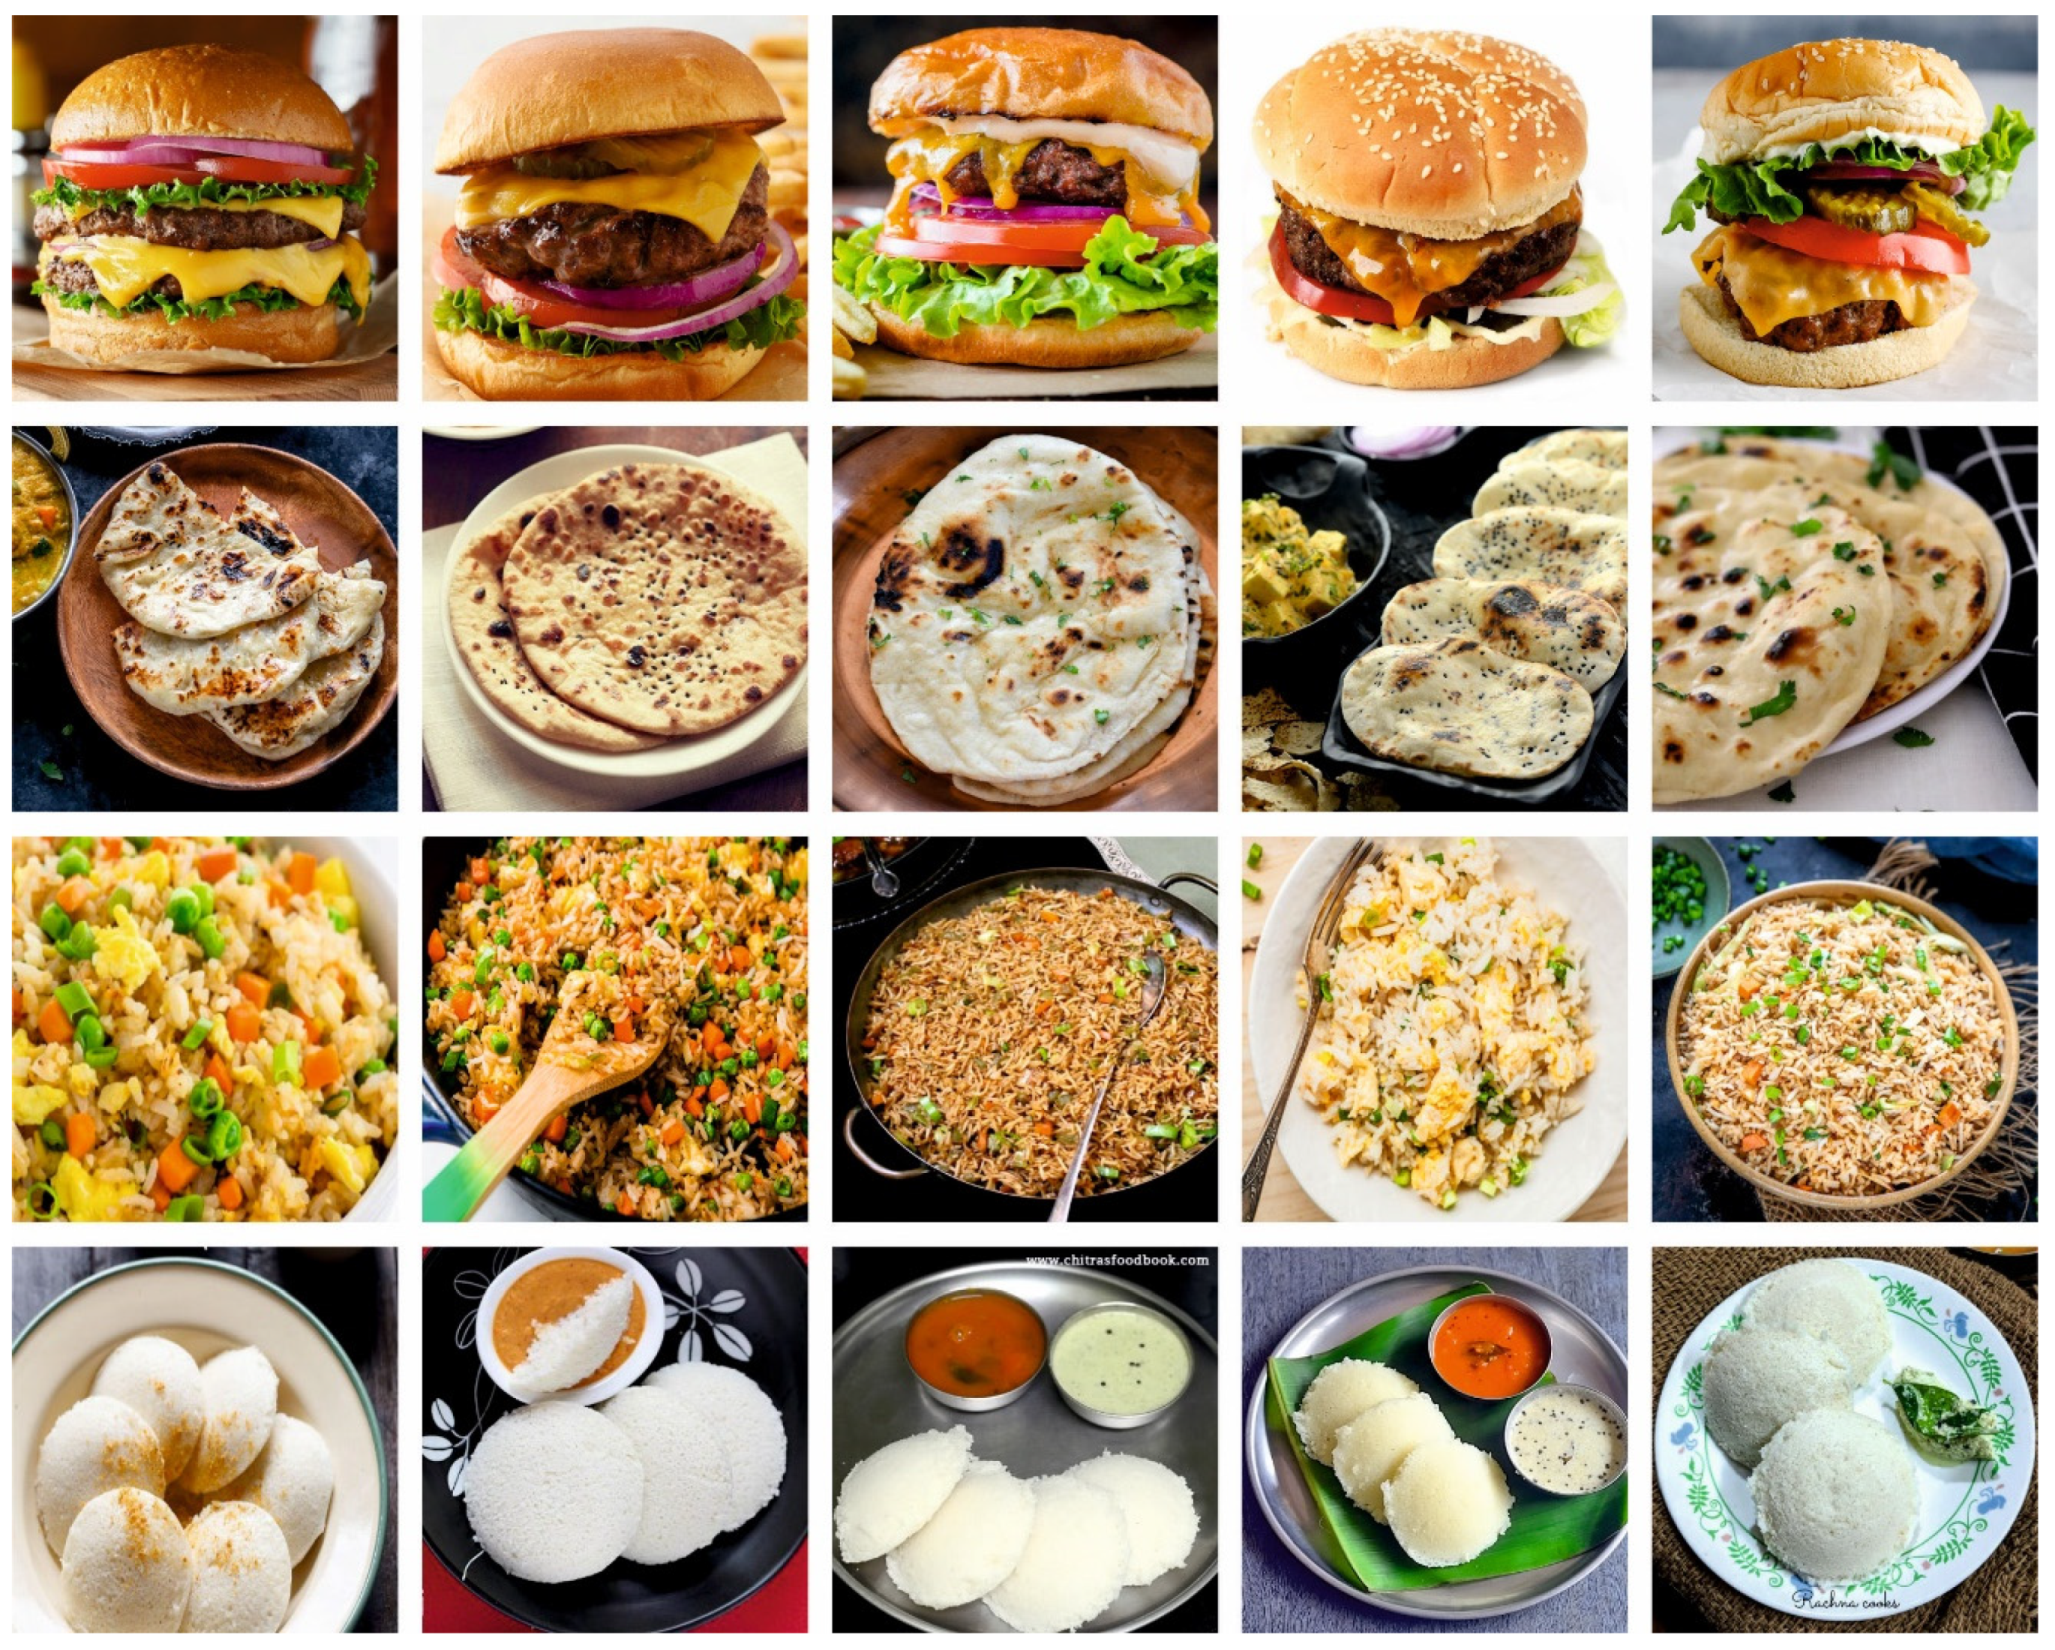
| Class | No. of Samples |
|---|---|
| Butter_Naan | 300 |
| Burger | 300 |
| Chapati | 300 |
| Dal_Makhani | 300 |
| Fried_Rice | 300 |
| Idli | 300 |
| Total Samples | 1800 |
| Class | MCC | ||||
|---|---|---|---|---|---|
| Training Phase (60%) | |||||
| Butter_Naan | 80.65 | 43.05 | 77.84 | 55.44 | 47.53 |
| Burger | 88.43 | 74.02 | 50.54 | 60.06 | 54.91 |
| Chapati | 86.20 | 68.03 | 43.01 | 52.70 | 46.73 |
| Dal_Makhani | 86.67 | 62.56 | 67.01 | 64.71 | 56.55 |
| Fried_Rice | 86.11 | 56.77 | 51.46 | 53.99 | 45.91 |
| Idli | 87.31 | 58.90 | 57.83 | 58.36 | 50.88 |
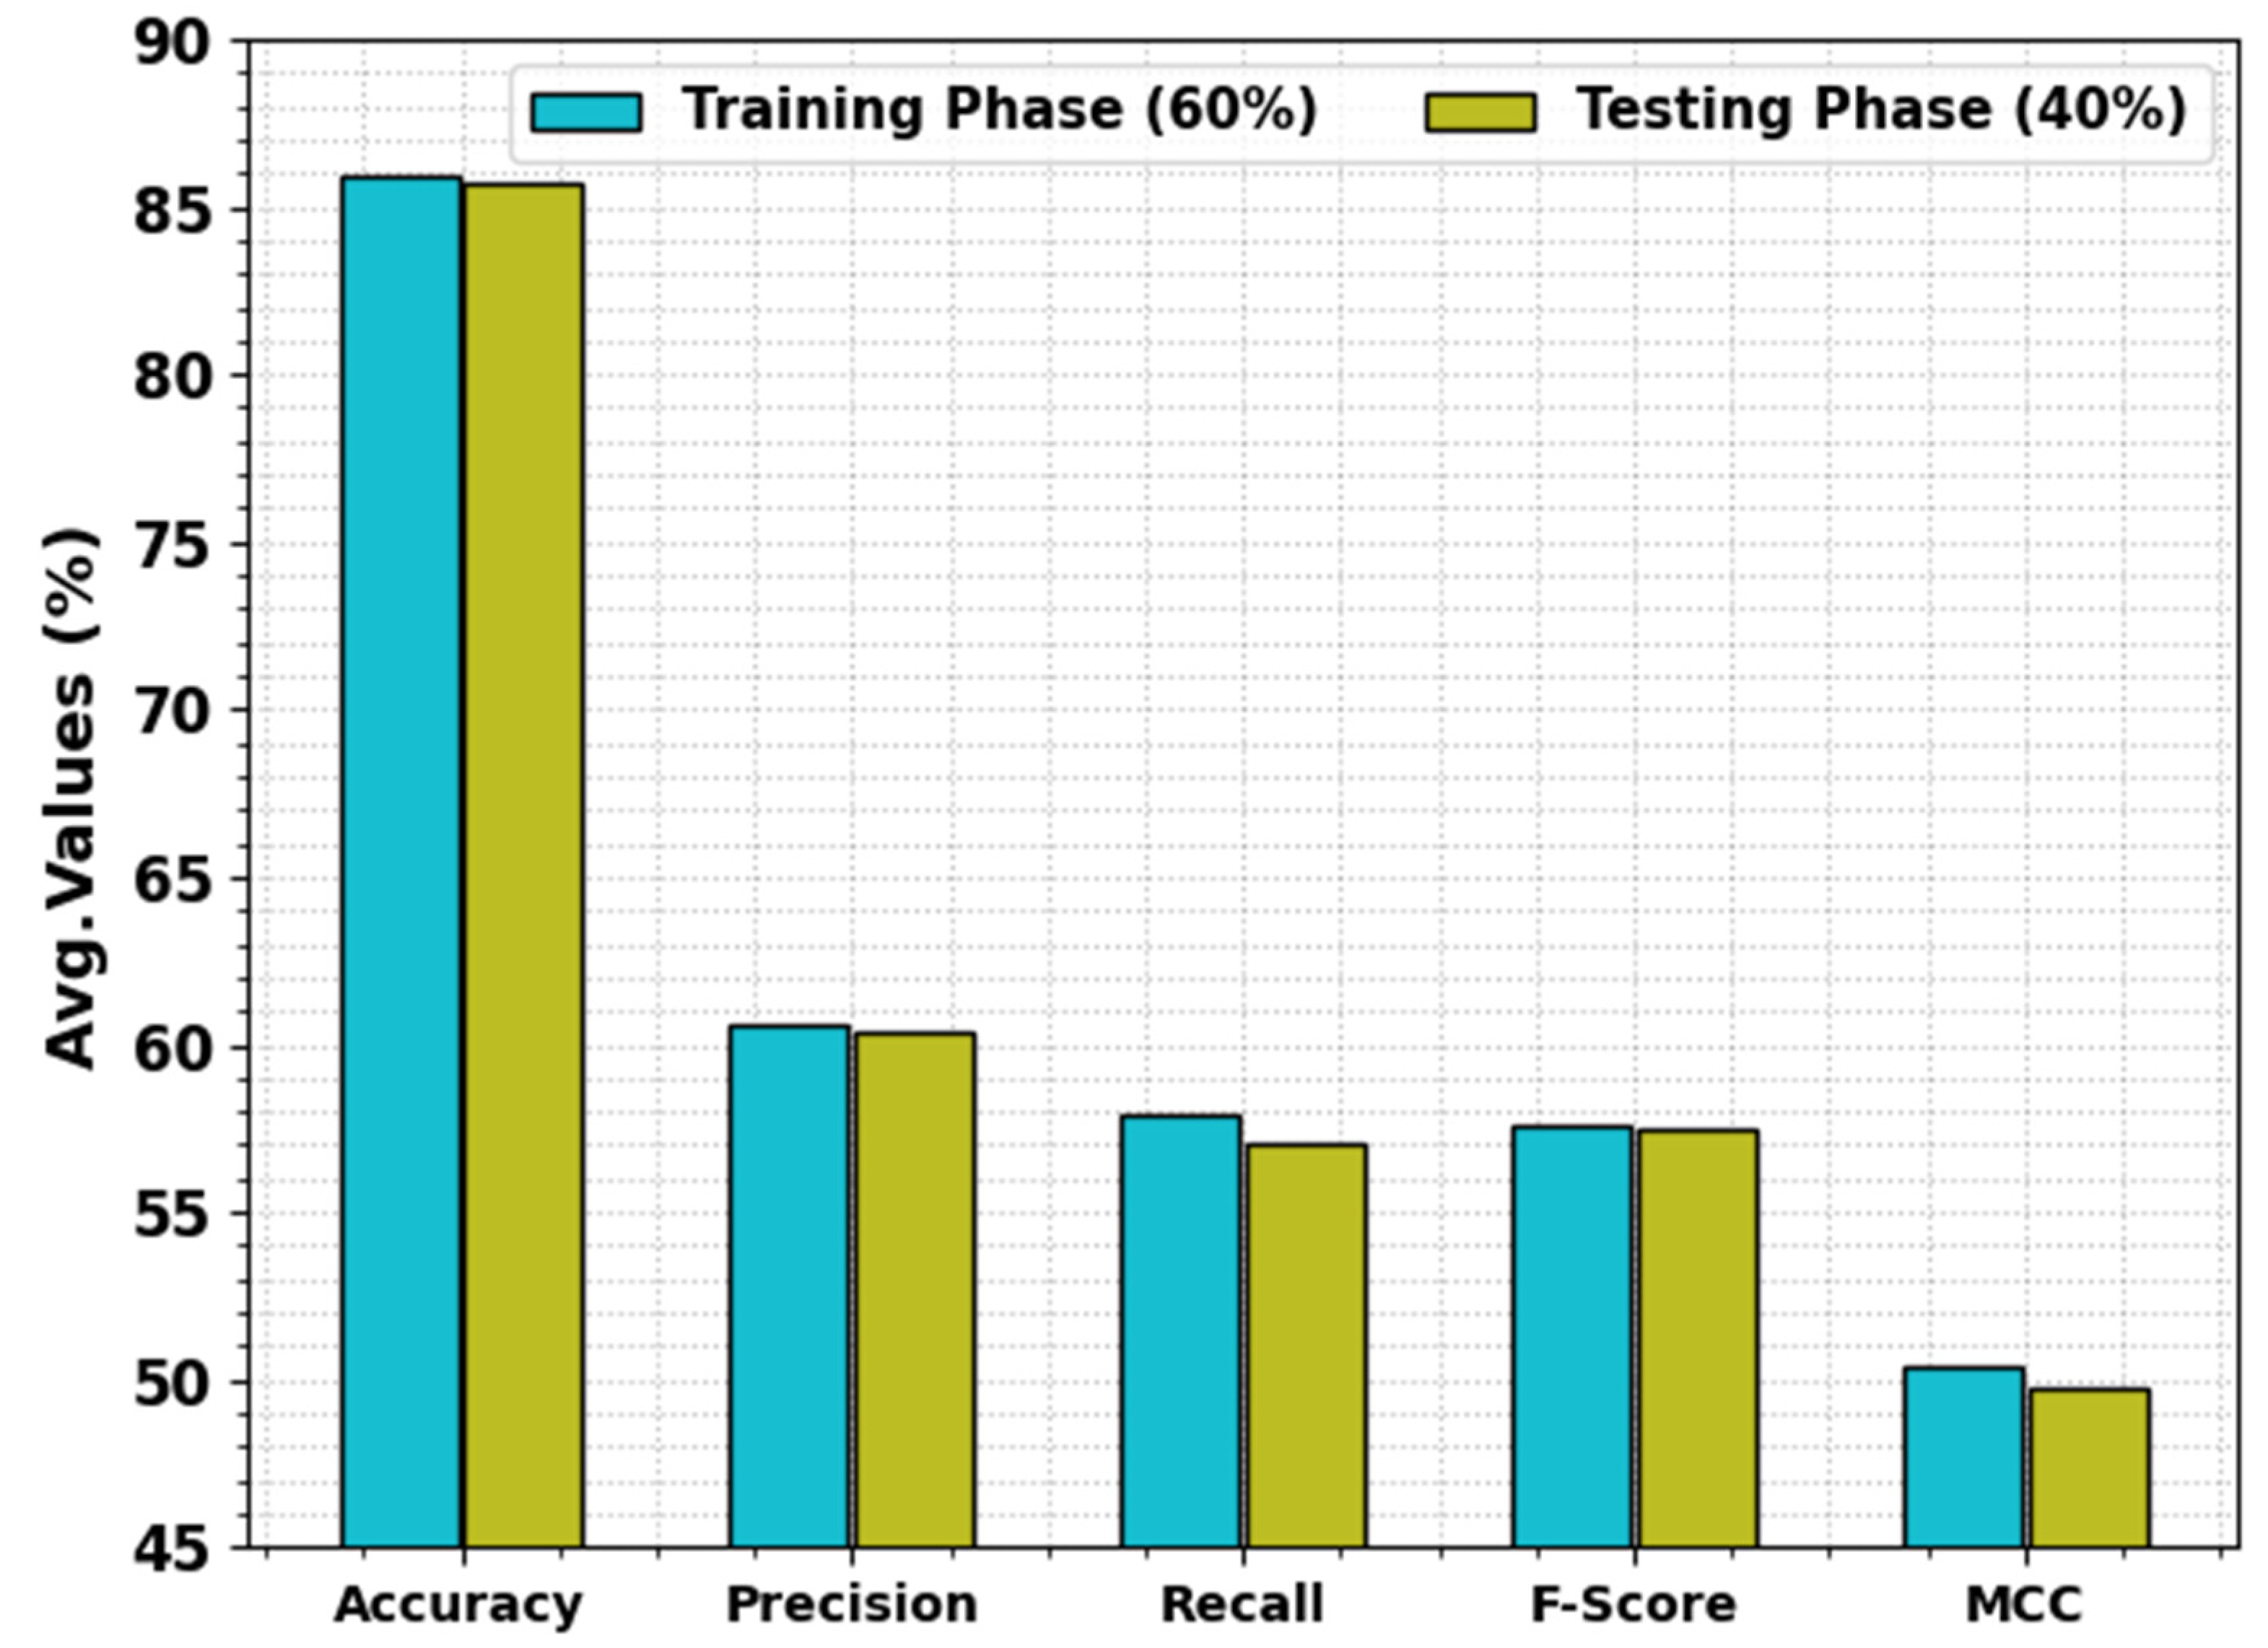
| Average | 85.90 | 60.55 | 57.95 | 57.54 | 50.42 |
| Testing Phase (40%) | |||||
| Butter_Naan | 77.22 | 42.29 | 63.91 | 50.90 | 38.19 |
| Burger | 88.33 | 69.74 | 46.49 | 55.79 | 50.73 |
| Chapati | 89.44 | 70.13 | 50.47 | 58.70 | 53.77 |
| Dal_Makhani | 87.36 | 54.55 | 69.90 | 61.28 | 54.45 |
| Fried_Rice | 85.97 | 61.86 | 56.59 | 59.11 | 50.74 |
| Idli | 85.83 | 63.79 | 55.22 | 59.20 | 50.88 |
| Average | 85.69 | 60.39 | 57.10 | 57.49 | 49.79 |
| Class | MCC | ||||
|---|---|---|---|---|---|
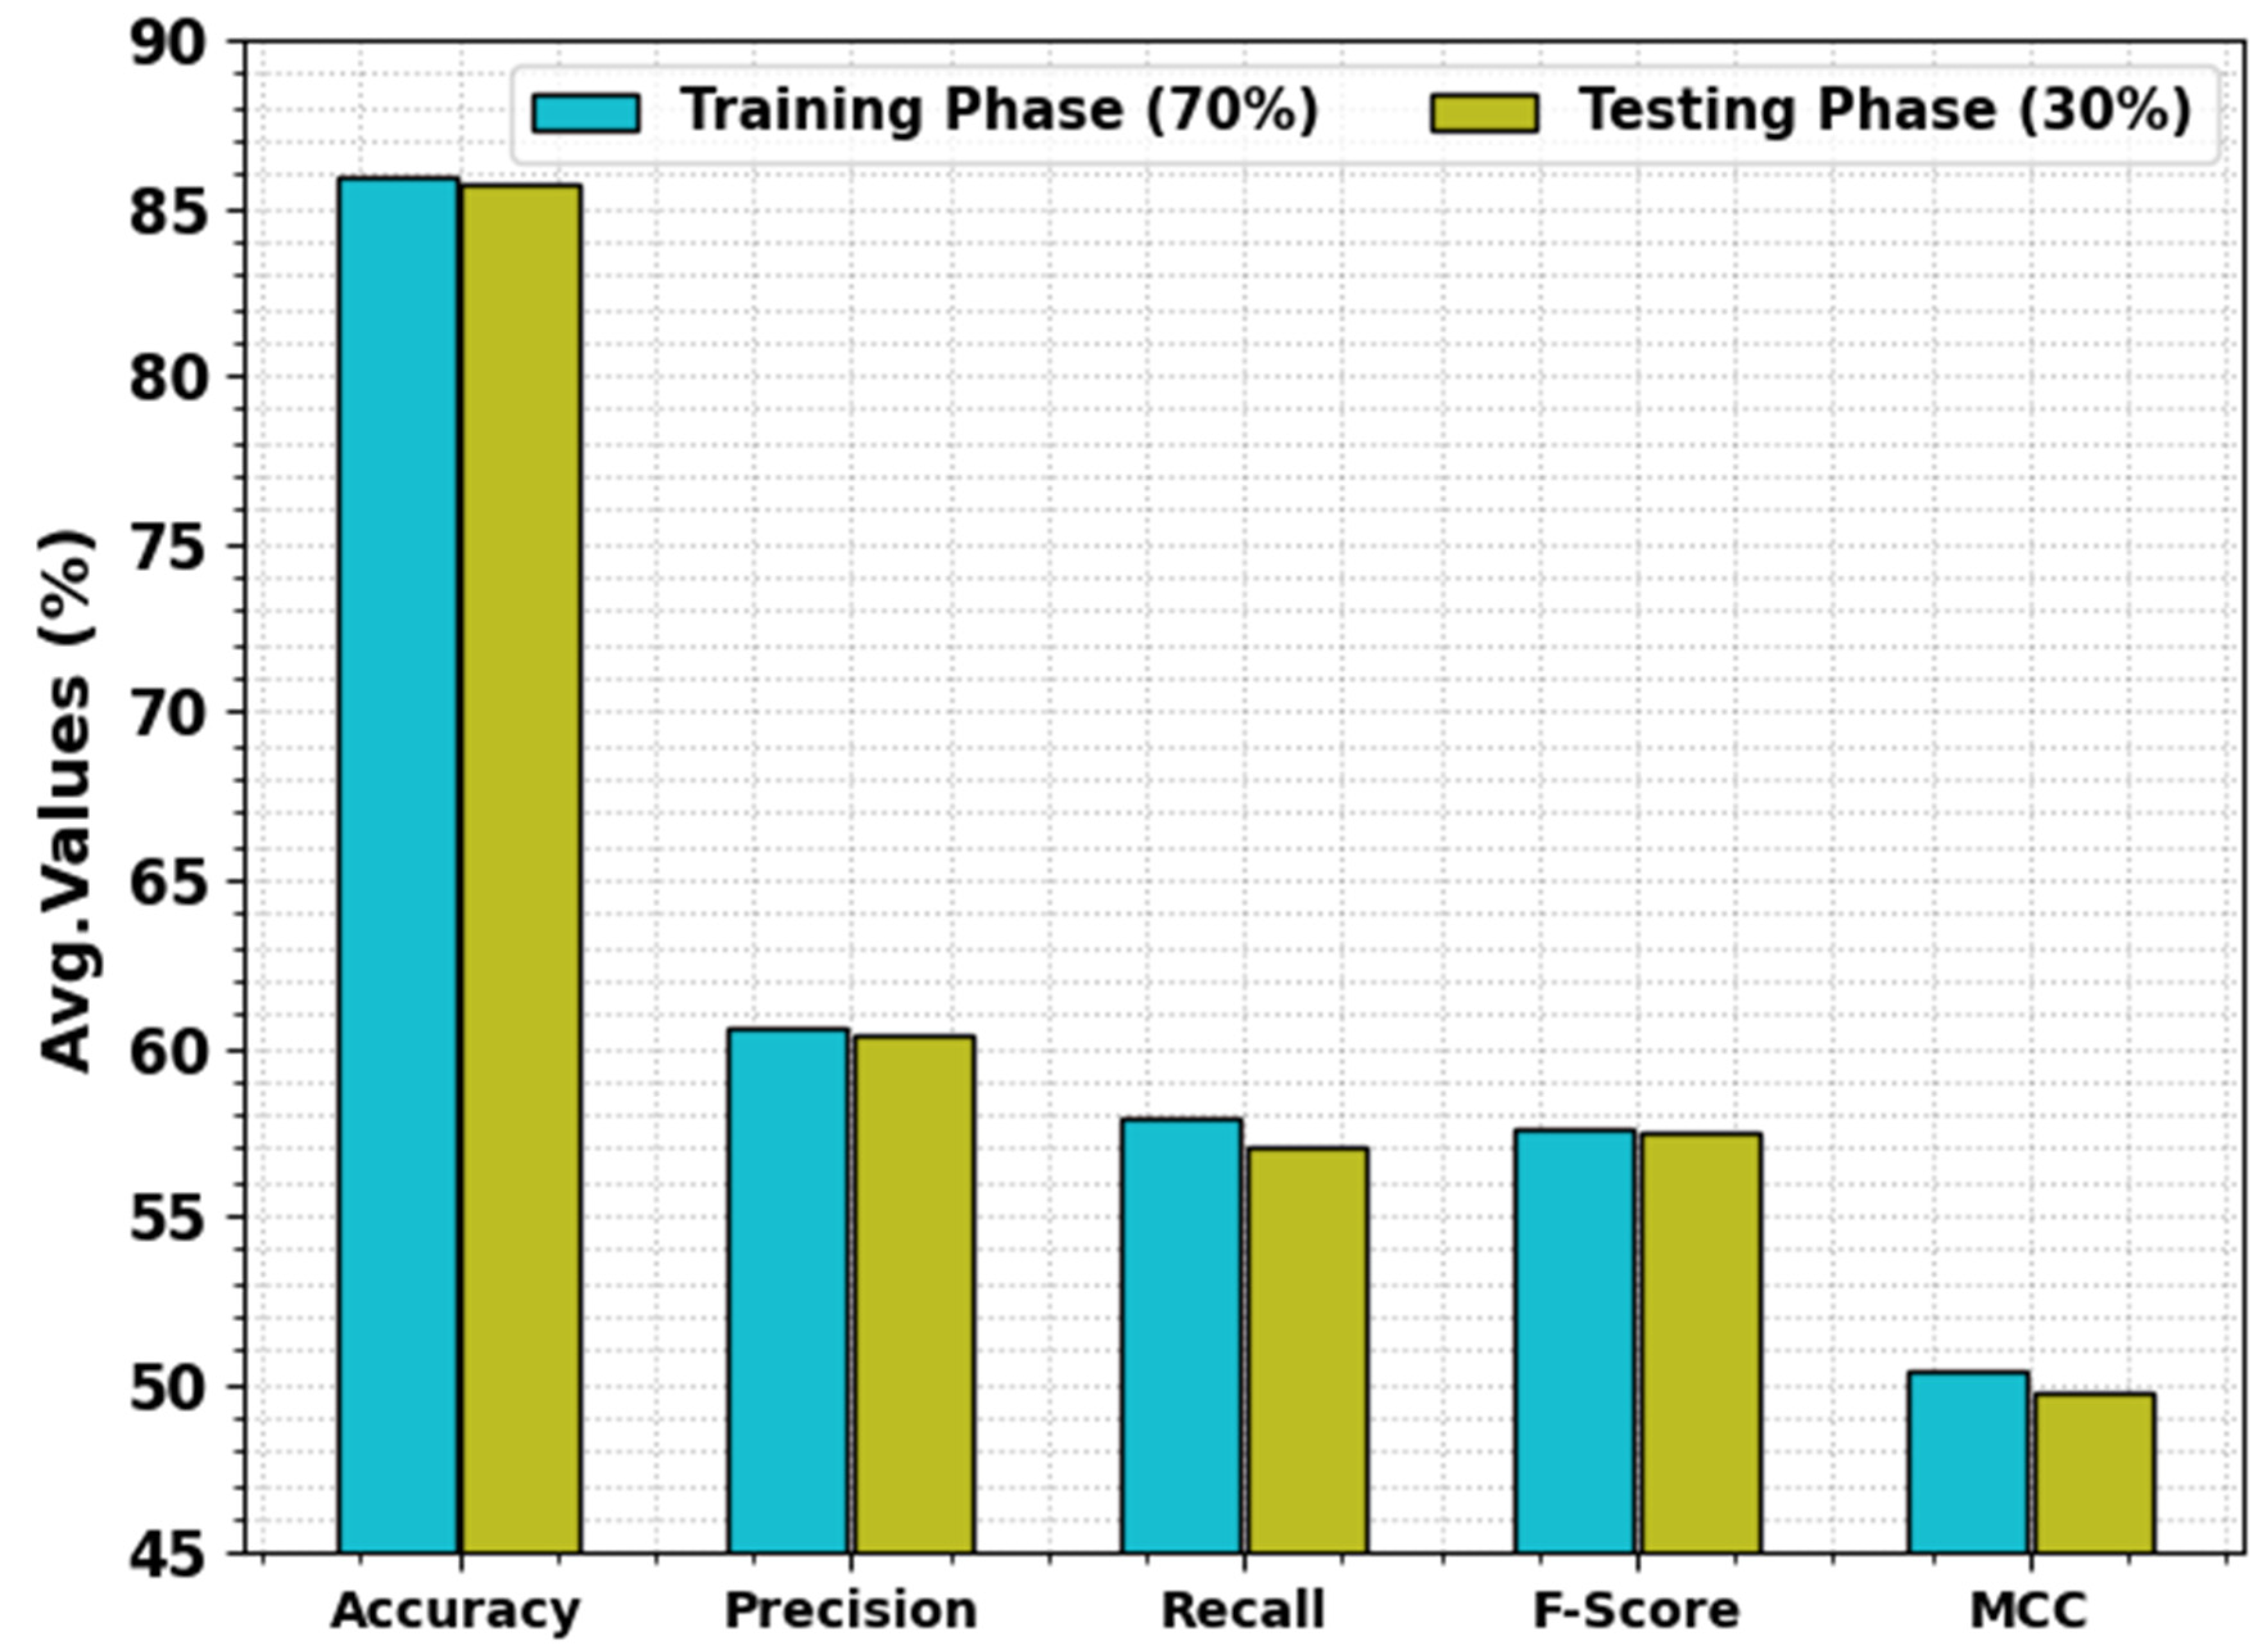
| Training Phase (70%) | |||||
| Butter_Naan | 89.92 | 71.71 | 68.06 | 69.83 | 63.82 |
| Burger | 90.95 | 80.59 | 62.84 | 70.62 | 66.07 |
| Chapati | 90.48 | 78.34 | 58.85 | 67.21 | 62.64 |
| Dal_Makhani | 80.48 | 42.14 | 58.42 | 48.96 | 38.04 |
| Fried_Rice | 85.00 | 55.56 | 54.25 | 54.89 | 45.90 |
| Idli | 79.05 | 37.34 | 44.33 | 40.54 | 28.09 |
| Average | 85.98 | 60.95 | 57.79 | 58.68 | 50.76 |
| Testing Phase (30%) | |||||
| Butter_Naan | 88.89 | 65.79 | 59.52 | 62.50 | 56.09 |
| Burger | 91.11 | 76.56 | 59.76 | 67.12 | 62.71 |
| Chapati | 88.15 | 72.13 | 48.35 | 57.89 | 52.70 |
| Dal_Makhani | 78.52 | 43.92 | 66.33 | 52.85 | 41.09 |
| Fried_Rice | 82.22 | 45.65 | 47.73 | 46.67 | 36.02 |
| Idli | 80.00 | 44.44 | 45.36 | 44.90 | 32.68 |
| Average | 84.81 | 58.08 | 54.51 | 55.32 | 46.88 |
| Methods | MCC | ||||
|---|---|---|---|---|---|
| SHODCNN-FIC | 85.98 | 60.95 | 57.79 | 58.68 | 50.76 |
| InceptionResNet | 81.91 | 58.97 | 55.75 | 54.54 | 48.34 |
| NasNetLarge | 77.91 | 51.97 | 53.67 | 53.87 | 46.94 |
| MobileNet | 75.36 | 58.17 | 51.47 | 56.97 | 44.97 |
| ResNet101 | 73.7 | 58.97 | 54.15 | 53.51 | 47.38 |
| ResNet152 | 71.31 | 45.97 | 47.97 | 41.97 | 45.93 |
| ResNet50 | 68.27 | 44.95 | 56.97 | 54.97 | 46.53 |
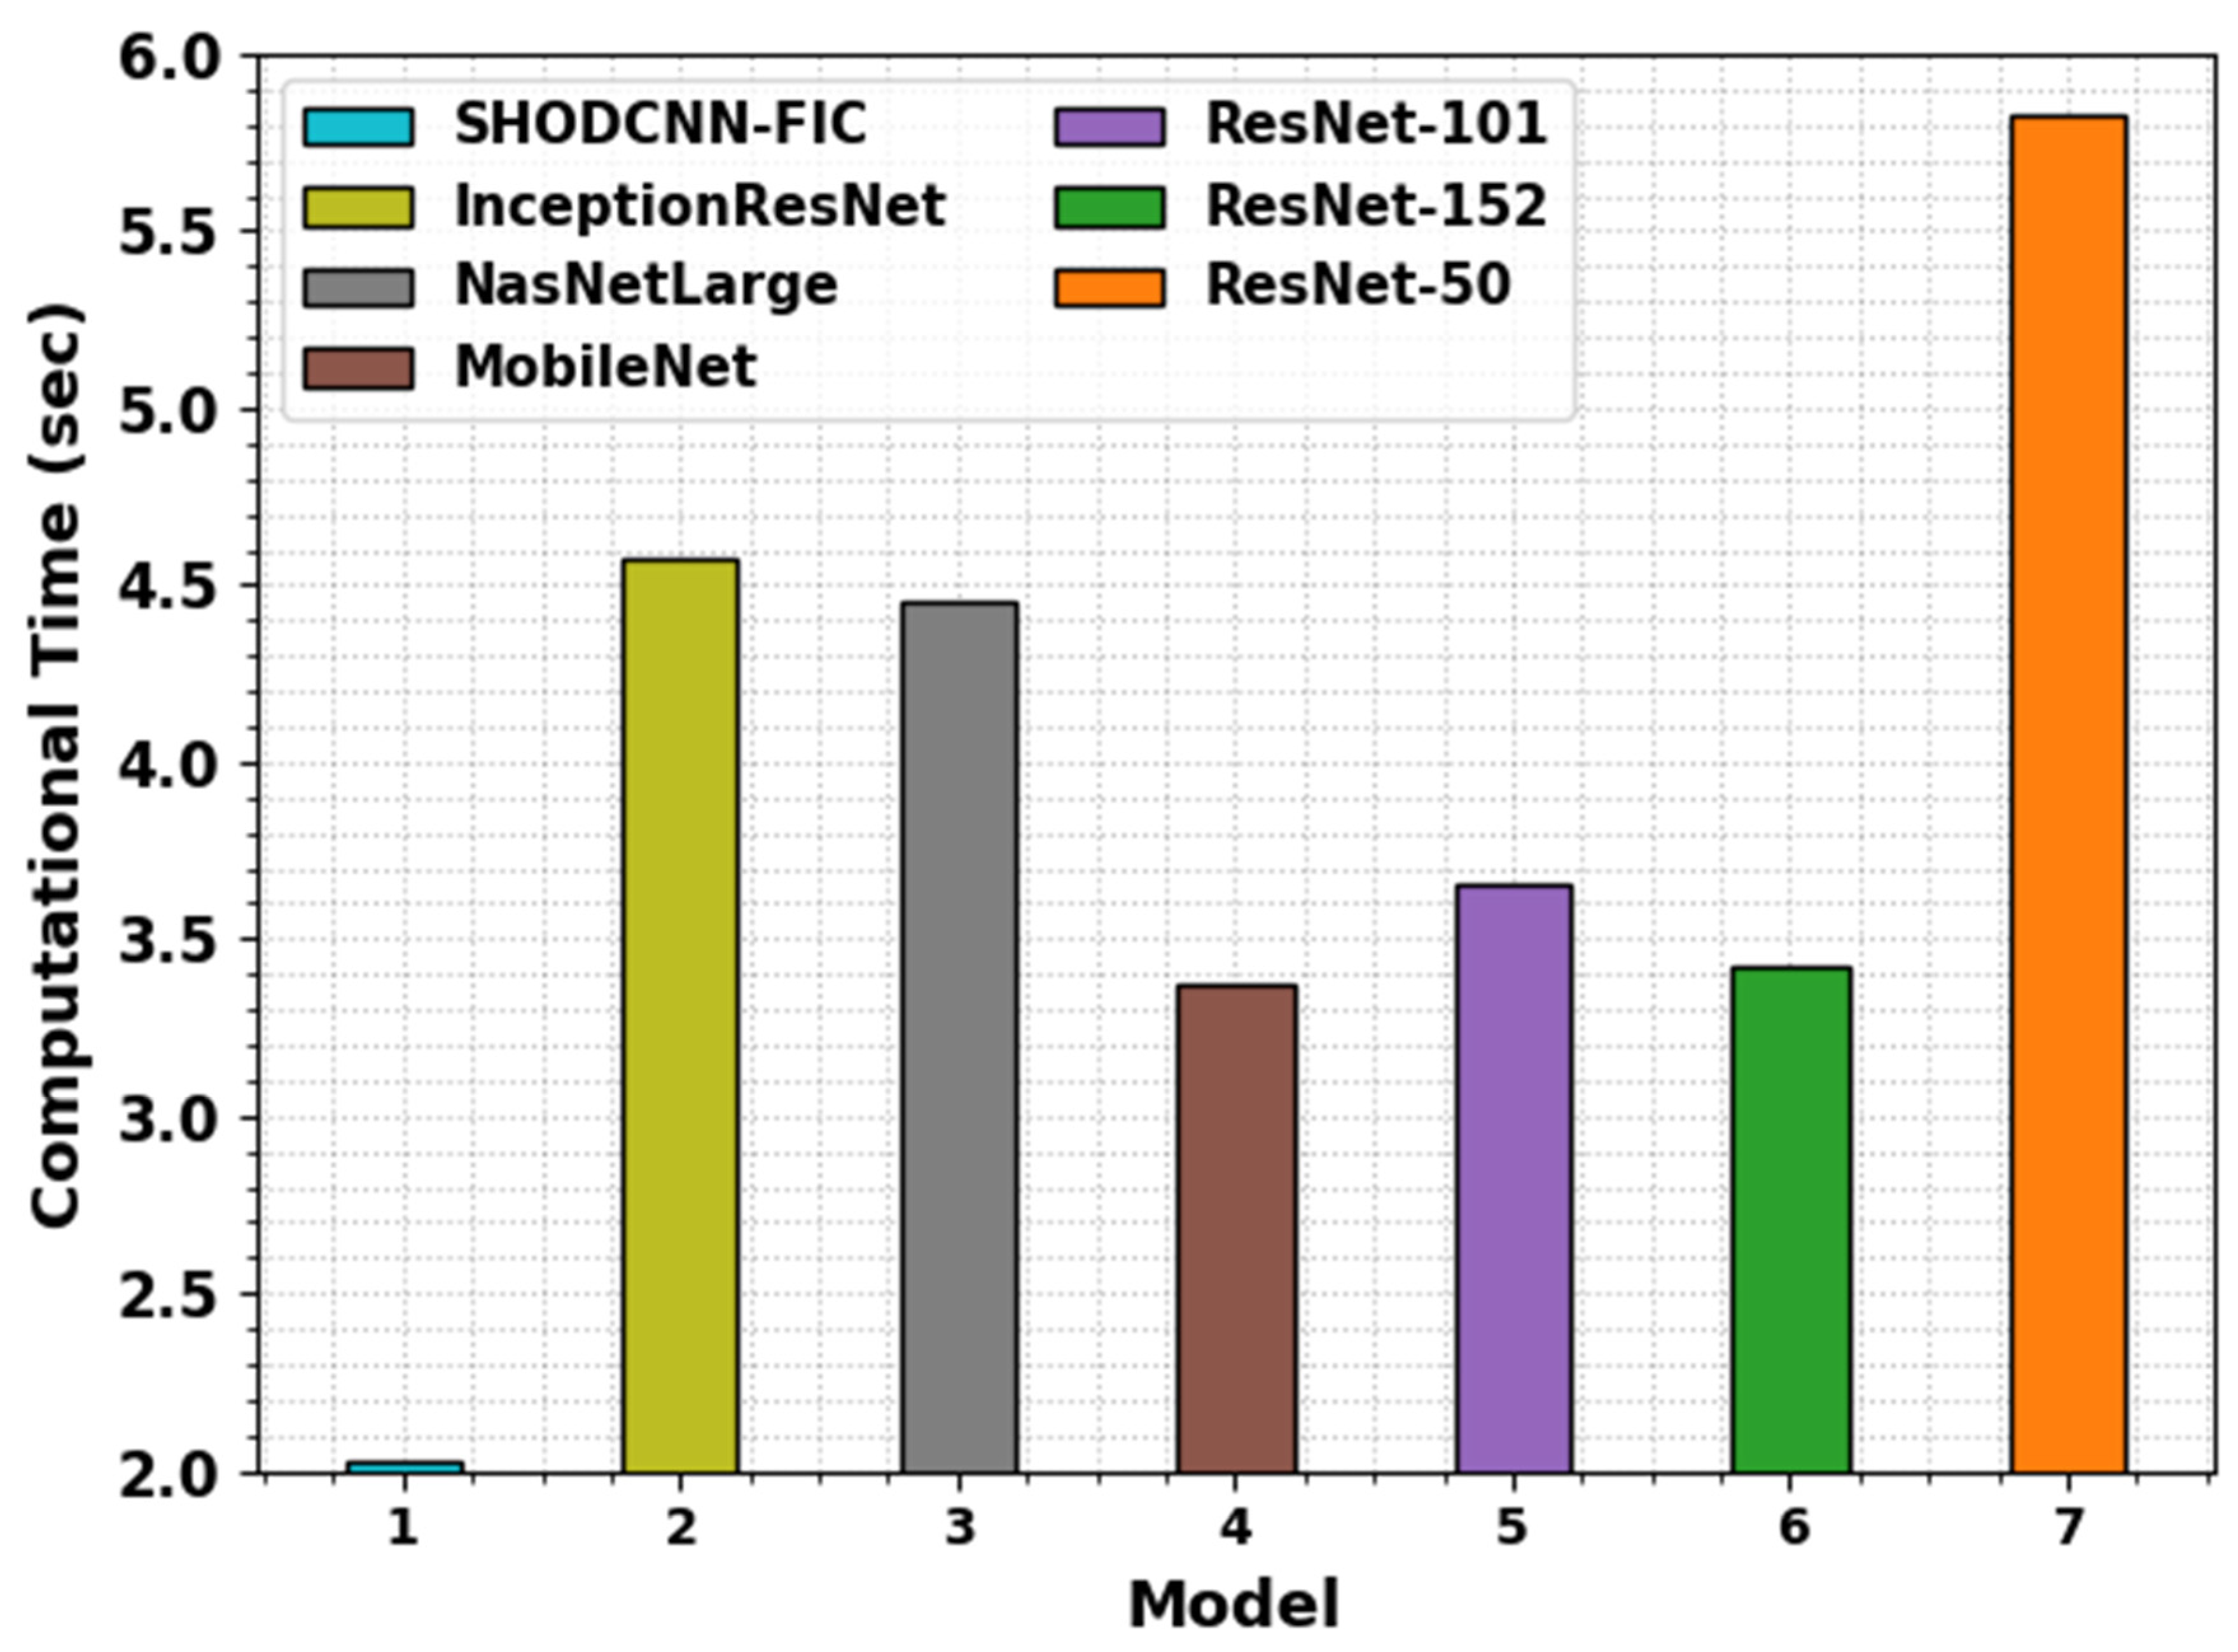
| Model | Computational Time (s) |
|---|---|
| SHODCNN-FIC | 2.03 |
| InceptionResNet | 4.57 |
| NasNetLarge | 4.45 |
| MobileNet | 3.37 |
| ResNet-101 | 3.65 |
| ResNet-152 | 3.42 |
| ResNet-50 | 5.83 |
Disclaimer/Publisher’s Note: The statements, opinions and data contained in all publications are solely those of the individual author(s) and contributor(s) and not of MDPI and/or the editor(s). MDPI and/or the editor(s) disclaim responsibility for any injury to people or property resulting from any ideas, methods, instructions or products referred to in the content. |
© 2023 by the authors. Licensee MDPI, Basel, Switzerland. This article is an open access article distributed under the terms and conditions of the Creative Commons Attribution (CC BY) license (https://creativecommons.org/licenses/by/4.0/).
Share and Cite
Mahgoub, H.; Aldehim, G.; Almalki, N.S.; Issaoui, I.; Mahmud, A.; Alneil, A.A. Bio-Inspired Spotted Hyena Optimizer with Deep Convolutional Neural Network-Based Automated Food Image Classification. Biomimetics 2023, 8, 493. https://doi.org/10.3390/biomimetics8060493
Mahgoub H, Aldehim G, Almalki NS, Issaoui I, Mahmud A, Alneil AA. Bio-Inspired Spotted Hyena Optimizer with Deep Convolutional Neural Network-Based Automated Food Image Classification. Biomimetics. 2023; 8(6):493. https://doi.org/10.3390/biomimetics8060493
Chicago/Turabian StyleMahgoub, Hany, Ghadah Aldehim, Nabil Sharaf Almalki, Imène Issaoui, Ahmed Mahmud, and Amani A. Alneil. 2023. "Bio-Inspired Spotted Hyena Optimizer with Deep Convolutional Neural Network-Based Automated Food Image Classification" Biomimetics 8, no. 6: 493. https://doi.org/10.3390/biomimetics8060493
APA StyleMahgoub, H., Aldehim, G., Almalki, N. S., Issaoui, I., Mahmud, A., & Alneil, A. A. (2023). Bio-Inspired Spotted Hyena Optimizer with Deep Convolutional Neural Network-Based Automated Food Image Classification. Biomimetics, 8(6), 493. https://doi.org/10.3390/biomimetics8060493