1. Introduction
Advanced primates have evolved over a long time to optimize powerful and well-developed visual systems. The human visual system, as a sophisticated and complex information acquisition and perception system, provides a solid foundation for people to accomplish tasks such as awareness, cognition, and understanding. However, visual impairment and lesions cause great inconvenience to people with visual impairment. Some diseases, such as glaucoma, are caused by the axonal death of ganglion cells in the retina, resulting in impaired visual fields. Macular degeneration is caused by the degeneration of retinal pigment epithelial cells, leading to the degeneration and death of photoreceptors. Due to the insufficient bionics, no major practical application breakthroughs have emerged from the prospect of applications in biomedical engineering and functional rehabilitation. On the one hand, the lack of understanding of brain-coding mechanisms leads to uncoordinated human–machine interfaces. On the other hand, the implementation of previous computational models usually requires a large amount of hardware resources, ignoring the need for portability and low power consumption. For example, the impaired need functional assistive devices respond instantly and reliably with a low cost, which places high demands on portability and computational efficiency. We hope to design wearable brain-like visual aids device to solve similar problems, and it is a good choice to develop tools from an embedded perspective in terms of hardware implementation [
1].
In terms of approaches to solving visual tasks, we prefer to study the processing of objects in the human visual system from the direction of bio-vision theory rather than computer vision theory because it is supported by more direct and reliable biological arguments and has a certain interpretability and robustness. Although computational models utilizing deep learning have emerged and shown good accuracy, they also suffer from network structures that do not facilitate understanding, are vulnerable to attacks [
2,
3], and generate high power consumption [
4,
5]. Bio-vision systems solve all these problems extremely well and achieve an excellent balance between real-time processing, accuracy, robustness, and energy consumption. At the same time, the biological mechanism can effectively simulate the function of visual structures, which helps make designs that more easily achieve information transfer with the brainand has broad application prospects in the fields of biomedical engineering.
One way of researching brain-like computing is to study how the brain’s structure is adapted to its functional needs. Some researchers have constructed brain-like computing models based on certain parts of the brain structure and neurocomputational principles. For example, Salamat et al. proposed a brain-like unsupervised clustering method based on hyperdimensional computing, which maps low-dimensional data to high-dimensional data for processing clusters [
6]. Wei et al. proposed computational models that simulate the structure of functional columns of the visual cortex and nonclassical receptive fields [
7,
8,
9,
10]. These studies show how to design computational models from a neuromorphic perspective with the potential of in-memory computing.
Tanaka et al. proposed a brain-like learning model based on the amygdala, which was implemented with hardware and used in a robot [
11,
12]. Based on the spatial and memory functions of the hippocampus and its spatial navigation function, Aggarwal et al. developed a mathematical model of hippocampal structure, and then implemented the model on the circuit [
13]. Cho et al. modeled the behavior of simple cells of the visual cortex by using Gabor functions and implemented the mapping in hardware [
14].
Brain-like computing is moving toward the goals of high performance, high parallelism, and low power consumption. These advantages are difficult to achieve with current traditional computing architectures. Designing dedicated architectures and conducting research from the perspective of in-memory computing facilitates the achievement of these goals. The development of storage-based systems has led to an increase in the efficiency of in-memory computing, providing the conditions for reducing hardware resources, on which biologically inspired computing can be used for the purpose of scaling the devices down [
15].
We design specific architecture for our computational models on FPGAs. FPGAs are highly customizable and configurable devices that can be customized to better fit the circuit structure of the target system, providing extreme flexibility and reconfigurability for the hardware acceleration of software algorithms. Designing such dedicated architectures can effectively reduce memory bottlenecks, improve overall system computational efficiency, and reduce hardware cost and power consumption.
There has been a great deal of practice in implementing many different kinds of neural networks with FPGAs. Several studies have successfully mapped convolutional neural networks onto FPGAs, exhibiting minimal loss of accuracy while achieving significant improvements in speedup ratios and energy efficiency [
16,
17]. Some studies implement spiking neural networks on FPGAs and realize model acceleration, indicating that FPGAs are suitable for large-scale cortical simulations [
18,
19,
20]. However, there has been relatively little research into using FPGAs to implement non-traditional multi-level neurocomputational models that strictly mimic visual neurobiological mechanisms and follow visual conduction pathways, which is not just a hardware acceleration of multilayer feedforward networks.
With the continuous development of physiology and anatomy, the principles of the human visual system have been roughly explained from the neuronal level. Some previous research studies build and implement visual computational models on circuits [
21,
22,
23,
24,
25]. These studies are either limited to individual neural connections or information pathways, while ignoring the overall representation of the early visual system. Based on a large number of physiological and anatomical experiments, there is a certain understanding of the functional hierarchical division of the primary visual cortex, which gives us the possibility to build a visual model based on fundamental physiological knowledge. We simulate these physiological structures and model networks with orientation selectivity. If these orientation signals are transmitted to the visual nerve, it will greatly facilitate the construction of the visual repair system.
This study integrates multiple bottom–up visual pathways in the visual system from the retina, to the lateral geniculate nucleus (LGN), to the visual cortex and proposes a bionic hierarchical network to approximate the process of object formation representation in the visual system, which can also lay a foundation for subsequent higher-level visual tasks. In addition, circuit-based design took a long time to develop and was also expensive to develop and modify according to changes of models. Our proposed FPGA-based network model mimicking the visual system has a multi-layered structure based on both the physiological structure and signal-processing mechanisms, and it follows the anatomical and biological evidence of human visual neural mechanisms more closely. Based on this model, we generate cortical orientation maps that are surprisingly similar to the actual cortical maps and functionally have orientation selectivity.
In researching visual impairment aid devices, there are a variety of research studies that build assistive devices from different perspectives. For example, some studies use sensors, such as ultrasound and laser to locate and distance objects [
26,
27,
28]. Some studies use cameras to acquire images and run computer vision algorithms to calculate obstacle data [
29]. There are also papers that use positioning technologies, such as GPS, to build a complete set of hardware wearable devices for the visually impaired [
30].
However, the implementation of biological mechanisms is always based on larger hardware resource, ignoring the need for portability and low power consumption. From the perspective of embedded, it is more appropriate to use FPGA as the implementation device for developing wearable devices. Wearable embedded devices are ideal form for medical or assistive devices, which further increase the requirements for size, quality and energy consumption. It needs to be worn on the body and carried around, where portability and durability are necessary. In addition, with the optimization of software algorithms and functional changes, the programmability of the device is also necessary. Multilayer network model design on FPGAs can gain advantages in these aspects. In terms of performance per watt, FPGAs can achieve relatively low energy consumption, which gives longer endurance to portable devices.
In order to find an explainable image representation model and image-processing method, we explore the brain-like mechanism and make the following contributions:
We developed a bionic vision model that simulates the process from the retina to the primary visual cortex, which is capable of representing images and giving a neuroscientific explanation of this process.
We meticulously mapped the visual pathway model onto FPGAs, effectively integrating biological cell functions with hardware features to achieve parallel distributed neural computation.
We performed hardware simulations and parallelism experiments, and the results show that it outperforms the implementation on the central processing unit (CPU) and graphics processing unit (GPU) in terms of parallelism, latency and power consumption.
3. Methods
We focus on this existing knowledge in anatomical structure and information processing functions and use it as basic constraints for brain-like computational model design. We develop a hierarchical network model of visual pathways based on neurobiological mechanisms. Each layer of the network architecture is an abstract model of a particular function of the visual system. Also, we conduct some experiments to verify the feasibility of model.
3.1. Hierarchical Network Computational Model
By studying the physiological structure and function of the retina, LGN, and primary cortex, it can be found that primary visual cortex cells have orientation selectivity, which is important for object contour extraction and representation. In order to simulate the information processing mechanism of human vision, we abstract the main cellular structures in the physiological visual system and establish an orientation-selective model of the early visual system.
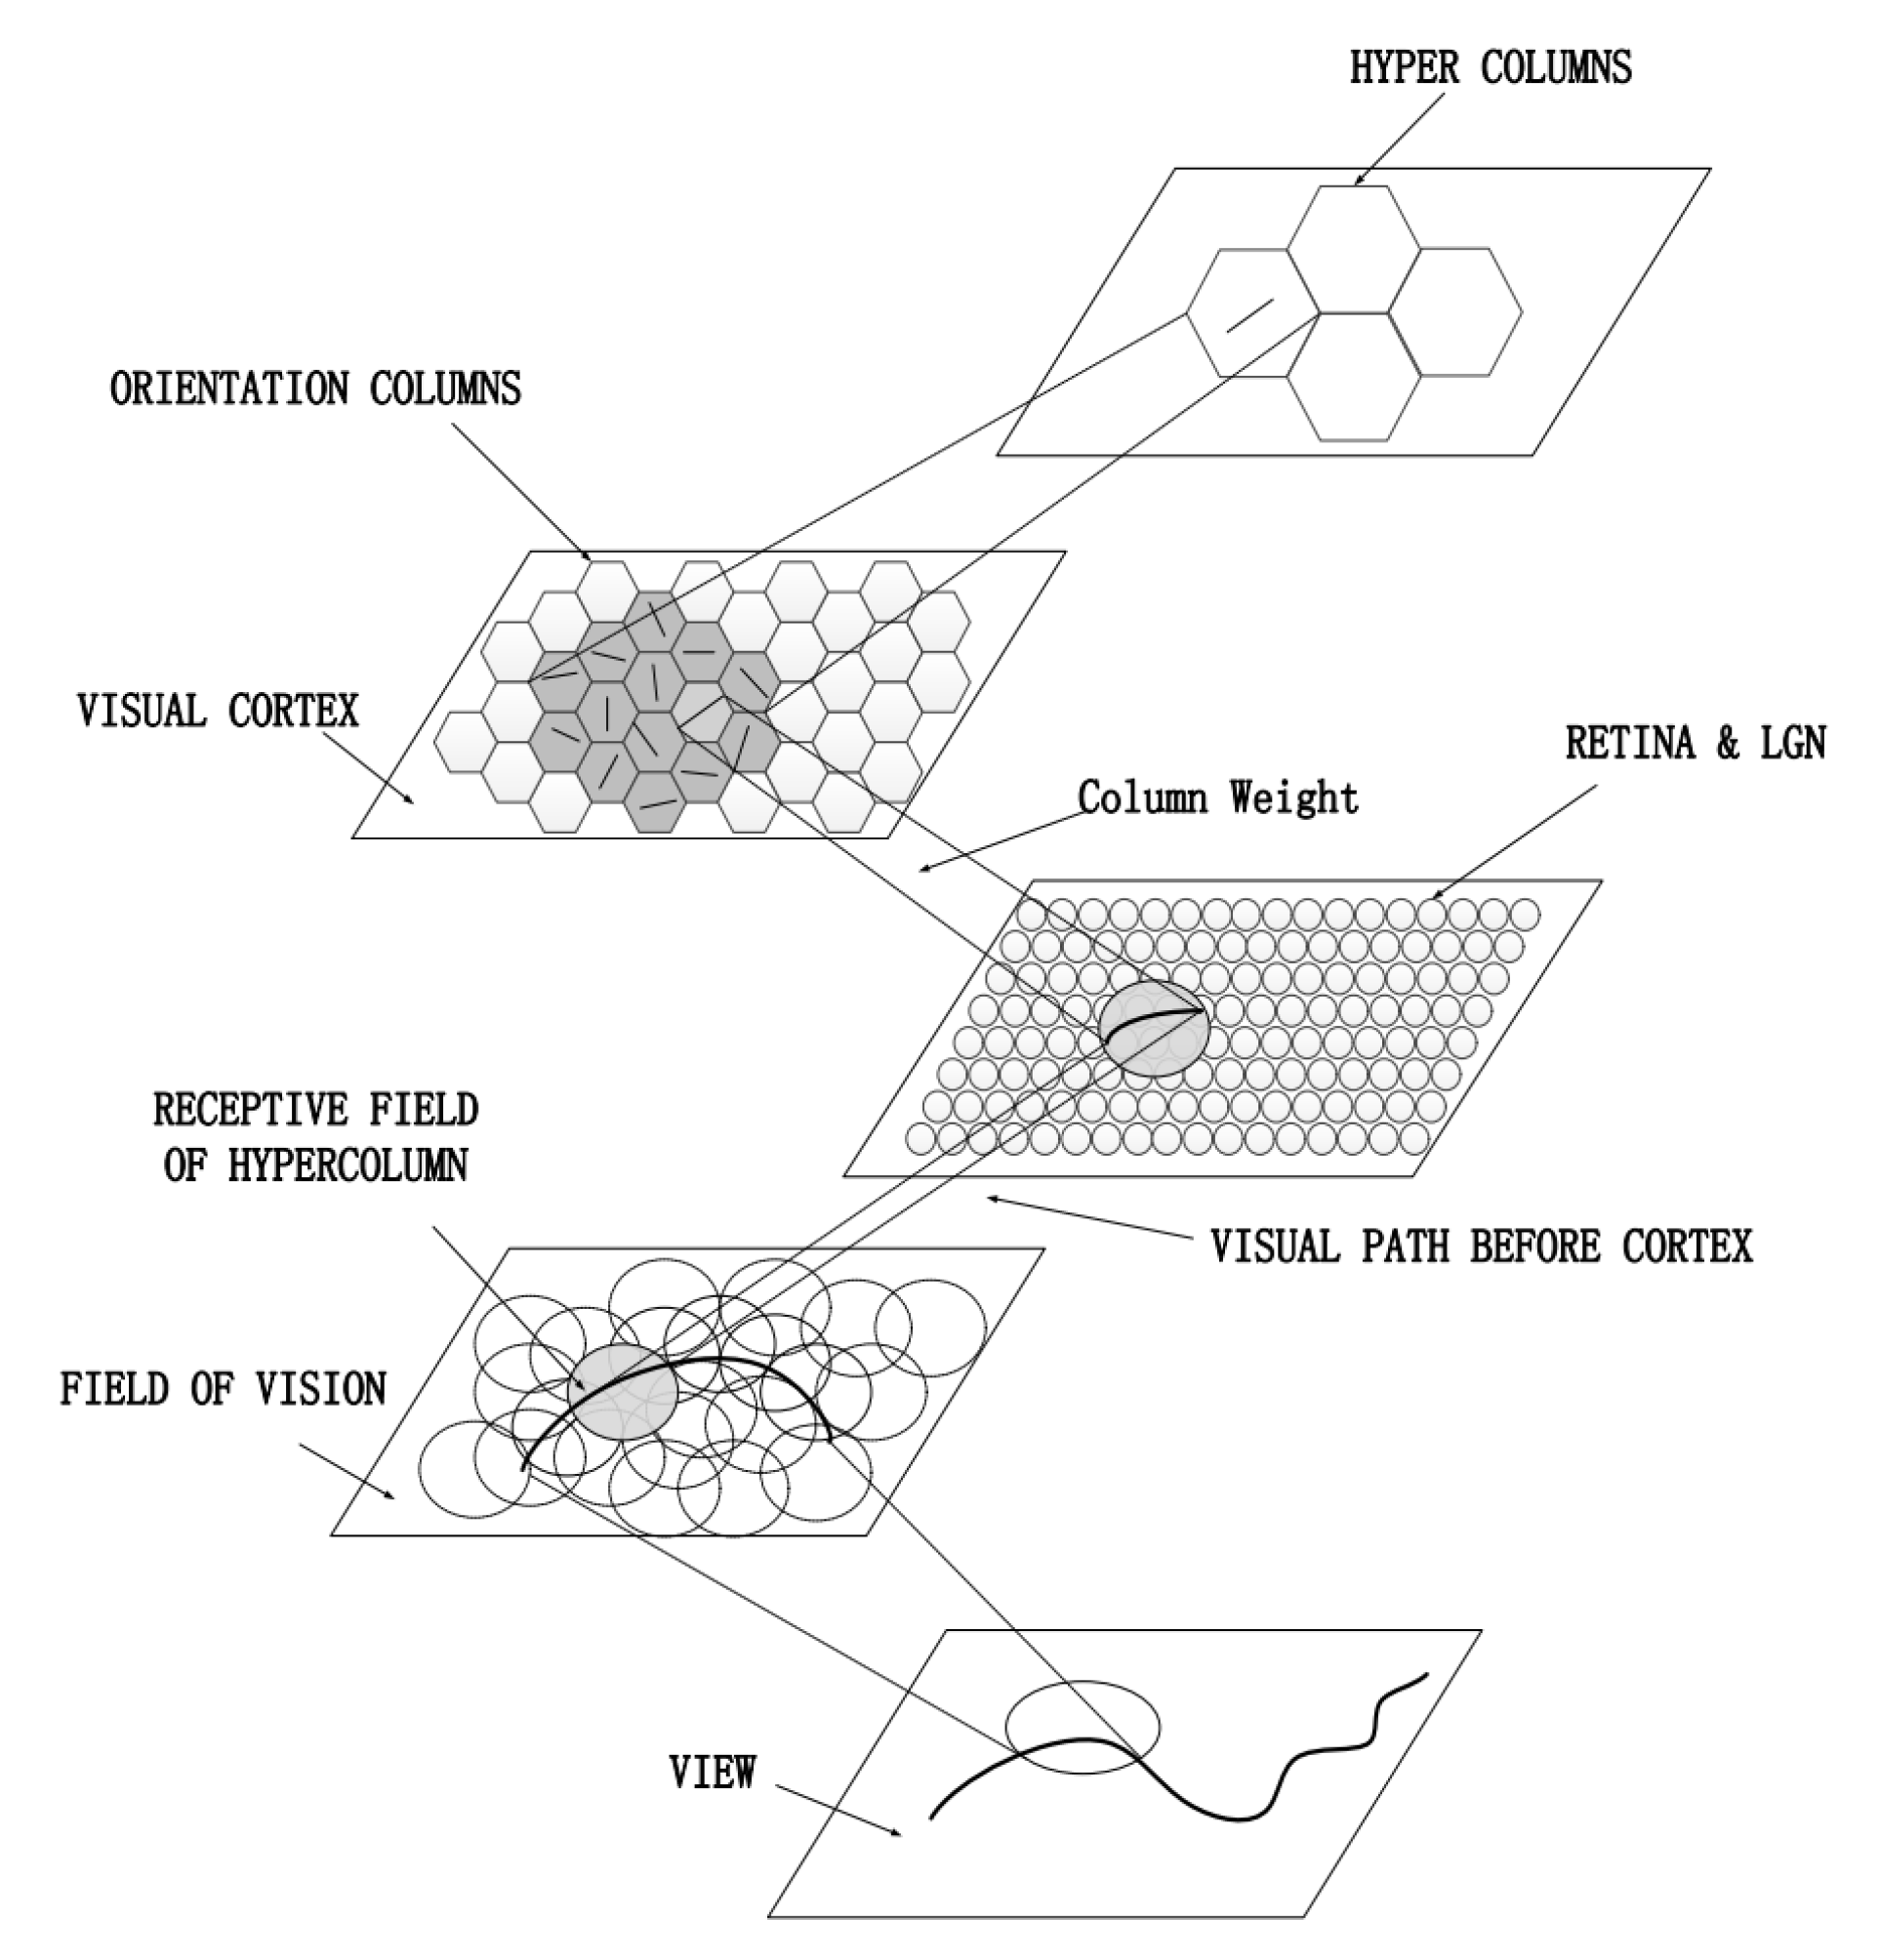
The model is shown in
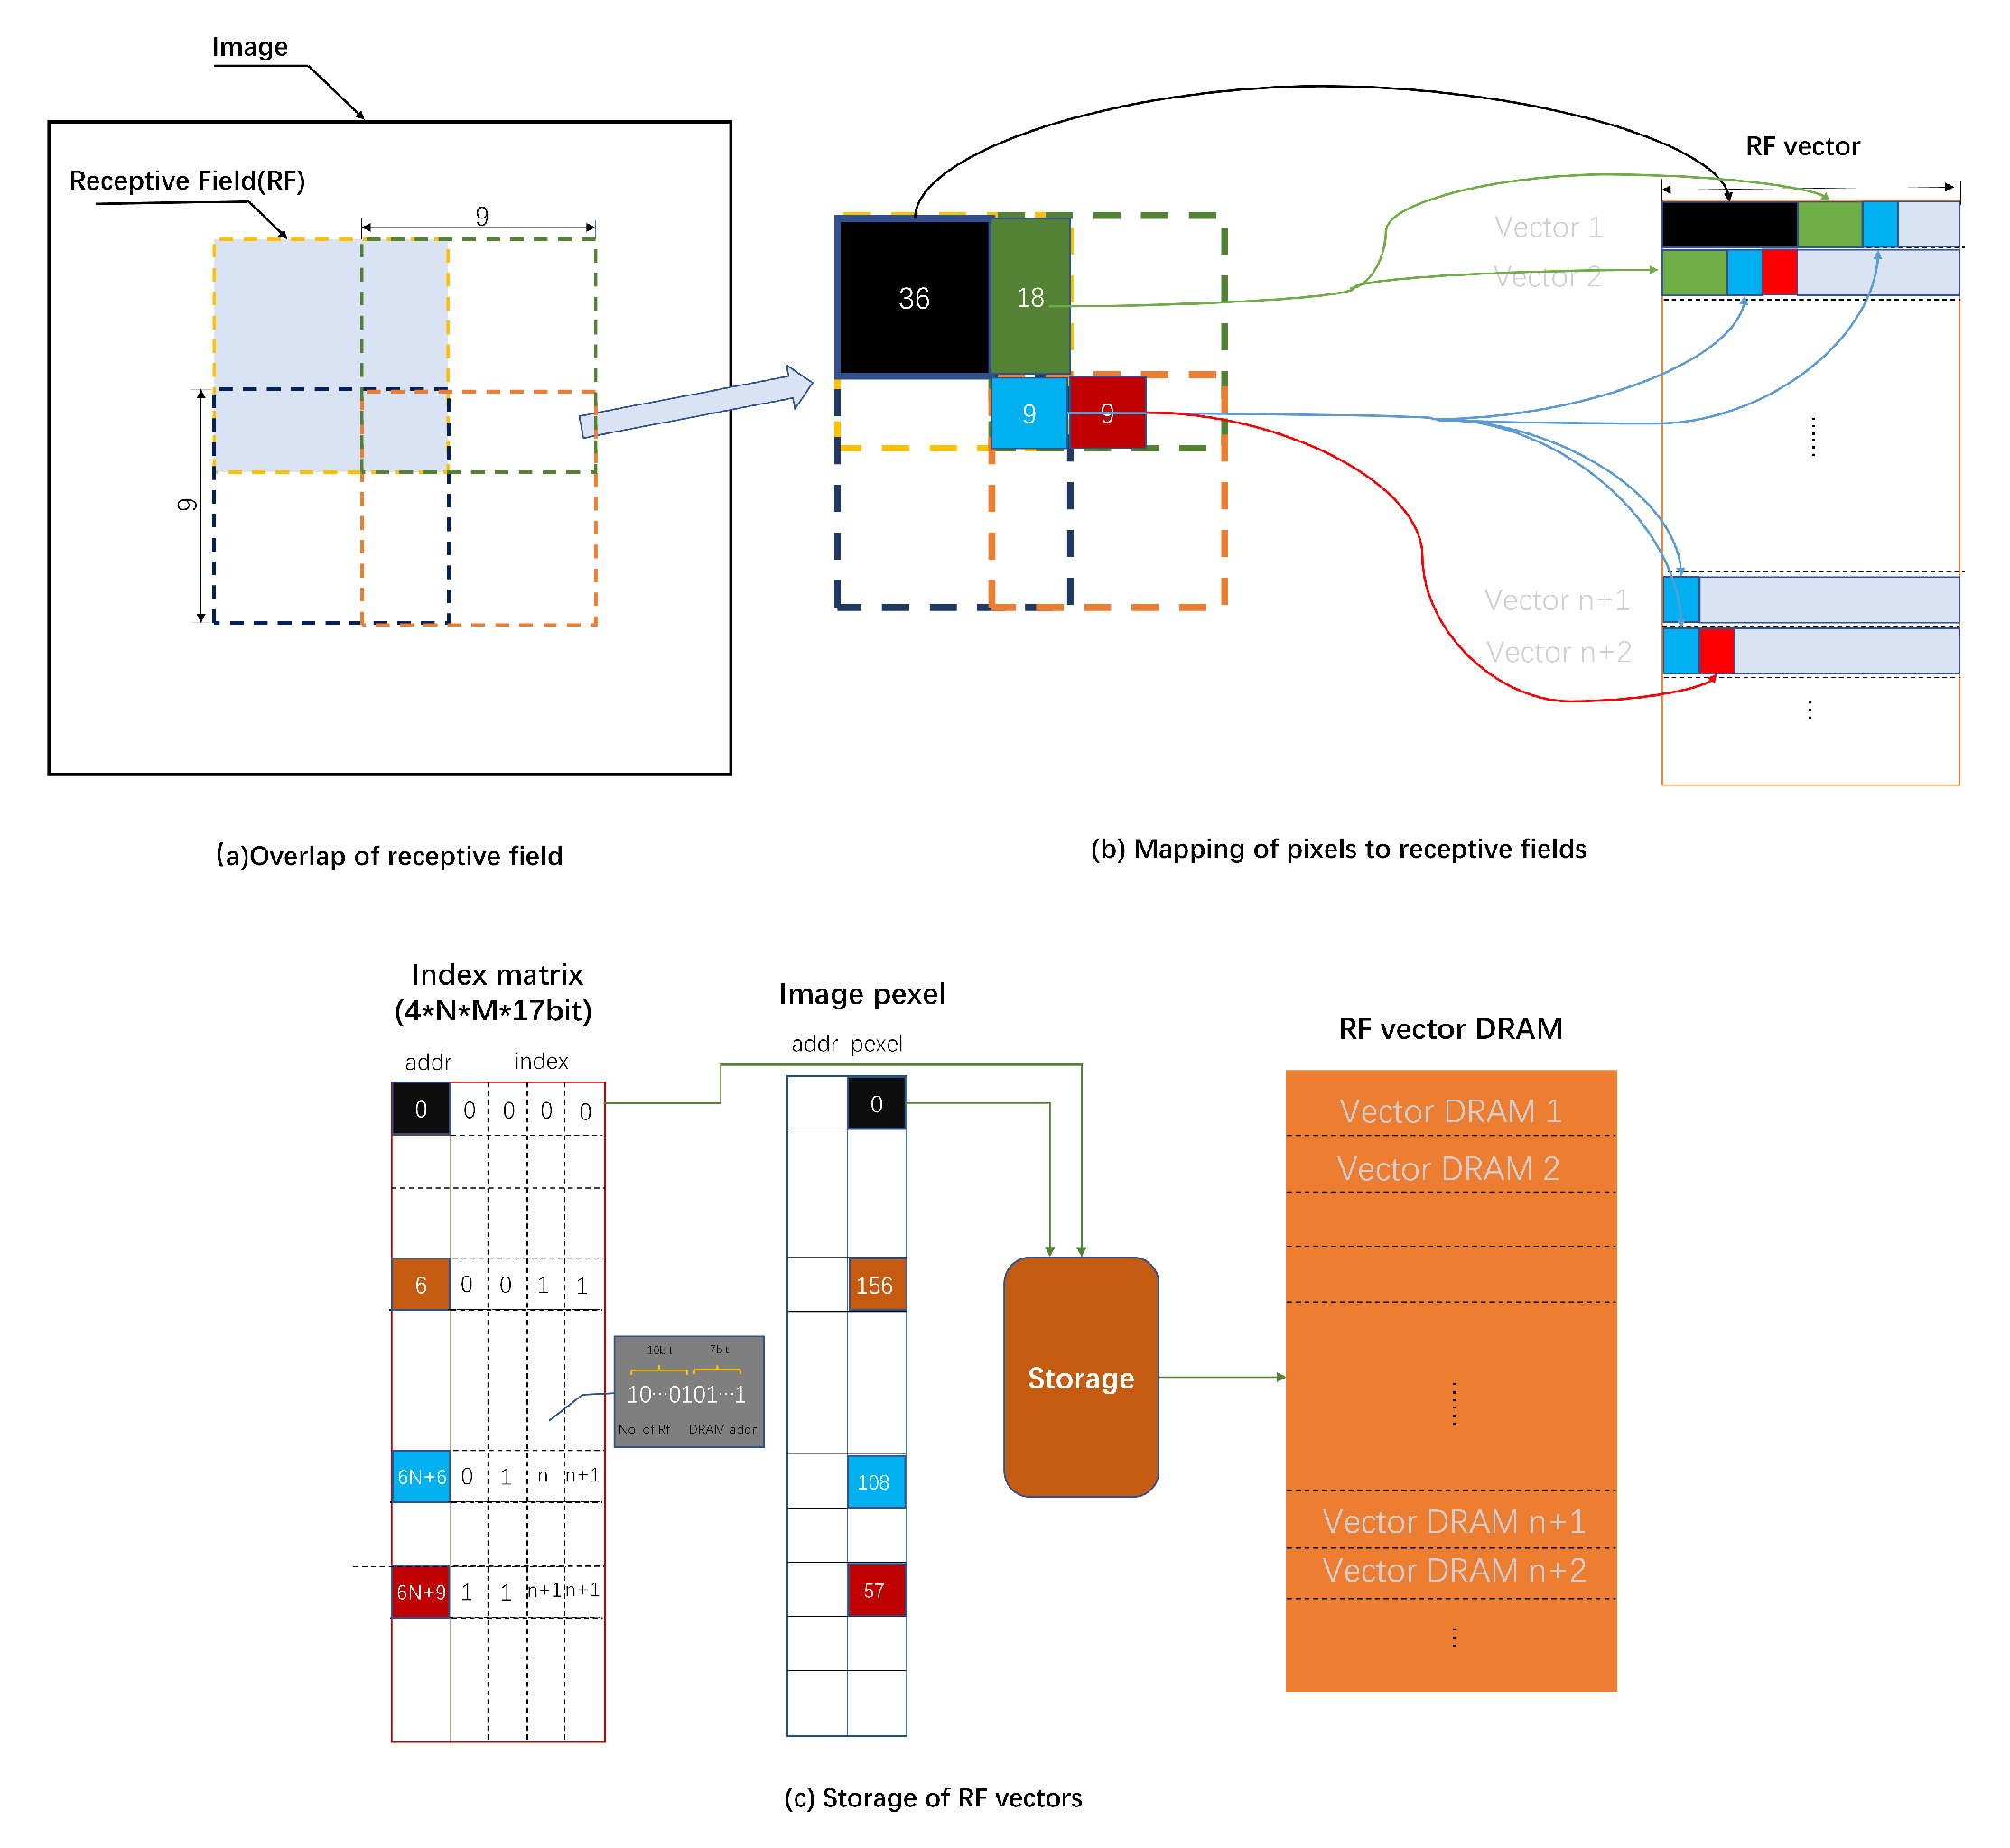
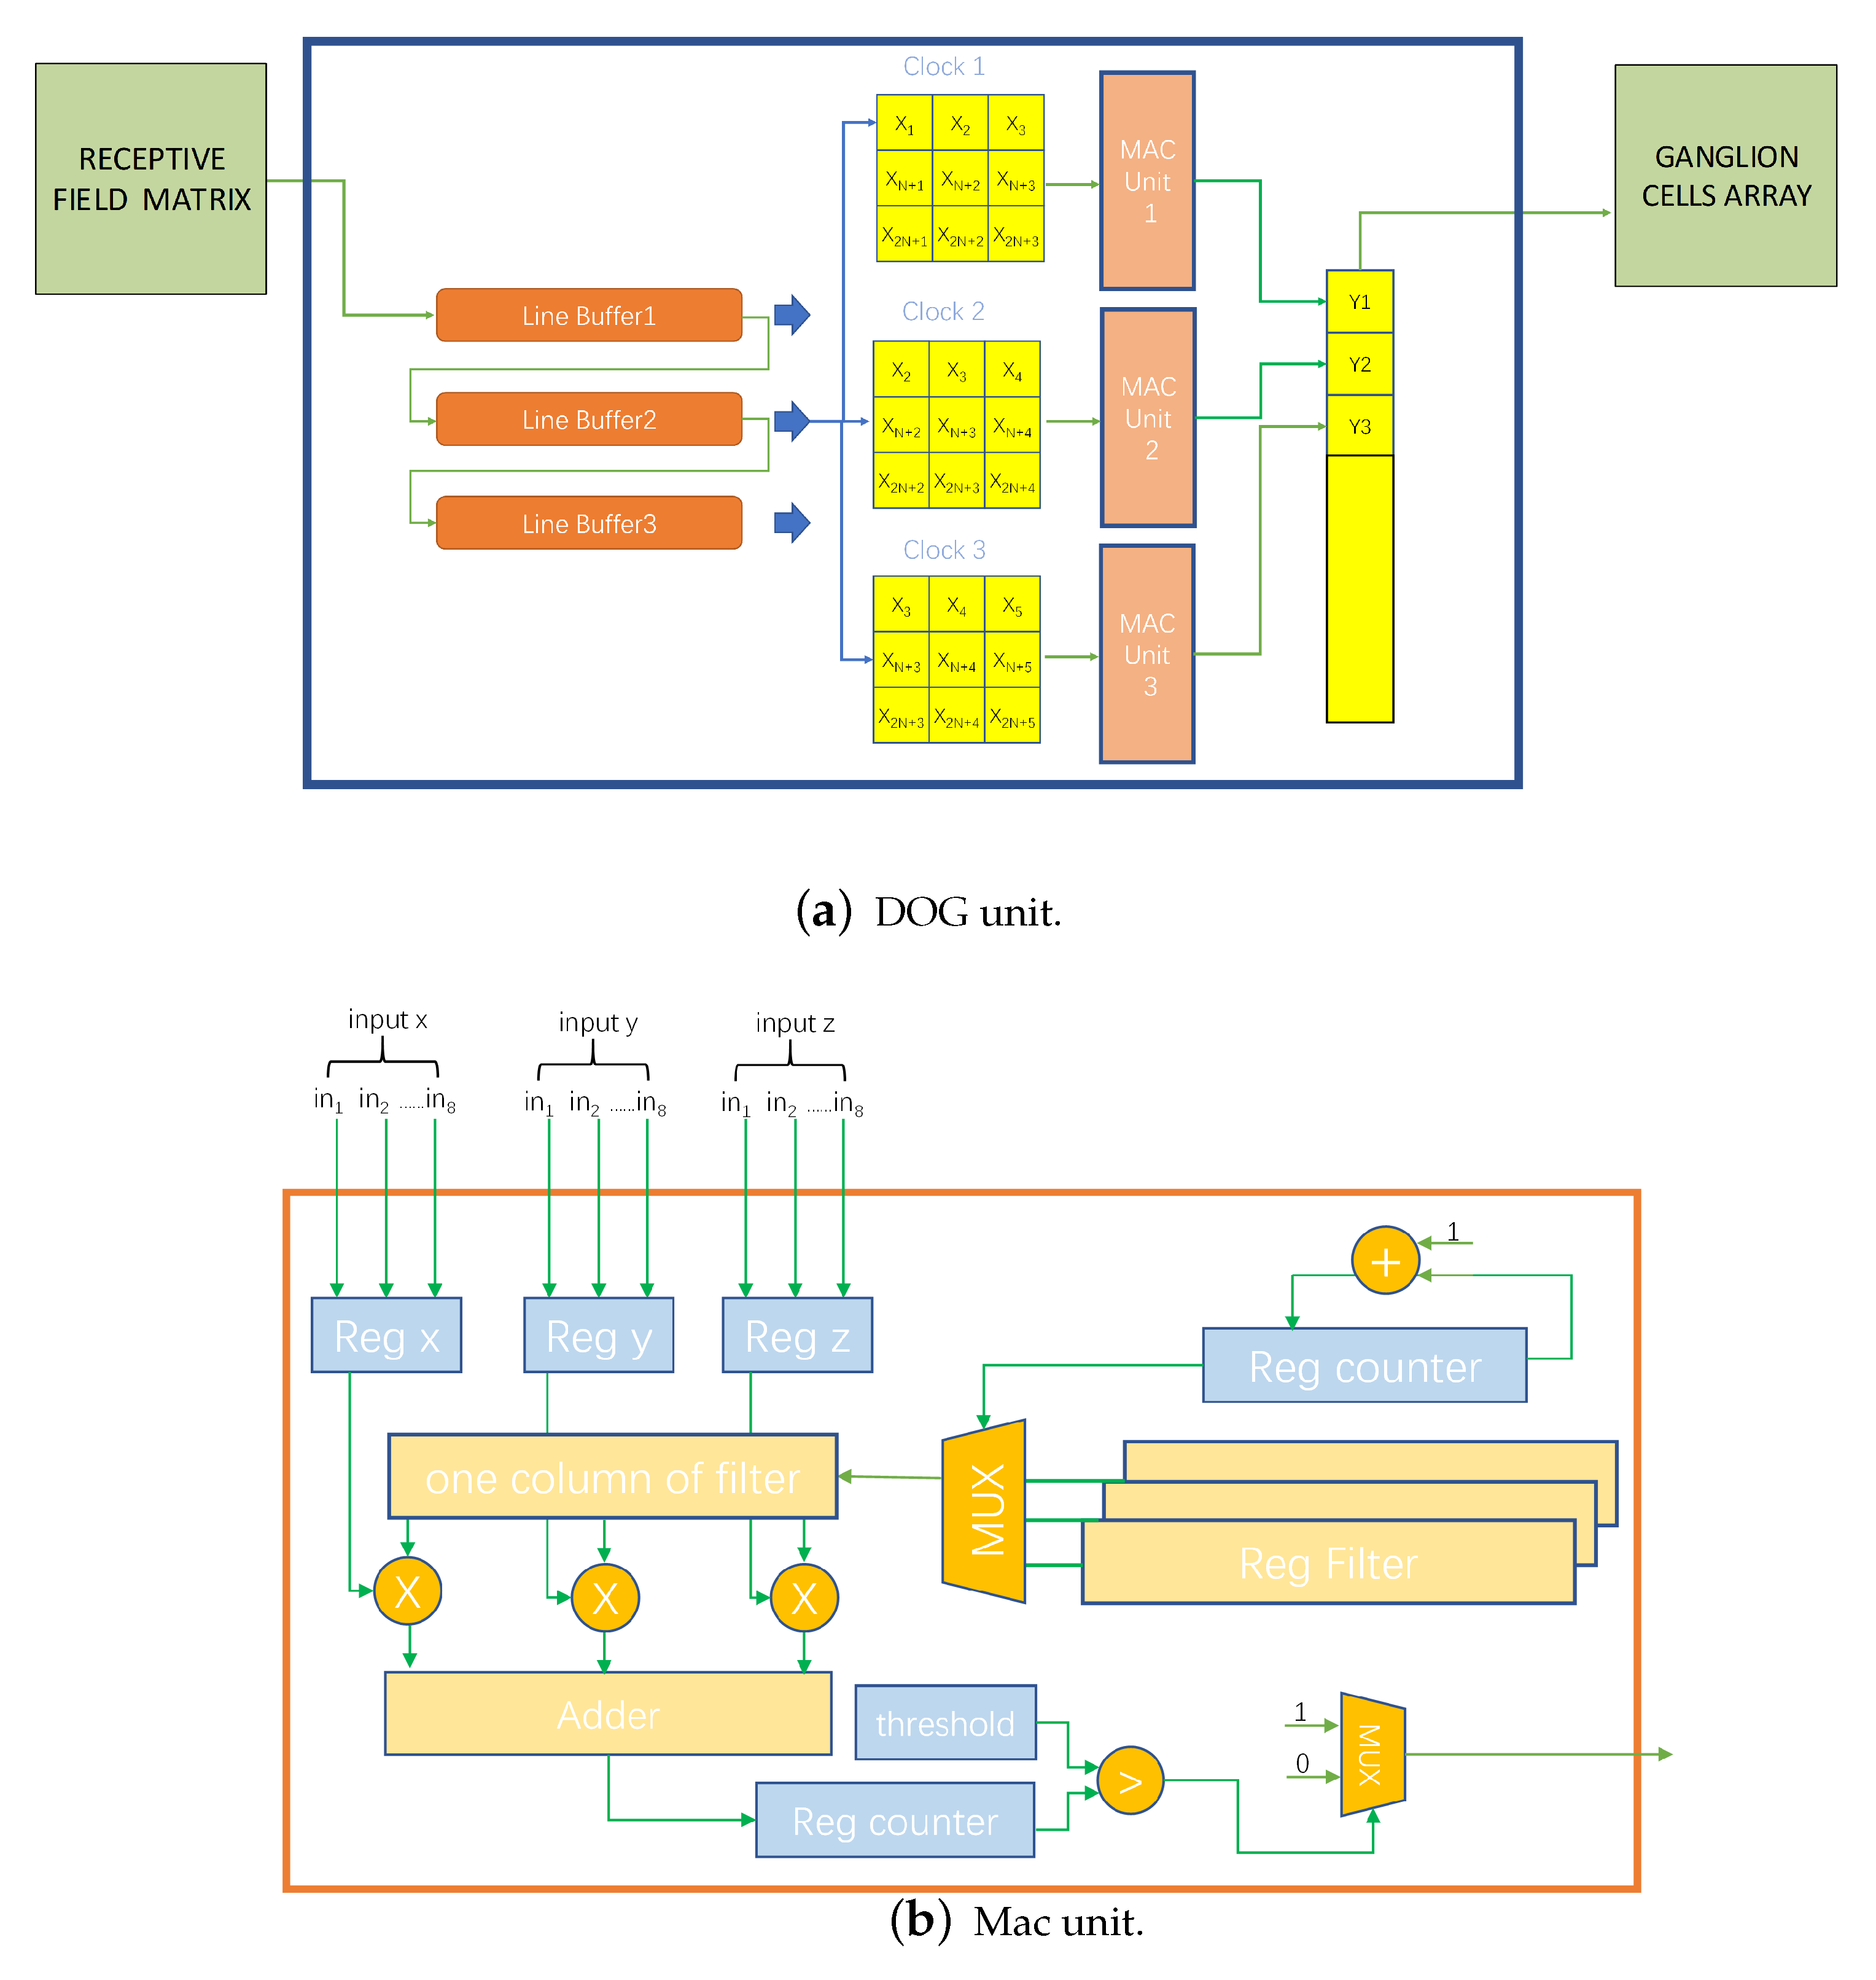
Figure 1. The receptive field layer simulates the oculomotor scanning process of the human eye and simulates some cells in the retina to segment the image in the receptive field into separate receptive fields; the retinal and LGN layers carry out the difference-of-Gaussians (DOG) processing of pixels in the receptive fields as a GC model, and the primary visual cortex carries out the orientation processing of the results of the upper layer processing as an orientation column model to present the representational information and form a cortical orientation map as the output.
3.2. Modeling of Ganglion Cells
When we view an image, the visual information within a certain field of vision enters the photoreceptor cells as the eye turns. The visual information is gradually processed through the retinal layer to form the concentric receptive field. Bipolar cells generate graded potentials from information in the receptive field and transmit them to ganglion cells. The receptive field formed during this process has a central peripheral antagonistic mechanism [
34]. It is impossible to create a negative firing frequency; the retina splits its information pathways to OFF and ON to encode both positive and negative derivatives. For the on-center and off-center areas of the receptive field, when both are stimulated with the same degree of light intensity, a bipolar cell shows no significant response to it, and the output of this cell to the upper layer is almost zero. A bipolar cell responds significantly to the stimulus only when the contrast between the stimuli in the two areas is greater. And the DOG model [
35] can simulate the physiological properties of this receptive field very well. Based on the two-dimensional DOG model, the output values of the cells in receptive field at position (
,
) are determined by a combination of excitation and inhibition input photoreceptor cells at (
,
). And the following simulation function is used to represent it:
where
denotes the parameter of the Gaussian function,
R is the output of cells in the receptive field,
x,
y are the relative positions of cells, and
is the output of photoreceptor cells in relative position
.
Since on-center parvo cells (On-P) and off-center parvo cells (Off-P) make up approximately 90% of GCs, we mainly model these two types of cells. The response function is as follows:
where
,
,
,
are the parameters of central and peripheral receptive field of On-P and Off-P.
The GCs then process the received information and perform selective output, which in physiology is the process of converting graded potentials into action potentials. GCs are also the first cells to emit action potentials during information processing. Only when the signal strength is greater than its own threshold potential value does the GC generate an action potential to transmit the information backward. According to the relationship between the resting potential, threshold potential, and peak action potential of the cell (the resting potential is approximately −70 mv, while the potential causing the opening of sodium channels is approximately −50 mv and the action potential peak is approximately +35 mv), we set the threshold value of the model to 0.2:
where
,
, and
are the maximum and minimum of the GC responses, and a hyperparameter related to the type of GC.
3.3. Modeling of Orientation Columns in the Primary Visual Cortex
When visual information is transmitted to the visual cortex via the LGN, a variety of cells in the primary visual cortex are activated to varying degrees to form an initial orientation representation of the object. According to biological discoveries, cortical cells are orientation selective and arranged in a specific structural manner. Cortical puncture experiments showed that when microelectrodes are inserted perpendicular to the surface of the visual cortex, the receptive fields of various cells are found to be mostly overlapping, and the preferred optimal orientation is similar. When microelectrodes are inserted in an approximately horizontal orientation to the surface, the orientation selectivity of the cells changes continuously.
Subsequently, the cortical ice block model [
36] was proposed to simulate two functional structures of the cortex, the ocular dominance column and the orientation column. The former indicates which eye is more likely to influence visual processing, while the latter detects orientation features. We use the orientation column as the main bionic and computational modeling object in this study.
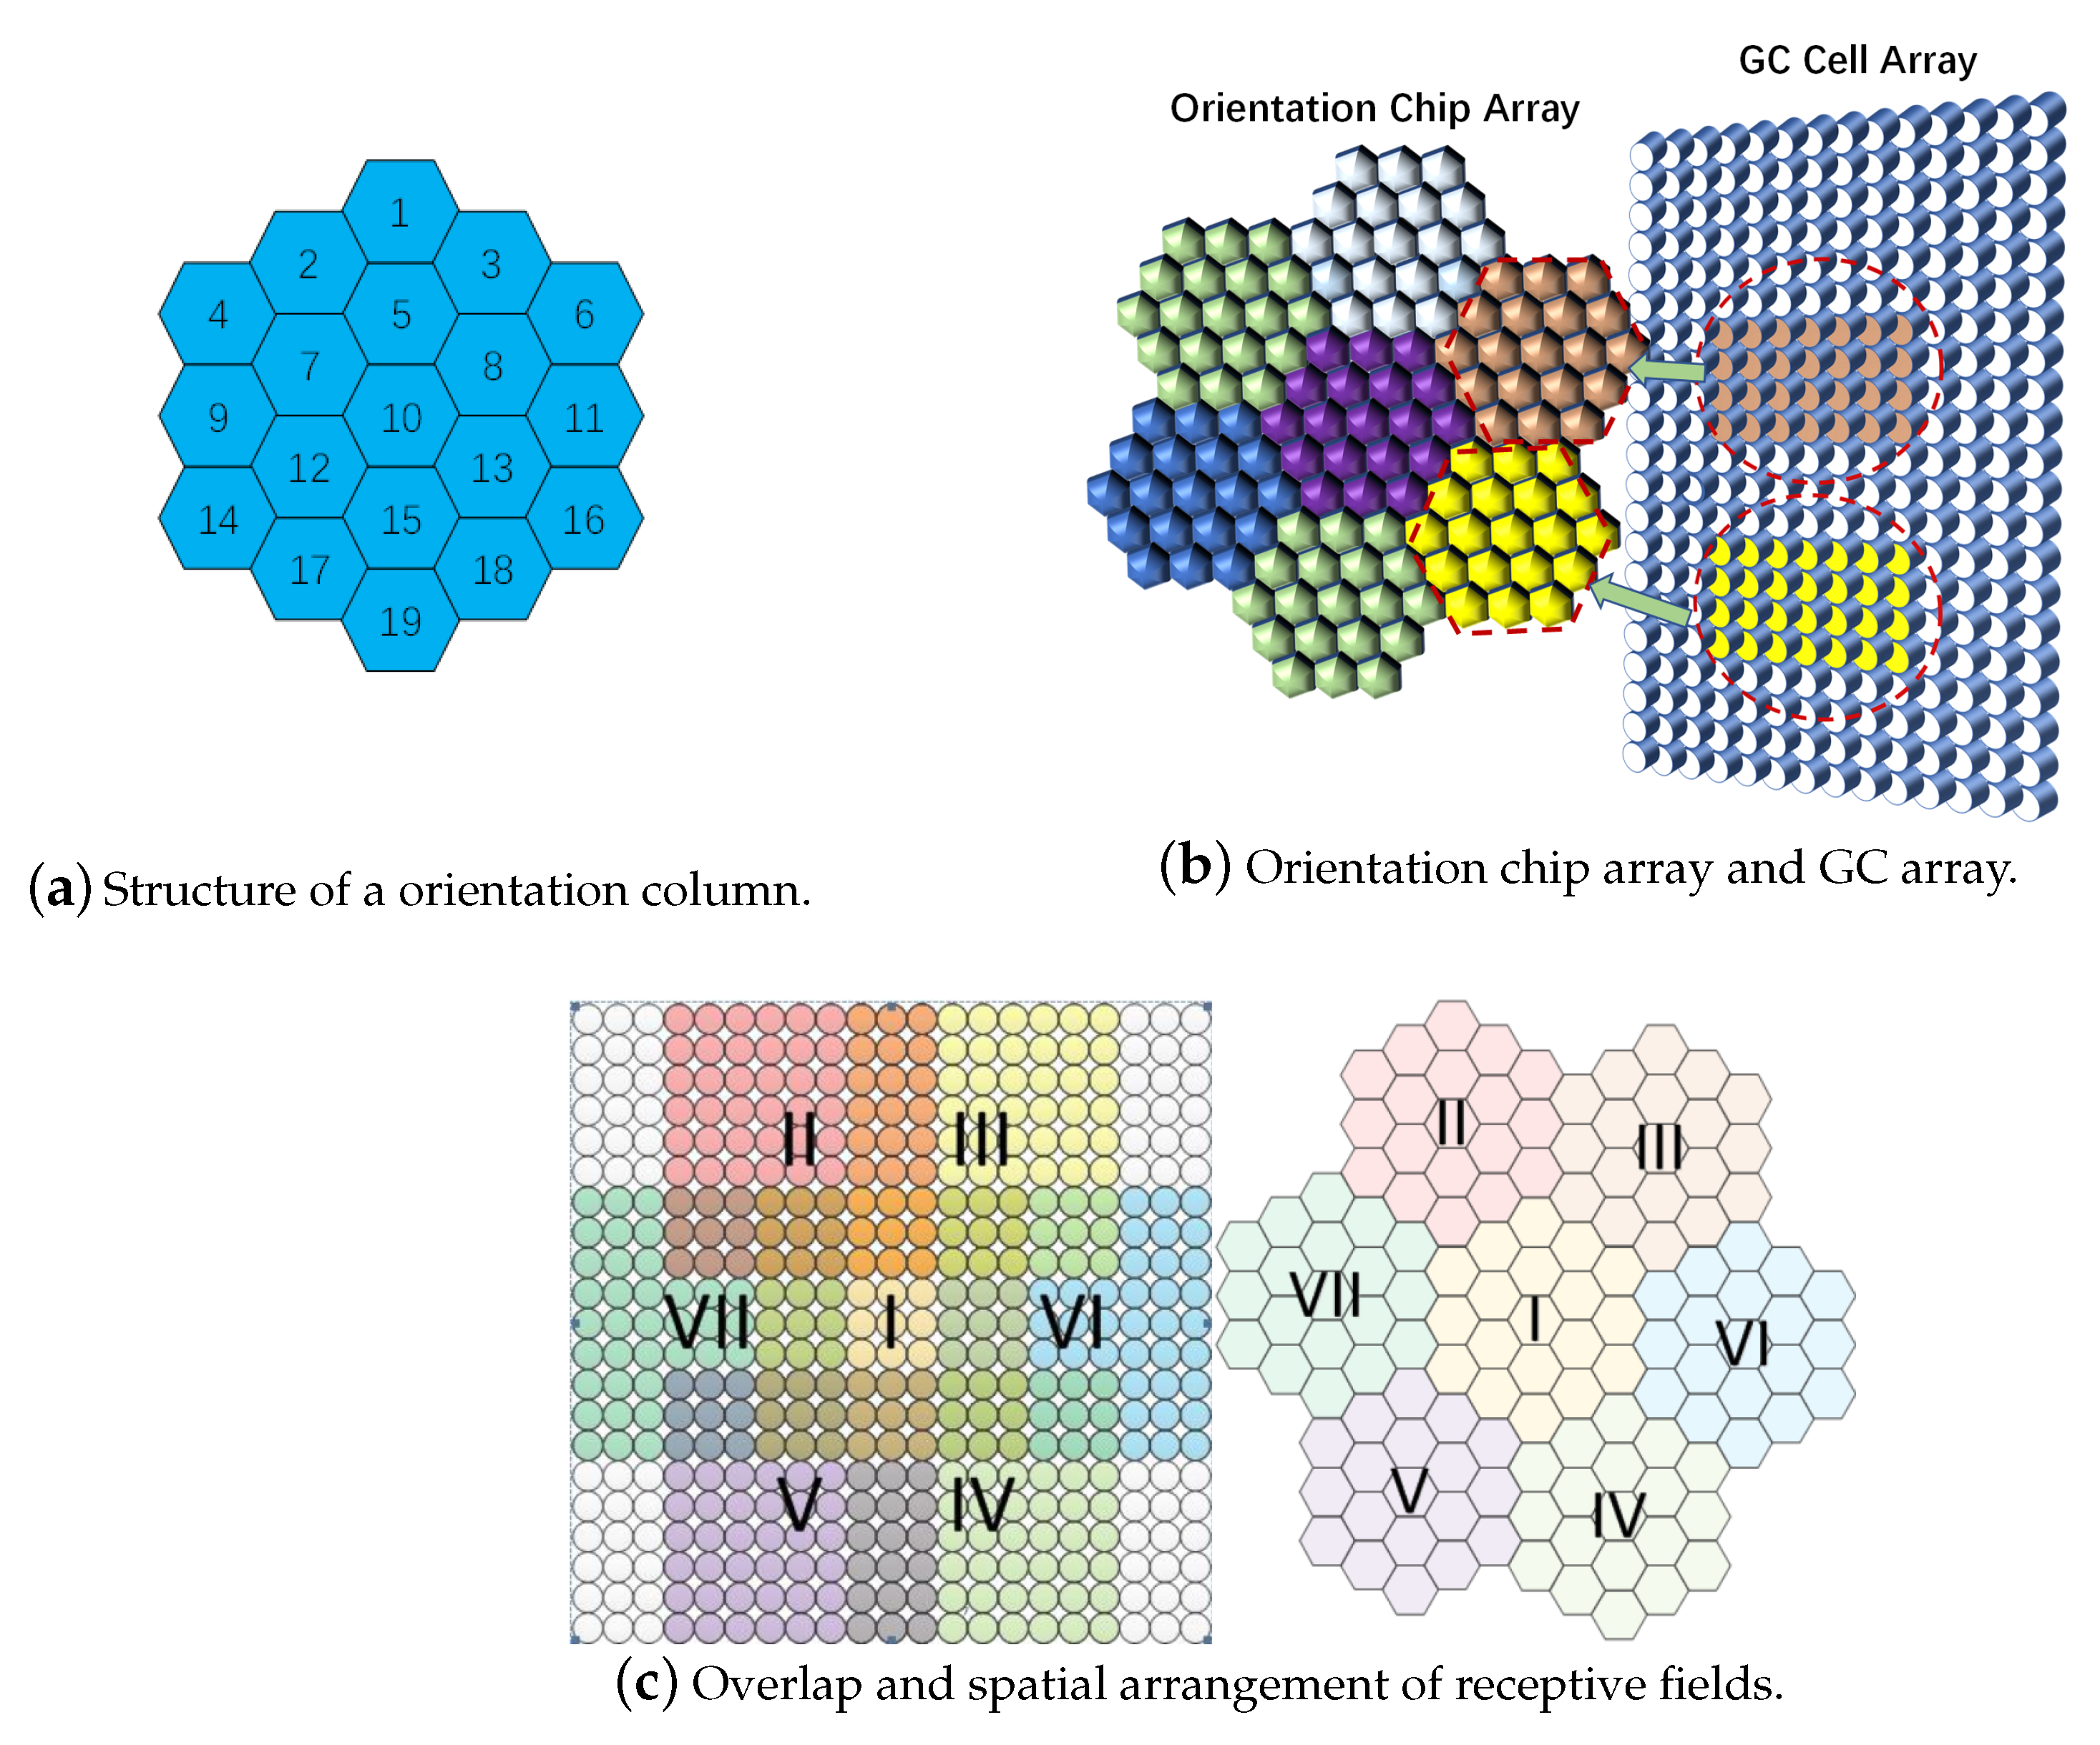
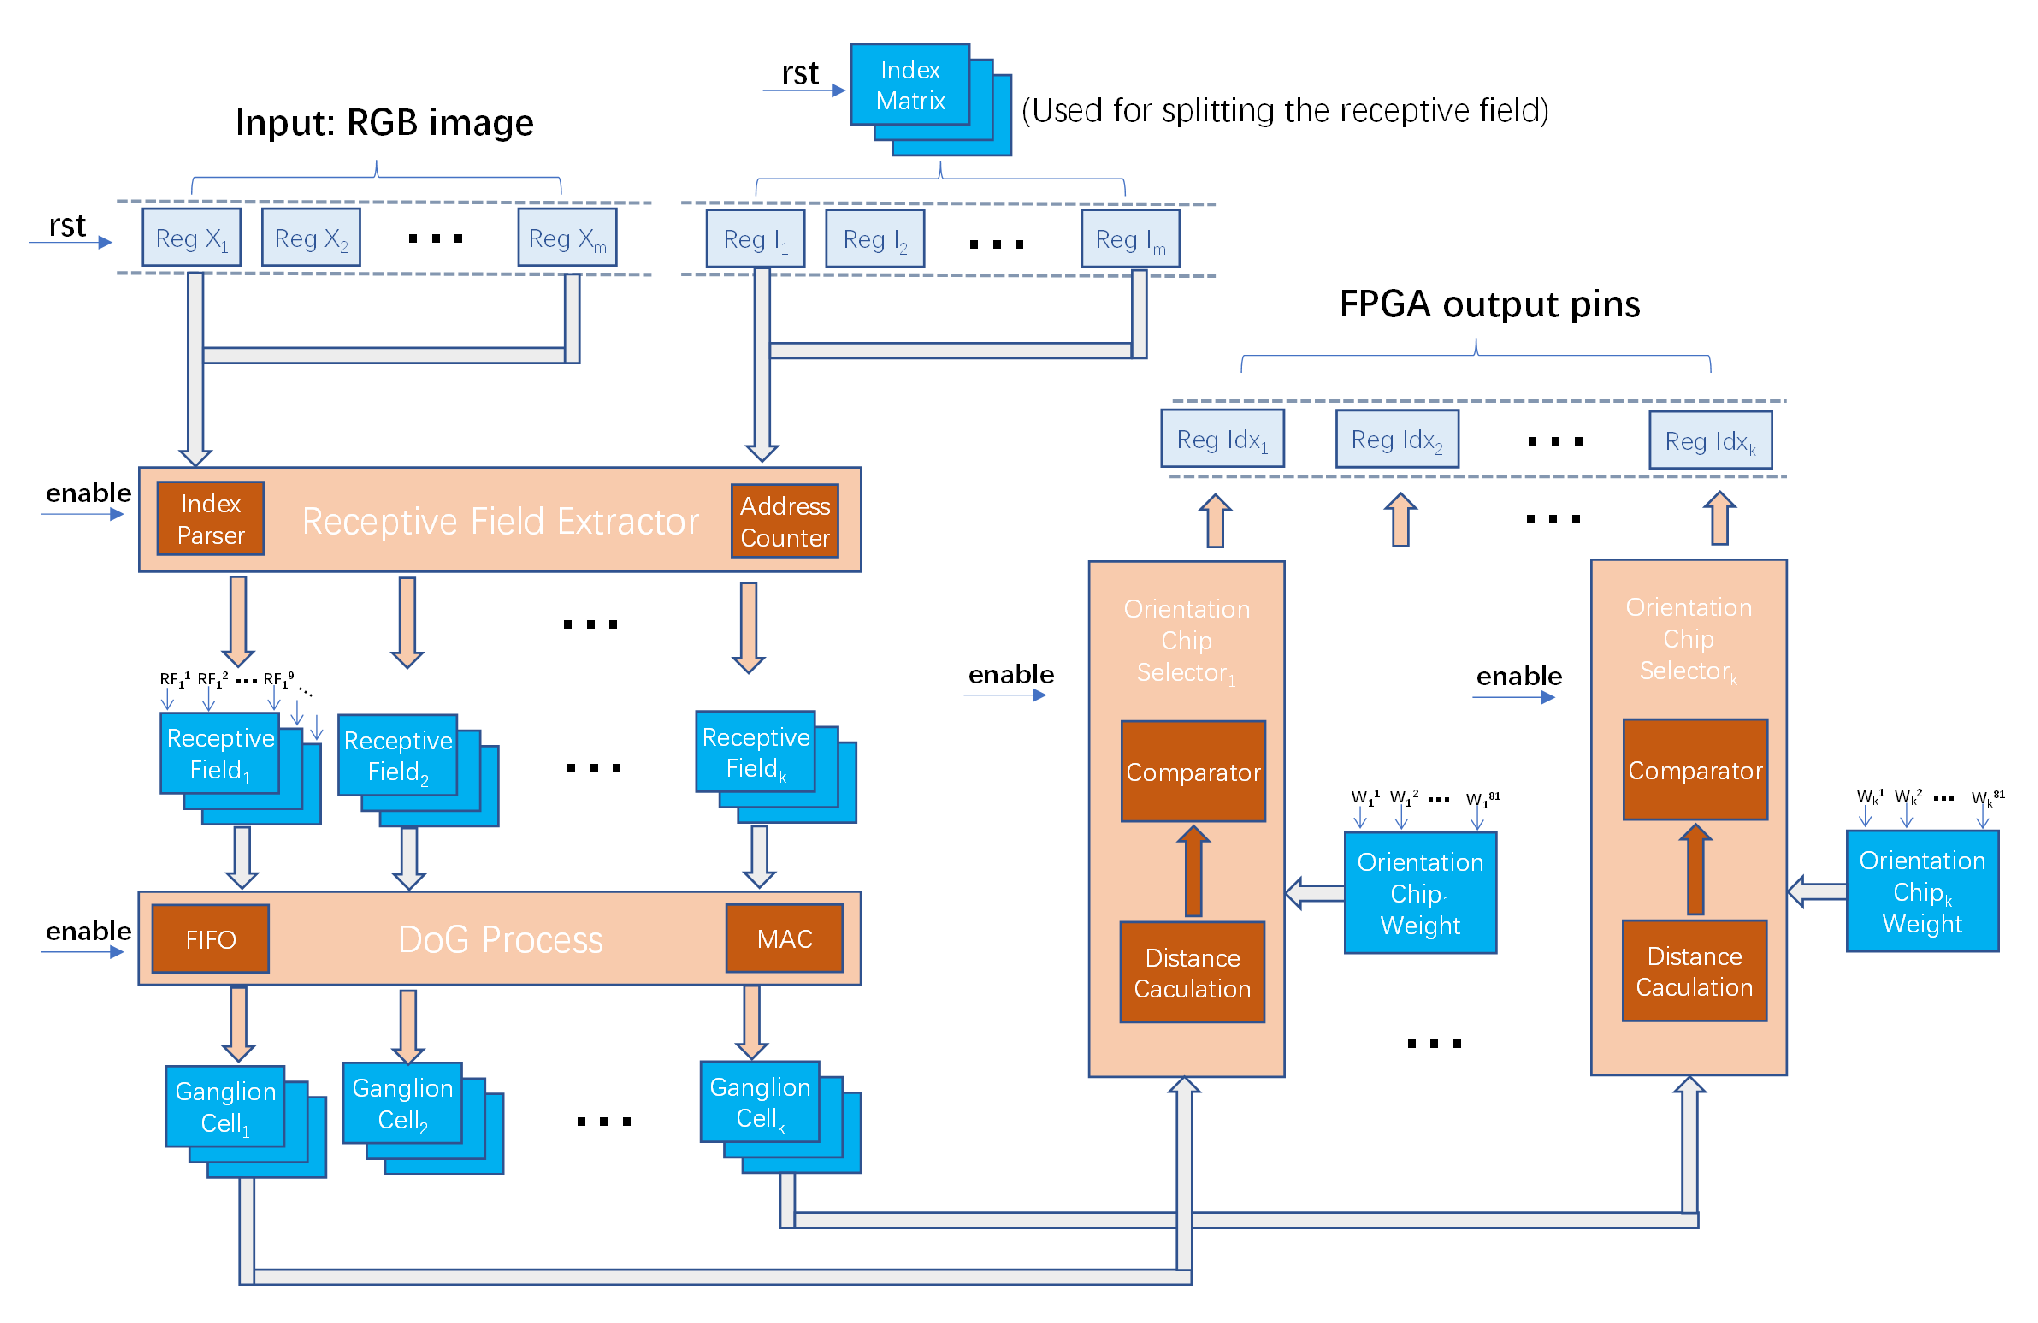
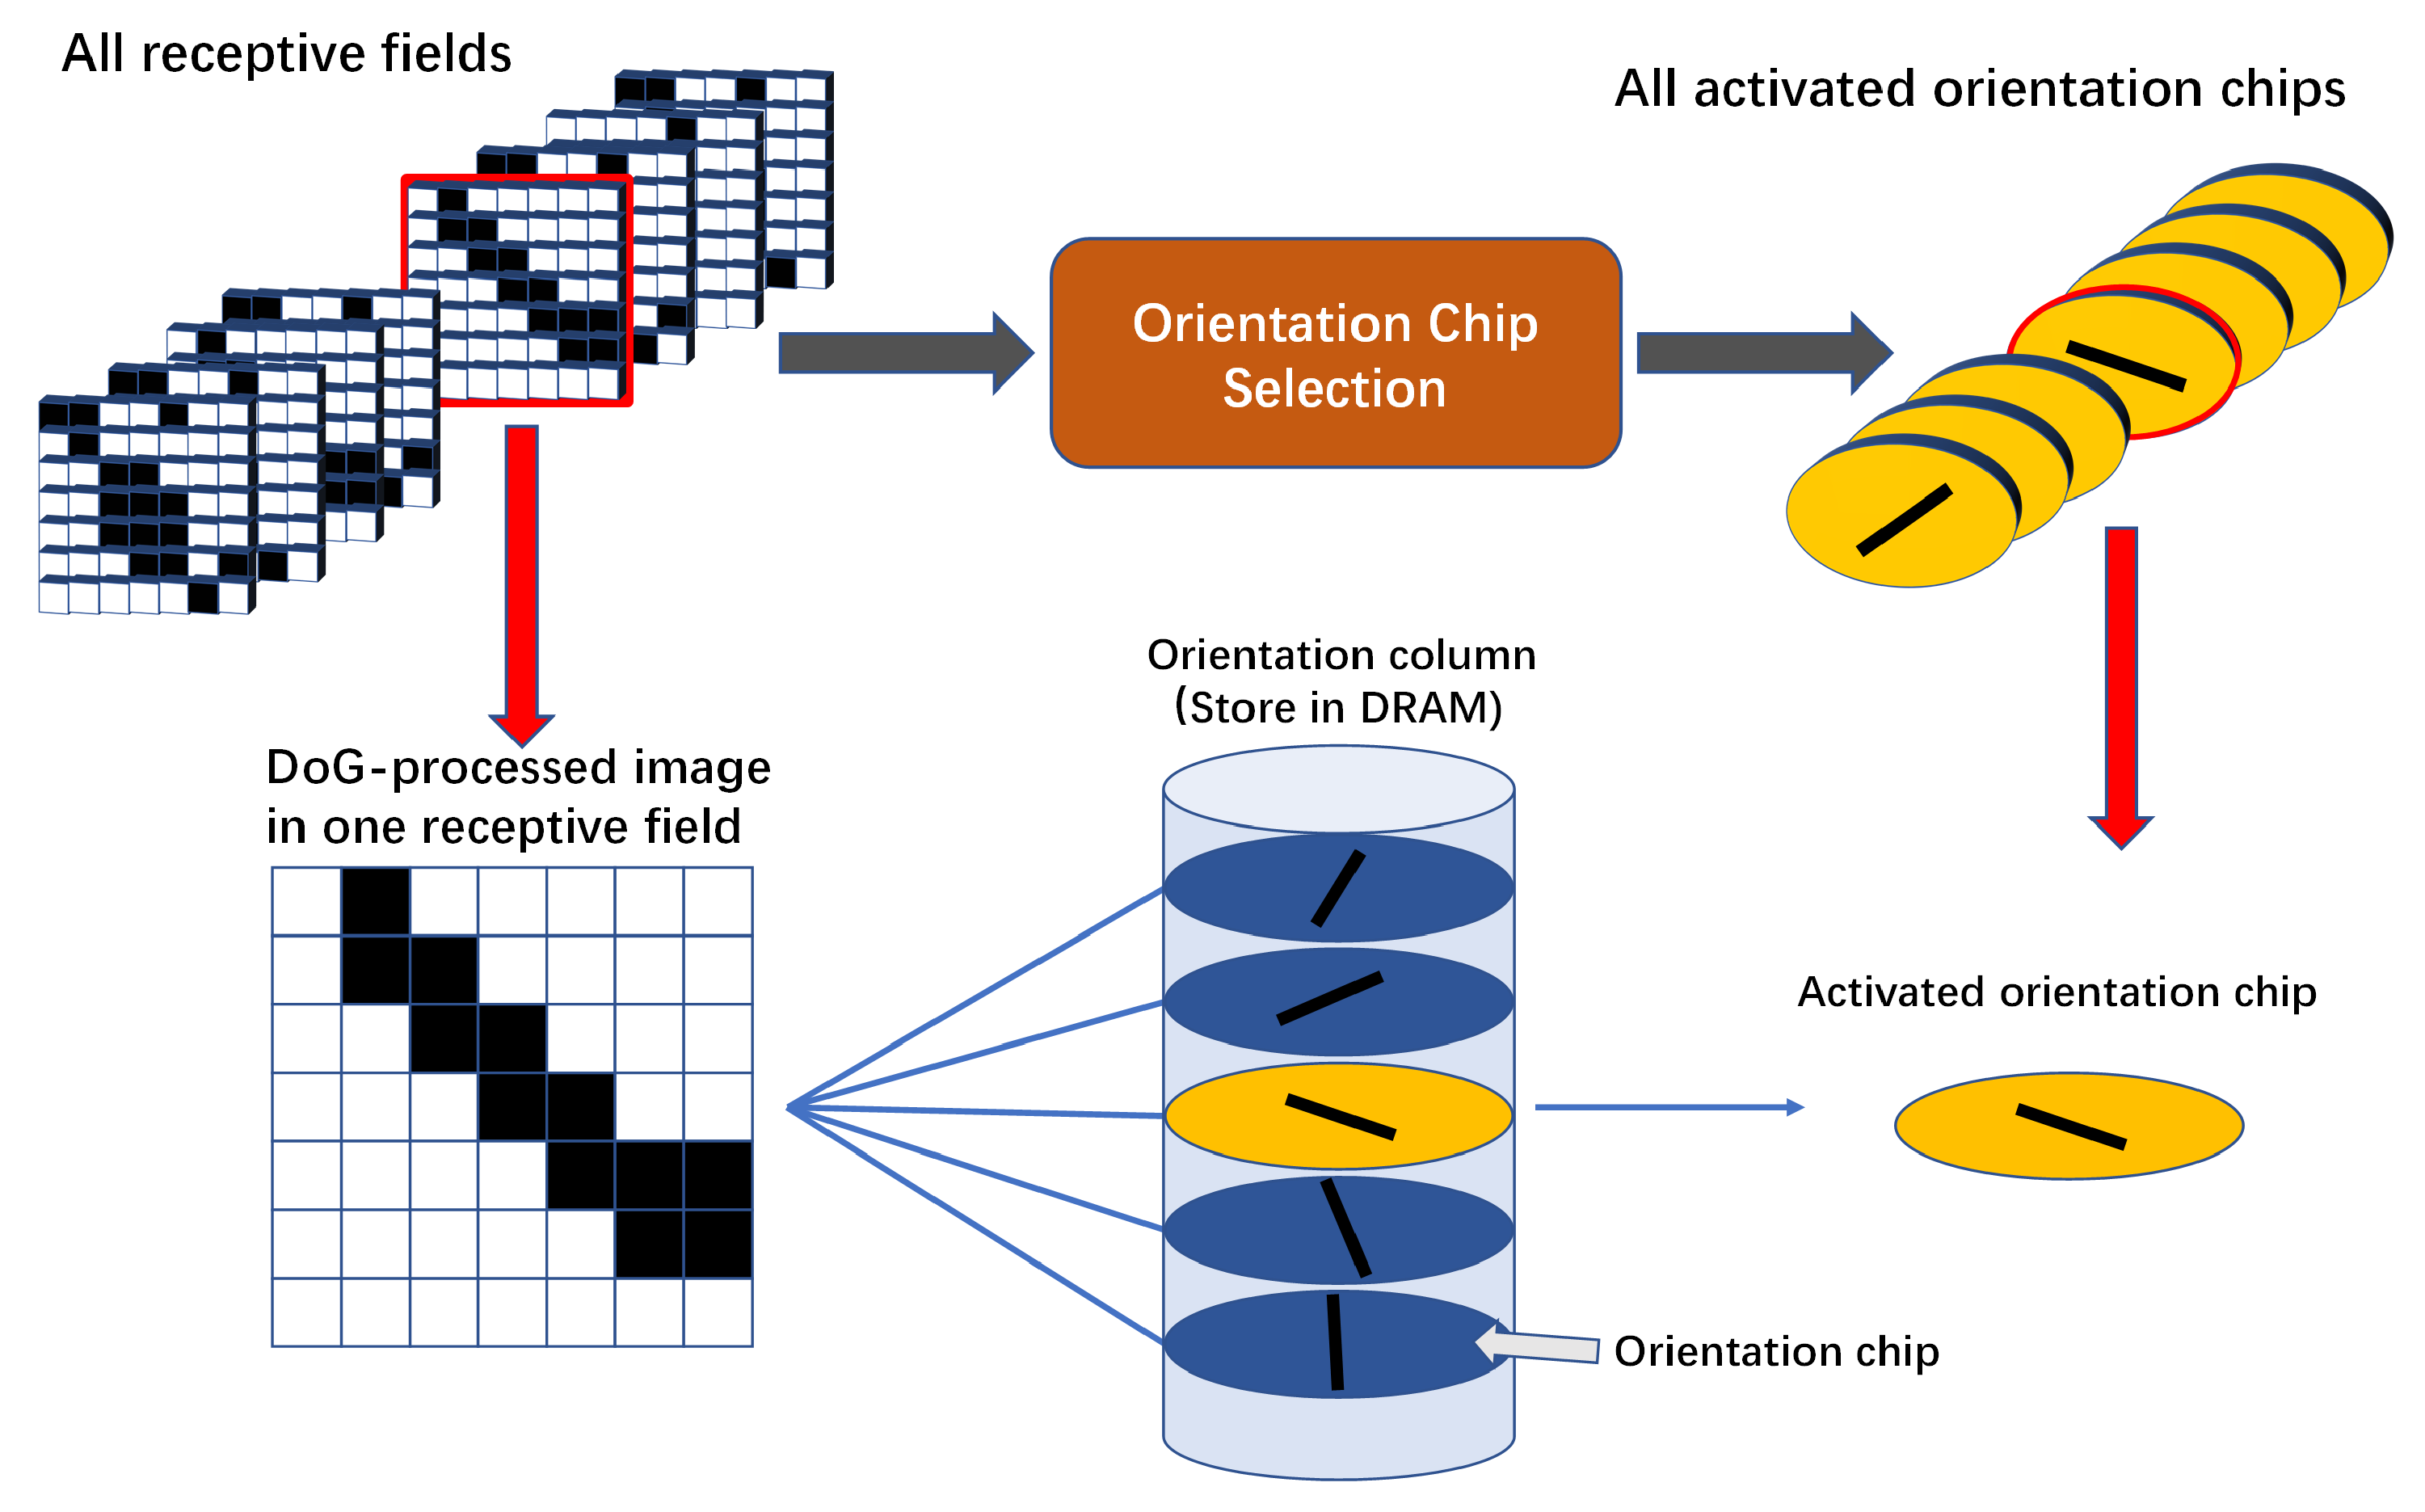
We establish an orientation column model to represent the concept of the functional column in the cortex, which is a functional module with orientation selection. It consists of orientation chips and receives processing information from GCs, and the logical structure of a orientation column is shown in
Figure 2a. Considering the scalability of the orientation chip and orientation column structure, we design the structure of the orientation chips in such an arrangement shown in
Figure 2b. The orientation chips represent different kinds of cells sharing the same receptive field under the same orientation column.
Figure 2b expresses the relationship between the GC array and orientation column array as well. The receptive field of the orientation column is composed of receptive fields of all cells in it as shown in
Figure 2c.
3.4. Training Orientation Columns by SOM
In biological neural networks, neurons have competitive relationships with each other, and such relationships are self-learned by neurons when they compete. There is a clustering effect between neurons.
Often, neurons cluster together to accomplish similar functions, such as functional columns, and changes in neurons simultaneously affect surrounding neurons to varying degrees and produce a lateral inhibitory effect, i.e., they will send activation signals to neurons that are relatively close and inhibition signals to neurons that are relatively far away.
The self-organizing map (SOM) [
37], an artificial neural network for multidimensional classification, is an unsupervised learning network that mimics the structural relationships between neurons better than other neural networks. It can both classify the input data effectively and express the topology of the upper layer neural units, and it can represent the competitive yet cooperative relationship between cortical neurons well. In SOM training, when the winning neural node wins, it causes the neural nodes near its topology to receive some of the learning gain, which is extremely consistent with neurobiology.
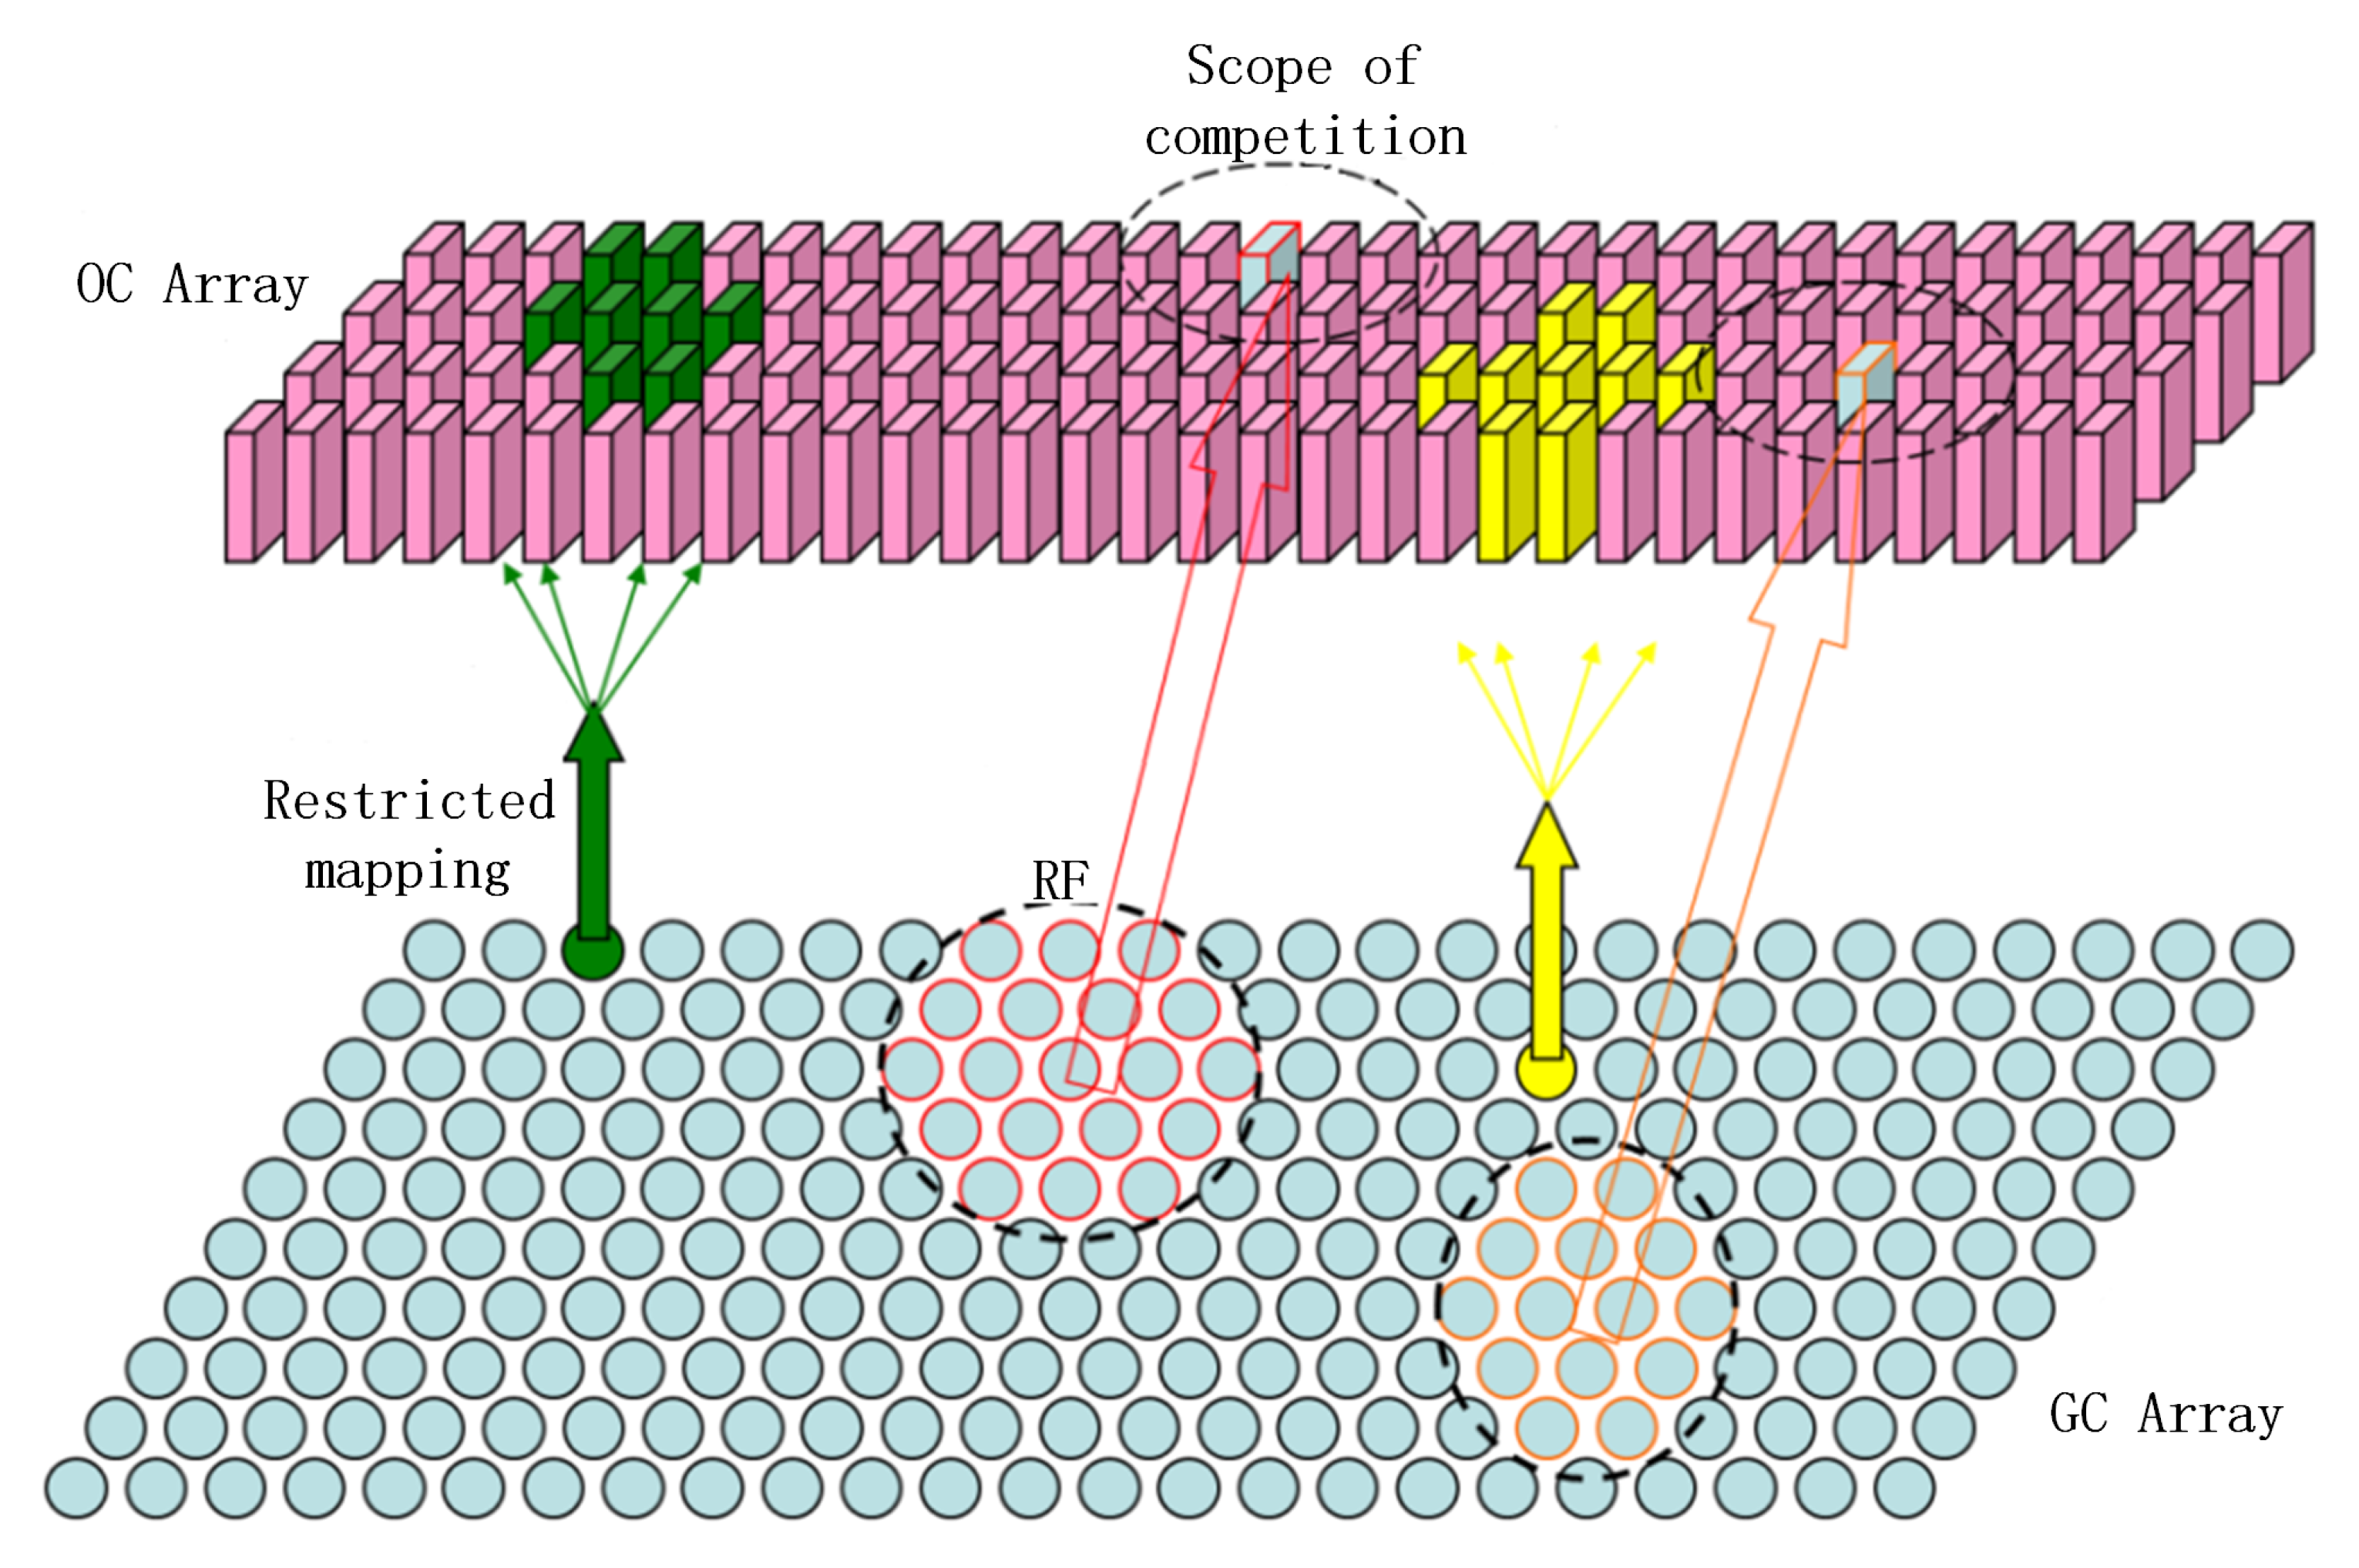
Unlike traditional self-competitive networks, our self-competitive model is not fully connected to the lower layer inputs but instead has limited connections. The upper layer neurons compete and learn from the output of lower layer GCs within the same receptive field in terms of orientation columns as shown in
Figure 3.
3.5. Feasibility Verification Experiment
In order to verify the feasibility of the above hierarchical network computational model, we conduct several image-processing experiments on the model.
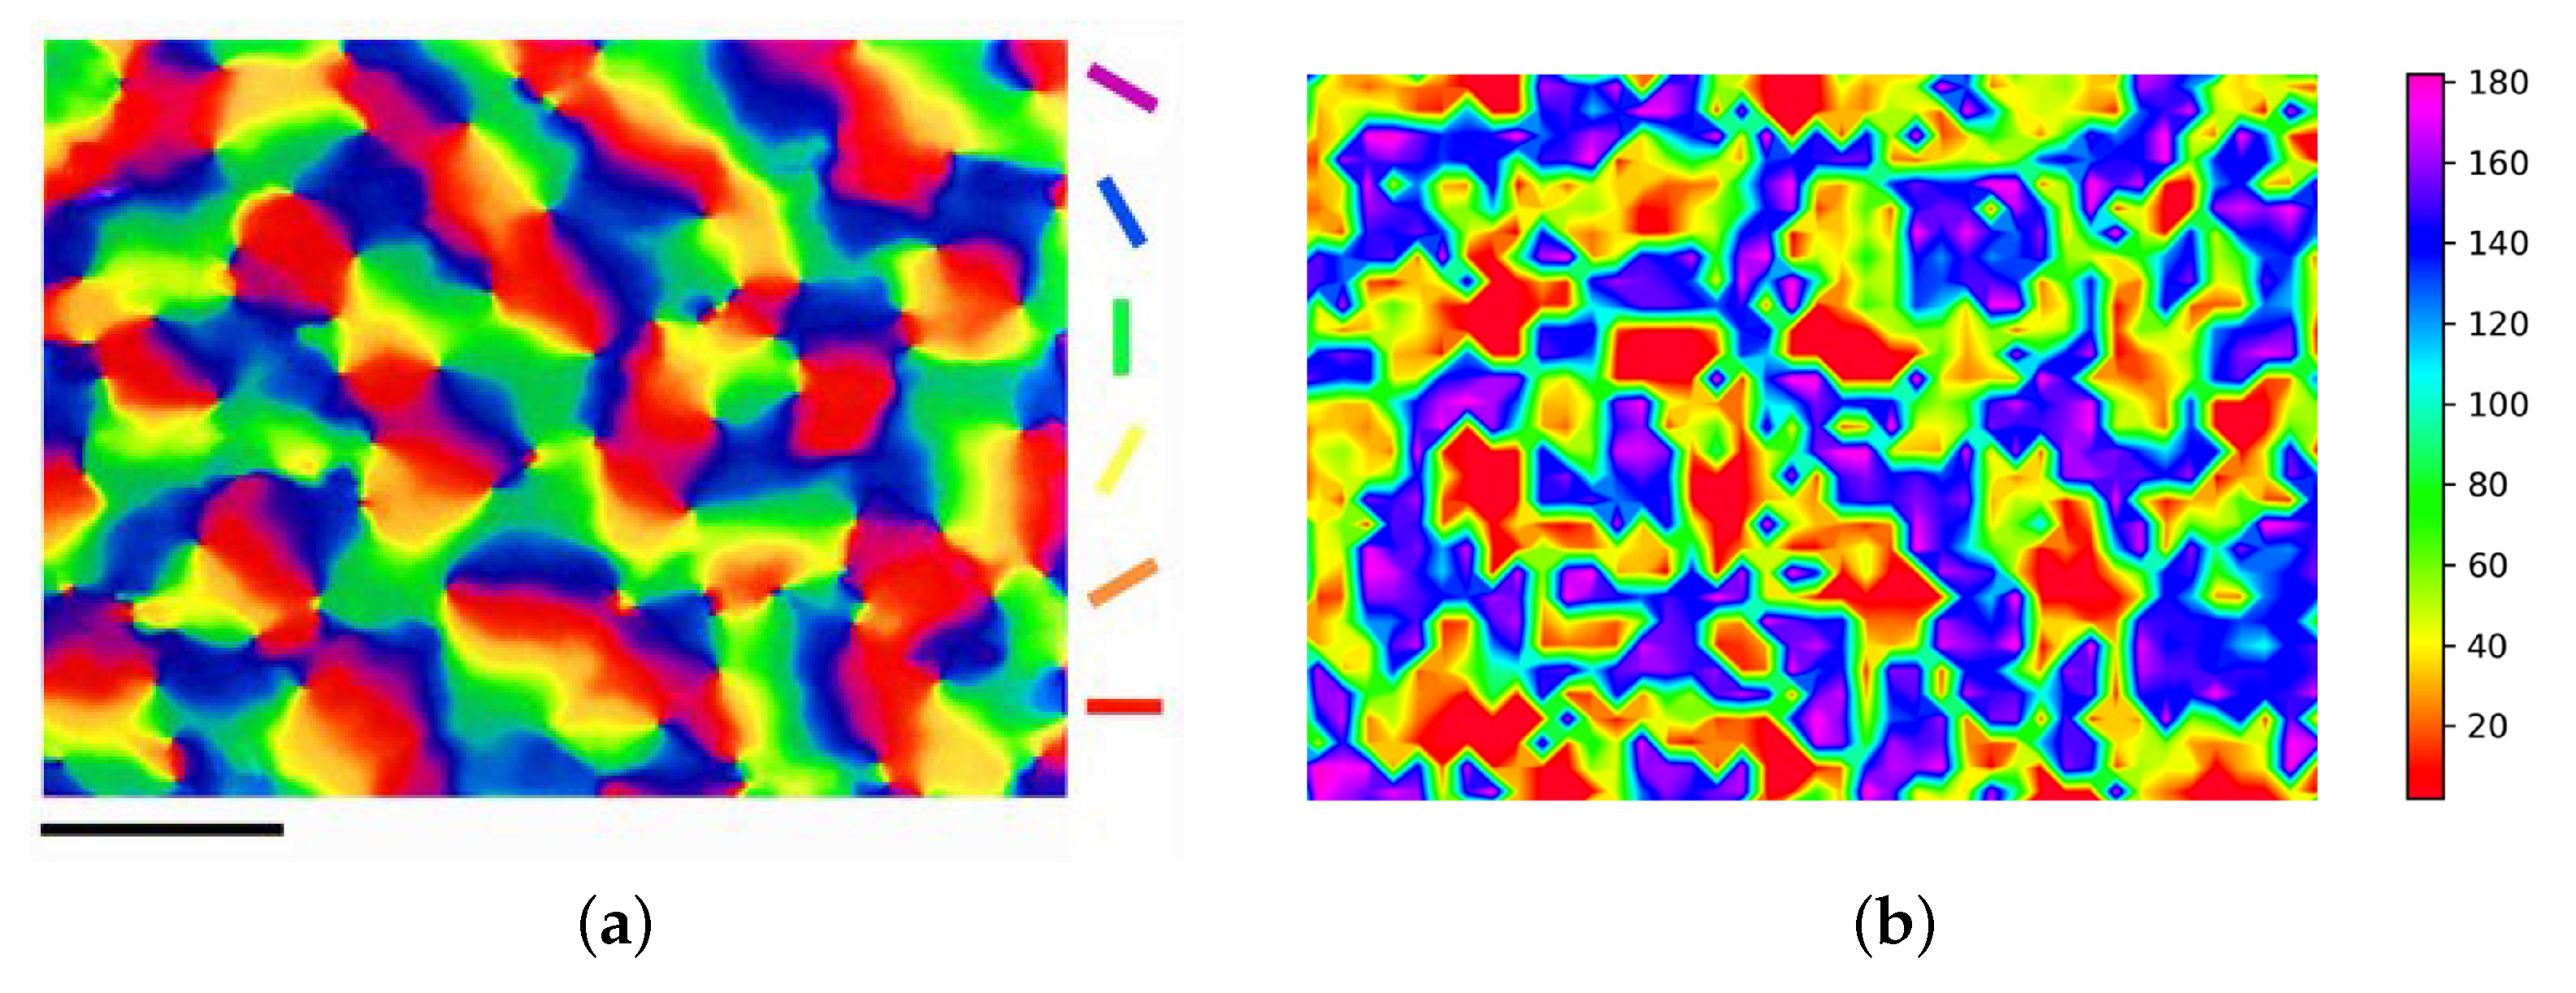
Figure 4a shows the map of cortical functional features. The cortical pinwheel is a unique phenomenon in the cortical orientation map in which singularities, i.e., orderly and uniform increases in orientation selectivity, are produced, which is more likely to occur at the adjacent boundaries of multiple orientation columns. The appearance of cortical pinwheels verifies the validity of the model developed. Training by our theoretical model leads to the results shown in
Figure 4b. Our results have a high similarity to the orientation map of biological staining with voltage-sensitive dyes. To some extent, this generated cortical orientation map already has some of the functions of a real cortical column. Putting this to good use might be an aid in repairing visual impairment.
In the orientation chip layer, each orientation chip activated by the orientation column is identified, and a roughly characterized pattern of the object is derived. As shown in
Figure 5, in this representation mode, the representation results of the same or similar objects are approximately the same.
Figure 5a is formed by object rotated by a certain angle, and its representation results are also rotated by a certain angle, which can be seen to have rotation invariance. However, the representation results are very different among different objects and present different distributions on the orientation feature space as shown in
Figure 5b.
5. Results
We program for the model by using Verilog Hardware Description Language (HDL) and simulate it by Vivado and Modelsim. The input of the image is an 8-bit grayscale image of 123 ∗ 183. It is a snapshot of the input image and belongs to the receptive field layer. Eventually, we can obtain the sequence numbers of the activated orientation chips from output.
5.1. Simulation for Model
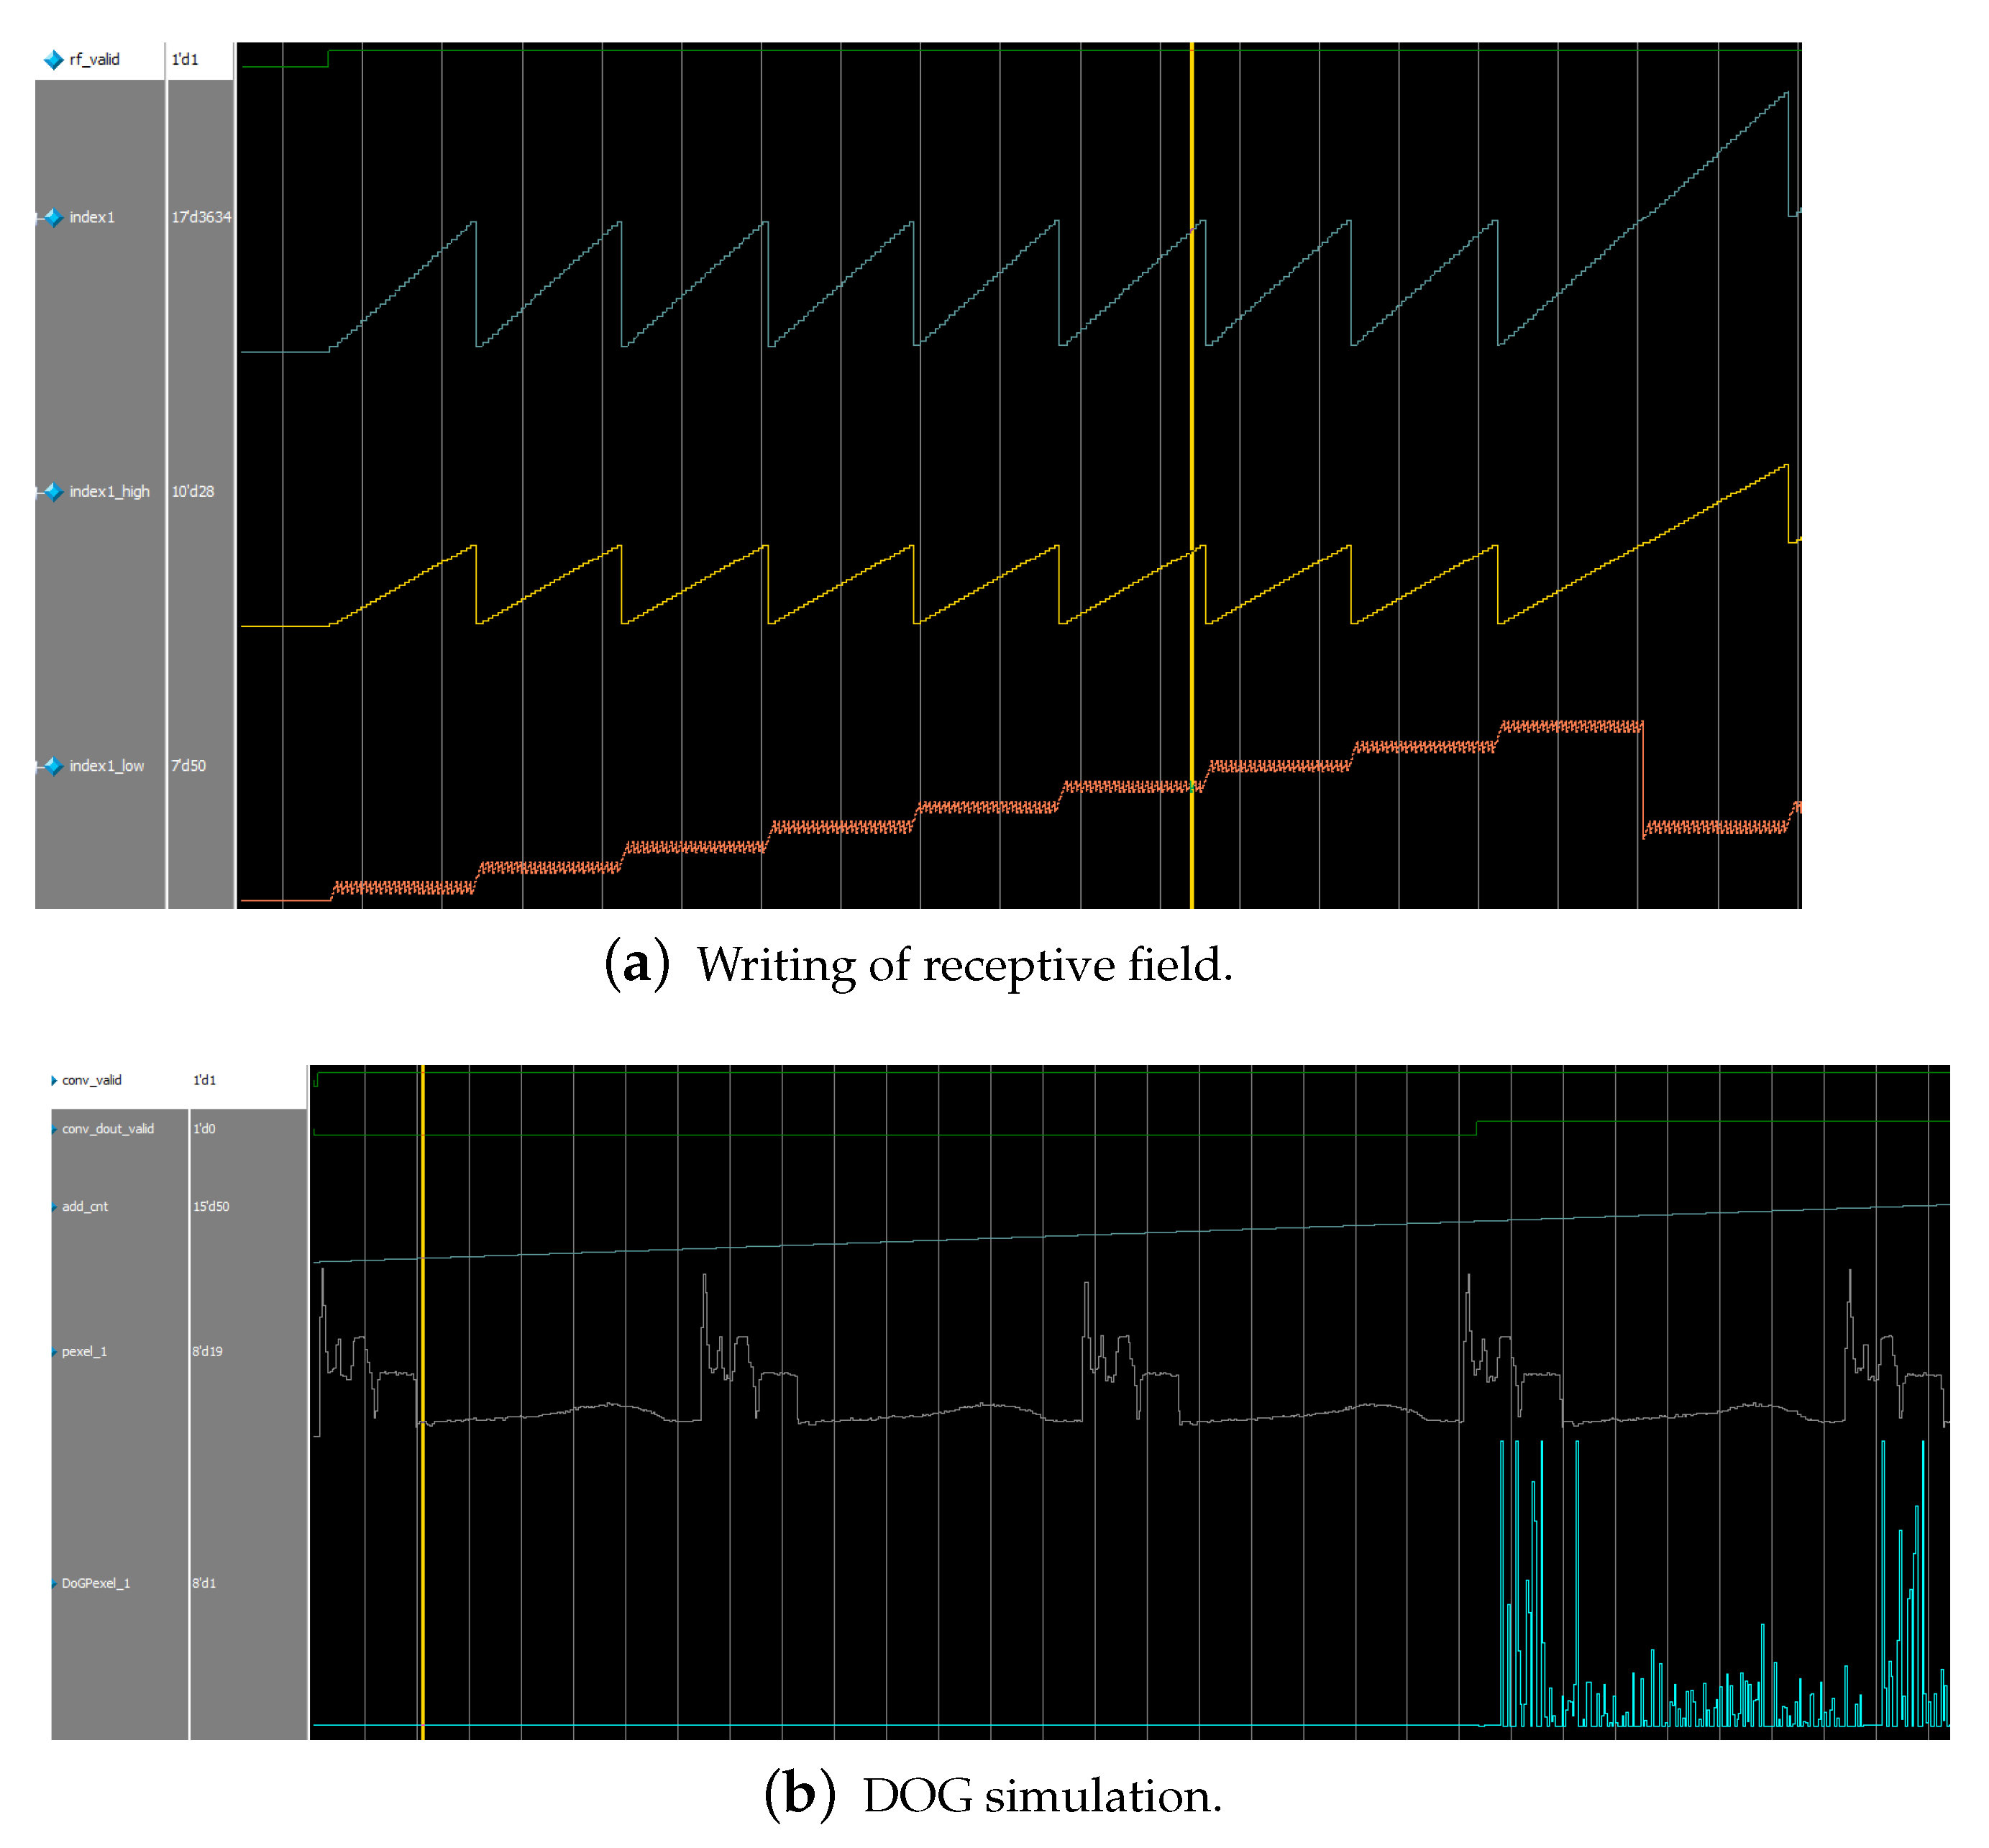
As shown in
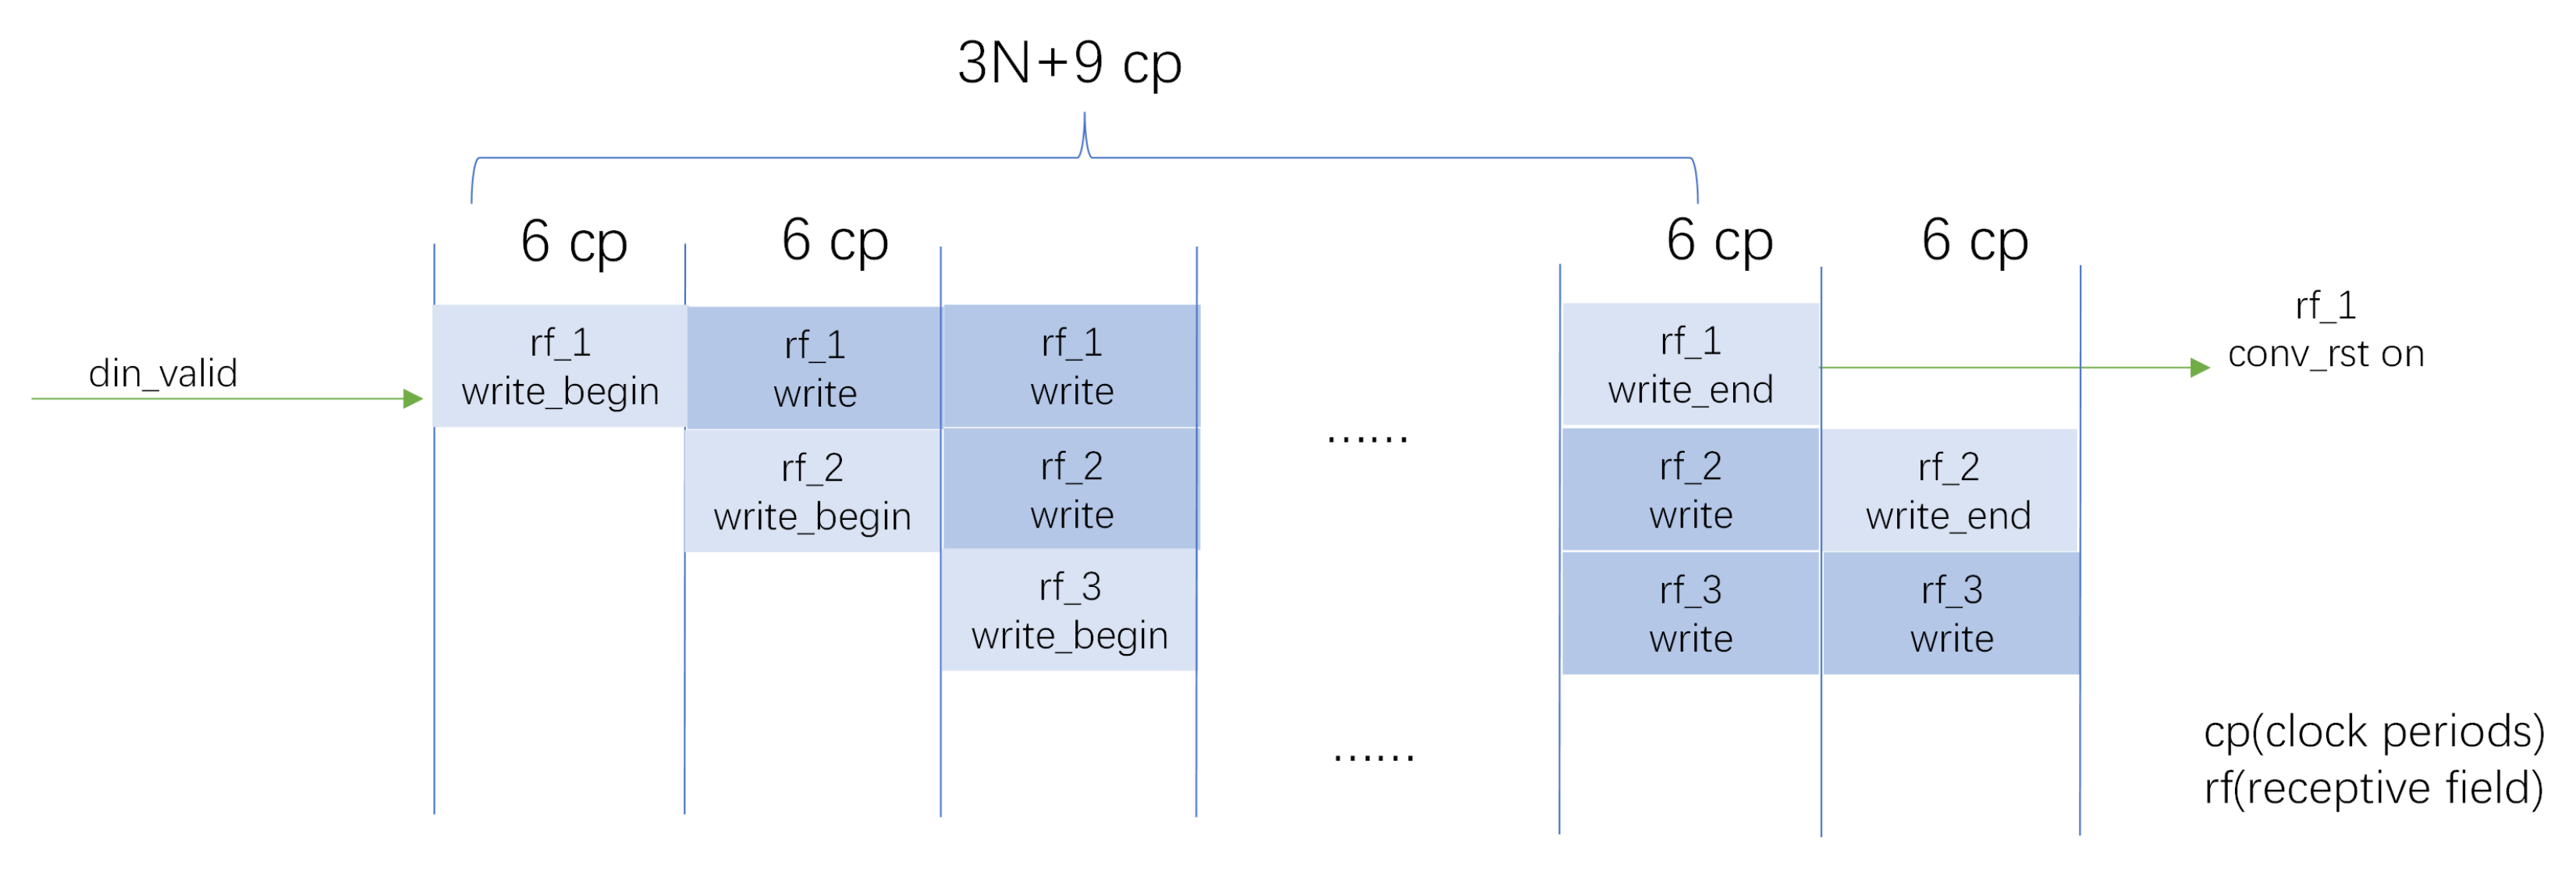
Figure 12a, with the change of the receptive field write signal (rf_valid), the read of the index block random access memory (BRAM) is performed, and each clock reads the four indexes corresponding to the current pixel at the same time.
Only the first index corresponding to each pixel is shown, indicated by the blue line (index1). By the time the maximum jump is generated, the writing process of a receptive field is completed. The image to be processed is read simultaneously with the index counter, and the pixel values are obtained and written to the receptive field DRAM array.
When it comes to the DOG processing stage, with the validity of the conv_valid signal, the read and convolution operations are performed on a certain receptive field with the self-increasing address signal as shown in
Figure 12b. With the change of the conv_dout_valid signal, the intermediate result of the processing (DoG pixel) is transferred to the storage of the GC DRAM array.
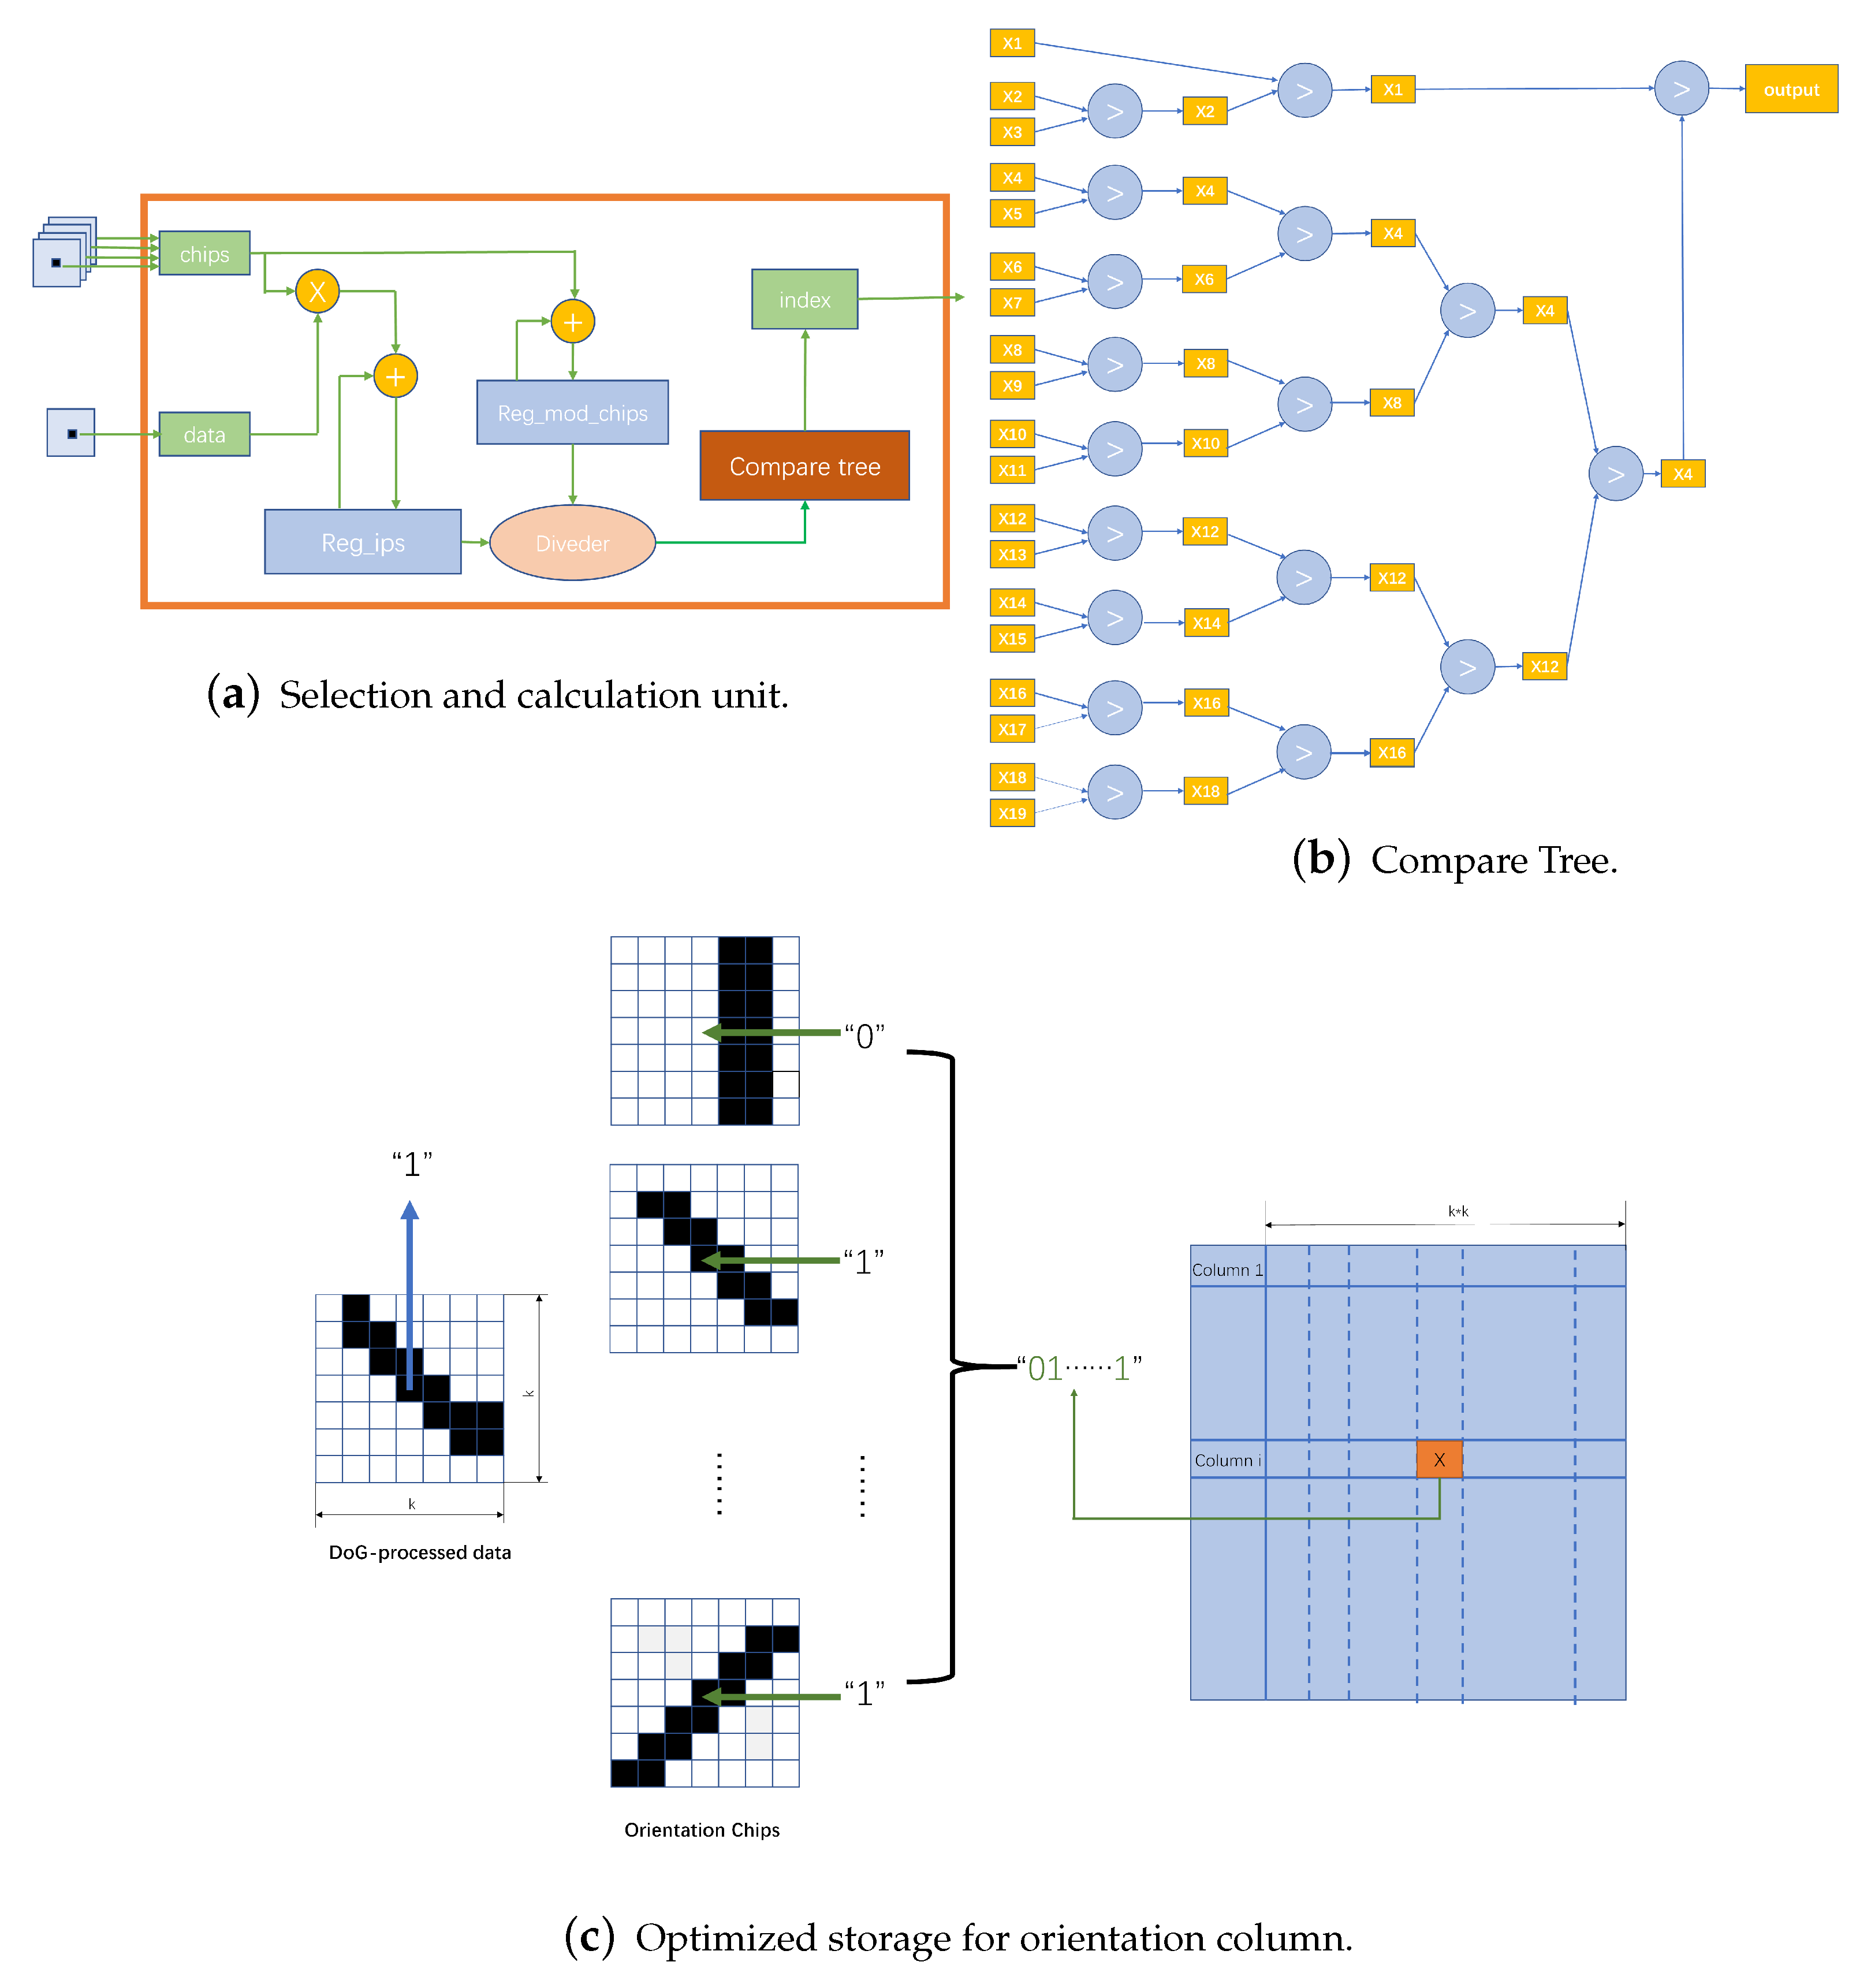
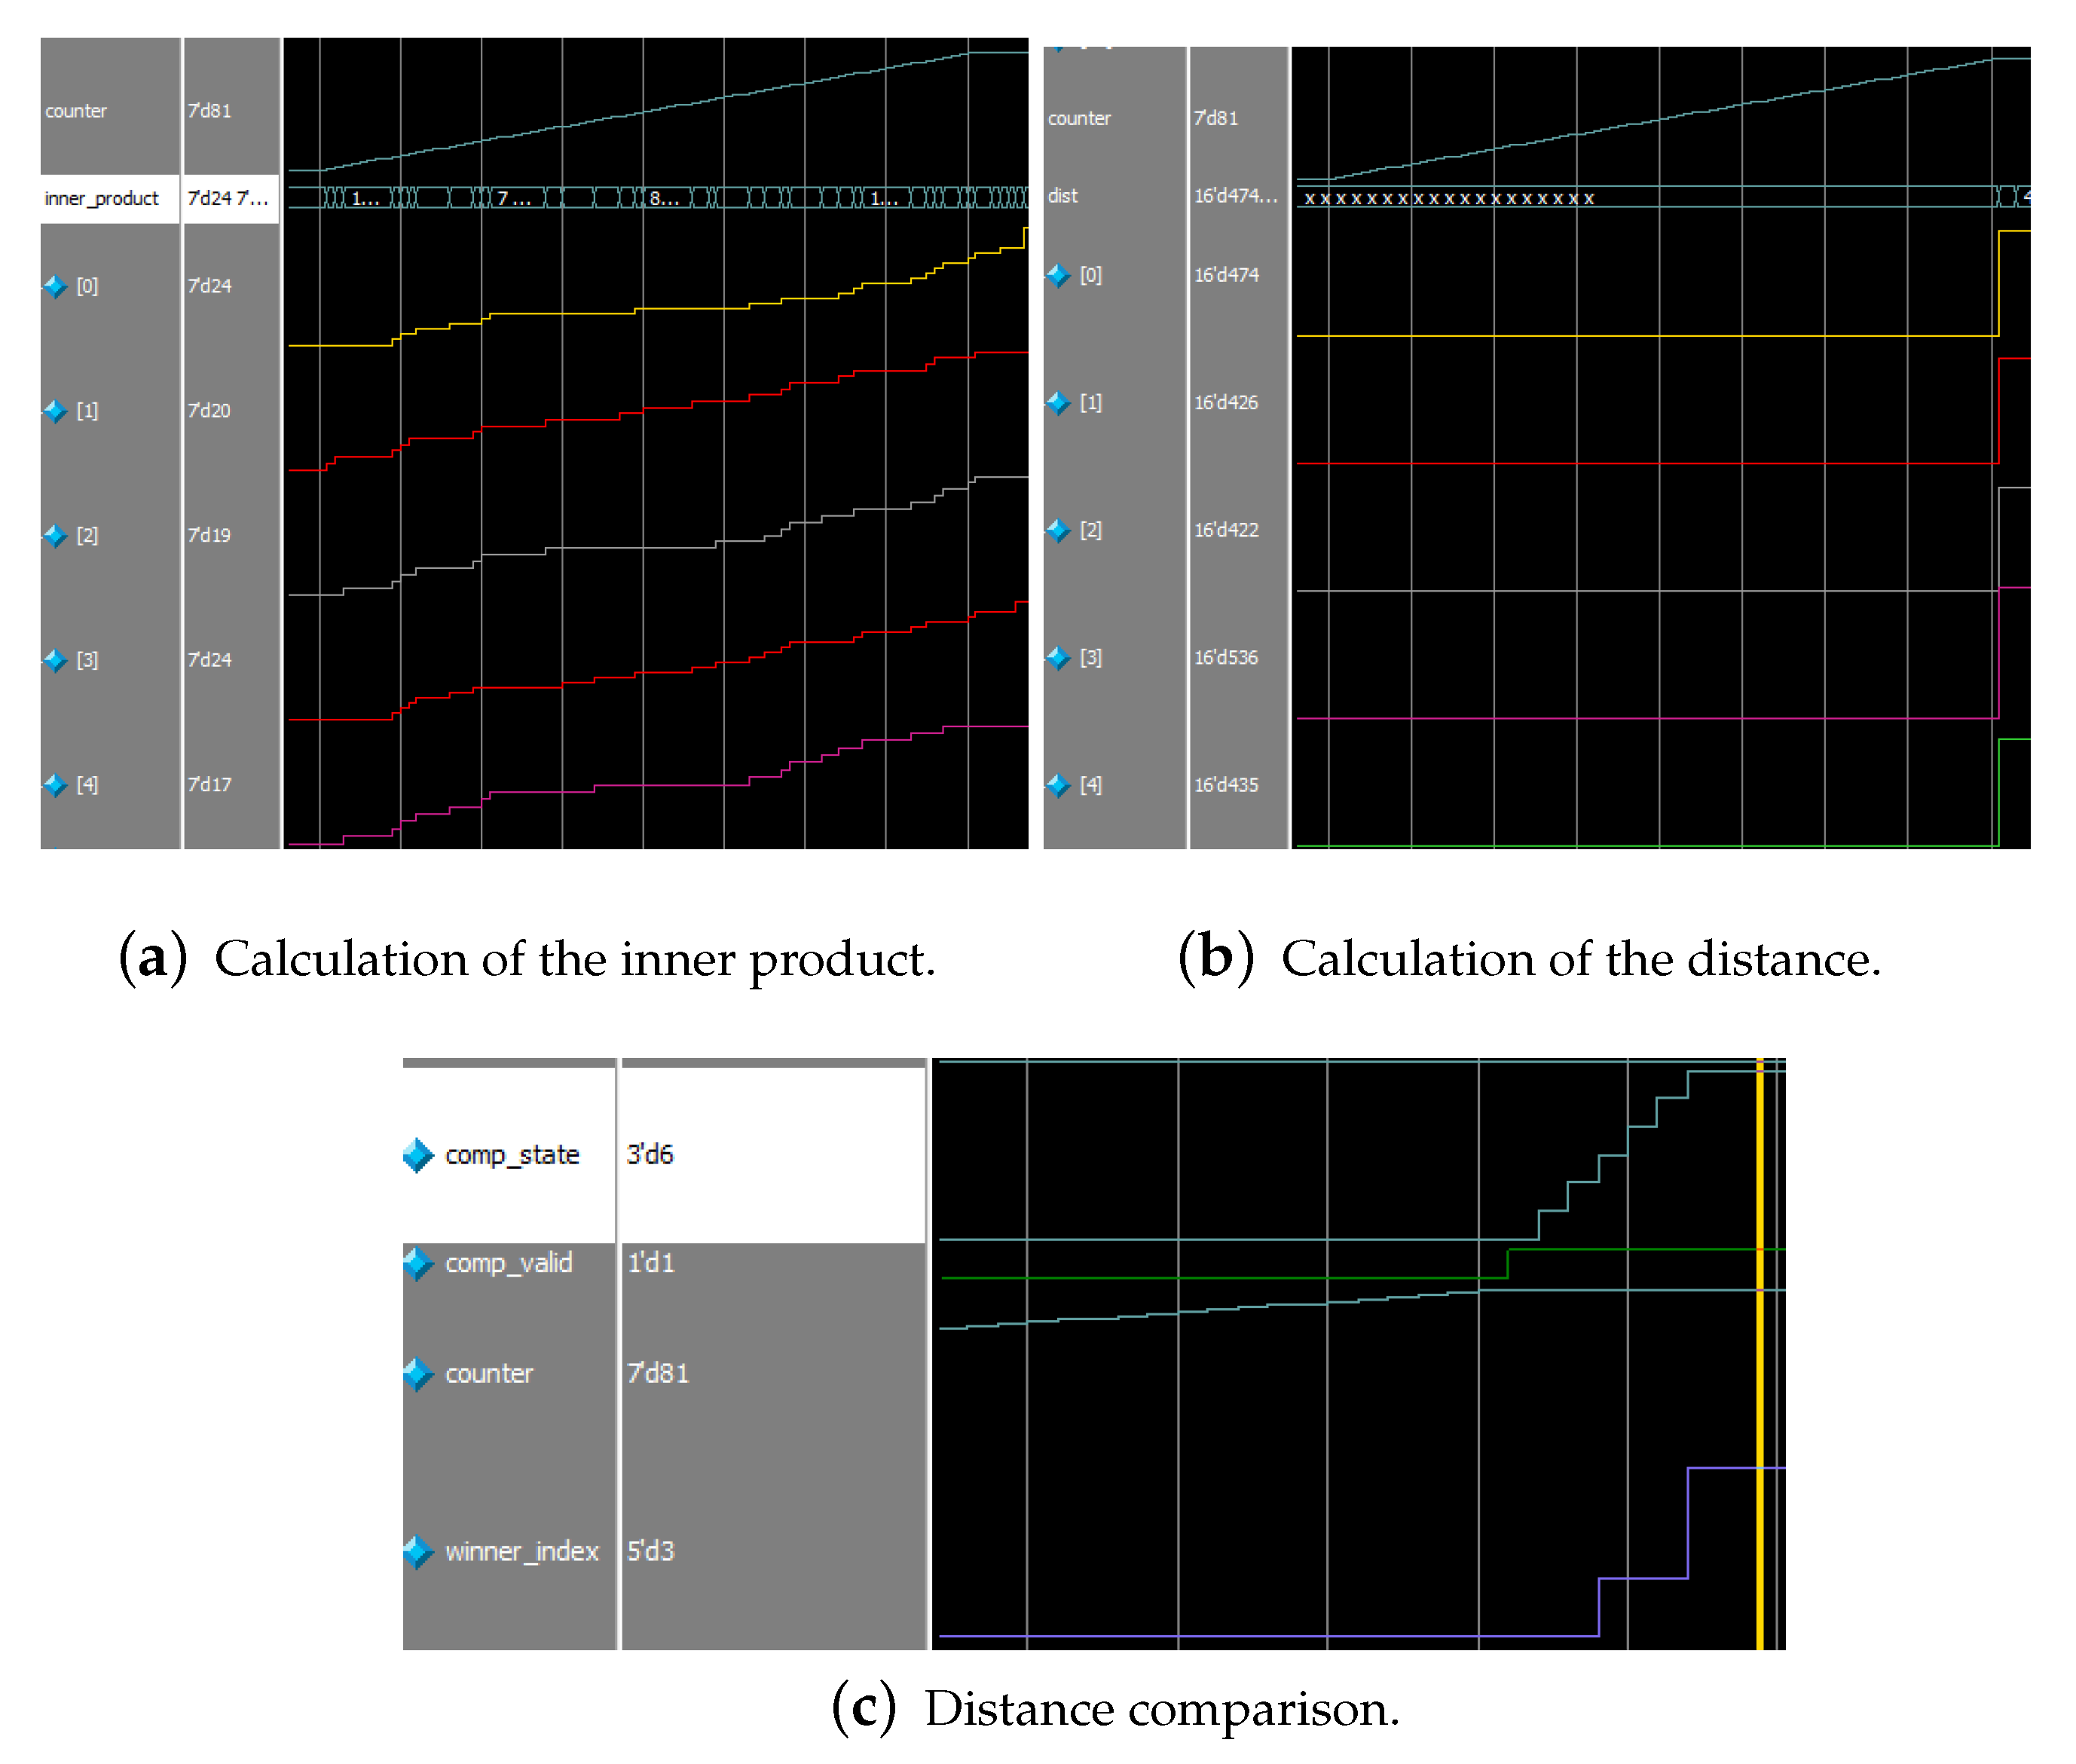
Finally, the simulation will enter the orientation chip selection phase, where the trained weights are expanded in bitwise form for distance calculation and comparison with the intermediate calculation results. The orientation chip selection module performs the computation after the select_valid signal is valid.
Figure 13a,b show the parallel computation of products of a set of orientation chips, with the distance computation performed after 81 (the number of GC cells in one receptive field) cycles.
Figure 13c illustrates that the distance comparison is performed for five clock cycles when the cmp_valid signal is valid, and the optimal orientation chip sequence number is output after completion. We mark the activated indexes in the orientation column map, thereby generating the result of the orientation column representation of the object.
5.2. Resource Consumption
Having shown that the visual information is correctly processed by our FPGA visual pathway model, let us look at its resource usage. With the analysis tool provided by Vivado, we can identify the resources used by the designed computational module as shown in
Table 1. In our visual pathway model, information within a single receptive field is the basic unit of visual processing. Here, we show the resources needed for a single receptive field. BRAM resources are mainly used for image storage and index matrix storage, whereas DRAM is used for the receptive field most, which occupies look-up table (LUT) and flip-flop (FF) resources. Due to the conversion to binary image processing while facilitating bitwise operations, the on-chip digital signal processor (DSP) is mainly used in the distance comparison of the division calculation process and MAC of the DOG process. However, since the pixel overlap makes the DOG double computed, the resource utilization of the global-based DOG will be much lower than that of the receptive field-based DOG. This means that the selector block takes up the majority of the DSP. Depending on the resources required for a single receptive field during the whole process, we can determine the parallelism of the model based on the amount of resources.
5.3. Parallelism Exploration
The resource utilization of a single receptive field is given above, and the overall parallelism of the system will be constrained by the onchip resources. In terms of receptive fields, we define RFL as the delay time required from the formation of a single receptive field to the generation of activation indexes of orientation columns. Whereas the delay in generating the receptive field DRAM array comes mainly from the image signal input, segmenting and writing the receptive field is performed in real time. We simulate and synthesize based on receptive fields in parallel and 400 receptive fields in parallel with the xc7k325t chip, respectively. Our results are shown in
Table 2. In the case of meeting the timing requirements, our system can run at 235.8 Mhz in the former case, while the latter can run at 222.5 Mhz. It can be found that the maximum frequency is less affected by the parallelism in our design.
Table 2 shows that as the parallelism increases, the number of DSPs becomes the bottleneck first, followed by the number of LUTs bottleneck. Since DSPs are mainly used on the division of the parallel division of orientation chips, for chips with fewer computational resources, it may be necessary to reduce the division accuracy and extend the division cycle, which will add several cycles of latency.
We then take chip xc7k480t, which own more resources, to accomplish 600 receptive fields in parallel. This is a degree of parallelism that allows the parallel processing of all the receptive fields of the test images (123 × 183). Base on this parallelism, we can complete the scanning process of the images, which corresponds to the receptive field layer of our hierarchical network model. We also test all parallelism on this chip. As shown in
Table 3, it not only achieves a higher degree of parallelism compared to the xc7k325t, but also gains about 3% frequency improvement. At the same time, compared to the previous chip, the parallelism has less impact on the maximum clock frequency, thanks to its resource size.
5.4. Comparison with CPU
We put this visual pathway processing flow on the CPU for testing. On the CPU side, we choose AMD 4800H (8 cores and 16 threads) for test by Python. For the processing latency of a single receptive field, we obtain the processing results on the CPU and FPGA, respectively, as shown in
Table 4. This shows that we reduce the latency on FPGA by about 4200 times. We set the throughput as the number of receptive fields that can be processed in one second. To speed up the CPU processing, we transform the receptive field data into matrix form. Then we process the same number of receptive fields as the test image on the CPU and set the parallelism to 600. Every clock cycle on the FPGA will get an active index of the orientation columns.
Table 4 shows that in terms of throughput, we also achieve a speedup ratio of 3600 times. Also in terms of power consumption, there is no doubt that FPGAs gain a huge advantage. The parallel computation on FPGAs is truly parallel in the sense that it simulates the neuro-visual mechanism very well. For our orientation selection model, both the longitudinal processing of visual pathways and the lateral processing of multiple pathways in parallel are substantially improved.
From the previous experiments, our model can generate cortical orientation maps with a high degree of similarity and orientation selectivity for information within the receptive field. Through the simulation and synthesis experiments, we can obtain that the system has low latency with good real-time performance, and the overall power of the system is low. If it is used in the visual aid system, it can obtain better endurance.
5.5. Comparison with GPU
We also set the visual pathway model to experiment on the GPU (RTX 3090Ti). From
Table 5, we can see that when dealing with the single receptive field, the latency is reduced compared to the CPU but there is still distance from the FPGA implementation. As a part of the computer system, the GPU still needs to interact with the computer CPU, etc., which leads to a high latency. For portable wearable devices, low latency and good real-time performance are necessary requirements. FPGAs have a great advantage in this regard.
In terms of throughput, although it can be further improved with GPU, there is a huge increase in power consumption. The power consumption of the graphics card alone reaches 450 W and requires additional heat dissipation. The GPU cannot run on its own and needs to be run on the computer, which also needs to consider the overall power consumption. There is no doubt that FPGAs achieve a higher power consumption ratio than GPU. At the same time, due to the size of the computer itself, they do not have portability but also do not meet our original intention of designing a brain-like application system.
5.6. Orientation Chip Training Performance
The training approach proposed in this paper differs slightly from traditional SOMs due to the incorporation of connectivity optimization and topological structure optimization. However, within a single receptive field, its connection scheme shares similarities with conventional SOMs, making it practically significant when compared to other FPGA-based SOM training studies. As shown in
Table 6, the experimental results in this paper are compared with the findings of a prior study [
39], revealing that our approach achieves higher CUPS (computations per second). This improvement in performance is attributed to the optimized storage of the proposed approach and the rational design of numerical representation and fixed-point decimal arithmetic modules, resulting in reduced hardware resource utilization, such as LUTs. One major advantage of our approach is its capability to handle training on larger-scale neural layers, thereby achieving higher CUPS. However, the high dimensionality of the input layer in this paper leads to significant delays in weight IO operations, resulting in a slight reduction in the maximum clock frequency. Nevertheless, this trade-off leads to a substantial overall improvement in CUPS.
Our proposed training approach is compared with other algorithms as shown in
Table 7. The table presents the performance of training with a single orientation column (row 3) and dual orientation columns (row 6) when the neuron count is similar. Our training system achieves higher CUPS compared to the first two systems when training with a single orientation column. However, there is still a gap compared to the results of [
40]. We optimize the connections between the input layer and the competition layer, removing unnecessary connections that can be considered connections with update magnitudes of 0. Similar connection optimizations have been used in other studies [
41] to improve CUPS. Considering the number of connections, our approach can further enhance CUPS when training with dual orientation columns simultaneously.
5.7. Representation Experiment of the Visual Pathway Model
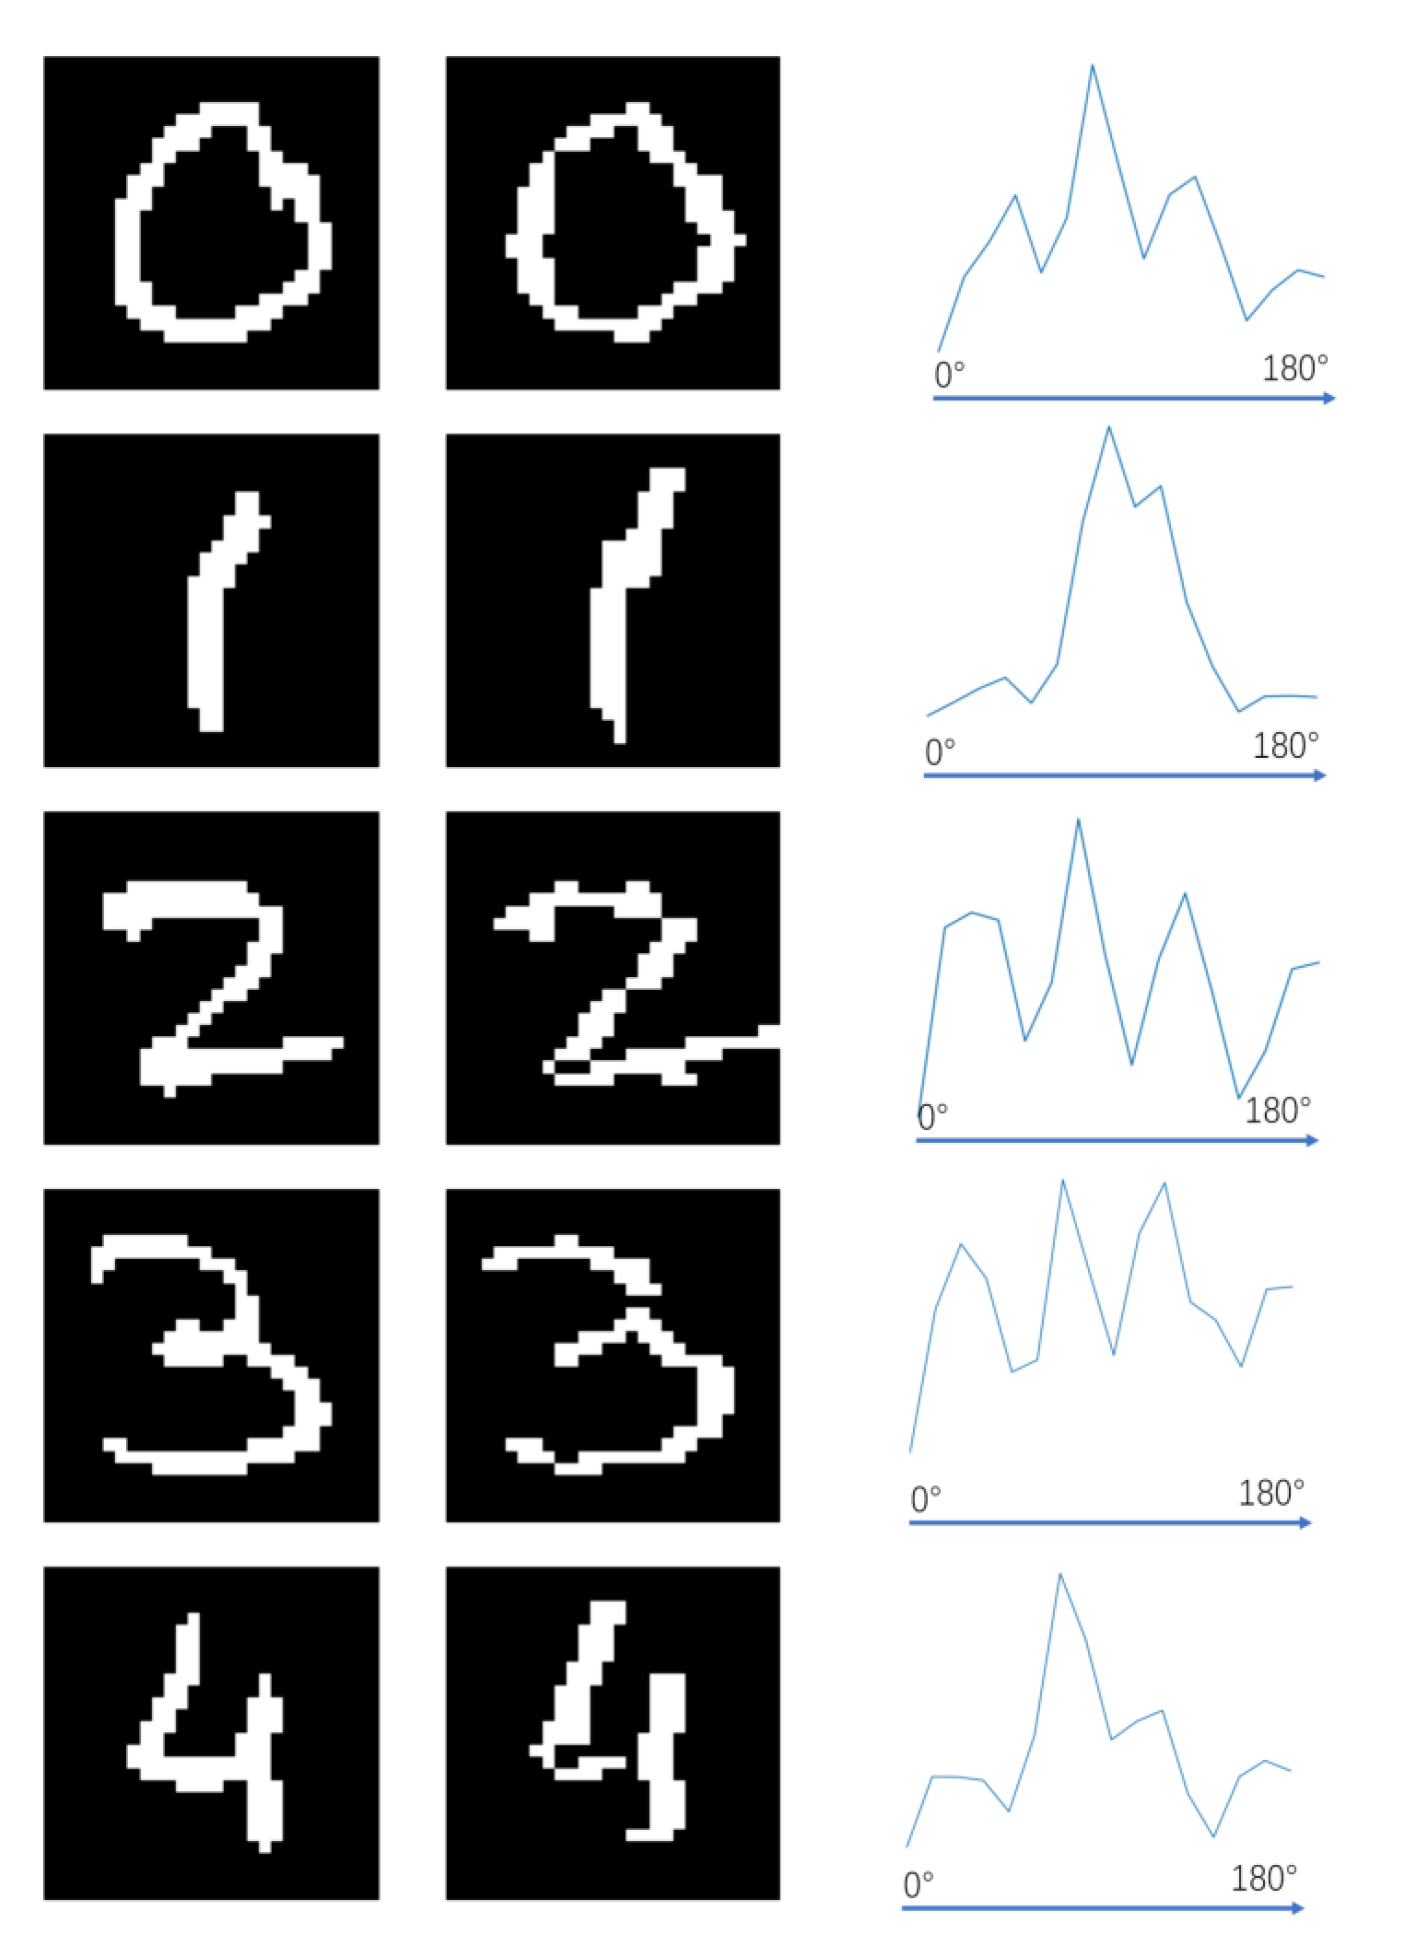
The representation results of the orientation chips array are examined at two different scales. Firstly, we observe the representation results of the orientation chips array on images with a smaller resolution, such as the Mnist dataset, which has a resolution of 28 × 28 pixels. The array should be able to extract line segments of various orientations for different digits. By using orientation chips instead of line segments, the array should be capable of reconstructing the original image. The specific experimental results are shown in
Figure 14. As seen in the second column of the figure, the final representation results can effectively reconstruct the original digits for different numbers. This indicates that the GCs array trained in this study can represent and reconstruct images.
We conduct a statistical analysis of the activated orientation patch types for each digit, which provides the proportions of different orientation patches activated by different digits as shown in the third column. From the graph, it can be observed that for digit 0, the activation of various types of orientation chips is evenly distributed. This can be attributed to the circular structure of the digit. As the digit itself has a slender and tall shape, there are more orientation chips biased towards the vertical direction compared to the horizontal direction. On the other hand, for digit 1, a few specific types of orientation chips are prominently activated, with their optimal orientations mostly close to the vertical direction. This is likely due to the prevalence of inclined angles in handwritten characters, resulting in a higher activation of orientation chips biased towards the vertical direction. As for digits 2 and 3, although their shapes are somewhat similar, digit 3 exhibits a higher activation of orientation chips along the main diagonal. The representation results of the orientation chips array indicate the effectiveness of the multi-layer array proposed in this study.
The ability to effectively represent low-resolution images is a prerequisite for achieving the successful representation of higher-resolution images. We further conduct experiments on images with higher resolutions. We capture partial images using CCD devices, and some images are obtained from the BSD dataset [
45].
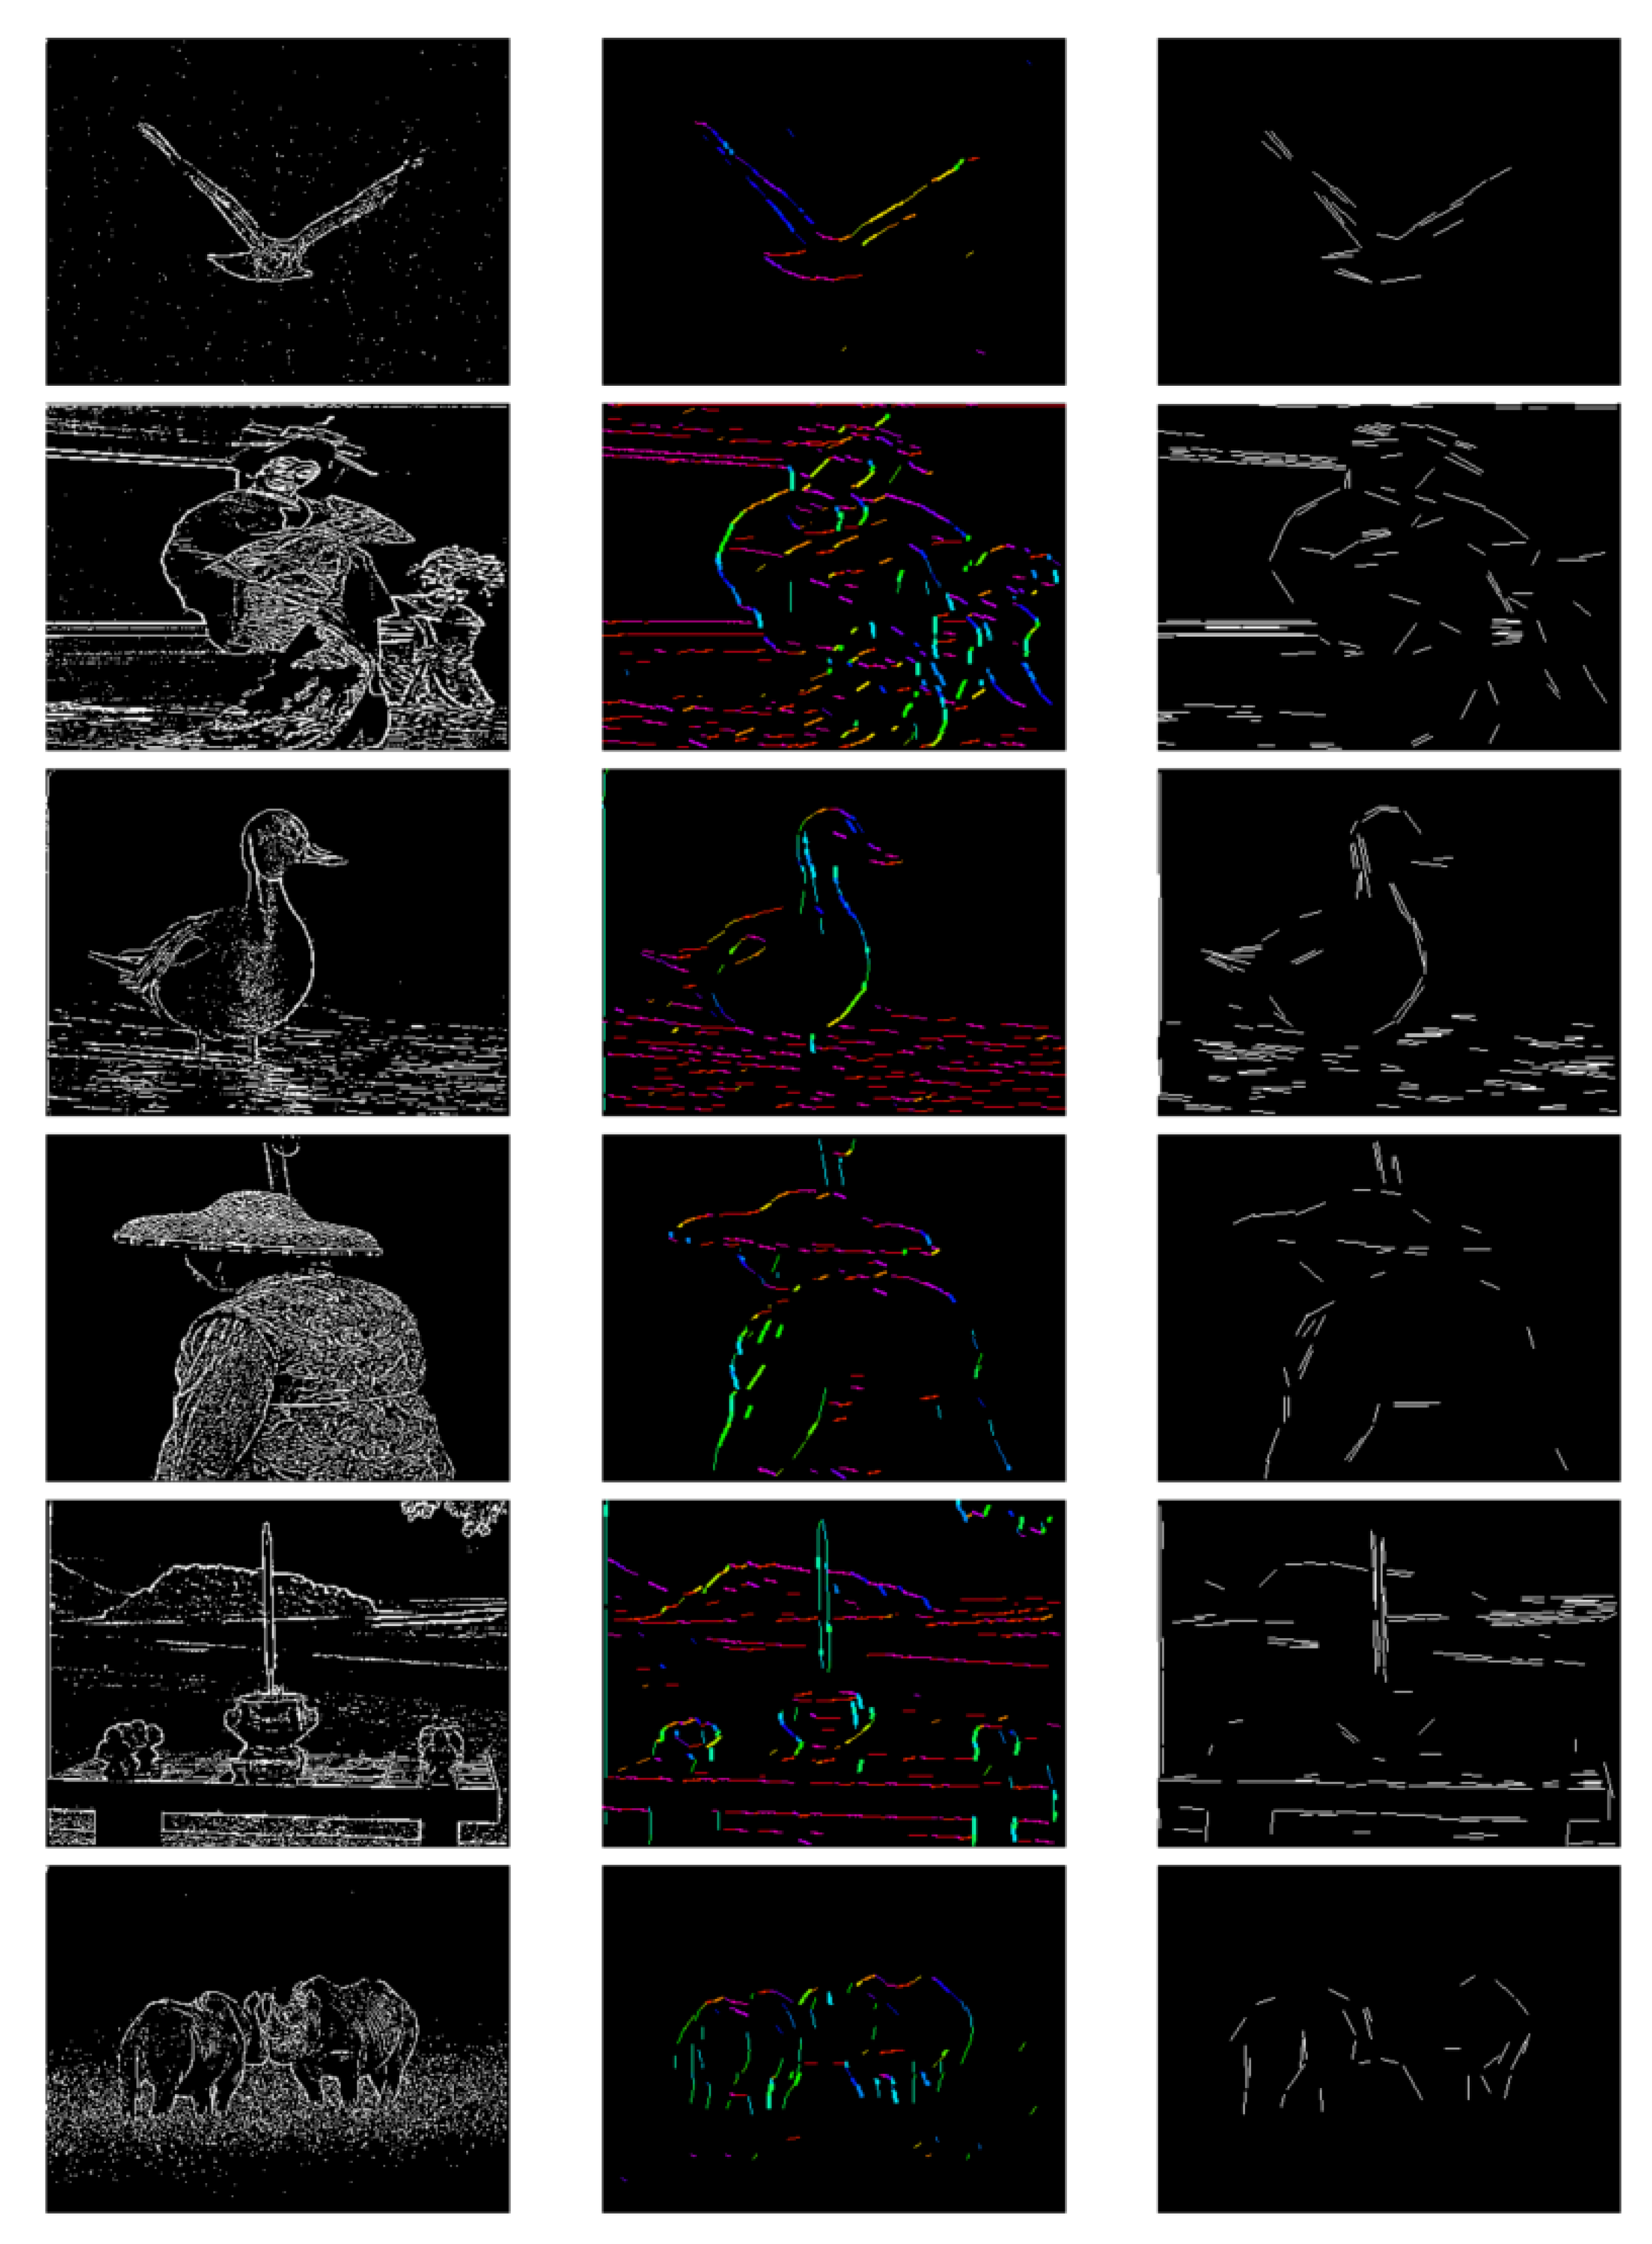
As shown in
Figure 15, the array captures the variations in brightness and darkness in the edge regions, making the edges of the image more pronounced. However, the extracted results are coarse and accompanied by a significant amount of salt-and-pepper noise. The third column represents the results of the orientation chips array’s representation of the image. The entire image is composed of multiple oriented chips resembling line segments, with different colored lines representing patches with different optimal orientations. Compared to the processing results of the GCs array, the OCs array significantly reduces noise and eliminates numerous invalid edges, resulting in a clearer representation. From this representation result, we can obtain both a feature descriptor to describe the entire image and the distribution of features with the same orientation within the image.
Based on the results obtained after processing with the GCs array, we compare the capability of extracting and representing orientation information with the LSD algorithm [
46] using the orientation columns array. As shown in
Figure 16, compared with the LSD method, for relatively simple graphic features, such as the eagle in the third row, the training results can better reflect the representation ability of the visual functional column for edge orientation. For images containing complex information, such as an image with three people, the model focuses more on extracting the excessively redundant features, identifying key lines as a prerequisite, and then distinguishing the orientation. It can be observed that the orientation column array extracts orientation line segments that exhibit more continuity and form closed contours; one reason for this is that the model has a smaller receptive field, allowing for more detailed representation. Furthermore, it can be observed that within the same region, there are no multiple line segments of similar length with different orientations. This indicates that the training of the orientation columns can better learn the features of natural images and activate orientation chips that best match the edge information in the images.
6. Discussion and Conclusions
In this study, we propose a physiologically consistent hierarchical network model of the primary visual cortex orientation selection, which is bionic and highly parallelizable. The network dissects the physiological basis of orientation selection and generates highly approximate maps of cortical orientation columns.
Then we map the network model hierarchy on FPGAs and simulate the orientation selection of objects and implement it. The method achieves the integration of storage and computation and realizes the functional decomposition and fine-grained mapping of multi-level neuronal network computational architectures to FPGA functional components.
As [
47] indicates, based on the neutron structure, brain-like chips can overcome the von Neumann limitation and improve both the speed and complexity of the calculation. The power consumption will decrease at the same time. Our FPGA design can dramatically speed up the visual pathway processing speed and increase the parallelism. The low-latency, low-power, and high-parallelism characteristics of the model are well suited for building assistive systems to help the visually impaired. Simulating the signal processing in the biological cortex makes the input and output of the computing system biologically interpretable and compatible with the interface protocol, which is helpful for the brain–computer interface connection.
In the future, we will conduct larger-scale biocomputing and explore higher-level visual models in other visual cortices and embedded wearable devices to help solve more visual-impairment problems.
