To comprehensively evaluate the proposed LDR-Net, we conduct extensive experiments on public FER benchmarks, occlusion/pose test sets, and a driver facial expression dataset for real-world validation. We describe the datasets, implementation details, and evaluation metrics, followed by ablation studies on RAF-DB. Comparative analysis with several state-of-the-art (SOTA) methods further demonstrates its superiority, while cross-scene validation on KMU-FED confirms its effectiveness in real-world driving.
4.1. Datasets
RAF-DB [
2] is a real-world facial expression dataset which contains 30,000 facial images downloaded from the Internet. In our experiments, only the single-labeled subset is used for evaluations. RAF-DB contains 15,339 images with seven categories, of which the number of the training set and the testing set is 12,271 and 3068, respectively.
AffectNet [
38] is the largest facial expression dataset so far, with a total of more than one million images collected from the Internet. Our experiments select manually labeled images that contain two benchmark branches, AffectNet-7 and AffectNet-8. For AffectNet-7, there are 283,901 training images and 3500 validation images with seven basic expressions. AffectNet-8 introduces an additional category of
contempt, and expands the training and test samples to 287,568 and 4000, respectively.
SFEW [
39] is a static facial expression dataset. The most commonly used version is SFEW 2.0, which contains three sets with seven basic categories. There are 958 samples in the training set, 436 samples in the validation set and 372 samples in the test set.
FED-RO [
3] (Facial Expression Dataset with Real-world Occlusions) is a facial expression dataset with real occlusion for FER in the wild. It contains 400 images with seven basic expressions.
Occlusion-RAF-DB and Occlusion-AffectNet are the two subsets used to evaluate the performance of the FER model in real-world occlusion conditions. The Occlusion-RAF-DB and Occlusion-AffectNet contain 735 and 683 images, respectively.
Pose-RAF-DB and Pose-AffectNet are the two subsets used to value the performance of the FER model under varying pose conditions. The Pose-RAF-DB selects images with a pitch or yaw angle greater than
and
, containing 1248 and 558 images, respectively. Similarly, the Pose-AffectNet selects images with a pitch or yaw angle greater than
and
, containing 1948 and 985 images, respectively.
KMU-FED [
18] (Keimyung University Facial Expression of Drivers) consists of 1106 images from 12 subjects, each exhibiting six basic emotions:
anger,
disgust,
fear,
happiness,
sadness, and
surprise. The images were collected in real-world driving environments using near-infrared cameras, which were exposed to varying lighting conditions and partial occlusions.
Table 1 presents the expression category distribution for each dataset used in our experiments.
4.2. Implementation Details and Metrics
For all datasets, the official aligned face images are selected and then resized to 224 × 224 pixels. Random horizontal flipping and random erasing are employed to avoid over-fitting. The image backbone is IR50 [
35] pre-trained on MS-Celeb-1M [
40], which is designed to extract multi-level features. The initial facial landmarks are provided by a facial landmark detector (e.g., SLPT [
36]), which outputs the 2D coordinates of 98 facial landmarks. All detected landmarks are utilized without additional filtering. Our method is implemented with the PyTorch (version 2.4.0) toolbox on a NVIDIA GeForce RTX 4090 platform (NVIDIA Corp., Santa Clara, CA, USA), using the Adam optimizer (PyTorch built-in) with a momentum of 0.9. The learning rate is initialized as 3.5 × 10
−4 and a weight decay of 1 × 10
−4 is used.
Our model contains two Vision Transformer branches, each with a depth of two Transformer layers and eight attention heads. The embedding dimensions are set to 512 and 1024, respectively. The batch size is set to 128 for RAF-DB, AffectNet, and FED-RO, and 64 for SFEW due to its smaller dataset size.
The evaluation metrics used are overall sample accuracy (Acc) and mean class accuracy (Mean Acc).
4.5. FER with Occlusion and Variant Pose in the Wild
To evaluate the performance of the LDR-Net under occlusion and pose variations, we conduct several evaluations on occlusion-aware datasets with the default setting, which include Occlusion RAF-DB, Occlusion-AffectNet, and FED-RO [
3]), and pose-aware datasets including Pose-RAF-DB (Pose ≥ 30°), Pose-RAF-DB (Pose ≥ 45°), Pose-AffectNet (Pose ≥ 30°), and Pose-AffectNet (Pose ≥ 45°). The comparisons of our LDR-Net with several current SOTA methods, such as RAN [
1], MA-Net [
7], VTFF [
30], AMP-Net [
47], MRAN [
33], and GLMEA [
8], are shown in
Table 7 and
Table 8.
According to the experimental results in a in
Table 7, LDR-Net achieves 89.80%, 92.70%, and 92.65% on Occlusion-RAF-DB, Pose-RAF-DB (Pose ≥ 30°), and Pose-RAF-DB (Pose ≥ 45°), respectively, outperforming all compared methods. Compared to the previous best method, MRAN [
33], LDR-Net improves by 2.86%, 2.32%, and 2.87%, respectively. Notably, LDR-Net also surpasses the IR-50 baseline by 2.04%, 1.52%, and 1.61% on these three test sets. These improvements can be attributed to the proposed landmark-guided patch cropping strategy, which preserves spatial structure under occlusion and pose variations, and the dual-stream learning mechanism that captures both local dependencies and global context.
The results of the comparison on the AffectNet-7 dataset are shown in b in
Table 7, which indicate that the proposed method achieves the highest accuracy, surpassing MRAN [
33] by 3.52%, 2.96%, and 1.28% on Occlusion-AffectNet, Pose-AffectNet (Pose ≥ 30°), and Pose-AffectNet (Pose ≥ 45°), respectively. Additionally, as shown in c in
Table 7, on Occlusion-AffectNet-8, LDR-Net achieves 64.28%, surpassing the IR-50 baseline by 1.62%. For Pose-AffectNet-8, LDR-Net improves over the baseline by 2.31% (Pose ≥ 30°) and 1.93% (Pose ≥ 45°), with accuracies of 61.57% and 61.32%, respectively.
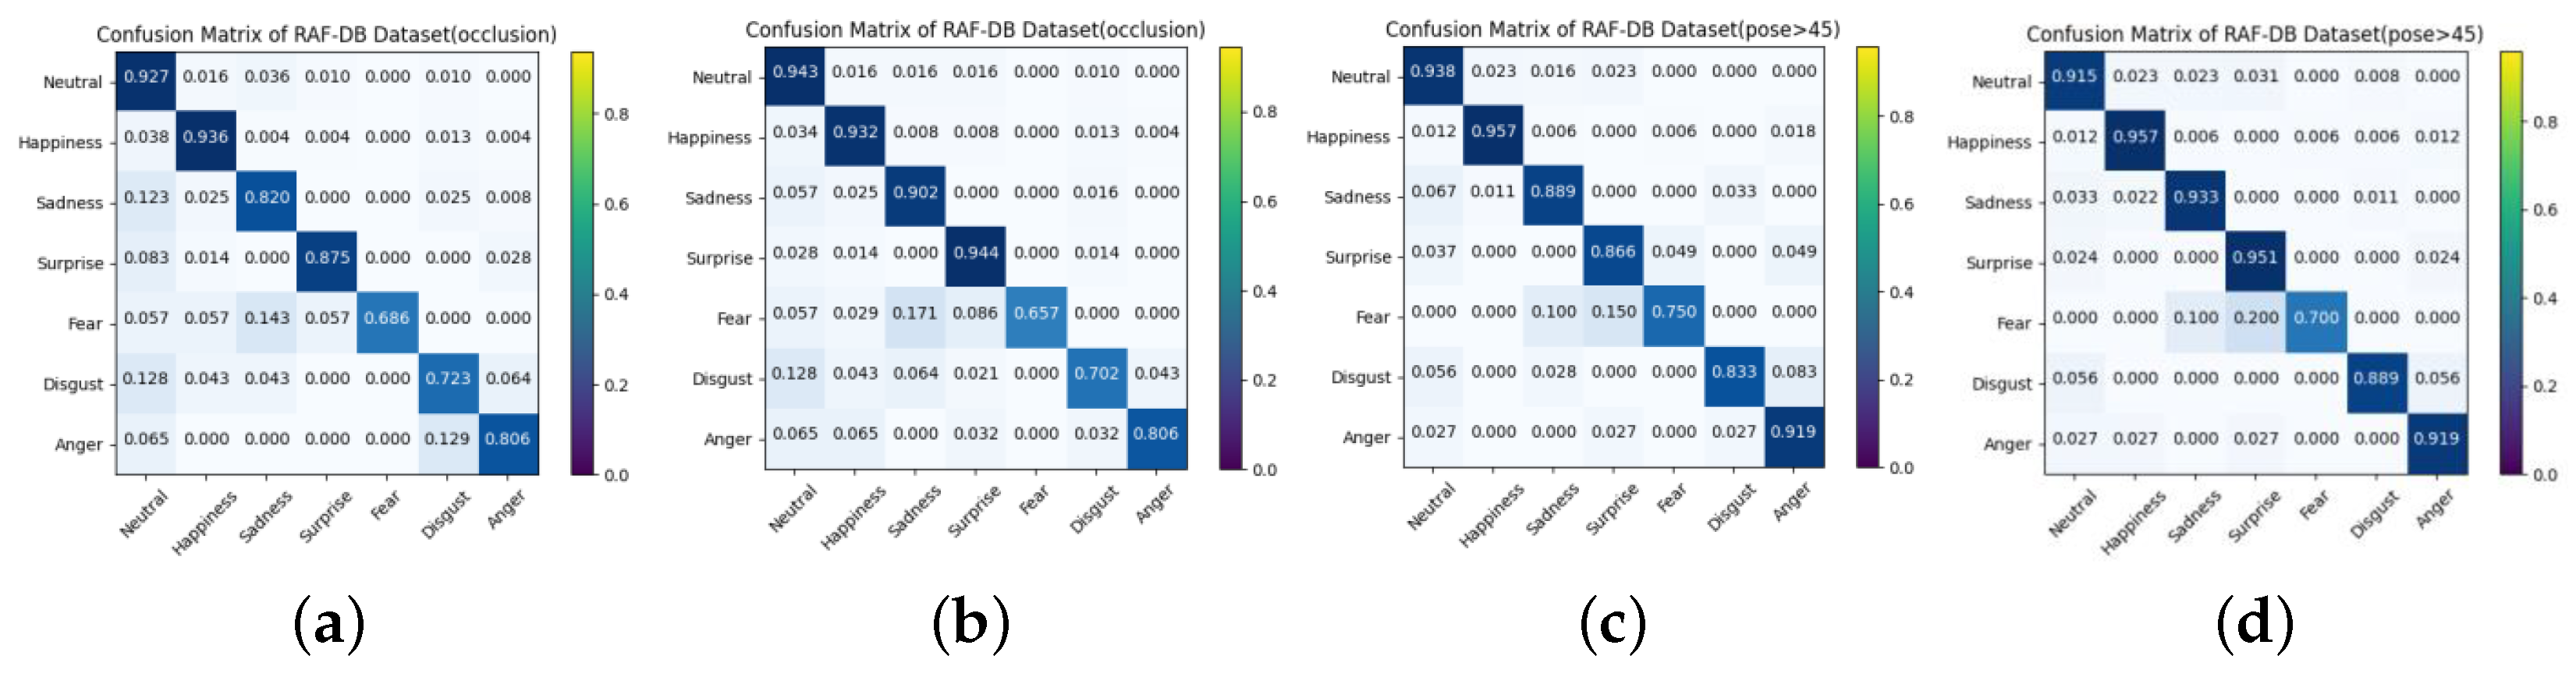
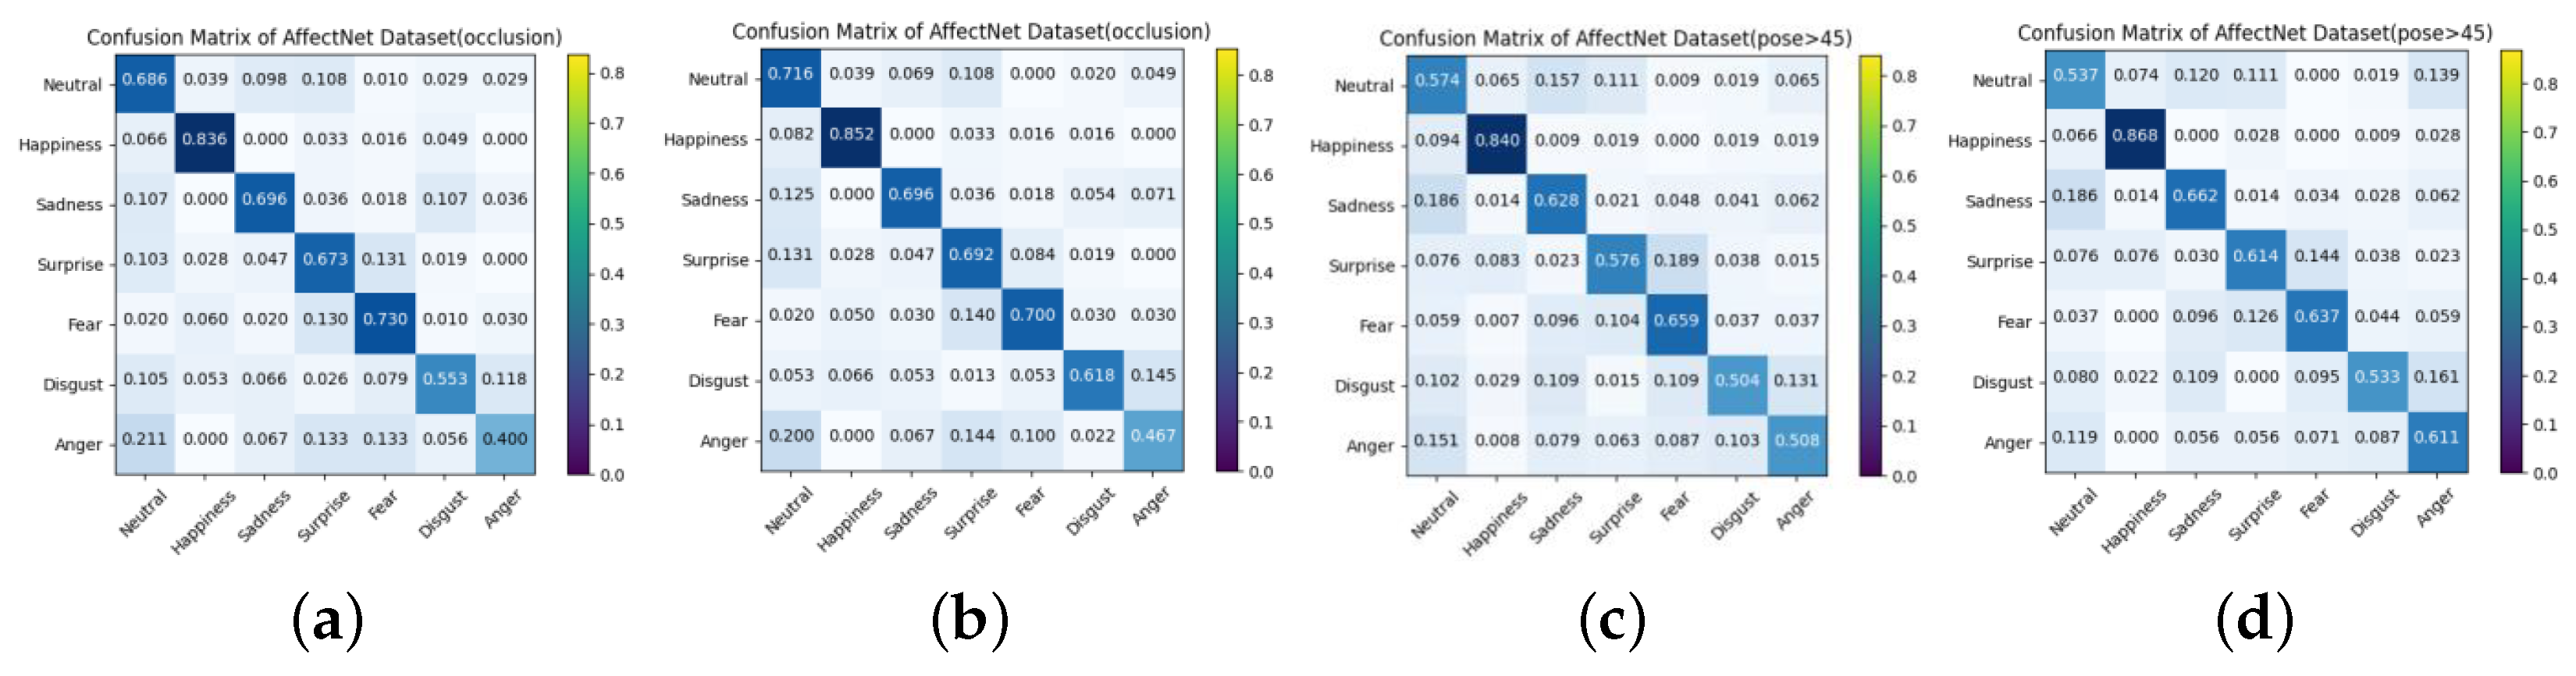
Furthermore, we present the confusion matrices of our LDR-Net and the baselines in
Figure 6 and
Figure 7. We find that our LDR-Net consistently boosts the
Sadness and
Surprise categories on all the test sets. This may be attributed to our LRR’s ability to effectively capture distinct local patch features, such as action units associated with “Cheek Raiser” and “Lip Corner Depressor”. Furthermore, we observe notable performance improvements in the
Disgust and
Anger categories within the AffectNet dataset. These findings indicate that the diverse regional feature design of LDR-Net effectively reduces inter-class similarities, improving classification accuracy.
In addition, we conduct a fair comparison on the recent occlusion test dataset: FED-RO [
3]. Following the standard cross-dataset protocol as [
3], we train LDR-Net on the combined training set of RAF-DB and AffectNet, and evaluate it on the independent FED-RO.
Table 8 presents the experimental results, where our method achieves state-of the-art performance with an accuracy of 73.75%. When compared to RAN [
1], MA-Net [
7], AMP-Net [
47], and EDGL-FLP [
45], our method leads by 5.77%, 3.75%, 2.00%, and 1.50%, respectively. Even compared to GLMEA [
8] (72.59%), which recently achieved the highest accuracy, our approach still maintains a 1.16% lead, demonstrating LDR-Net’s excellent robustness to both occlusion and pose variations.
4.6. Experiment Results of LDR-Net for FER in Driving Environment
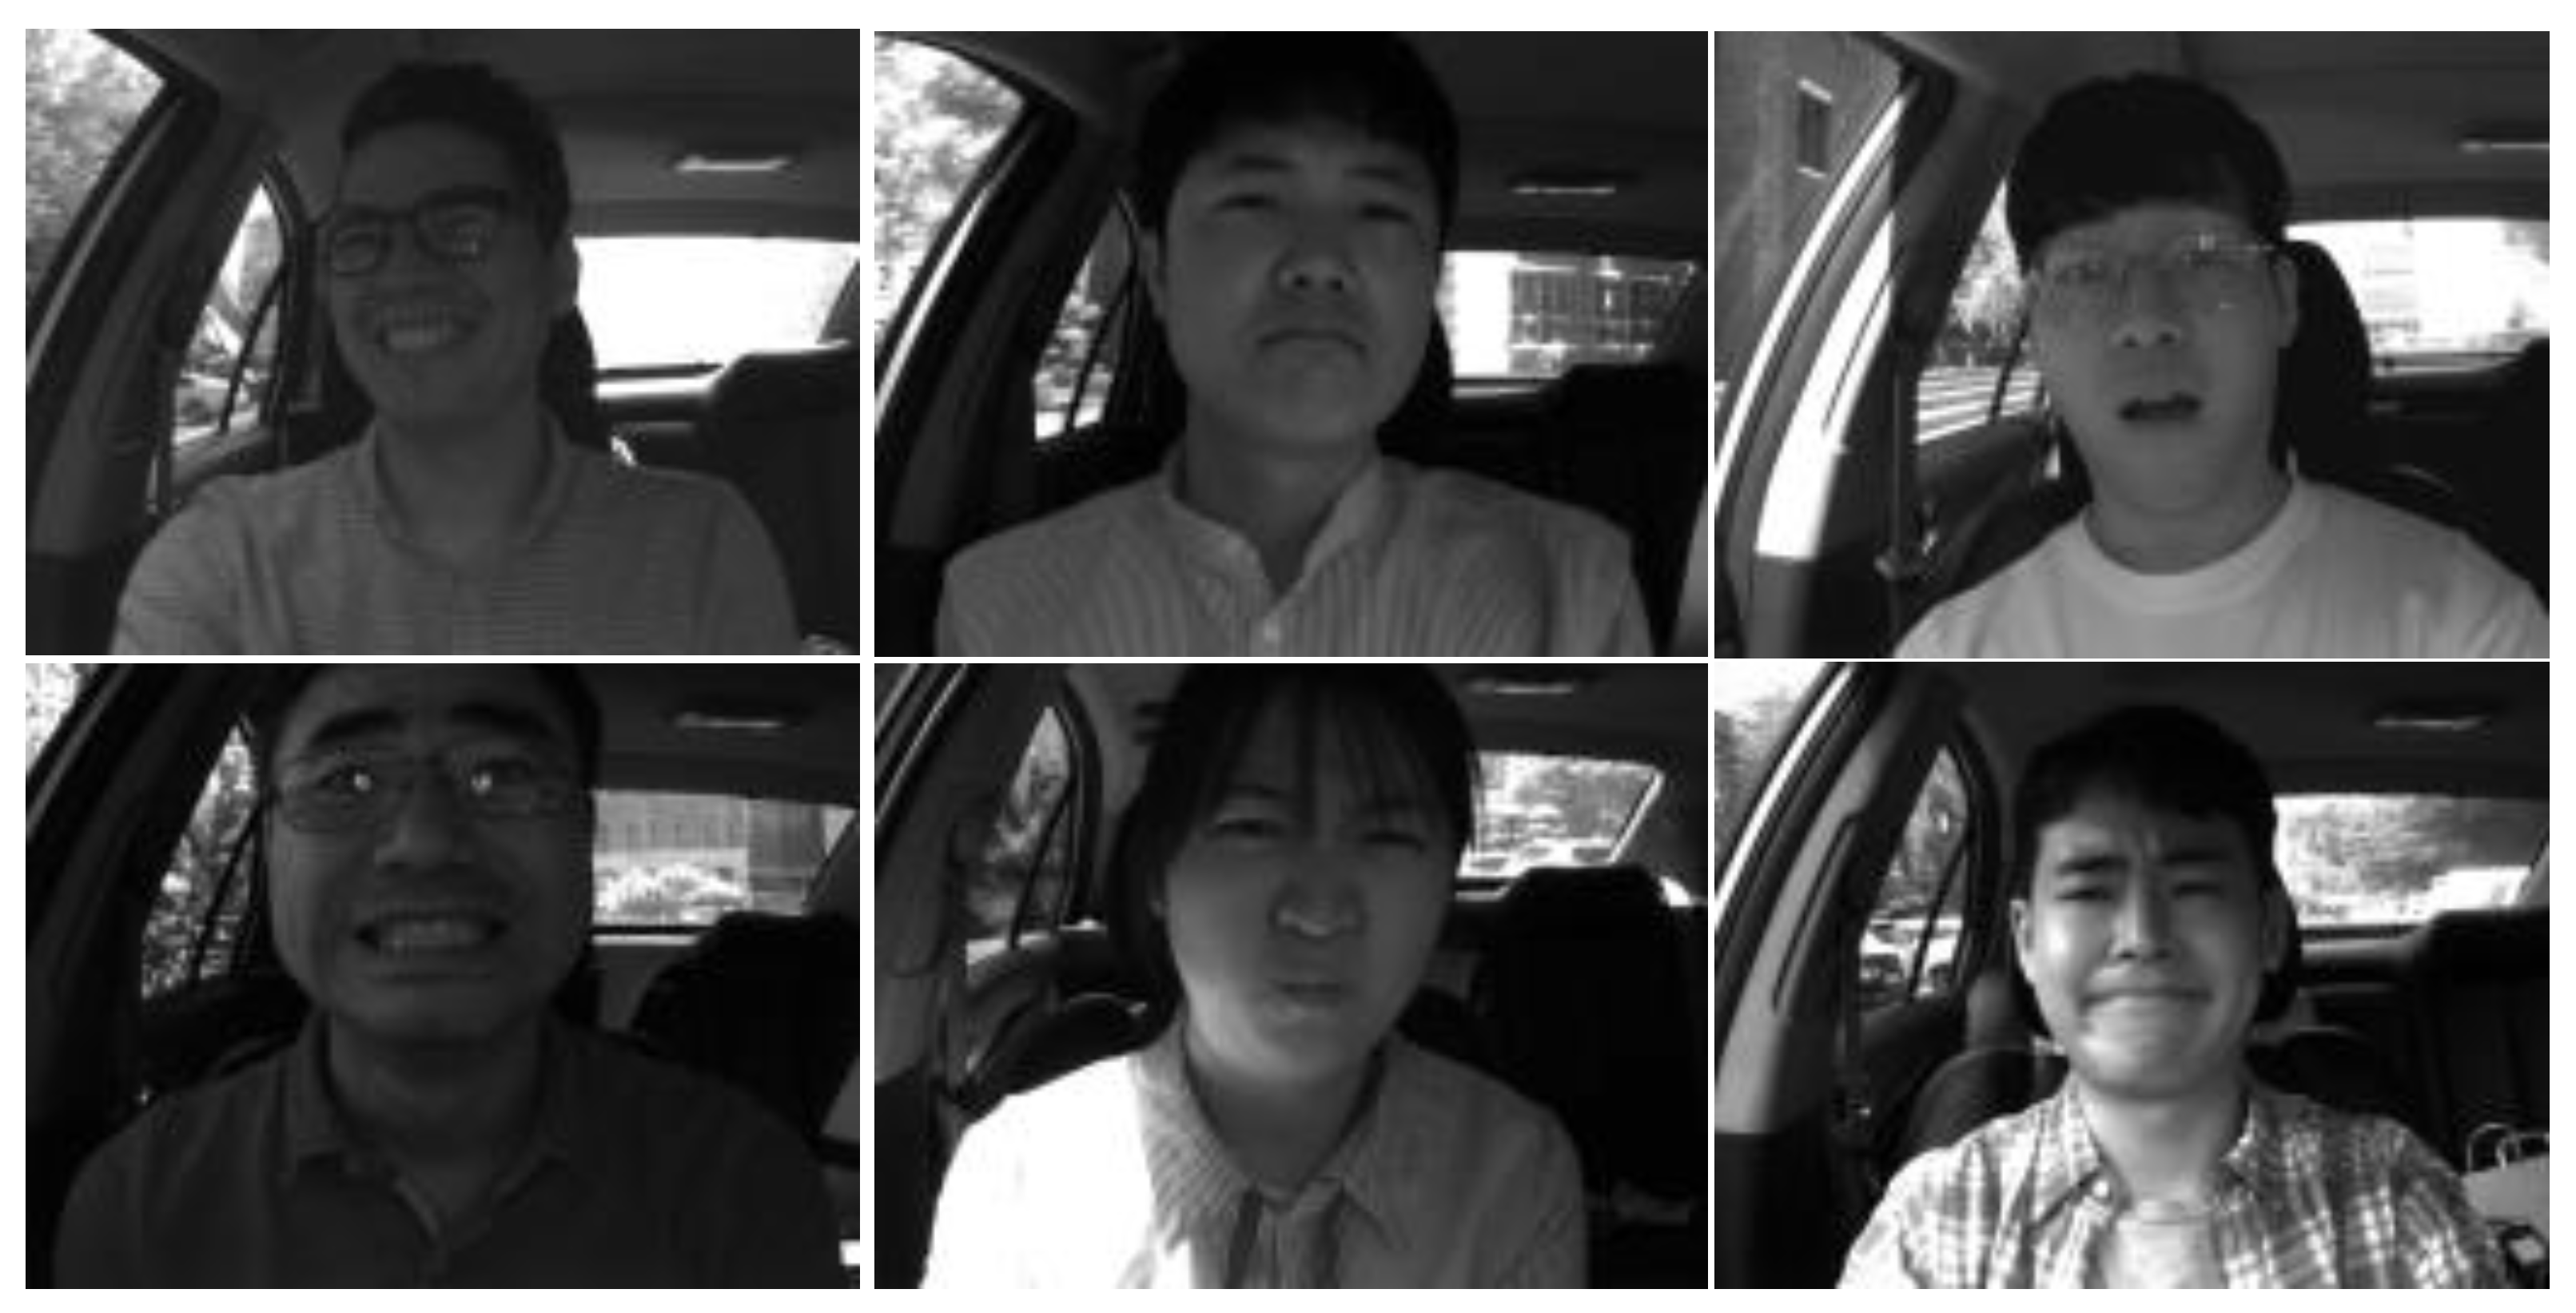
To further evaluate the generalization capability of LDR-Net in real-world driving environments and address the potential issue of subject leakage, we conduct experiments on KMU-FED under two different validation protocols. Representative samples from this dataset are shown in
Figure 8.
To facilitate comparison with previous studies, we first report results under a random split-based cross-validation protocol, which is broadly consistent with the evaluation settings used in prior works. As shown in
Table 9, LDR-Net achieves an accuracy of 99.10%, outperforming several representative methods.
However, random cross-validation may suffer from subject overlap between training and test sets, potentially leading to subject leakage and overly optimistic performance estimates. To rigorously evaluate generalization to unseen subjects, we further conduct leave-one-subject-out (LOSO) validation.
As reported in
Table 10, LDR-Net achieves an average accuracy of
across 12 subjects. The relatively large standard deviation mainly stems from the inherent class imbalance in KMU-FED: due to its limited size, the validation set for certain subjects lacks samples from several categories, leading to missing evaluation coverage and increased confusion among visually similar expressions. Thus, the performance fluctuation largely reflects dataset-level incompleteness rather than model instability. Nevertheless, the LOSO result demonstrates that LDR-Net maintains competitive recognition performance on unseen subjects, indicating its potential for practical FER in driving environments.
4.7. Computational Efficiency Analysis
To assess the practical deployment potential of LDR-Net, we evaluate its computational efficiency in terms of model parameters (Params), floating-point operations (FLOPs), inference speed (FPS), and peak GPU memory usage. All measurements are conducted on an NVIDIA RTX 4090 GPU with an input resolution of . Model parameters and FLOPs are computed using the thop library, while FPS is averaged over 100 forward passes after 10 warm-up iterations.
As reported in
Table 11, LDR-Net achieves an inference speed of 413.9 FPS with a batch size of 64, while requiring a peak GPU memory footprint of 3839.4 MB. These results demonstrate that LDR-Net maintains a favorable balance between recognition accuracy and computational cost.
To provide broader context, we also examined the computational metrics reported in the original publications of the KMU-FED baseline methods. Hierarchical WRF [
18] and LMRF [
48] report efficiency on CK+ (0.25 M/0.0067 M and 1.32 M/0.036 M FLOPs), while ILAB-CNN [
49] reports 1.29 M parameters and 2.44 ms inference time on RAF-DB. Under our evaluation protocol on RTX 4090, LDR-Net achieves 2.42 ms per sample with 413.9 FPS (BS = 64). Despite differences in hardware and datasets, both methods exhibit comparable inference speed, yet LDR-Net achieves substantially higher accuracy (92.11% vs. 85.03% on RAF-DB). This suggests that LDR-Net maintains competitive efficiency while delivering significantly better performance, though the comparison serves as a practical reference rather than a direct one.
It is worth noting that the total parameter count of LDR-Net (88.47 M) includes the pre-trained facial landmark detector (SLPT) and the IR50 backbone (56.92 M in total), which are adopted for fair comparison with prior works. The proposed core modules (DRFE, DRL, and HFF) collectively account for 31.55 M parameters, representing 35.7% of the total. This indicates that the majority of parameters come from pre-trained components, and the overall model size can be effectively reduced by replacing these components with more compact alternatives for resource-constrained scenarios.
4.9. Limitations and Failure Cases
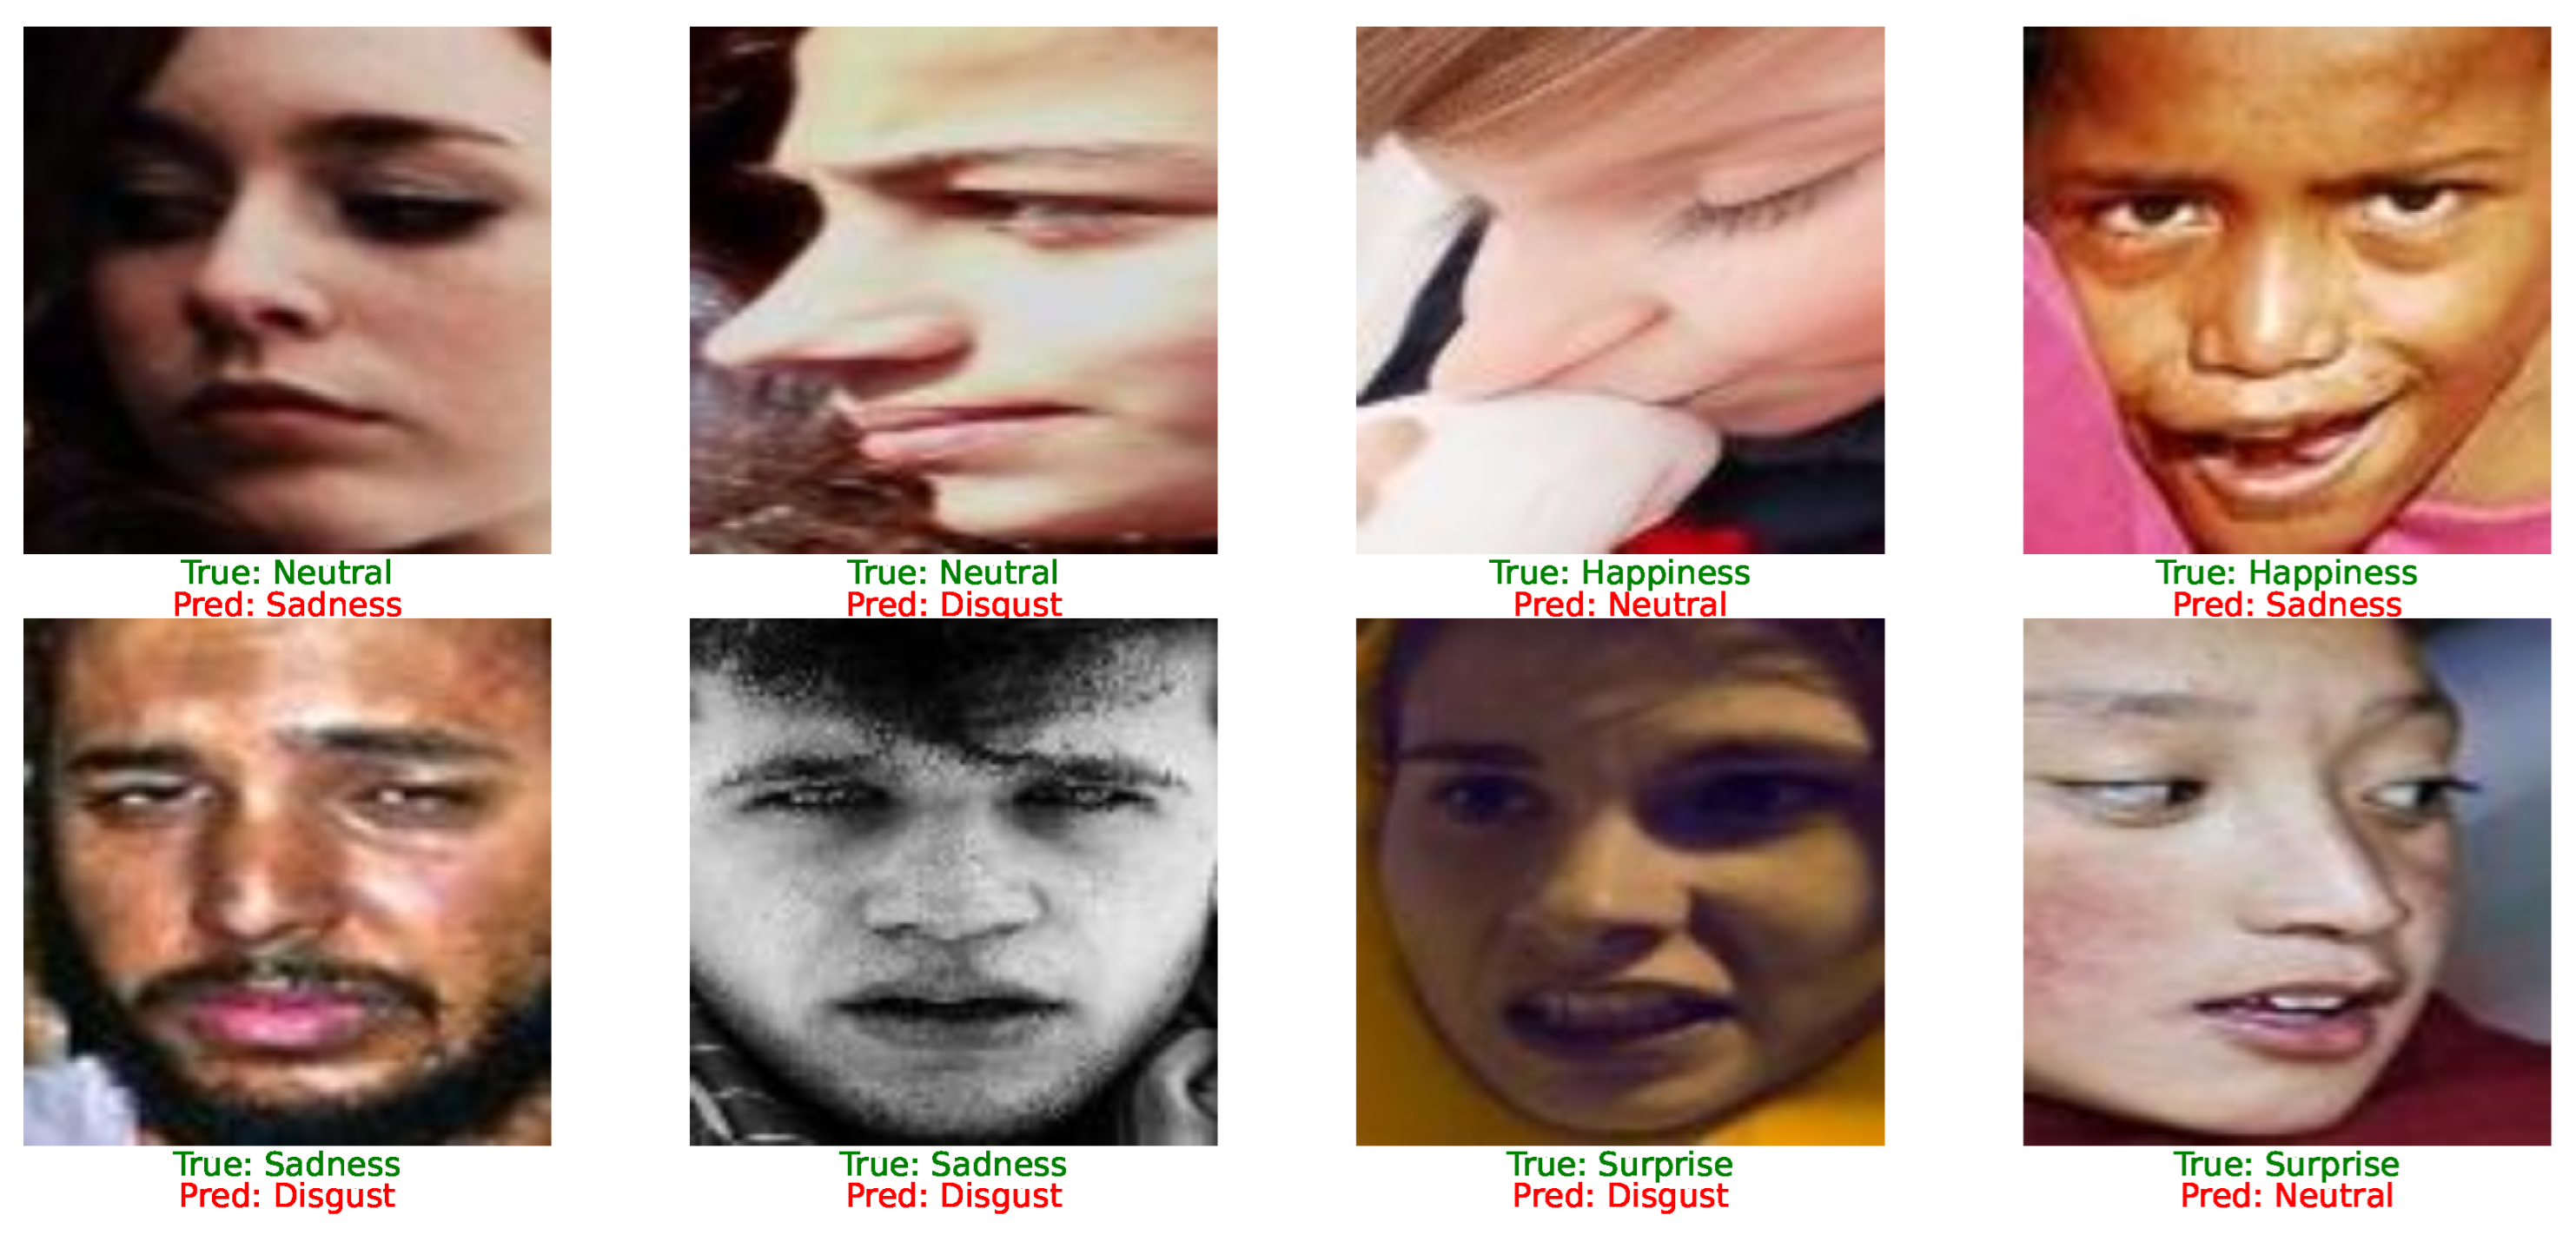
To better understand the limitations of LDR-Net,
Figure 10 presents eight representative misclassified samples from the RAF-DB test set. These examples illustrate several representative failure modes encountered by our LDR-Net under unconstrained FER.
Three representative error patterns can be observed. First, confusion between sadness and disgust occurs repeatedly, which is consistent with previous FER studies, as these two expressions share similar facial configurations and overlapping facial action units. Second, low-intensity positive expressions, including happiness and surprise, are occasionally misclassified as neutral, suggesting that subtle facial movements remain difficult to distinguish from neutral appearances. Third, several neutral samples are incorrectly classified as negative emotions such as sadness or disgust, likely due to subtle facial texture variations or ambiguous facial cues that lead the model to overestimate negative affect. These failure cases suggest that distinguishing subtle expression intensities and highly similar expression categories remains challenging, even with the proposed global–local collaborative architecture.