Review

IAROA: An Enhanced Attraction–Repulsion Optimisation Algorithm Fusing Multiple Strategies for Mechanical Optimisation Design
1
Art College, Xi’an University of Science and Technology, Xi’an 710054, China
2
Department of Applied Mathematics, Xi’an University of Technology, Xi’an 710054, China
3
Department of Computer and Information Science, Linköping University, 581 83 Linköping, Sweden
*
Author to whom correspondence should be addressed.
Biomimetics 2025, 10(9), 628; https://doi.org/10.3390/biomimetics10090628
Submission received: 7 July 2025 / Revised: 1 September 2025 / Accepted: 2 September 2025 / Published: 17 September 2025

Abstract

Attraction–Repulsion Optimisation Algorithm (AROA) is a newly proposed metaheuristic algorithm for solving global optimisation problems, which simulates the equilibrium relating to the attraction and repulsion phenomenon that occurs in the natural world, and aims to achieve a good balance between the development exploration phases. Although AROA has a more significant performance compared to other classical algorithms on complex realistic constrained issues, it still has drawbacks in terms of diversity of solutions, convergence precision, and susceptibility to local stagnation. To further improve the global optimisation search and application ability of the AROA algorithm, this work puts forward an Improved Attraction–Repulsion Optimisation Algorithm based on multiple strategies, denoted as IAROA. Firstly, the elite dynamic opposite (EDO) learning strategy is used in the initialisation phase to enrich the information of the initial solution and obtain high-quality candidate solutions. Secondly, the dimension learning-based hunting (DLH) exploration tactics is imported to increase the candidate solution diversity and enhance the trade-off between local and global exploration. Next, the pheromone adjustment strategy (PAS) is used for some of the solutions according to the threshold value, which extends the search range of the algorithm and also accelerates the convergence process of the algorithm. Finally, the introduction of the Cauchy distribution inverse cumulative perturbation strategy (CDICP) improves the local search ability of the algorithm, avoids falling into the local optimum, and improves the convergence and accuracy of the algorithm. To validate the performance of IAROA, algorithms are solved by optimisation with the original AROA and 13 classical highly cited algorithms on the CEC2017 test functions, among six engineering design problems of varying complexity. The experimental results indicate that the proposed IAROA algorithm is superior in terms of optimisation precision, solution stability, convergence, and applicability and effectiveness on different problems, and is highly competitive in solving complex engineering design problems with constraints.

1. Introduction

Metaheuristic optimisation algorithms have attracted much attention in recent years as an efficient method for solving complex optimisation problems. It stems from the exploration of the inadequacies of traditional optimisation methods and the need for more flexible and efficient solution strategies. Traditional optimisation methods, which require precise mathematical modelling and depend on the specific structure of the problem, become difficult to apply as the size and complexity of the problem increase. Metaheuristic optimisation algorithms provide new solution ideas and have evolved from simple heuristics to hybrid metaheuristic algorithms combined with advanced techniques. The basic principle of metaheuristic algorithms is to adaptively adjust the search strategy to the problem characteristics during the search process. They do not focus on specific details, but rather on finding an approximate optimal solution by effectively exploring the search space, which is highly flexible and can be widely applied to various optimisation problems.
Heuristic algorithms are commonly categorised into the following four types: algorithms based on evolution, algorithms based on physical principles, algorithms based on group intelligence, and algorithms that simulate human behaviour. Algorithms based on evolution are a type of high-powered optimisation algorithm that mimic evolutionary procedures such as natural selection and genetic variation. Such algorithms include Genetic Algorithms (GA) [1], Differential Evolutionary Arithmetic (DE) [2], Biogeography Based Optimisation (BBO) [3], Immunity Algorithms (IA) [4], and so on. Algorithms based on physical principles are a category of innovative optimisation algorithms that draw on the laws of operation of physical phenomena in nature or are directly motivated by physical principles, and simulate these physical processes to find the optimum or approximate resolution of problems. This class of algorithms includes Gravitational Search Algorithms (GSA) [5], Simulated Annealing Algorithms (SAA) [6], Kepler Optimisation Algorithms (KOA) [7], Light Spectrum Optimizer (LSO) [8], Multi-Verse Optimisers (MVO) [9], Polar Lights Optimisation (PLO) [10], etc. Algorithms based on group intelligence are a category of state-of-the-art optimisation algorithms inspired by group behaviour and group intelligence in nature and society, which find the optimal or approximate solution to a problem by mimicking the mechanisms of interaction, co-operation, and competition between individuals in a group. Such algorithms include Harris Hawk Optimisation (HHO) [11], Mountain Gazelle Optimizer (MGO) [12], Nutcracker Optimization Algorithm (NOA) [13], Honey Badge Algorithm (HBA) [14], Firefly Algorithm (FA) [15], Remora Optimization Algorithm (ROA) [16], Sled Dog Optimizer (SDO) [17], and so on. Human behaviour-based algorithms are optimisation tactics that are deeply inspired by human intelligence and behavioural patterns. They simulate the decision-making process, learning strategies, and problem-solving techniques adopted by humans when facing complicated problems, thus effectively increasing the efficiency and performance of problem-solving. Such algorithms include Preschool Education Optimisation Algorithm (PEOA) [18], Teaching-Learning-Based Optimization Algorithm (TLBO) [19], Hiking Optimisation Algorithm (HOA) [20], Enterprise Development (ED) [21], Football Team Training Algorithm (FTTA) [22].
Inspired by physical phenomena or the existence of some kind of attraction between groups of animals, Karol Cymerys et al. [23] proposed the Attraction–Repulsion Optimisation Algorithm (AROA) and experimentally compared it with high-performance algorithms on the CEC 2014, 2017, and 2020 evaluated functions. The experimental outcomes show that it is highly competitive as well as highlighting the applicability of AROA for solving complex real-world problems.
To further improve the performance of the AROA algorithm, this paper proposes to combine the four strategies and suggests an improved attraction–rejection optimisation algorithm (IAROA). The main contributions of this paper are as follows:
(1)
Based on the defects in the primordial AROA algorithm, an improved attraction–rejection optimisation algorithm called IAROA is raised by importing the EDO strategy, DLH strategy, the PAS strategy, and the CDICP strategy.
(2)
Some of the typical, recently raised, highly cited, CEC ranking, and refined classical intelligent algorithms are elected as the contrasting algorithms. The experiments are carried out in the 30D, 50D, and 100D CEC2017 test environments, respectively. The outcomes demonstrate that the IAROA algorithm exhibits remarkable superiority in most of the functions in the CEC2017 test set.
(3)
IAROA is applied in six engineering design issues of varying complexity, including Alkylation Unit, Industrial refrigeration System, Speed Reducer, Robot gripper problem, and Himmelblau’s Function, and 12 highly cited optimisation algorithms were also picked for contrast.
The remainder of this article is structured as follows: Section 2 first gives a brief overview of the standard AROA, followed by an improved AROA algorithm, detailing the four improvement strategies incorporated, and briefly analysing the algorithmic complexity of IAROA, offering pseudo-code as well as a design flowchart for IAROA. Section 3 briefly describes the comparative algorithms for the experiments and provides the outcome of analysing the evaluation indicators in the CEC2017 experimental environment so as to verify the superiority of IAROA’s performance. Section 4 applies IAROA to six engineering design problems of varying complexity and selects 12 highly cited optimisation algorithms for comparison. At the end, Section 4 will draw the outcomes of the research and present future research orientations and work programmes.

2. Theory

2.1. Overview of the Attraction–Repulsion Algorithm

AROA is a new intelligent optimisation algorithm proposed by Karol Cymerys et al. [23] in 2024. This algorithm is inspired by a special attraction phenomenon that exists in human or natural animal populations, and the attraction–rejection operator is proposed accordingly. At the same time, the algorithm comprehensively takes into account a variety of factors affecting the position of candidate solutions in the search space, like the attraction of the optimal solution, the memory mechanism, the influence of random solutions from the general population, and the local search operator.

2.1.1. Initialisation

In AROA, the initial positions of all solutions are determined stochastically,
x i = r a n d ( x max x min ) + x min
where xmin, xmax is the search space boundary, and rand is a stochastic number with values evenly distributed in [0,1].

2.1.2. Attraction and Repulsion

In the optimisation procedure, the location of a candidate solution is renewed by information about the fitness of the remaining population realisations. Specifically, the neighbouring solutions exert an attraction or repulsion effect on the candidate solutions, and the extent of this effect depends on the distance from other solutions. The attraction–repulsion concept for the search space of a given region is shown in Figure 1.
Firstly, define a matrix of distances D,
D = d 1 , 1 d 1 , 2 d 1 , n d 2 , 1 d 2 , 2 d 2 , n d n , 1 d n , 2 d n , n
secondly, define the distance between the ith and the jth candidate solution in terms of the squared Euclidean distance,
d 2 x i , x j = k = 1 dim ( x i k x j k ) 2
where dim denotes the dimensions, xi and xj are the ith and jth positions of solution severally. di,max is the distance from the ith solution to the furthest solution among all the candidate solutions. Considering the ith solution and the neighbouring k candidate solutions, the attraction–repulsion operator is defined as follows,
n i = 1 n j = 1 k c · ( x j x i ) · I ( d i , j , d i , max ) · s ( f i , f j )
where c is the step size and I is the function used to measure the extent to which the jth solution has an impact on the other solutions,
I ( d i , j , d i , max ) = 1 d i , j d i , max
the function s is presented in Equation (6),
s ( f i , f j ) = 1 , f i > f j 0 , f i = f j 1 , f i < f j
The number of neighbours k, which should decrease with the increasing number of iterations, is thus shown in Equation (7):
k = 1 t t max · n + 1

2.1.3. Attracted by the Optimal Solution

In AROA, the vector representing the vector attracted to the optimal solution bi is computed as shown in Equation (8):
b i = c · m · ( x b e s t x i ) , r 1 p 1 c · m · ( a 1 x b e s t x i ) , r 1 < p 1
where xbest is the optimum solution; r1 is a stochastic digit in [0,1]; p1 is a probability threshold; a1 is a vector of stochastic digits within [0,1].
Factor m is in charge of maintaining the trade-off between discovery and development, dynamically controlling the impact of the optimum solution. It is defined as shown in Equation (9):
m = 1 2 exp ( z ) 1 exp ( z ) + 1 + 1
where Equation (12) is the transformed hyperbolic tangent function, z = 18 · t / t max 4 .

2.1.4. Local Search Operator

The AROA algorithm also randomly selects a local search operator for each candidate solution, and there are three of these operators. The first operator draws on the principle of Brownian motion, as shown in Equation (10):
r B = u 1 N ( 0 , f r 1 · ( 1 t t max ) · ( x m a x x m i n ) )
where fr1 is a decimal number, N is a vector of digits randomly generated according to a normal distribution, and u1 is a two-valued vector.
The second local search operator combines a trigonometric function and a roulette wheel selection mechanism. This operator is shown in Equation (11):
r t r i = f r 2 · u 2 · ( 1 t t max ) · sin 2 r 5 π a 2 x w x i , r 4 < 0.5 f r 2 · u 2 · ( 1 t t max ) · cos 2 r 5 π a 2 x w x i , r 4 0.5
where r4,r5 are stochastic digits in [0,1], a2 is a vector of random numbers in [0,1], and the solution xw is represented by the roulette wheel selection method.
To ensure broad coverage of the search space and population diversity, the third local search operator introduces new candidate solutions by randomly selecting positions in the search space, and the related operator is given by Equation (12):
r R = u 3 ( 2 · a 3 o ) ( x m a x x m i n )
where u1 is a binomial vector with threshold value t r 2 , a3 is a vector of arbitrary counts, and o is a unit matrix.
Therefore, the position update is defined, as shown in Equation (13):
r i = r B , r 3 > 0.5 · t t max + 0.25 r t r i , r 3 0.5 · t t max + 0.25 , r 2 < p 2 r R , r 2 p 2
where both r2 and r3 are stochastic generated digits in [0,1].
Finally, the position of the candidate is defined as illustrated in Equation (14):
x i ( t ) = x i ( t 1 ) + n i + b i + r i
where ni is the one determined by the attraction–repulsion operator, which captures the relationship among the candidate solution and the other candidate solutions, bi is the modelling of the appeal of the optimum candidate, ri denotes motion of the local exploration operator.

2.1.5. Population-Based Operations

Two population-based operators are used to interact with every solution. The first arithmetic produces irritations that imitate the forming of vortices, as well as two stochastic solutions to influence the candidate solutions. It is defined as shown in Equation (15):
x i = x i + c f · ( u 4 ( a 4 ( x max x min ) + x min ) ) , r 6 < e f x i + ( c f · ( 1 r 7 ) + r 7 ) ( x r 8 x r 9 ) , r 6 e f
where u4 is a binary variable vector with the threshold 1 − ef, a4 is a vector of stochastically produced digits, r7 is a vector of stochastically produced digits in [0,1], ef takes the value of 0.2, r8 and r9 form the index of randomly selecting an individual as well as c f = 1 t t max 3 .
The second key stimulus affecting the population is a memory mechanism that records the previous position and fitness of each candidate solution. When a candidate solution fails to improve during the evolutionary process, it “gets back on track” through the memory mechanism and continues to participate in the subsequent search and optimisation process. The definition is shown in Equation (16):
x i ( t ) = x i ( t ) , f ( x i ( t ) ) < f ( x i ( t 1 ) ) x i ( t 1 ) , f ( x i ( t ) ) f ( x i ( t 1 ) )

2.2. Improved Attraction–Repulsion Algorithm

Although the AROA algorithm has merits like excellent optimisation ability and quick convergence speed, it is inevitably vulnerable to becoming trapped in local optimum, resulting in low computational accuracy and affecting its optimisation ability. To optimise the performance of the AROA, in this section, the AROA is refined by integrating the below four tactics and proposes an improved Attraction–Repulsion Optimisation Algorithm (IAROA).
(1)
EDO strategy to enable a more uniform spread of the primary population and to acquire a high-quality starting population.
(2)
DLH strategy which scales up the trade-off among local exploitation and global search, while retaining the multiplicity of solutions.
(3)
CDICP strategy, which increases the reliability of the algorithm search and the variety of candidate solutions, thus effectively preventing the algorithm from converging to the local optimum prematurely.
(4)
PAS strategy to raise the overall running efficiency of the algorithm, both to expedite the convergence procedure and to ensure that the ultimately optimal solution is gained with a higher degree of precision.

2.2.1. Elite Dynamic Opposite Learning Strategy (EDO)

The optimisation performance of the swarm intelligence optimisation algorithm is greatly affected by the quality of the initial solution, and a high-quality initial population can accelerate the convergence speed of the algorithm and help to find the global optimal solution [24]. The standard AROA algorithm tends to initialise the population by a random initialisation method, which can easily lead to poor population diversity and is not conducive to the fast convergence of the algorithm.
Inspired by quasi-opposite-based learning (QOBL) and quasi-reflection-based learning (QRBL), Xu et al. [25] (2020) proposed dynamic opposite learning (DO). The search space of DO exhibits asymmetric properties and can be dynamically adjusted based on random opposites. This dynamically changing property greatly enriches the diversity of the search space, which in turn effectively enhances the exploration capability of the algorithm. Based on this, this paper applies DO to the initialisation phase of AROA, and the mathematical model is shown in Equation (17),
X o p = LB o p + UB o p X , X R O = u · X o p , X D O = X + v · X R O X
where Xop is the solution generated by reverse learning and u,v are astochastic digits evenly distributed at [0,1]. These newly produced inverse solutions Xop are merged with the primitive solution set X and the elite portion of them is filtered out by a sorting operation. That is, the solutions are sequenced based on their fitness values, and the top-performing solutions are selected to form the original population. It can effectively improve the variety and quality within the initiative population. The solution generated by backward learning makes the initial population more uniform in distribution. Such an initial population is not only conducive to the fast convergence of this algorithm, but it can also strengthen the global exploration ability of it, thus further enhancing its overall performance.

2.2.2. Dimension Learning-Based Hunting Search Strategy

Dimensional Learning Heuristic (DLH) [26], proposed by Nadimi-Shahrakiden et al. (2021), provides us with a novel and efficient optimisation idea. Under the framework of DLH, DLH constructs a neighbourhood for each candidate solution, which can promote information sharing among all candidate solutions and broaden the search scope. In addition, DLH introduces the influence of stochastic solutions on candidate solutions, balances local and global exploration phases, and enhances its flexibility to maintain the diversity of solution populations. In this section, the mathematical model is shown in Equation (18),
x _ d l h i d t + 1 = x i d t + r a n d · x n e i g h b o r d d ( t ) x r 1 d
where x n e i g h b o r d d ( t ) is the random domain solution selected by the Euclidean distance among the candidate solutions, and a radius between xi(t) and the candidate solution, r1 is the index of one stochastic solution.
After obtaining the candidate populations generated by DLH, the final population in generation t + 1 is determined by greedy selection:
x i t + 1 = x _ d l h i t f ( x _ d l h i t ) f ( n e w x i t ) n e w x i t f ( x _ d l h i t ) > f ( n e w x i t )
where n e w x i t denotes the location of the ith candidate solution in the tth generation of candidate species solutions generated by the attracting and repelling operators, i = 1, 2,⋯, n.

2.2.3. Cauchy Distribution Inverse Cumulative Perturbation Strategy

The Cauchy distribution inverse accumulation [27] is a new tangent function proposed by Wang et al. (2022). The step size generated by this function is generally more average, with occasional large step sizes. The flight trajectory diagram of the CDICP in a given search area is shown in Figure 2. When used as a scale to control the step size, it can effectively enhance the stability of the algorithm search. In most cases, the AROA algorithm has a limited scope of exploration. In this study, we take advantage of this property of the CDICP to perform tangent flight perturbation operations on all candidate solutions at each iteration, to expand the distribution range of the solutions in the search space and deepen the degree of exploration of the solution space. This can not only increase the diversity of solutions and accelerate the convergence speed of the algorithm, but also alleviate the problem that the AROA algorithm tends to fall into local optimality in the late iterations. The specific operation is shown in Equations (20) and (21) below:
f 1 p ; a , b = a + b tan π p 1 2
x i t + 1 = x i t + x b e s t x i t f 1 p ; a , b , p < 0.5 x i t + x m e a n x i t f 1 p ; a , b , p 0.5
where p is an astochastic digit in [0,1], and d is the dimension. The standard Cauchy distribution location parameter a takes the value 0, and a scale parameter b of 0.01. xbest is the current optimal solution.

2.2.4. Pheromone Adjustment Strategy (PAS)

The Black Widow Optimisation Algorithm (BWOA) was proposed by Hayyolalam V. et al. (2020) inspired by black widow spiders’ predation [28], which simulates the efficient search and strategy selection capabilities exhibited by black widow spiders during predation and aims to solve complex optimisation problems. Pheromone is another trait of black widow populations that plays an important role in the mating process. Its definition is shown in Equation (22):
p h e r o m o n e ( i ) = f max f ( i ) f max f min
when this pheromone is too small, the individual will be replaced by a new individual, modelled as shown in Equation (23):
x i t = x * t + 1 2 x r 1 t 1 σ · x r 2 t
where x * t is the optimum solution, r1,r2 are the indexes of two stochastic individuals, σ taken as 0 or 1.
This section introduces the PAS strategy in the population-based operation session. Specifically, when the pheromone level of a candidate solution is monitored to be lower than a preset threshold (which is set to be 0.3 in this section), a replacement operation is carried out for the candidate solution according to Equation (23). Through this dynamic adjustment of the pheromone level of the candidate solution, the algorithm is guided to explore the solution space more efficiently, which in turn accelerates the convergence speed of the algorithm and improves the accuracy of the optimal solution obtained in the end.

2.2.5. Steps of the Improved Attraction–Repulsion Optimisation Algorithm

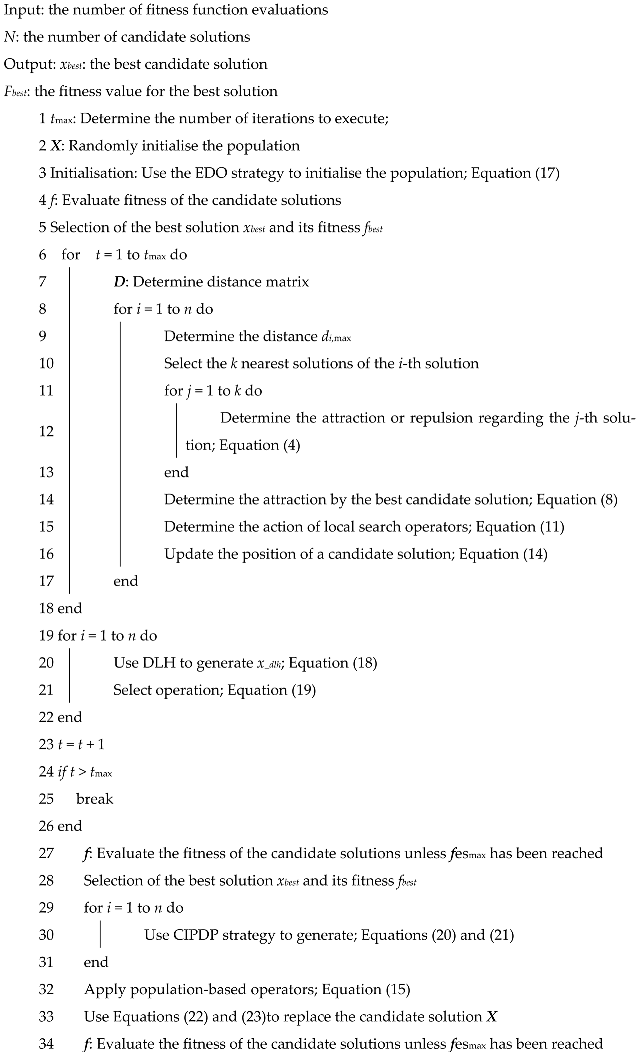
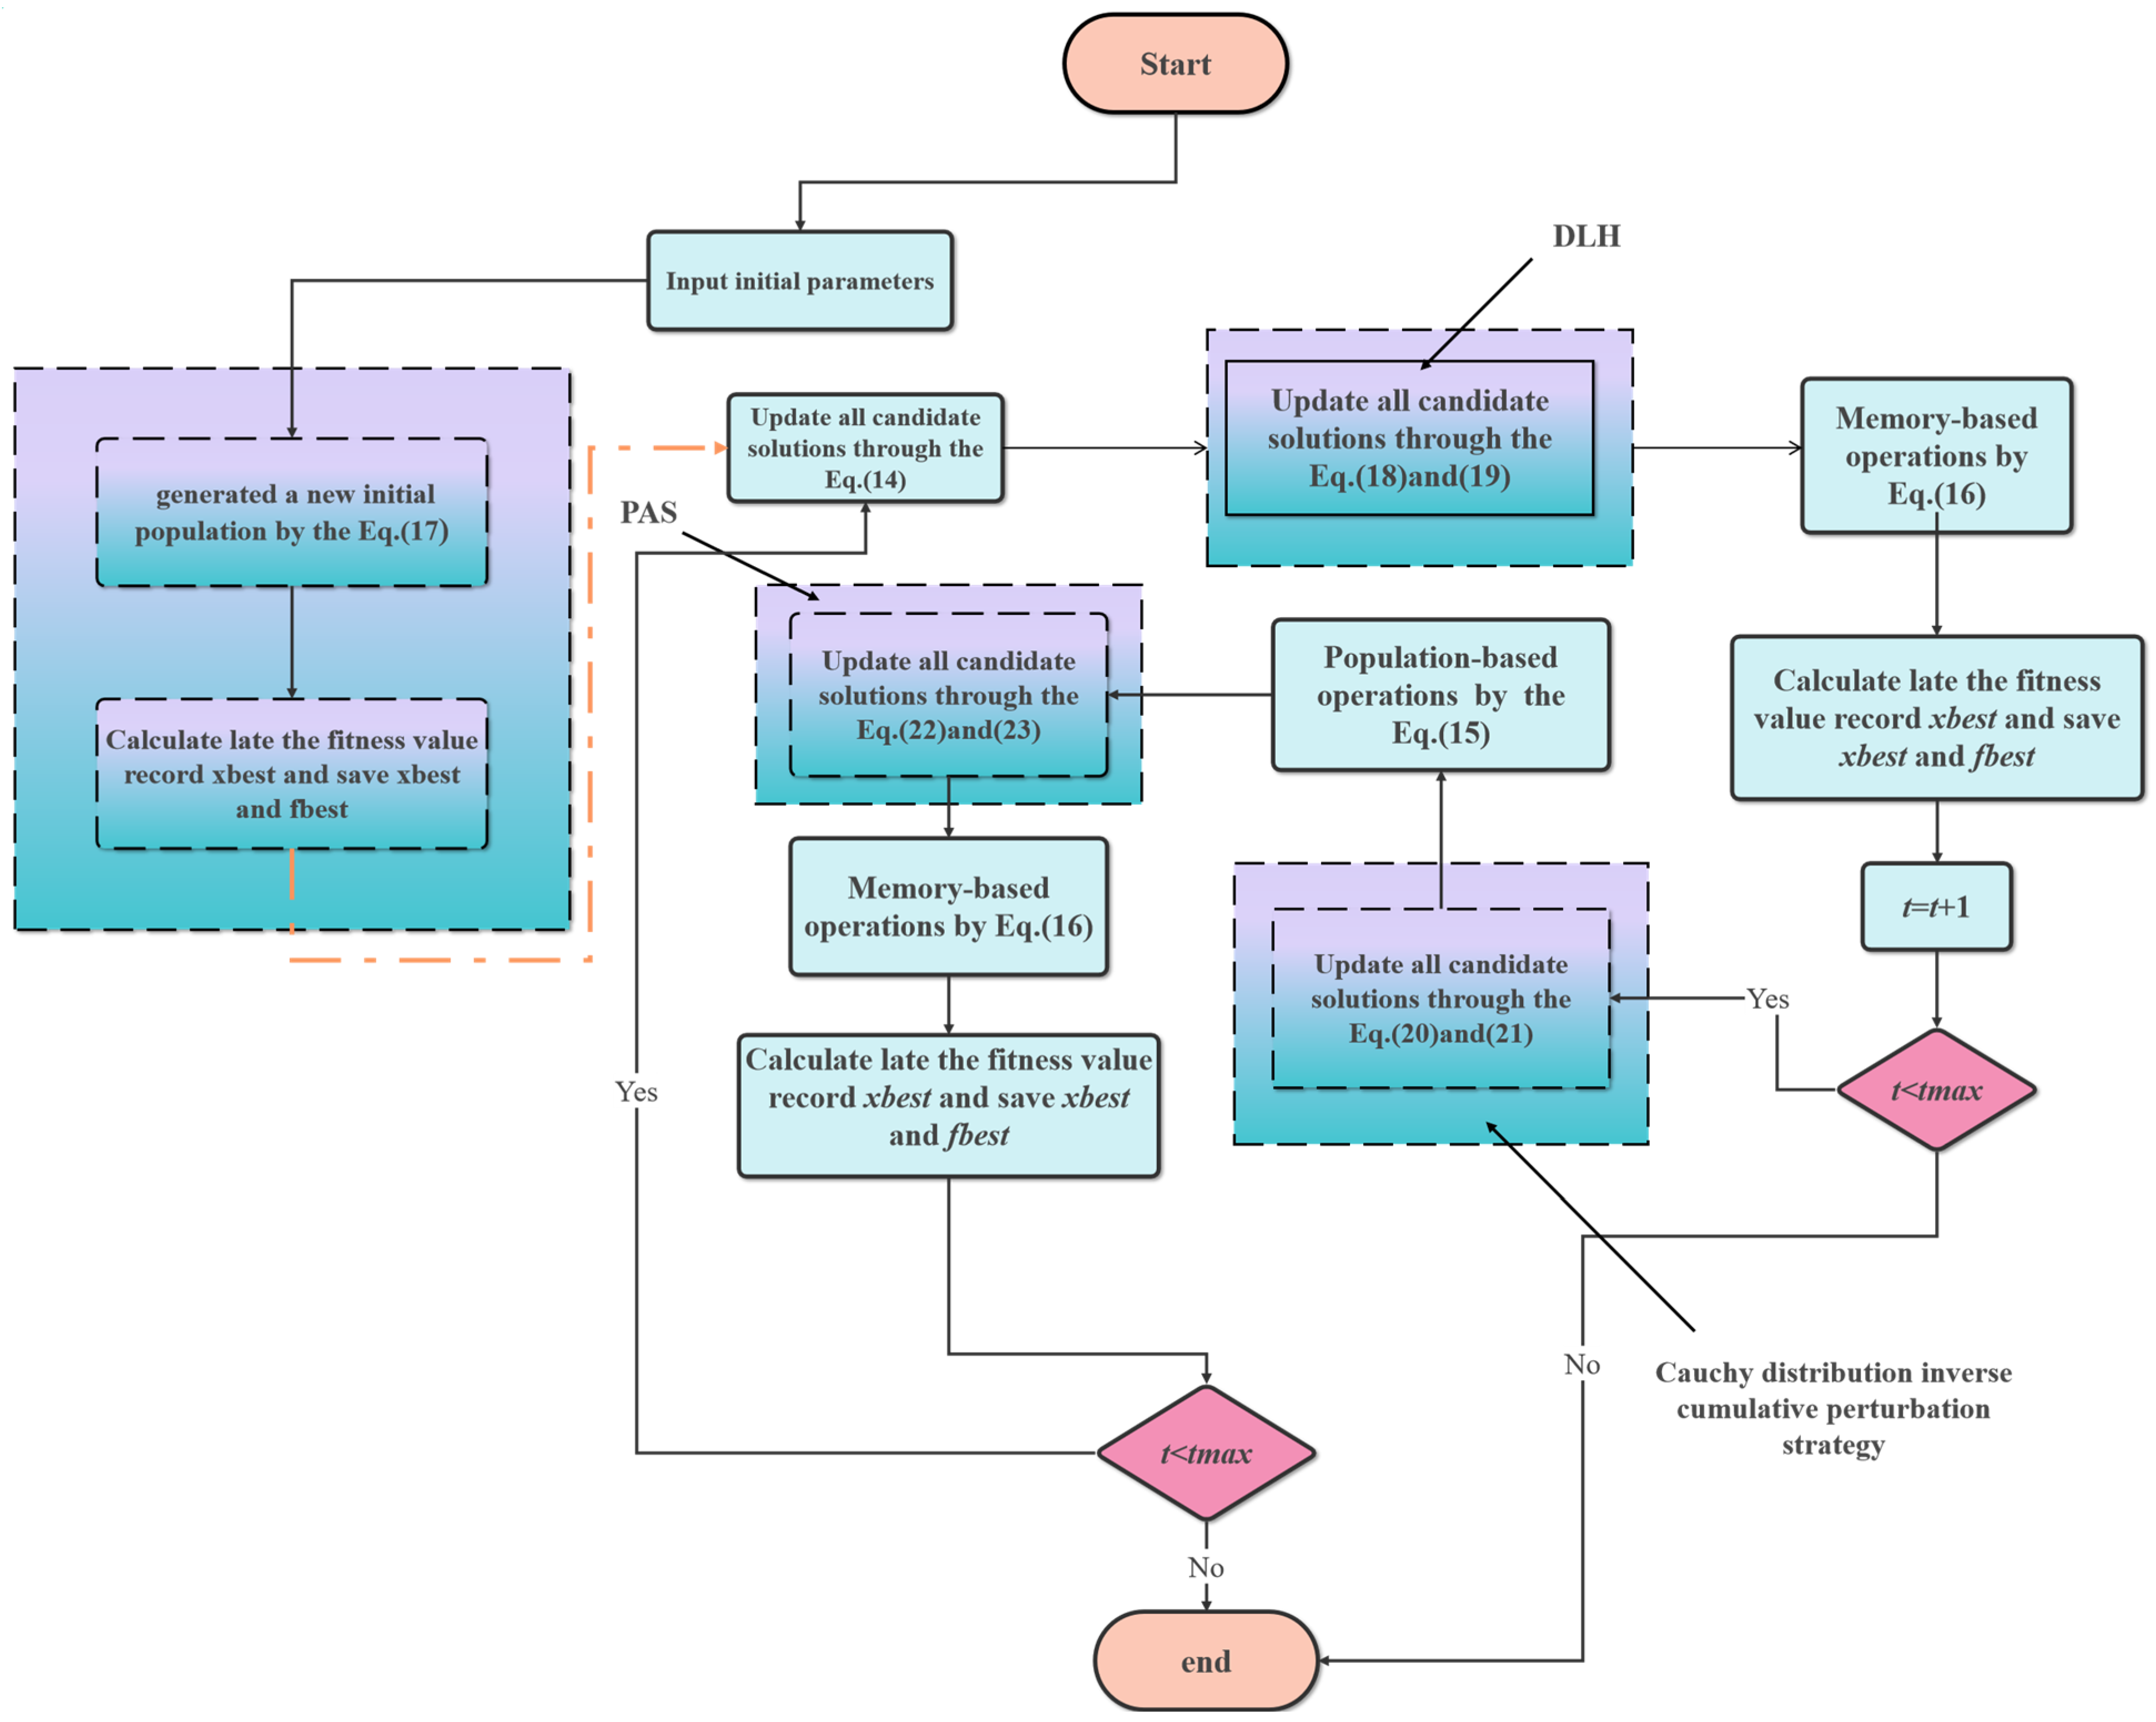
In this paper, the improved AROA algorithm (IAROA) is proposed by adding several improvement strategies, namely, EDO strategy, DLH mechanism, CDICP strategy, and PAS strategy, to the original AROA. The four different improvement strategies not only improve the performance of the original AROA, but also enhance the optimisation capability significantly. Figure 3 shows the flowchart of the IAROA algorithm. The steps of the IAROA algorithm are shown below:
Step 1. Set the population size N, maximum Iterations tmax, variable dimension dim, execute EDO, and update the initial solution with Equation (17);
Step 2. According to the fitness value, all candidate solutions are arranged from good to worse, and the placement of the elite solutions are renewed to acquire the initialised candidate solutions;
Step 3. Calculate the fitness value F of every candidate solution, record the optimum fitness value fbest and the corresponding optimal individual xbest;
Step 4. Use Equation (14) to refresh all candidate solutions;
Step 5. Execute DLH to renew the candidate solution locations using Equations (18) and (19) for these solutions;
Step 6. Compare the fitness values of the solution before performing DLH with the solution after performing the operation and choose the individual corresponding to the smaller fitness value to renew the present candidate solution position;
Step 7. Judge whether the maximum iterations tmax have been achieved. If yes, carry out Step 14, or, if not, continue to carry out Step 8;
Step 8. Perform CDICP to renew the candidate solution locations using Equations (20) and (21) for these solutions;
Step 9. The fitness values of the solution before the perturbation are compared with the solution fitness values after the perturbation, and the location of the current candidate solution is renewed by selecting the location corresponding to the smaller fitness value;
Step 10. Renew all candidate solutions with Equation (15);
Step 11. The PAS is executed to refresh the candidate solution locations by using Equations (22) and (23) for these solutions;
Step 12. If the fitness value of the existing optimum solution is smaller than the optimum value fbest, then use the fitness value of the existing optimal solution as the new optimum value fbest, and at the same time, make the current optimum solution xbest as the new optimum individual;
Step 13. Judge whether the maximum iterations tmax have been achieved. If yes, carry out Step 14, or, if not, go back to Step 4;
Step 14. Export the optimum solution location xbest and its fitness value fbest.
Figure 3. Flowchart of the IAROA algorithm.
Biomimetics 10 00628 g003
Corresponding to the above procedures, Algorithm 1 gives the pseudo-code of the IAROA algorithm. The flow diagram of IAROA is depicted in Figure 3.
Algorithm 1: IAROA algorithm
Biomimetics 10 00628 i001

2.3. Time Complexity of the IAROA Algorithm

The computational complexity of IAROA is affected by the population size n, the individual dimensions and the maximum iterations. The procedures relevant to this value in IAROA include the population initialisation O(INI), the position retrieval formula O(PRF) in IAROA, the population-based operations O(PBO) of IAROA, the elite dynamic opposite learning strategy O(EDO), the Cauchy distribution inverse cumulative perturbation strategy O(CDICP), the dimension learning-based hunting search strategy O(DLH), and pheromone-adjusted strategy O(PAS). The specific computational procedure is as follows:
O ( I A R O A ) = O INI + O P U F + O P B O + O E D O + O C D I C P + O D L H + O P A S = O ( n d + n d ) + O T n d + O T n d + O T n d + O T n d + O 0.3 T n d / 2 = O ( n d + 2.15 T n d )

2.4. Test Functions and Comparison Algorithms

In this section, fifteen intelligent optimisation algorithms, including AROA, are simulated and the results are evaluated to assess the performance of IAROA using the 30/50/100 dimensional CEC2017 test set. There are four major groups: the first group mainly selects intelligent algorithms that have been cited with high frequency in experimental applications, such as Marine Predators Algorithm (MPA, 2020) [29], Equilibrium Optimizer (EO, 2020) [30], Sparrow Search Algorithm (SSA, 2020) [31], and Grey Wolf Optimizer (GWO, 2014) [32]; and the second group mainly focuses on the ones that raised in the recent years as better intelligent optimisation algorithms: Archimedes Optimization Algorithm (AOA, 2020) [33], African Vulture Optimisation Algorithm (AVOA, 2021) [34], Dung Beetle Optimizer (DBO, 2022) [35], and Nutcracker Optimisation Algorithm (NOA, 2023); and the third group is mainly selected to be high-performance as well as highly competitive in the CEC competitions, such as LSAHDE-cnEpSin [36] and LSHADE-SPACMA [37]; the fourth group mainly selects the classical algorithm, Particle Swarm Optimisation Algorithm (PSO, 1995) [38] with the improvement algorithms of the three representative ones: the SRPSO [39], the XPSO [40], and the TAPSO [41]. The parameter settings of the algorithms employed in the experiment are presented in Table 1.

2.5. Analysis of Optimisation Results Under the CEC2017 Test Set

The IEEE International Conference on Evolutionary Computation (IEEE CEC) is a seminal conference in the field of evolutionary computation that fairly assesses the optimisation performance of algorithms by holding optimisation competitions. In these competitions, all novel evolutionary algorithms and population-based algorithms are tested using a uniform single-objective benchmark problem.
CEC2017 is a competition held in 2017, the core of which is to provide a set of test function sets for multimodal optimisation problems to assess and to contrast a variety of evolutionary algorithmic performance designs. The test function set mainly consisted of 29 test functions (the F2 has been officially deleted due to stability issues). The test set consists of four types:
(1)
Single-peak shift-rotation functions (F1 and F3) have a global unique optimal solution and are ideal tools for inspecting algorithm development capabilities.
(2)
Multi-peak shift-rotation functions (F4–F10) have multiple local optimum solutions and are suitable for testing the discovery ability of the algorithms.
(3)
Hybrid functions (F11–F20) enable a comprehensive assessment of the algorithm’s ability to trade off between development and discovery due to their complex mathematical spatial properties.
(4)
Composite functions (F21–F30) incorporate the hybrid function as a basic function.
In all the comparison tests, to make a reasonable comparison of the properties of the algorithms, we set up a uniform group of base parameter configurations: population scale n set to 100, maximum iterations T set to 1000, upper bound ub set to 100, and lower bound lb set to −100. Every algorithm was operated separately for m = 30, and the results were counted in the table.

2.5.1. Optimisation Accuracy Analysis

Tables S1–S3 exhibits the experimental outcomes of Mean, std, p-value [42], and MR for IAROA and its contrasting algorithms after 30 separate operations on the CEC2017 test set prepared with setup dimensions of 30, 50, and 100, respectively, where the mean of the optimum performer on each function is highlighted in black and bold. Tables S1–S3 have been included in the Supplementary Material.
Combining the experimental results in Tables S1–S3, firstly, for the single-peak shift functions F1 and F3, IAROA’s search accuracy and std are significantly better than the original AROA in all three dimensions. For function F1, IAROA ranks third, second, and fifth in all three dimensions, and its overall performance is slightly inferior to that of the two competition-winning algorithms or MPA. For function F3, IAROA ranks first in all three dimensions.
In the tests of the multi-peak shift rotation function F4–F10, IAROA achieved 4, 6, and 7 first places in 30, 50, and 100 dimensions, respectively. In all three dimensions, the overall performance of IAROA has a more pronounced improvement compared to the original AROA, indicating that the DLH and the CDICP can sustain the large-scale exploration of space by the population in the early part of the iteration and the diversity of the population in the later part of the iteration, which leads to a significant improvement in the stability of IAROA. In the 30-dimensional experiment, IAROA ranks third on function F8, slightly inferior to LSHADE_SPACMA and LSHADE_cnEpSin, and still has room for improvement. As the dimensionality increases, the solving capability of IAROA improves remarkably, indicating that it performs well in handling complicated high-dimensional problems.
In the tests of hybrid functions F11–F20, IAROA achieved 9, 6, and 4 first places on 30D, 50D, and 100D, respectively. On 30D, IAROA does not perform as well as the two competitive ranking algorithms and the MPA algorithm on function F12, though it ranks first in the rest of the function tests. When the dimension is raised to 100D, the performance and stability of the IAROA algorithm are deficient, especially in the test of function F19, where IAROA ranks only fifth, and its performance metrics lag behind those of the two competition-winning algorithms, NOA and the original AROA algorithm.
In the test scenarios of composite functions F21–F30, the IAROA algorithm achieves 5, 8, and 9 first places under 30, 50, and 100D, respectively. In all three dimensions, IAROA has a significant advantage over the original AROA algorithm in terms of solution accuracy and std. In the 30D function test, IAROA’s metrics do not perform as well as the LSHADE_SPACMA algorithm or the LSHADE_cnEpSin algorithm on three functions. And in functions F26 and F27, IAROA’s mean and std are not as good as the MPA algorithm. When the dimension is raised to 50D, IAROA underperforms only on functions F25 and F26, while ranking first in the rest of the functions tested. In the 100D function F28, IAROA ranks second, behind the LSHADE_SPACMA algorithm. However, in the other function tests, IAROA outperforms all the algorithms involved in the comparison in terms of mean, best, and std. This is a good indication that when dealing with composite function problems, IAROA is less affected by dimensionality changes than the other compared algorithms. It can maintain competitive optimisation performance even when the function dimension increases and the computational process becomes more complex.
So as to assess whether IAROA has a remarkable enhancement in optimisation performance compared to the other compared algorithms, the Wilcoxon rank sum test [43] was adopted for statistically analysing the results. This test is suitable for judging whether the difference between two algorithms is significant or not. According to the principle of statistics, the null hypothesis can be rejected and the difference is considered significant when the p-value is less than 0.05, a criterion derived from the literature [44]. By contrasting the statistical examination outcomes in Tables S1–S3, we discover that IAROA significantly outperforms the other compared algorithms on most of the tested functions, with a p-value well below 0.05. Only on a very small number of functions is there no remarkable discrepancy between IAROA and the individual algorithms in terms of the solving results. Therefore, it can be drawn that IAROA is substantially different from the other comparative algorithms in terms of optimisation outcomes, and its optimisation finding is substantially better.

2.5.2. Convergence Analysis

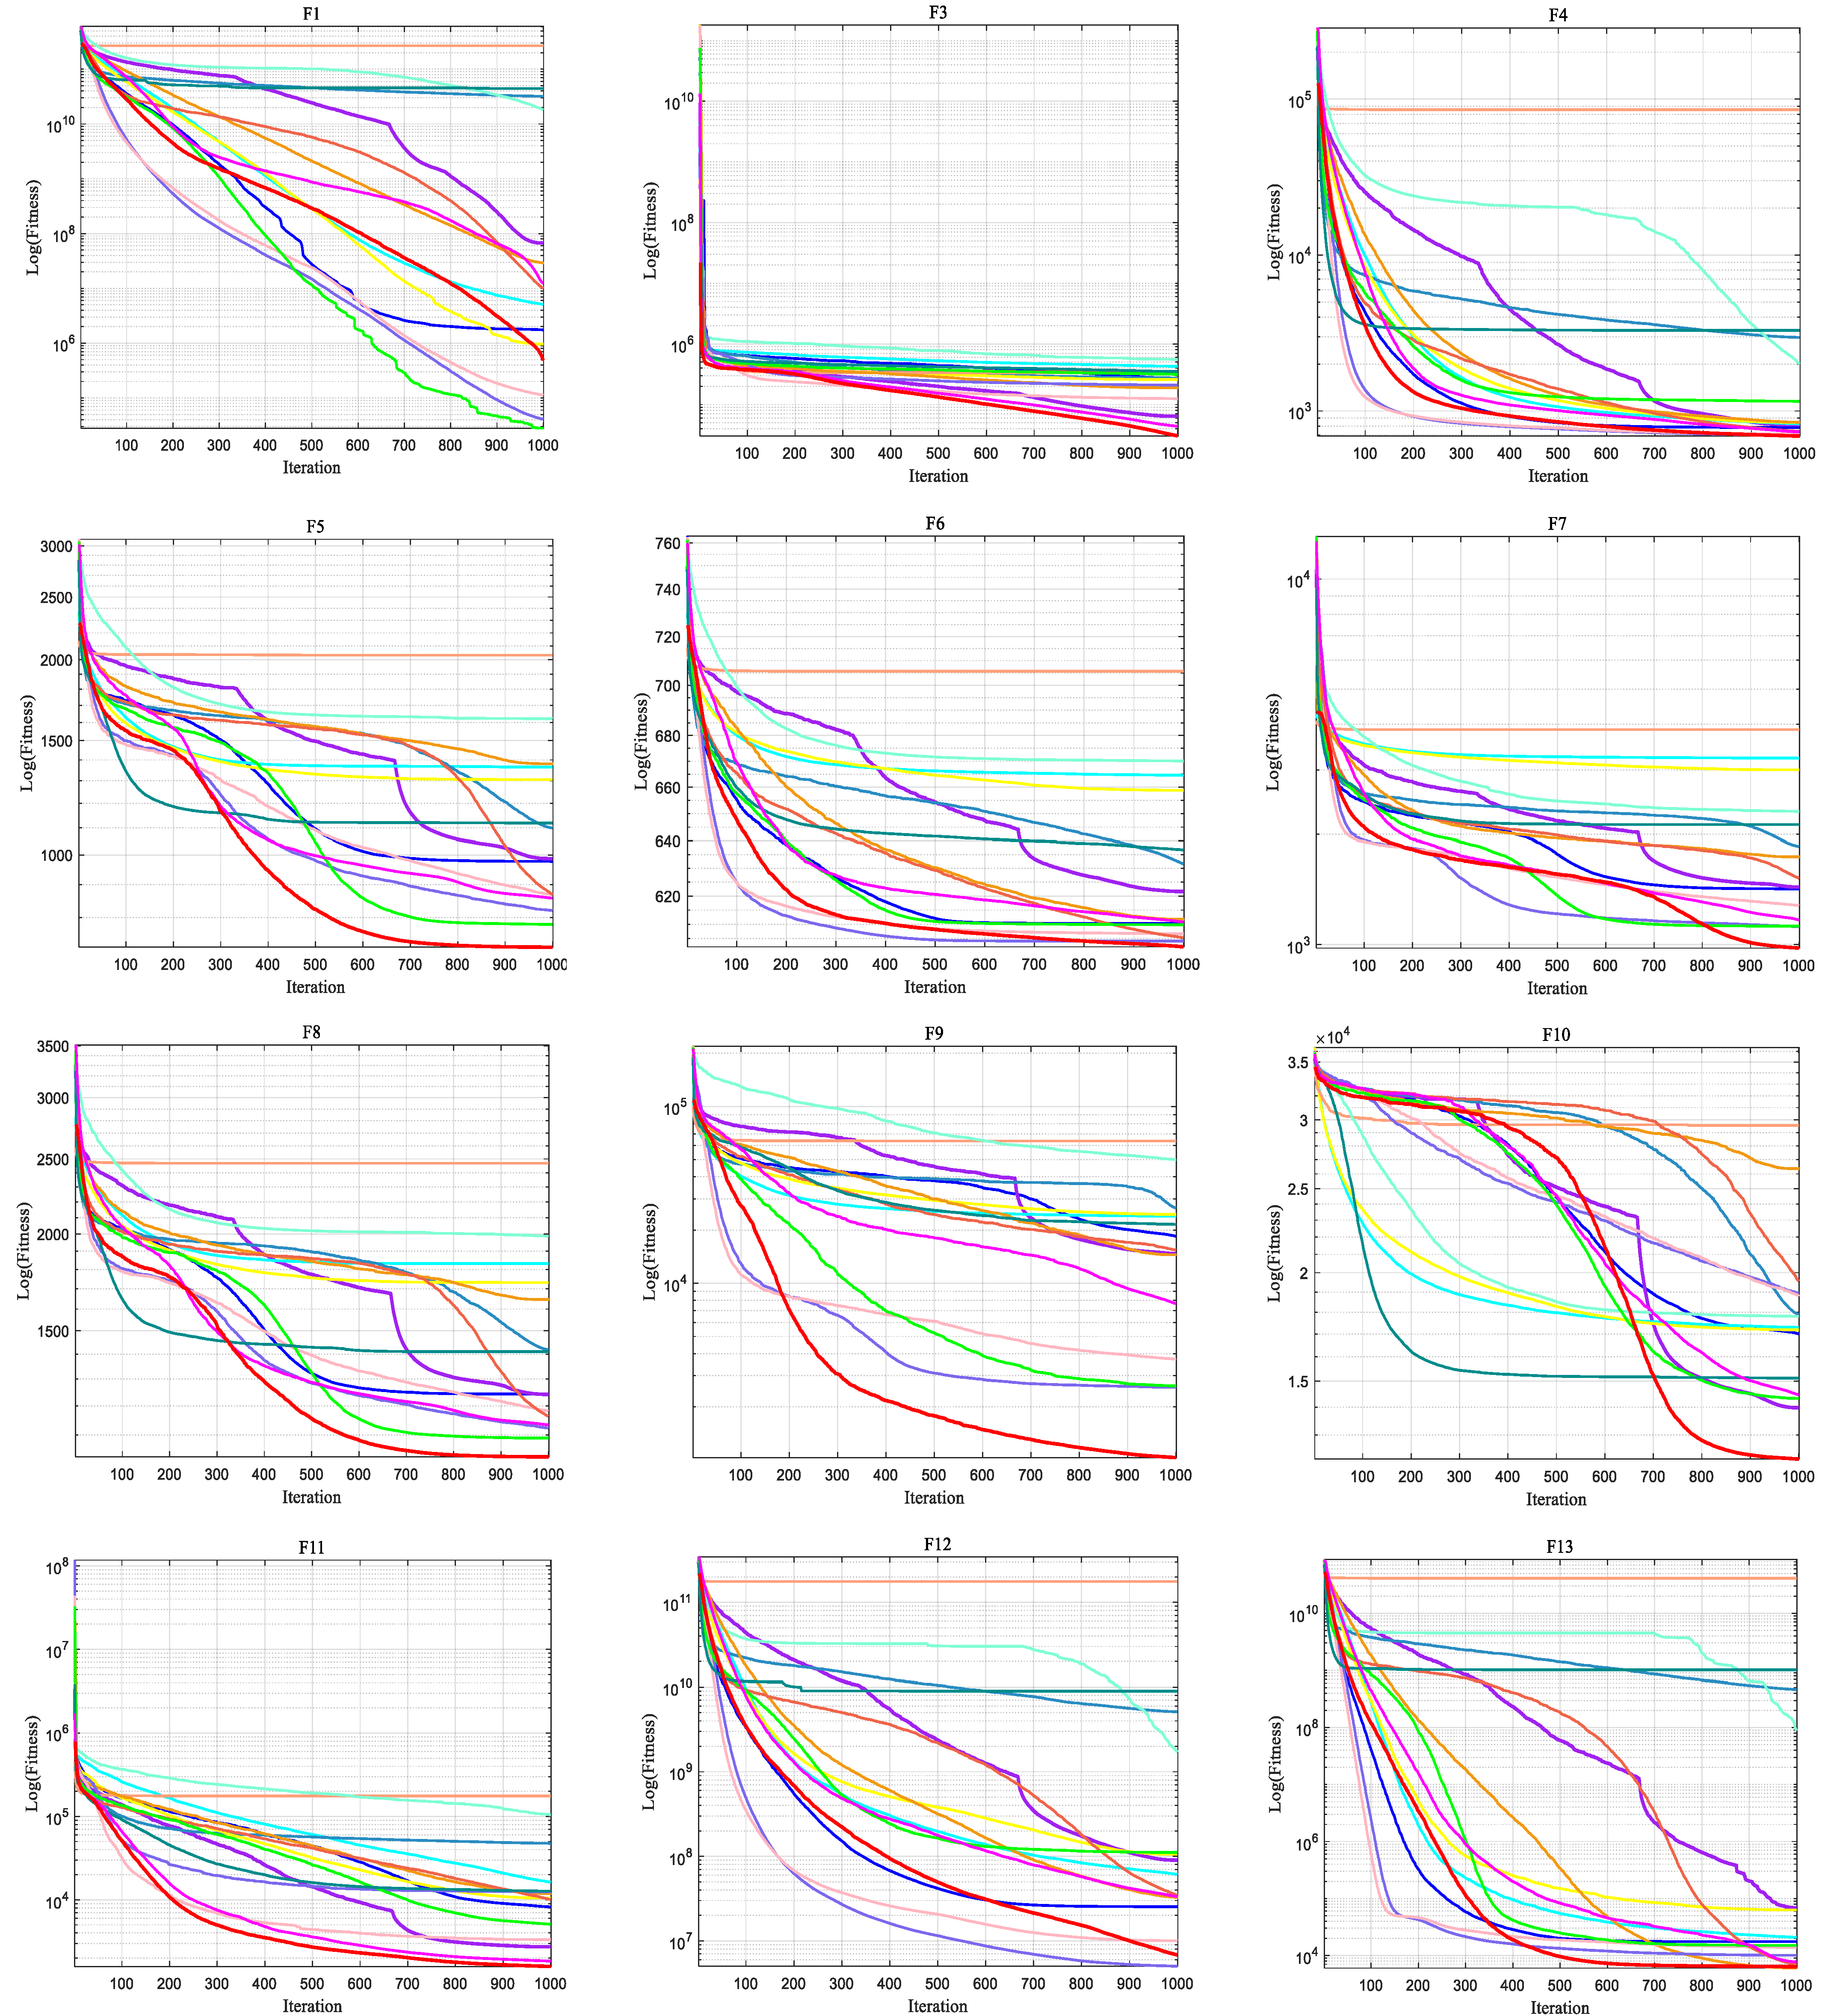
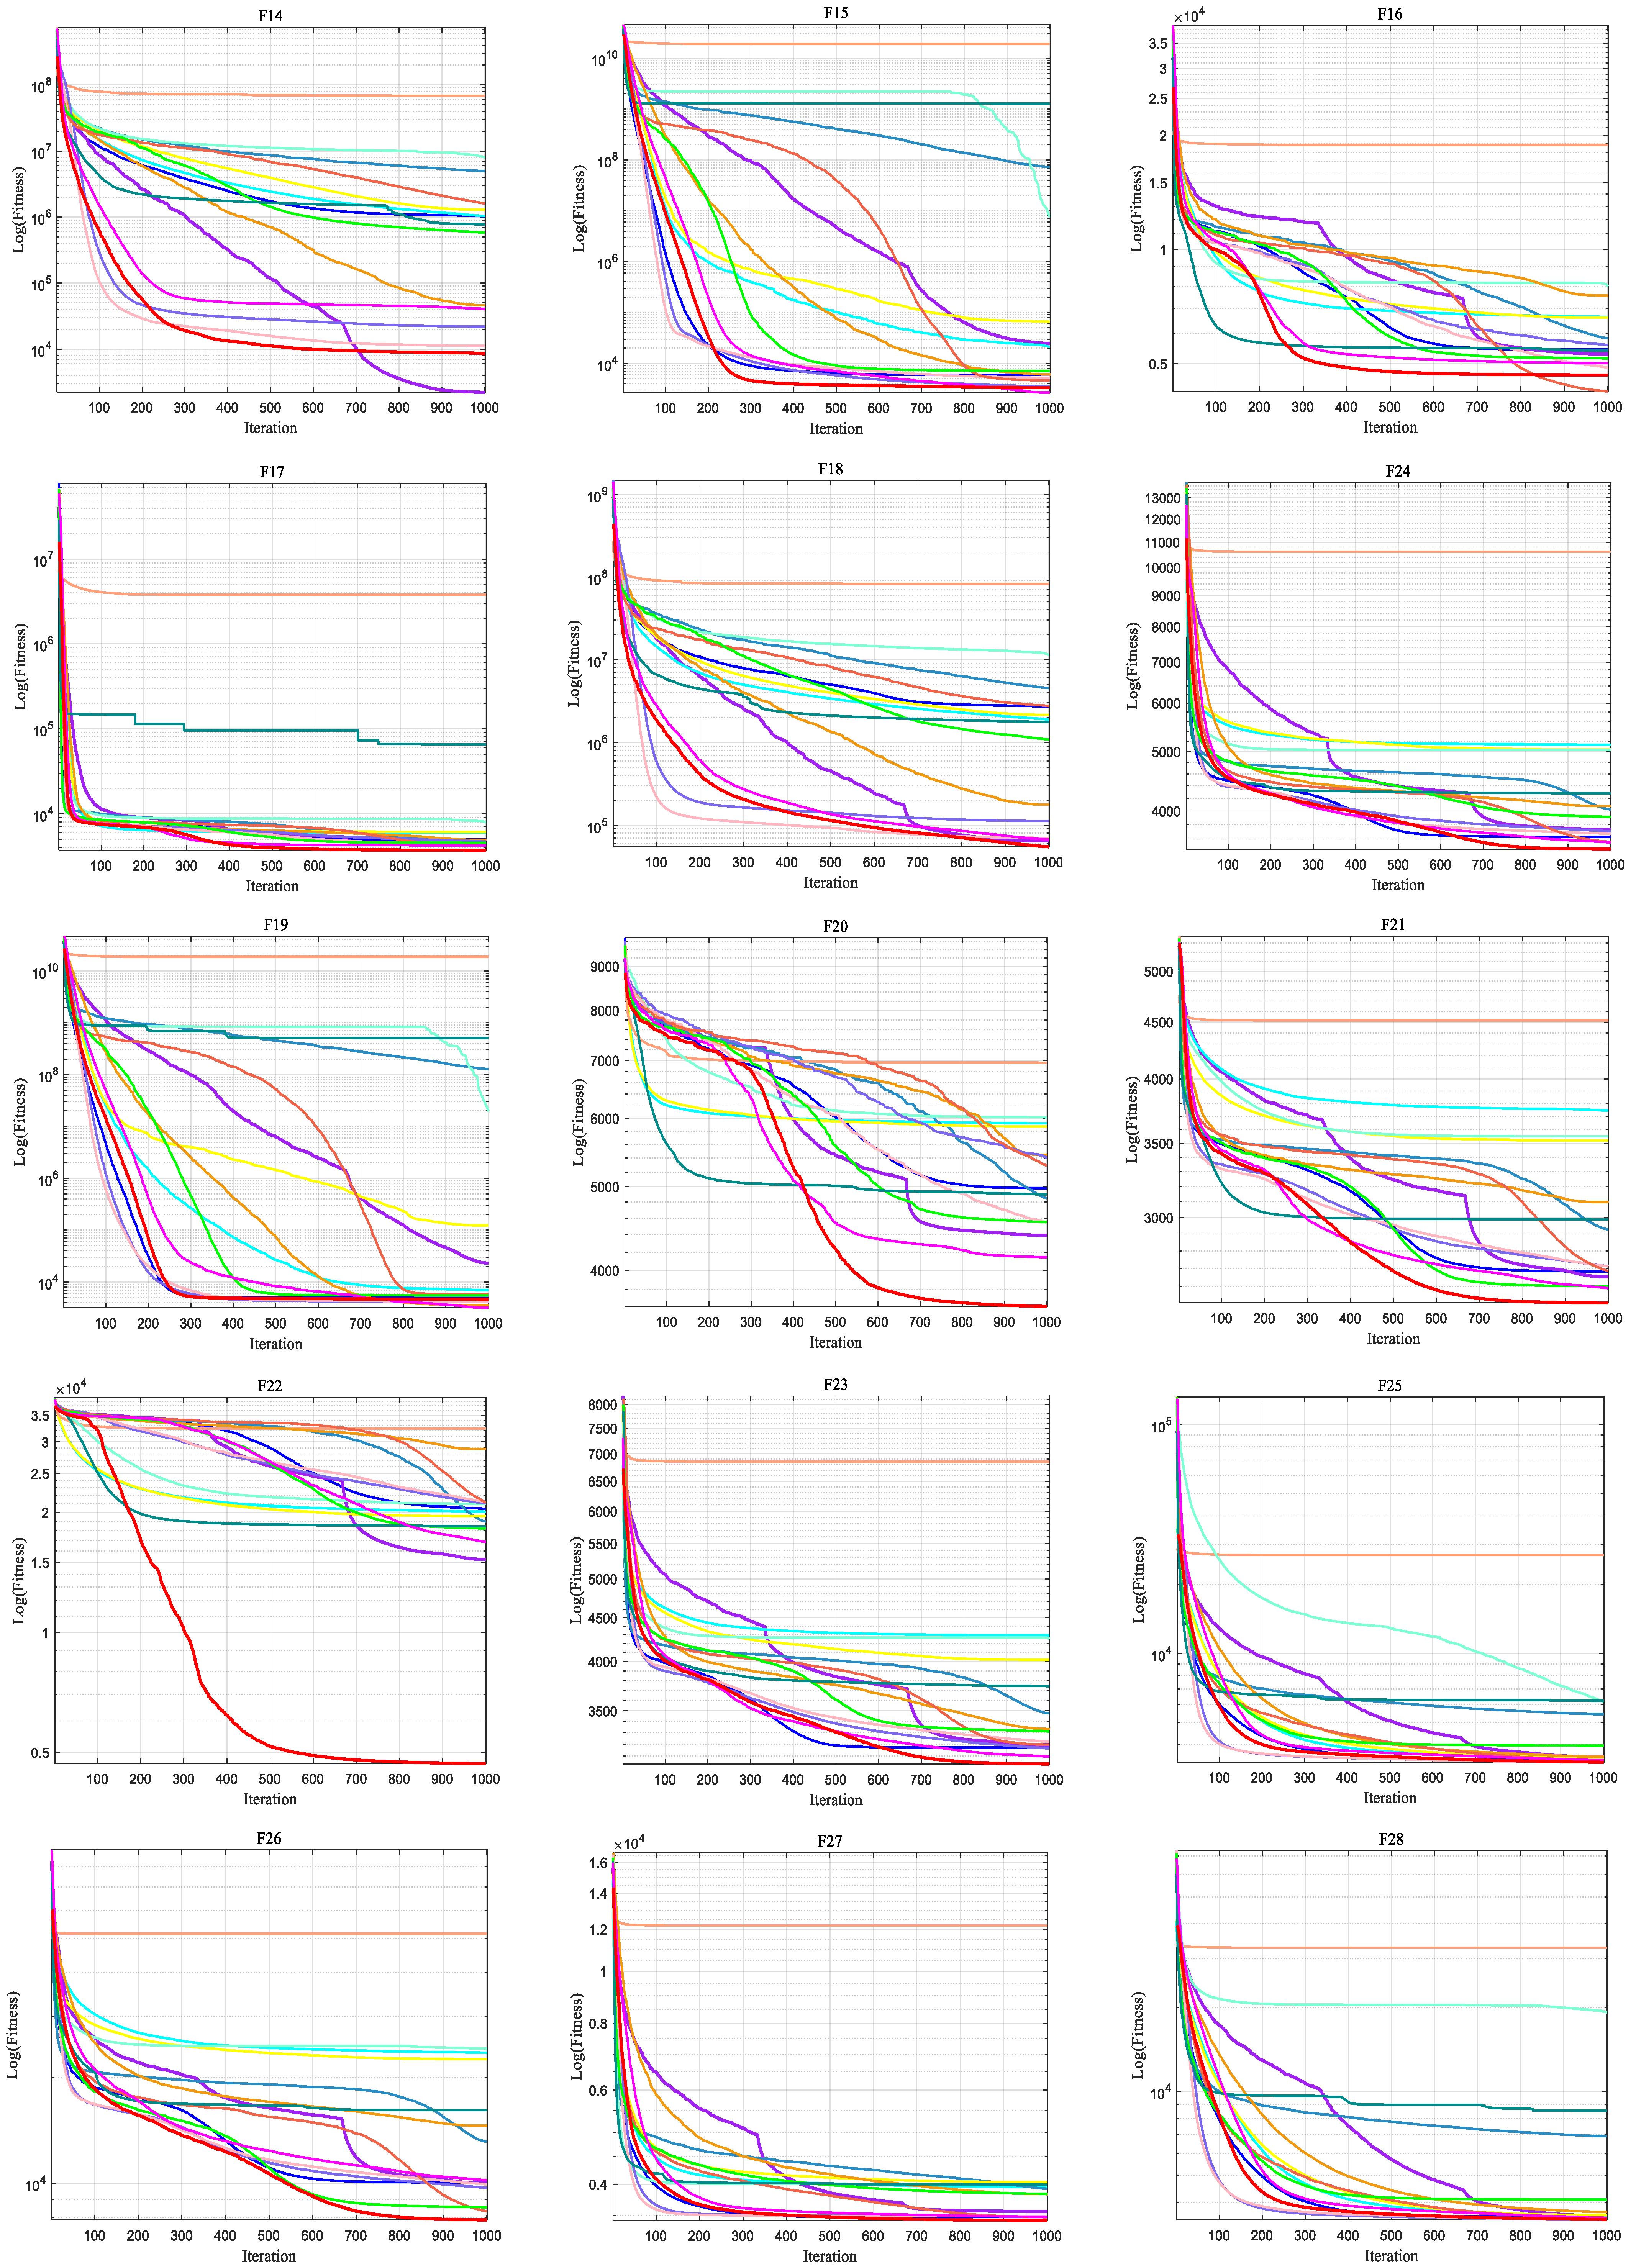
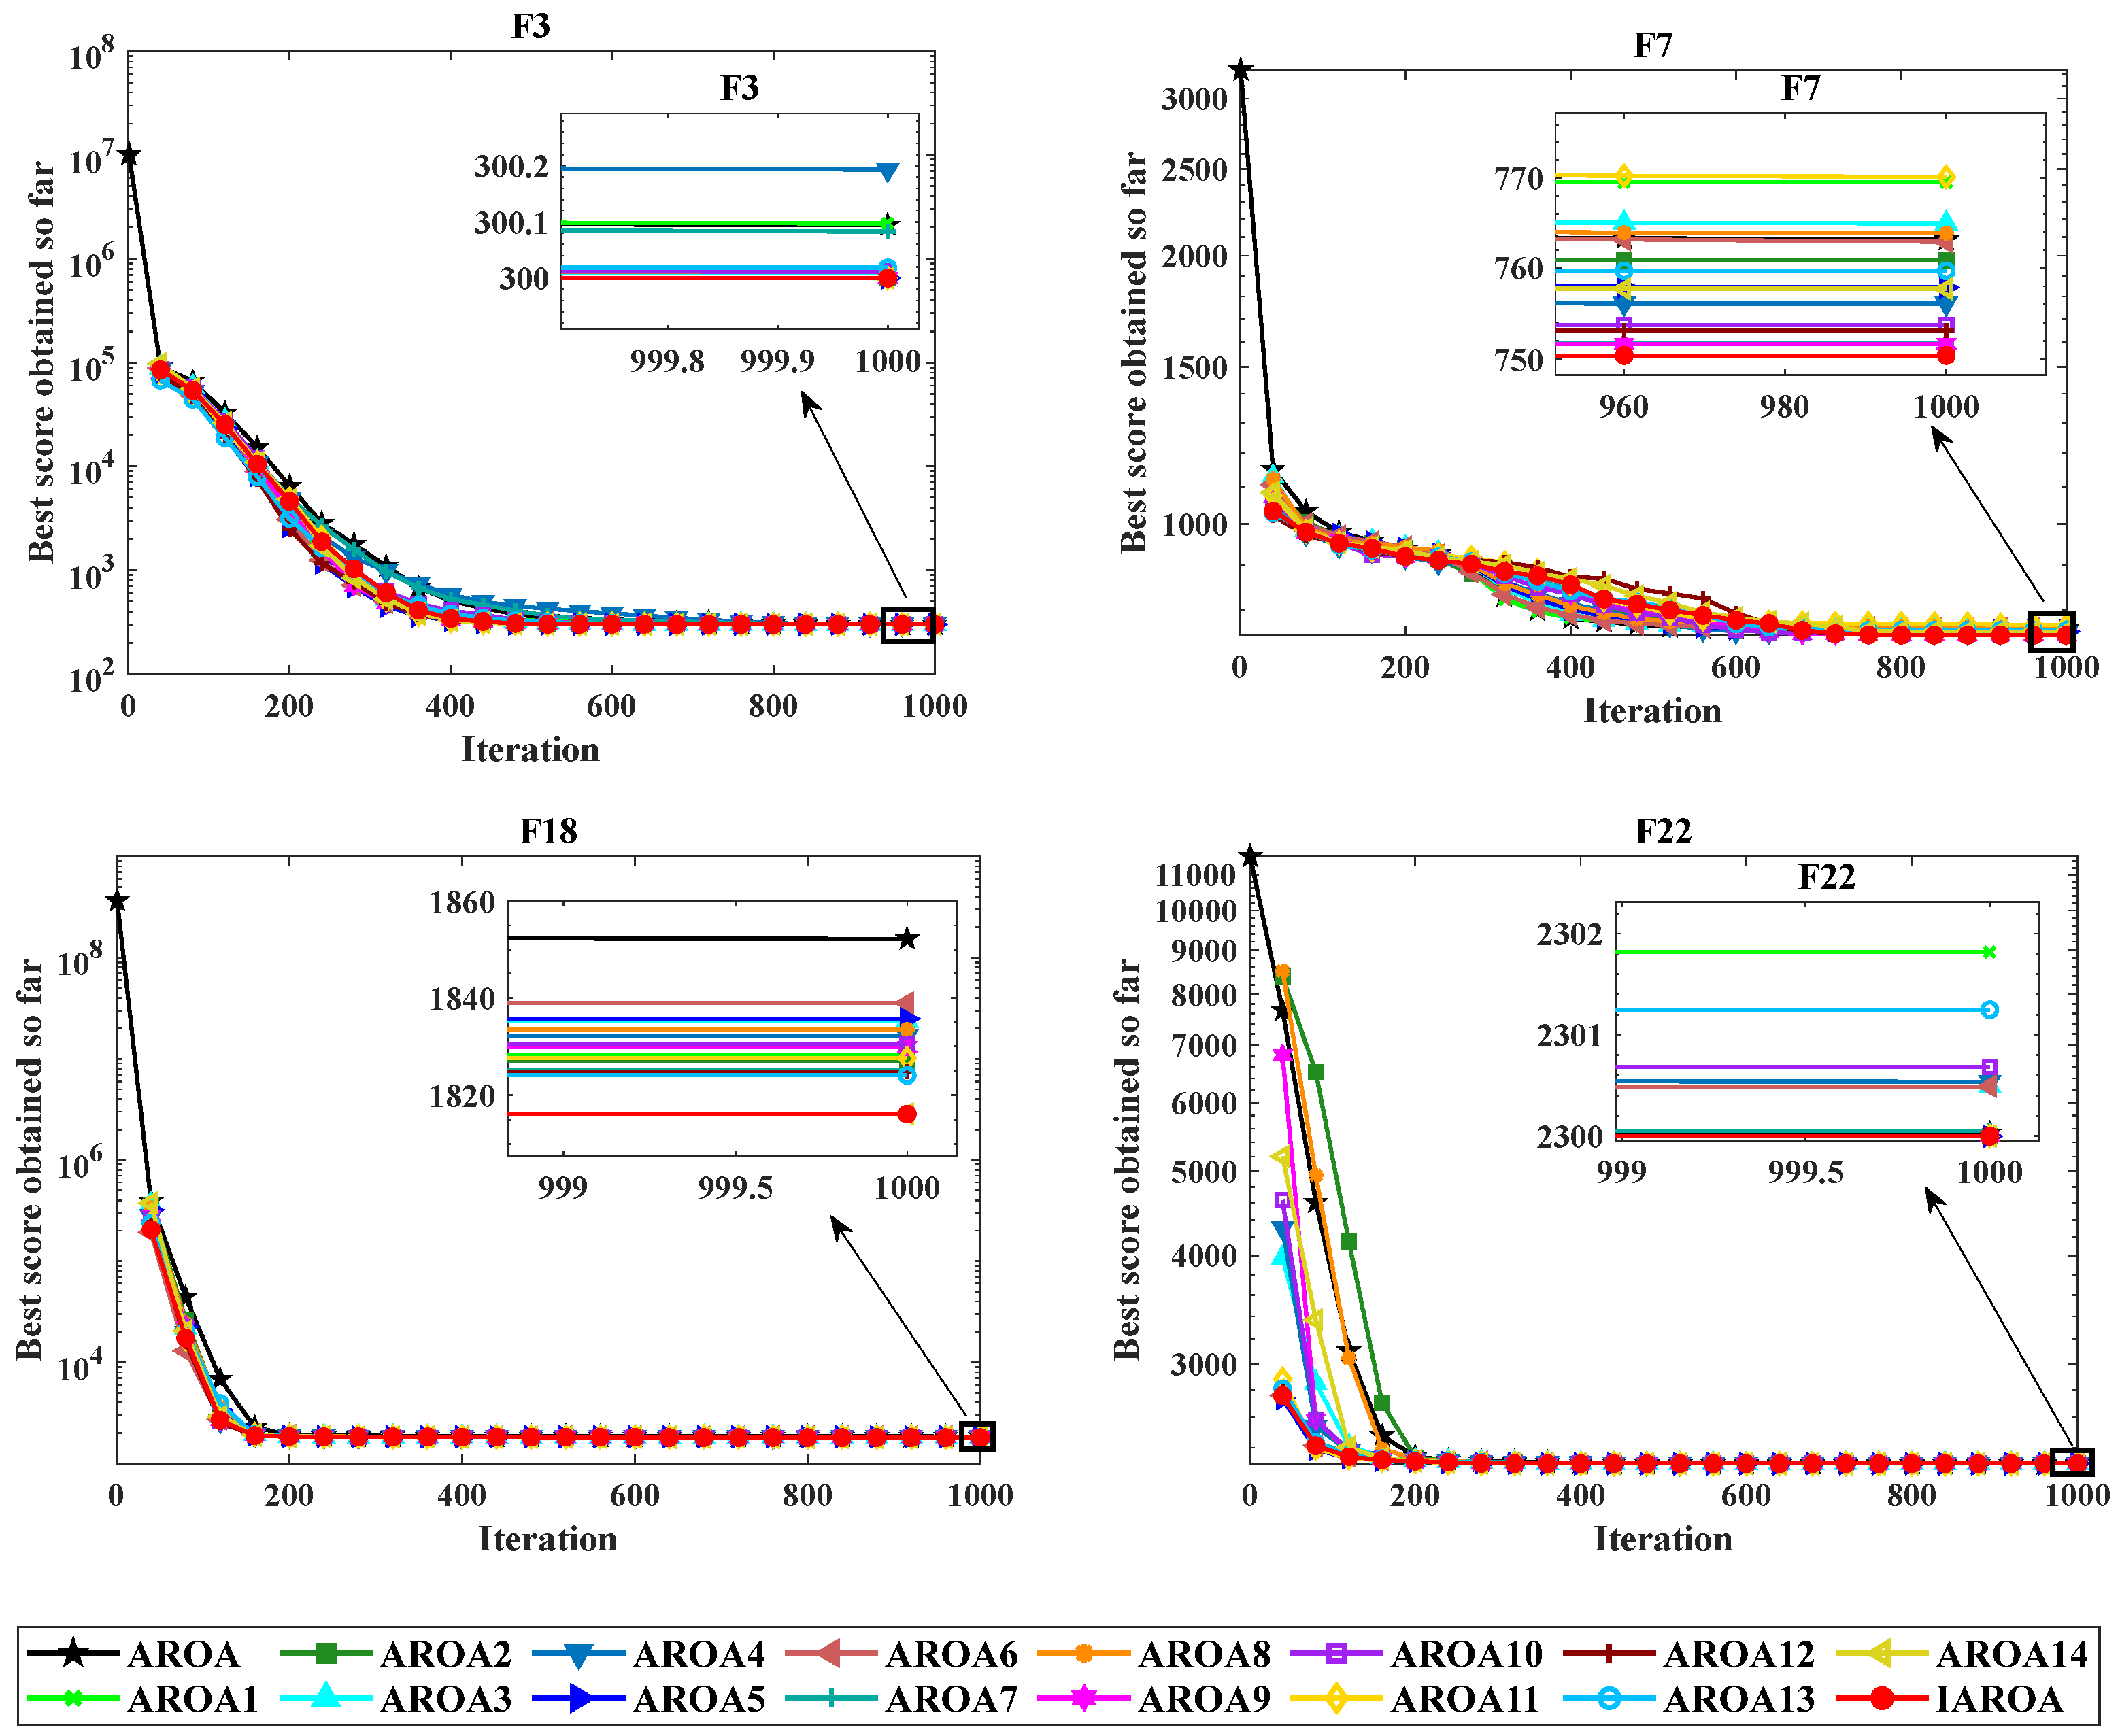
Mean and std can only display the optimisation precision and stability of the algorithm. However, the convergence speed of the algorithm during the iteration procedure can only be revealed from the convergence curves. Figure 4 displays the mean of IAROA versus the other contrasting algorithms in the 100D CEC2017, with the horizontal coordinate being the iterations and the vertical coordinate being the logarithm of the fitness.
Figure 4 presents the convergence curves of IAROA with other comparison algorithms in the 100D CEC2017 test set environment. By observing this figure, it can be seen that in most of the function tests, IAROA shows fast convergence throughout the search process and achieves the lowest convergence accuracy, which fully demonstrates that IAROA has excellent global search capability. From the convergence curves of the multi-peak shift rotation functions F4–F10, IAROA is able to reach a stable convergence state for these tested functions quickly, which reflects the good convergence ability of the algorithm. In particular, the convergence curves of IAROA for the functions F3, F5, F7–F10, F20–F22 show a “steep” shape, which indicates that IAROA has a strong ability to remove local optima. In addition, for the hybrid functions (F11–F20) and the composite functions (F21–F30), although the convergence precision of IAROA on F12–F16, F19, and F28 is only slightly improved compared with the AROA, there is still the problem of falling into local optimums, which leads to the problem of premature convergence.

2.5.3. Box Plot Analysis

A box-and-line diagram is a statistical diagram used to present the spread of digits [45]. It features and characterises data through five critical statistics—maximum value, minimum value, median, upper quartile, and lower quartile. In boxplots, data spots that are outside the whiskers (i.e., outside the upper and lower quartiles) are treated as outliers, and these outliers are typically highlighted with specific marker symbols (e.g., circles or asterisks).
In order to better understand the data distribution of IAROA and each comparison algorithm’s outcome on the function solution, box-and-line plots were used to statistically analyse the results, as shown in Figure 5. Figure 5 presents the box-and-line plots of IAROA and each comparison algorithm for the 100D condition of the CEC2017 test set. Although the IAROA box is longer, the distribution of outcomes is wider on some functions. However, in most of the functions, the boxplot box is narrower and the median line is lower, indicating that the optimisation results have a concentrated data distribution, less fluctuation, and superior stability.
Figure 5 presents a radar plot of the IAROA algorithm’s ranking against the other contrasting algorithms, where red shading denotes the IAROA algorithm and the rest of the colours denote the contrasting algorithms. According to the properties of radargrams, the less shadowing area of the colour region signifies the superior performance of this algorithm. It is obvious from the diagram that the shadow area of the IAROA is the smallest in comparison with the other contrasting algorithms, so it can be concluded that IAROA has the best performance.

2.6. Ablation Experiment

In this section, in order to verify whether the four strategies added will have an impact on the original AROA algorithm, the mean value is used as a criterion to carry out ablation experiments on AROA with respect to these four strategies. Among them, Table S4 shows the different variants formed by AROA under the effect of the four different strategies; Table S5 presents the results obtained from the ablation experiments. Figure 6 presents a line graph of the results of some of the ablation experiments. By analysing the data in Table S5, it can be found that the performance of the original AROA is improved after adding different strategies to it. Specifically, the overall performance of the AROA variant with three strategies is better than that of the AROA variant with only two strategies; and the overall performance of the AROA variant with all four strategies is not only better than that of the AROA variant with two strategies, but also better than that of the AROA variant with three strategies, which is an outcome that fully proves that the gradual addition of strategies effectively improves the performance of the original AROA. Tables S4 and S5 have been included in the Supplementary Material.

3. Practice

Engineering design optimisation problems are designed to solve real-life problems by optimising economic indicators and related parameters, and they belong to the type of constrained optimisation problems that are very challenging in the real world. This type of problem is difficult to solve because of the complexity of the objective function and the existence of a large number of constraints. At the same time, the higher the number of design variables and constraints, the higher the computational complexity of the engineering problem. In this study, six engineering design problems with varying degrees of complexity are selected, which allow for a more comprehensive comparative test of algorithm performance and stability. Twelve algorithms, including AROA, were chosen for the experiments and compared with IAROA. When solving these engineering problems, the population size of all the optimisation algorithms is set to 50, the maximise number of iterations is set to 500, and the number of independent runs is set to 30, and the best, mean, worst, and standard deviation of the design results are used as the indexes for evaluating the solving ability of each algorithm. The code for the engineering design can be obtained from this link: https://github.com/jiangziwei9621/IAROA (accessed on 25 August 2025).

3.1. Industrial Chemical Processes

Alkylation Unit
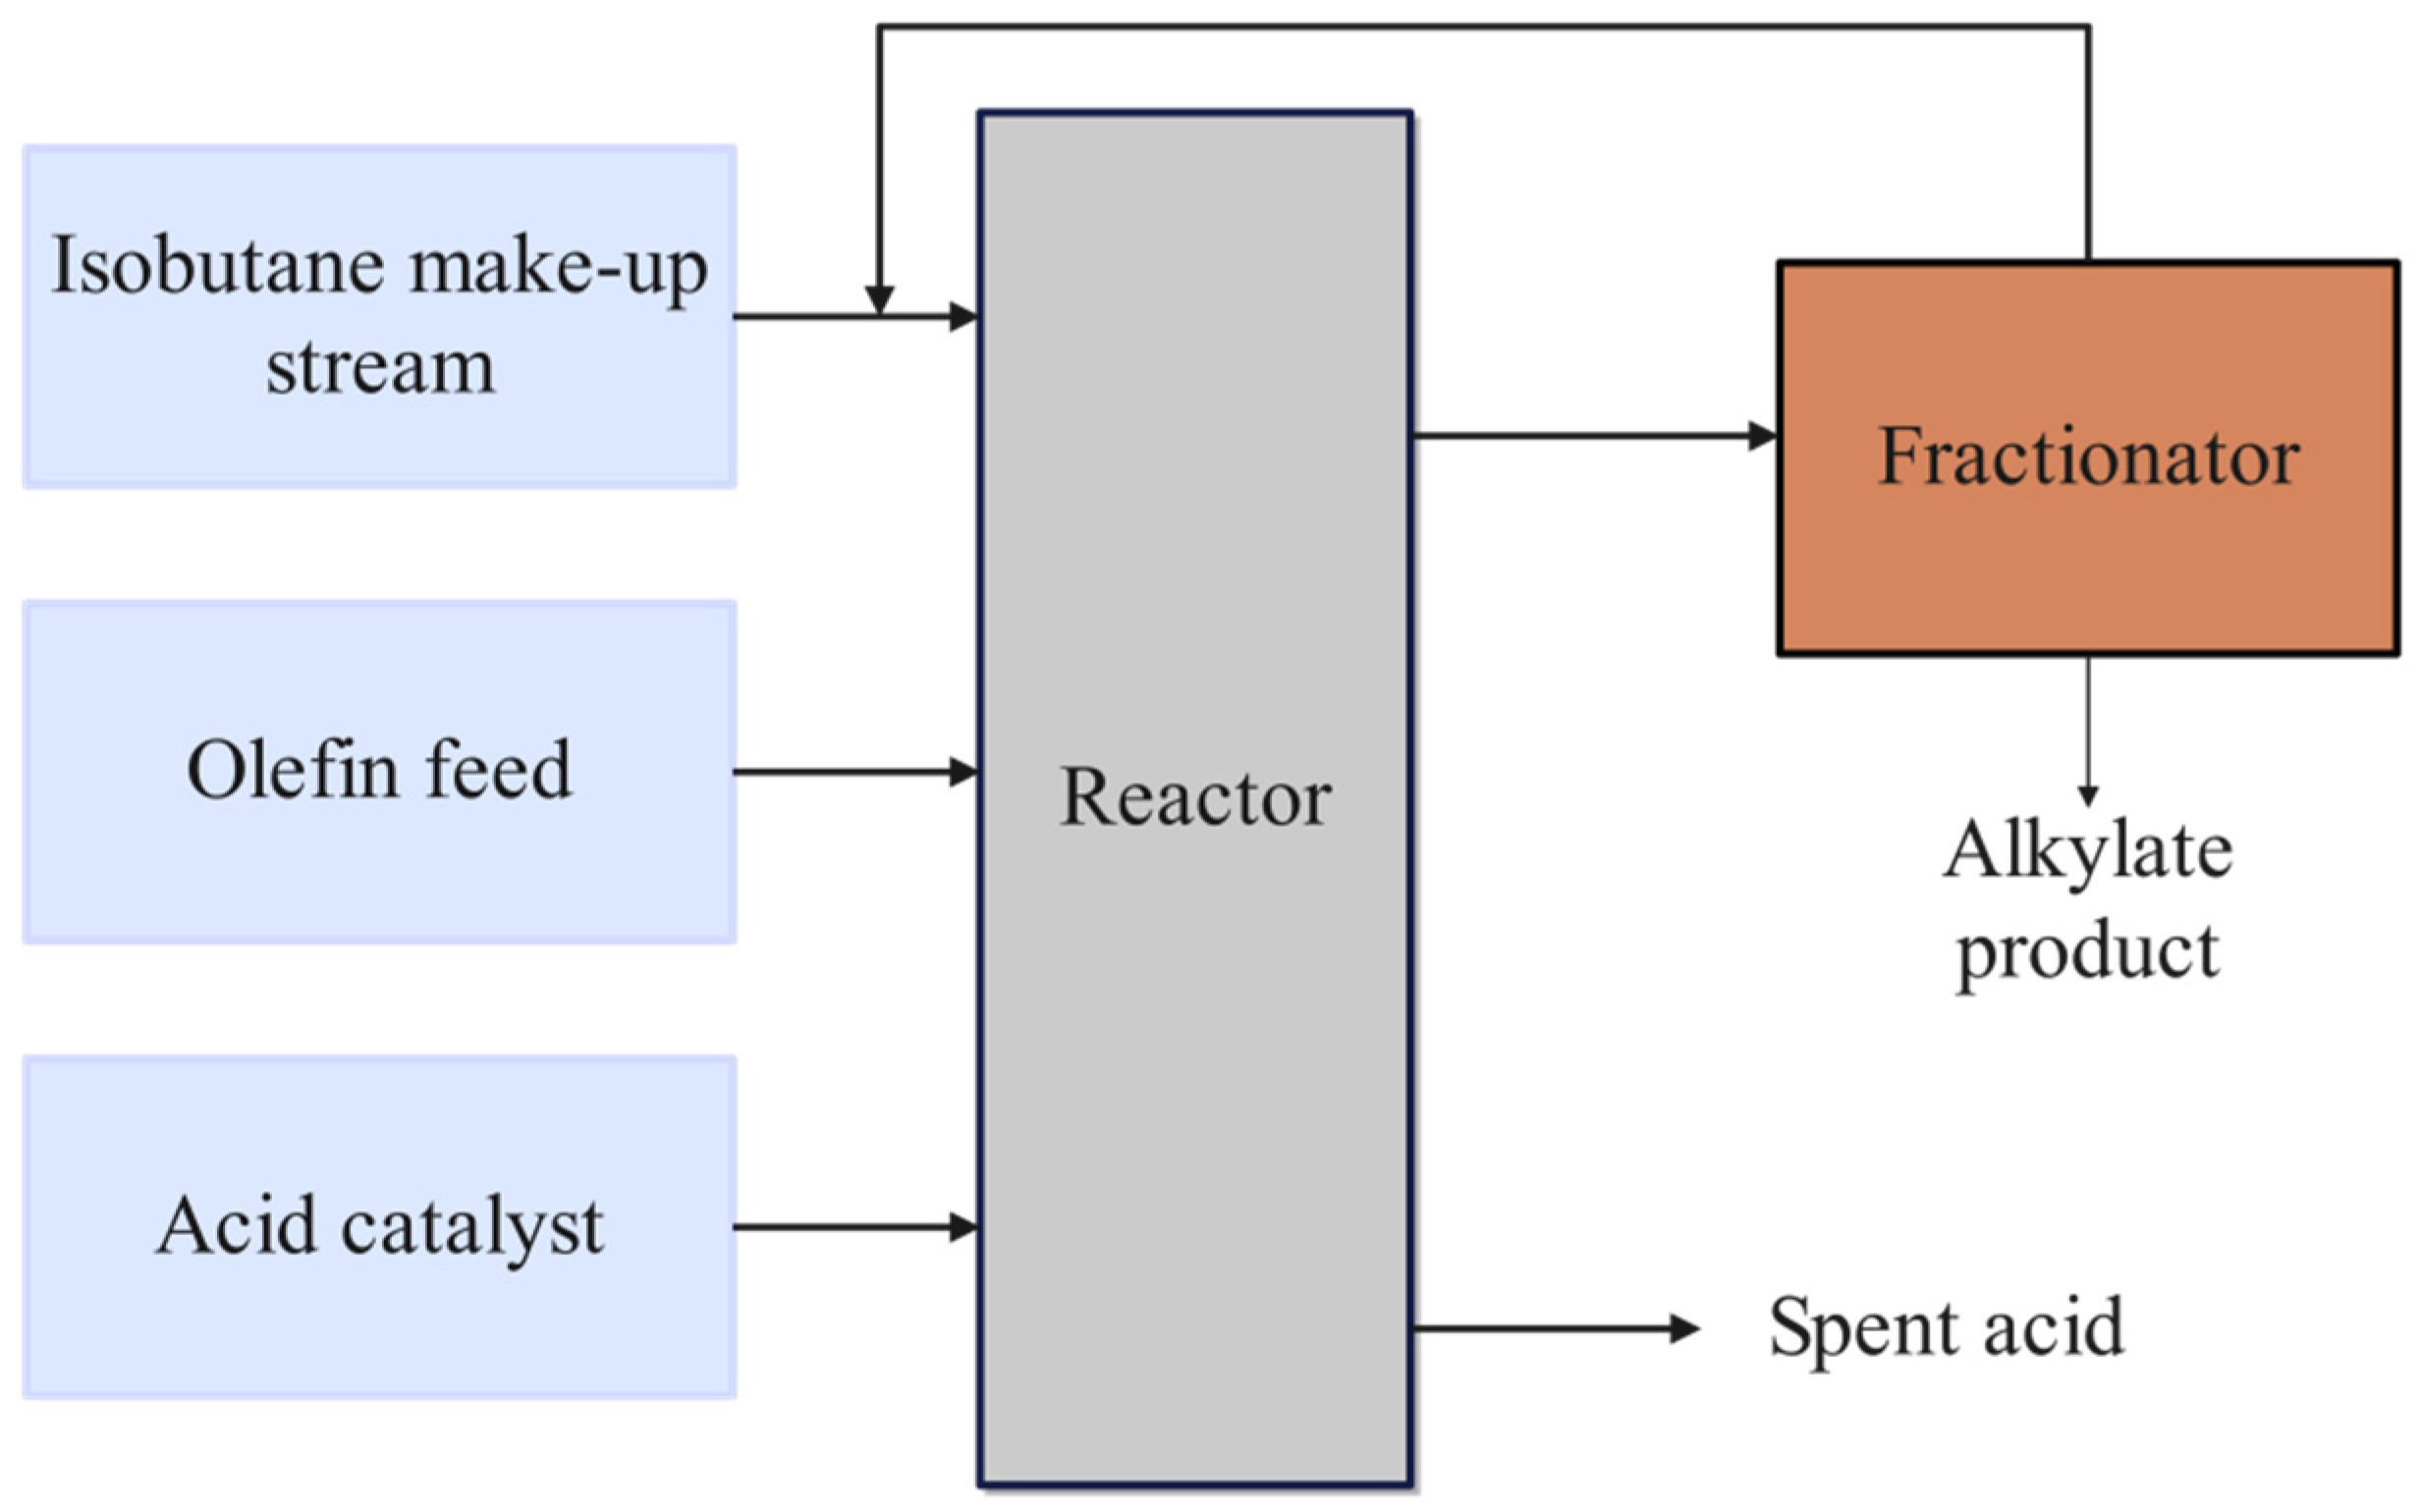
The major purpose of the Alkylation unit is to maximise the octane of the olefin feed in an acidic environment [46], so as to maximise the profit. This target function focuses on the Alkylation output and consists of 7 variables and 14 inequality constraints. The process flow diagram of the simplified Alkylation unit is depicted in Figure 7. The specific operation is illustrated below:
Minimise:
f x = 0.035 x 1 x 6 + 1.715 x 1 + 10.0 x 2 + 4.0565 x 3 0.063 x 3 x 5
Subject to:
g 1 x = 0.0059553571 x 6 2 x 1 + 0.88392857 x 3 0.1175625 x 6 x 1 x 1 0 , g 2 x = 1.1088 x 1 + 0.1303533 x 1 x 6 0.0066033 x 1 x 6 2 x 3 0 , g 3 x = 6.66173269 x 6 2 56.596669 x 4 + 172.39878 x 5 10,000 191.20592 0 , g 4 x = 1.08702 x 6 0.03762 x 6 2 + 0.32175 x 4 + 56.85075 x 5 0 , g 5 x = 0.006198 x 3 x 4 x 7 + 2462.3121 x 2 25.125634 x 2 x 4 x 3 x 4 0 , g 6 x = 161.18996 x 3 x 4 + 5000.0 x 2 x 4 489,510.0 x 2 x 3 x 4 x 7 0 , g 7 x = 0.33 x 7 + 44.333333 x 5 0 , g 8 x = 0.022556 x 5 1.0 0.007595 x 7 0 , g 9 x = 0.00061 x 3 1.0 0.0005 x 1 0 , g 10 x = 0.819672 x 1 x 3 + 0.819672 0 , g 11 x = 24,500.0 x 2 250.0 x 2 x 4 x 3 x 4 0 , g 12 x = 1020.4082 x 2 x 4 + 1.2244898 x 3 x 4 100,000 x 2 0 , g 13 x = 6.25 x 1 x 6 + 6.25 x 1 7.625 x 3 100,000 0 , g 14 x = 1.22 x 3 x 1 x 6 x 1 + 1.0 0 . ,
where:
1000 x 1 2000 , 0 x 2 100 , 2000 x 3 4000 , 0 x 4 100 , 0 x 5 100 , 0 x 6 20 , 0 x 7 200 .
From Table 2, the best and mean of IAROA are both optimum, while the best derived by IAROA is up to the theoretical optimum, which indicates that IAROA has strong competitiveness in the field of industrial chemical process. In addition, the std of IAROA is much smaller than that of other algorithms, which indicates that IAROA has high reliability and robustness compared with other comparative algorithms in solving the problem of optimal operation of an Alkylation plant. From Table 3, the optimal solution vector (2000.0000, 0.0000, 2576.4003, 0.0000, 58.1607, 1.2600, 41.2298), corresponding to the optimal fitness value, is −4529.119739.
Figure 7. Schematic diagram of the Alkylation unit.
Biomimetics 10 00628 g007

3.2. Mechanical Engineering Issues

3.2.1. Speed Reducer
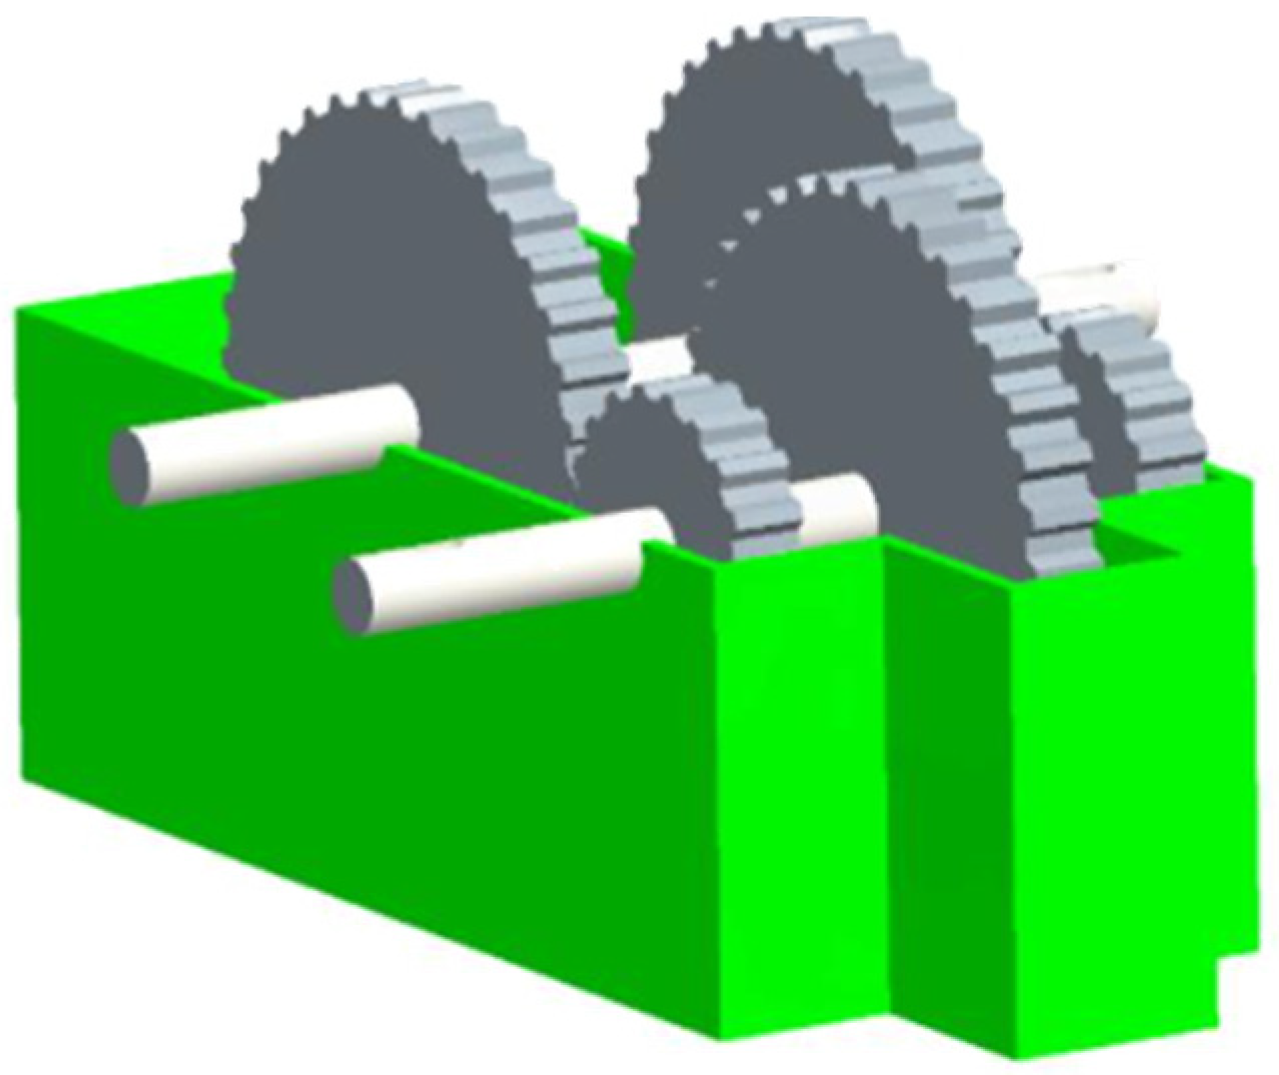
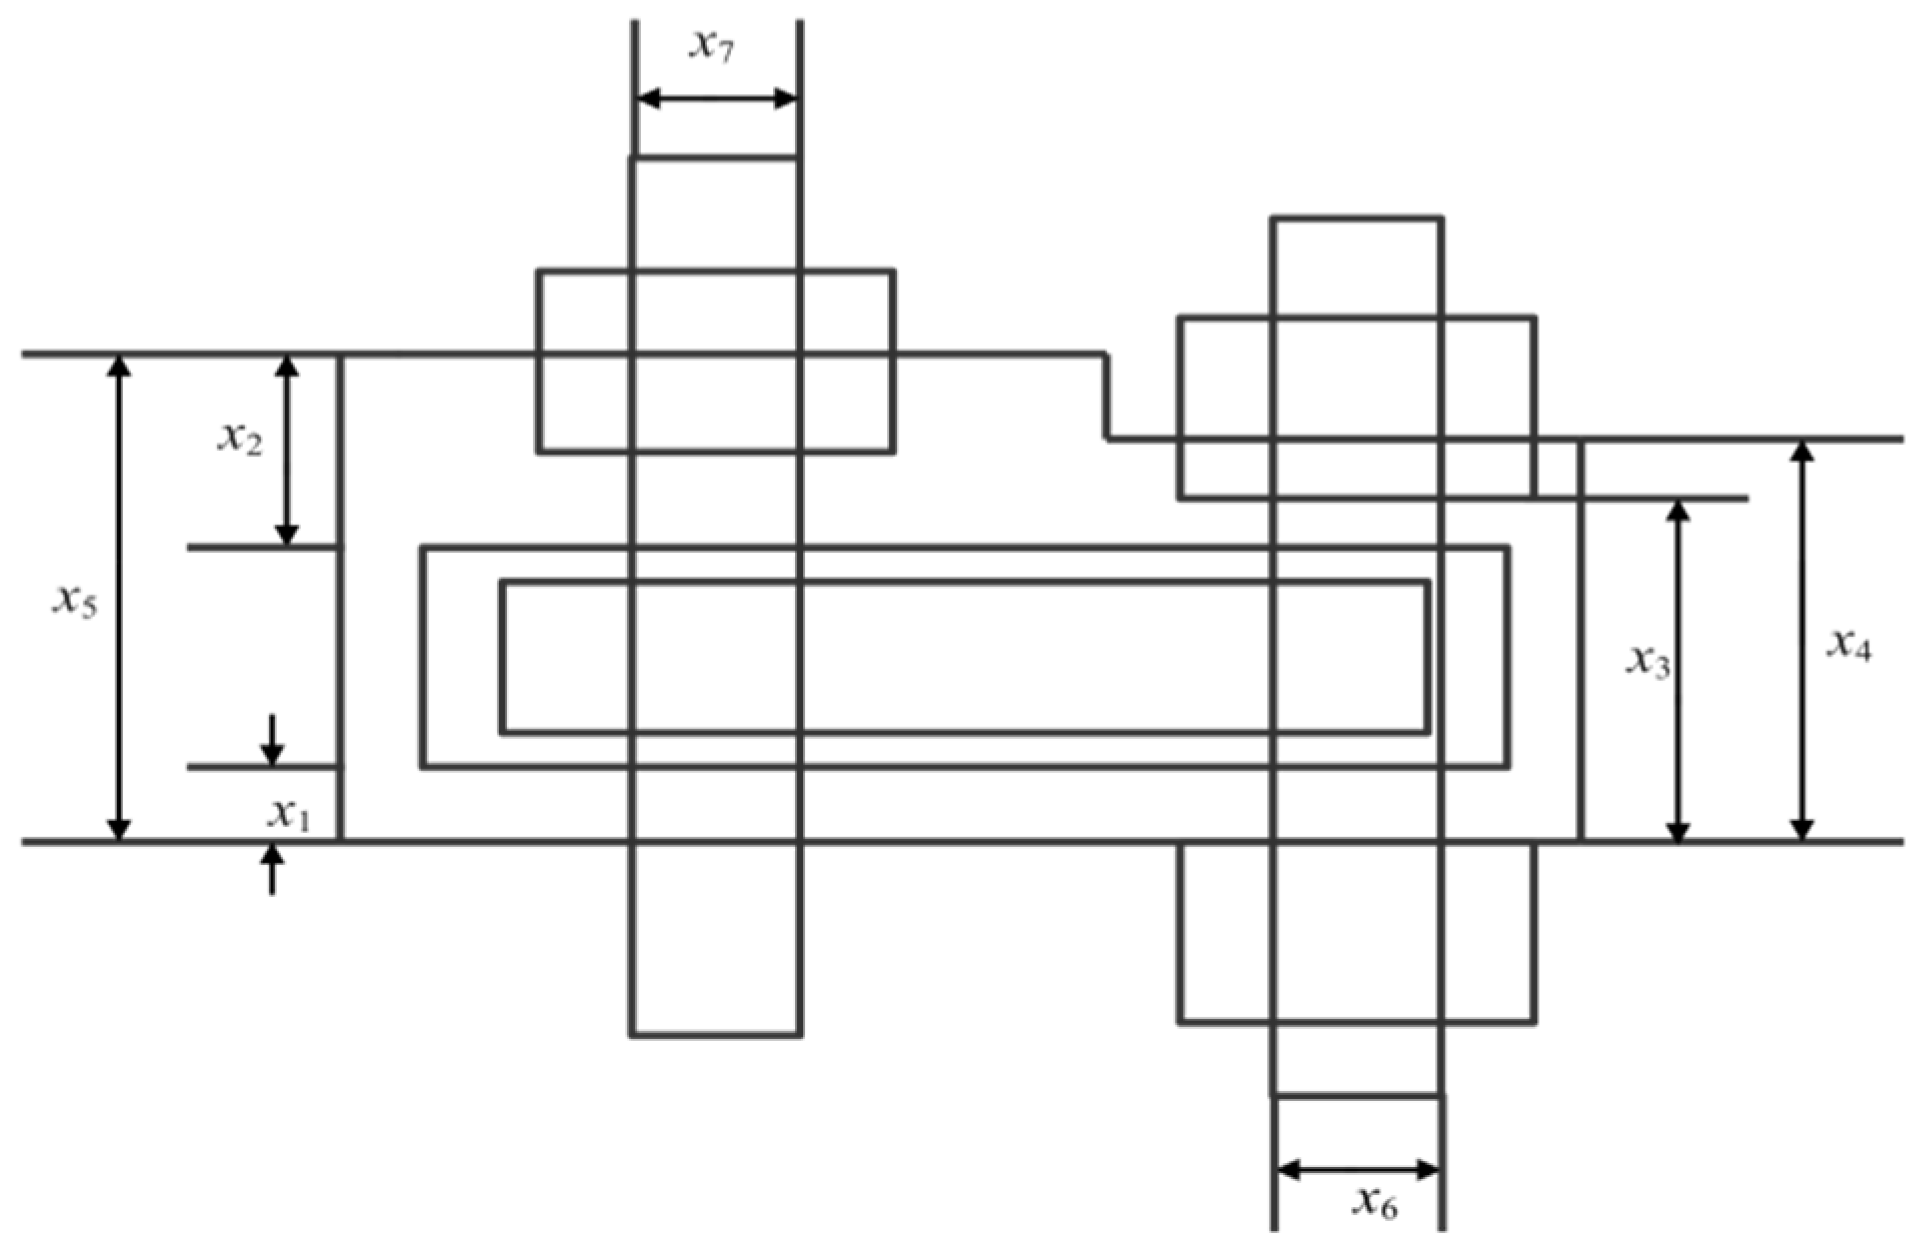
Speed Reducer is a gear between an aeroplane engine and a screw propeller [47], which is one of the essential components of a mechanical transmission system, whose structure is shown schematically in Figure 8. The design optimisation problem of the gearbox refers to the minimisation of the total quality of the gearbox on the basis of meeting the functional requirements of decreasing the rotational speed and raising the torque. The relevant parameters involved include face width x 1 , tooth module x 2 , number of pinion teeth x 3 , length of the first shaft between bearings x 4 , length of the second shaft between bearings x 5 , diameter of the first shaft x 6 , and diameter of the second shaft x 7 , as shown in Figure 9. The specific operation is illustrated below:
Minimise:
f x = 0.7854 x 2 2 x 1 14.9324 x 3 43.0934 + 3.3333 x 3 2 + 0.7854 x 5 x 7 2 + x 4 x 6 2 1.508 x 1 x 7 2 + x 6 2 + 7.477 x 7 3 + x 6 3
Subject to:
g 1 x = x 1 x 2 2 x 3 + 27 0 , g 2 x = x 1 x 2 2 x 3 2 + 397.5 0 , g 3 x = x 2 x 6 4 x 3 x 4 3 + 1.93 0 , g 4 x = x 2 x 7 4 x 3 x 5 3 + 1.93 0 , g 5 x = 10 x 6 3 16.91 × 10 6 + 745 x 4 x 2 1 x 3 1 2 1100 0 , g 6 x = 10 x 7 3 157.5 × 10 6 + 745 x 5 x 2 1 x 3 1 2 850 0 , g 7 x = x 2 x 3 40 0 ,
g 8 x = x 1 x 2 1 + 5 0 , g 9 x = x 1 x 2 1 12 0 , g 10 x = 1.5 x 6 x 4 + 1.9 0 , g 11 x = 1.1 x 7 x 5 + 1.9 0 ,
where:
2.6 x 1 3.6 , 0.7 x 2 0.8 , 17 x 3 28 , 7.3 x 4 , x 5 8.3 , 2.9 x 6 3.9 , 5 x 7 5.5
Figure 8. Schematic diagram of the Speed Reducer.
Biomimetics 10 00628 g008
Figure 9. Schematic diagram of Speed Reducer parameters.
Biomimetics 10 00628 g009
As can be seen from Table 4, IAROA, SSA, DBO, and TAPSO all seek the best optimal and reach the theoretical optimum, but the mean of IAROA is the smallest, which manifests that the entirety quality of solutions obtained by IAROA is high. And the std of IAROA is much smaller than the other algorithms, which indicates that IAROA has strong stability and robustness compared with other comparative algorithms in solving the speed reducer problem. As shown in Table 5, IAROA, DBO, SSA, and TAPSO have similar optimal solution vectors (3.500000, 0.700000, 17.000000, 7.300000, 7.715320, 3.350541, 5.286654), correlating to an optimal fitness value of 2994.424465757.

3.2.2. Industrial Refrigeration System

Modern industry continues to refine the process of development, electronics, pharmaceuticals, and many other industries for the refrigeration environment of the parameters of the control precision requirements. At the same time, the industrial refrigeration system, as a result of industrial energy consumption as a whole, accounted for a high proportion, thus becoming the key to the optimal allocation of energy and precise control. The optimum design problem for industrial refrigeration systems [48,49] can be defined as a nonlinear inequality-bound optimisation question. The question contains 14 parameters (x1~x14) and 15 nonlinear restraints (g1~g14). The specific operation is illustrated below:
Minimise:
f x = 63,098.88 x 2 x 4 x 12 + 5441.5 x 2 2 x 12 + 115,055.5 x 2 1.664 x 6 + 6172.27 x 2 2 x 6 + 63,098.88 x 1 x 3 x 11 + 5441.5 x 1 2 x 11 + 115,055.5 x 1 1.664 x 5 + 6172.27 x 1 2 x 5 + 140.53 x 1 x 11 + 281.29 x 3 x 11 + 70.26 x 1 2 + 281.29 x 1 x 3 + 281.29 x 3 2 + 14,437 x 8 1.8812 x 12 0.3424 x 10 x 14 1 x 1 2 x 7 x 9 1 + 20,470.2 x 7 2.893 x 11 0.316 x 1 2
Subject to:
g 1 x = 1.524 x 7 1 0 , g 2 x = 1.524 x 8 1 0 , g 3 x = 0.07789 x 1 2 x 7 1 x 9 1 0 , g 4 x = 7.05305 x 9 1 x 1 2 x 10 x 8 1 x 2 1 x 14 1 1 0 , g 5 x = 0.0833 x 13 1 x 14 1 0 , g 6 x = 47.136 x 2 0.333 x 10 1 x 12 1.33 x 8 x 13 2.1195 + 62.08 x 13 2.1195 x 12 1 x 8 0.2 x 10 1 1 0 , g 7 x = 0.0477 x 10 x 8 1.8812 x 12 0.3424 1 0 , g 8 x = 0.0488 x 9 x 7 1.893 x 11 0.316 1 0 , g 9 x = 0.0099 x 1 x 3 1 1 0 , g 10 x = 0.0193 x 2 x 4 1 1 0 , g 11 x = 0.0298 x 1 x 5 1 1 0 , g 12 x = 0.056 x 2 x 6 1 1 0 , g 13 x = 2 x 9 1 1 0 , g 14 x = 2 x 10 1 1 0 , g 15 x = x 12 x 11 1 1 0 ,
where:
0.001 x i 5 , i = 1 , , 14
As can be seen from Table 6, IAROA’s best is optimal and reaches the theoretical optimal value, and IAROA’s mean is the smallest in contrast to the others, which means that the overall quality of solutions obtained by IAROA is significantly improved, i.e., IAROA has a more competitive edge in the field of mechanical engineering. However, the std of MPA is smaller than that of IAROA, which indicates that the stability and robustness of IAROA are not sufficient in solving industrial refrigeration problems. From Table 7, the optimal solution vector of IAROA is (0.001, 0.001, 0.001, 0.001, 0.001, 0.001, 0.001, 0.001, 0.001, 1.524, 5.00, 2.00, 0.001, 0.001, 0.001, 0.007293, 0.087556), and the corresponding optimal fitness value is 0.032213002.

3.2.3. Welded Beam Design

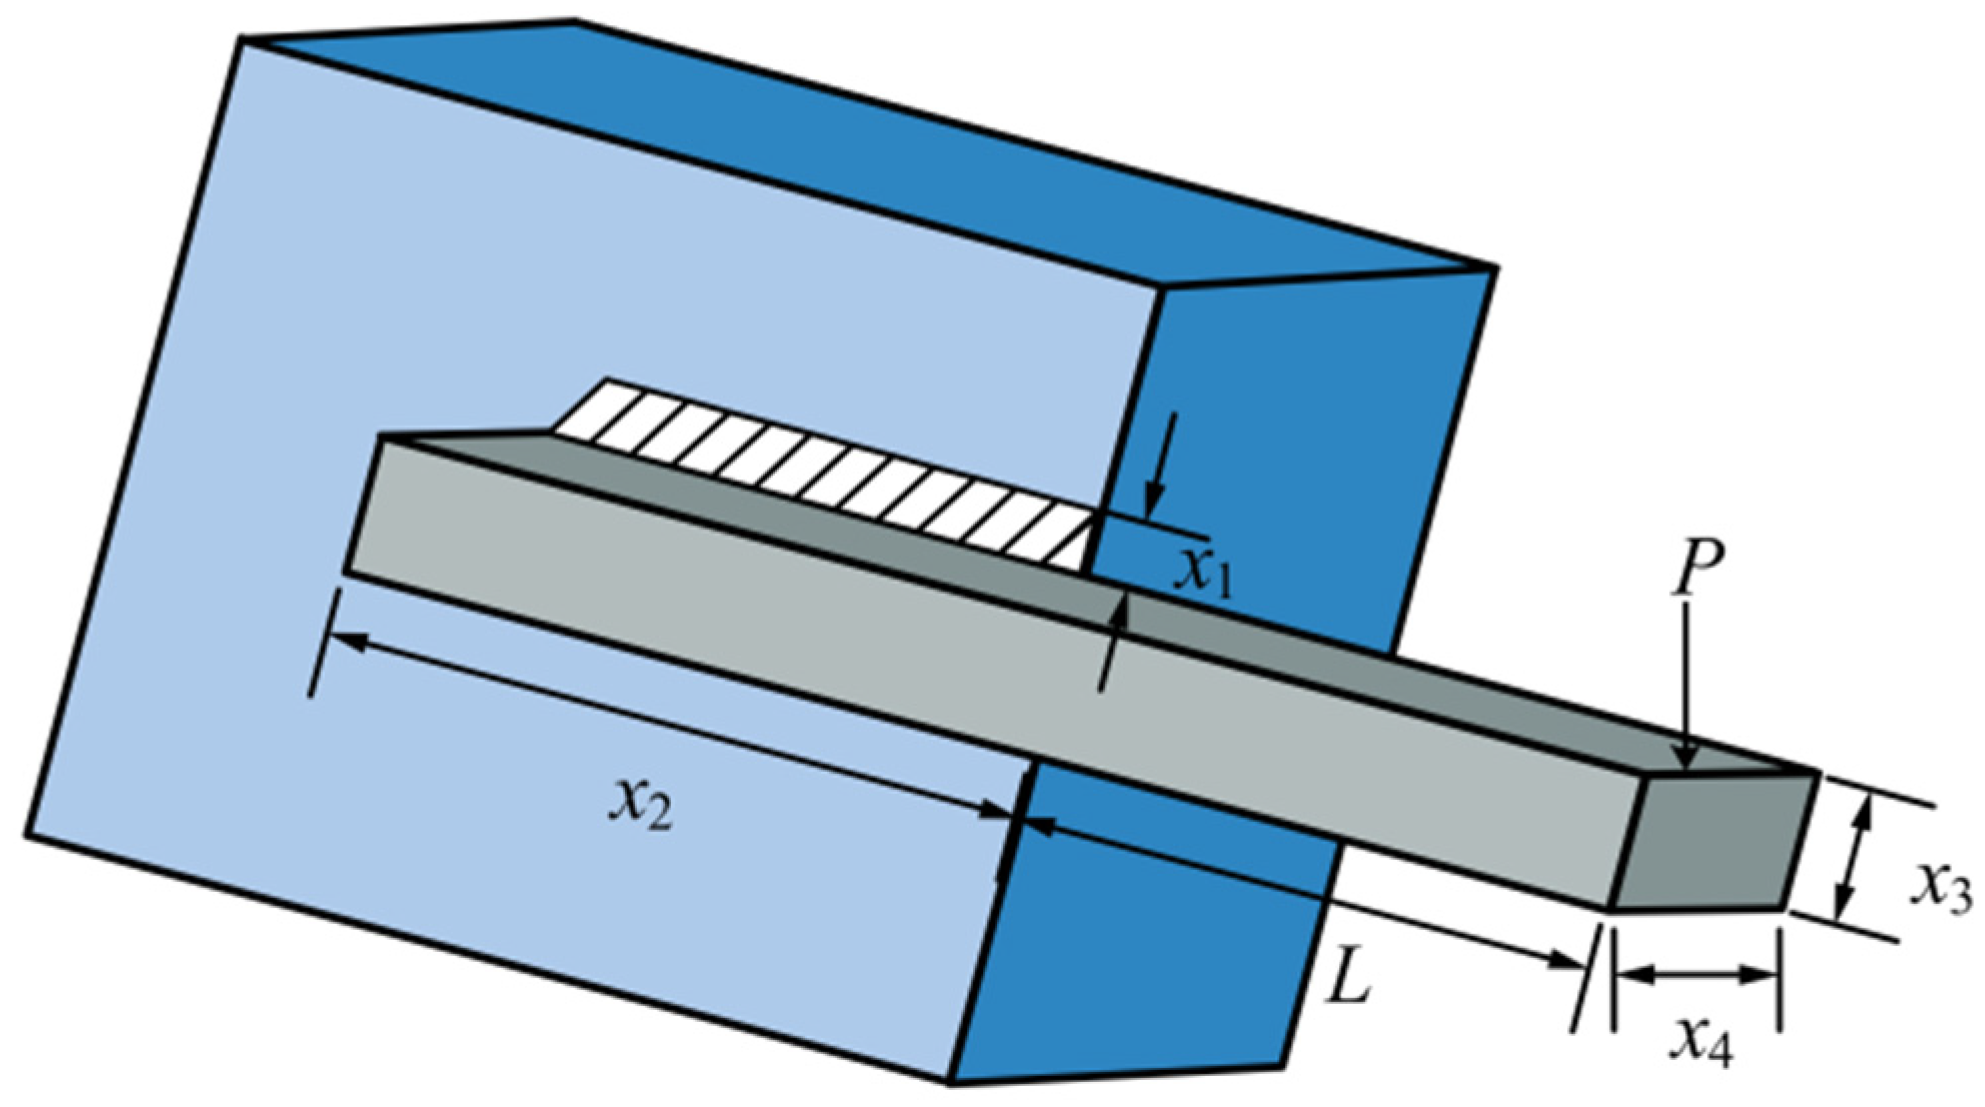
Welded beam problem [50,51], as a typical case of classical optimal design in the field of mechanical and structural engineering, has key practical applications in many aspects such as steel structure design, mechanical manufacturing, and architectural engineering etc. The aim of this problem is to find the solution with the lowest cost under the constraints of specific conditions. The schematic is shown in Figure 10. The optimisation of the welded beam involves four associated design parameters (t,h,l,b) and four nonlinear inequality constraints (g1~g5). The specific mathematical model is shown below:
C o n s i d e r   X = [ x 1 , x 2 , x 3 , x 4 ] = [ t , h , l , b ]
Minimise:
f x = 0.04811 x 3 x 4 x 2 + 14 + 1.10471 x 1 2 x 2
Subject to:
g 1 x = x 1 x 4 0 , g 2 x = δ x δ max 0 , g 3 x = P P c x 0 , g 4 x = τ x τ max 0 , g 5 x = σ x σ max 0 ,
where:
0.125 x 1 2 , 0.1 x 2 , x 3 10 , 0.1 x 4 2
Other parameters are computed as follows:
τ = τ 2 + τ 2 + 2 τ τ x 2 2 R , τ = R M J , τ = P 2 x 2 x 1 , R = x 2 2 4 + x 1 + x 3 2 2 , J = 2 x 2 2 4 + x 1 + x 3 2 2 2 x 1 x 2 , σ x = 6 P L x 3 2 x 4 , δ x = 6 P L 3 E x 3 2 x 4 , P c x = 4.013 E x 3 x 4 3 6 L 2 1 x 3 2 L E 4 G , L = 14 in , P = 6000 lb , E = 30 × 10 6 psi , σ max = 30,000 psi ,
τ max = 13,600 psi , G = 12 × 10 6 psi , δ max = 0.25 in .
As indicated in Table 8, the best, mean, worst, and std of IAROA are all optimal as compared to other contrasting algorithms, and the std of IAROA is much smaller than the other compared algorithms, which suggests that IAROA has much stability and robustness for solving the design problem of welded beams, i.e., IAROA has a strong competitiveness in the field of mechanical engineering. From Table 9, the optimal solution vector of IAROA is (0.19883230722, 3.33736529865, 9.19202432248, 0.19883230722) and the corresponding optimal fitness value is 1.67021772630, which demonstrates that IAROA possesses a superior performance in addressing the actual engineering issues.

3.2.4. Robot Gripper Problem

Grippers are essential end-effectors in robotics and are widely used in various fields [52]. The optimal design of the gripper is a classic nonlinear engineering robot gripper problem designed to enhance the gripping precision of the robot. The schematic of the gripper is shown in Figure 11. The problem has four design parameters (a,b,c,e,f,l,δ) and three nonlinear restraints (g1~g7). The specific operation is illustrated below:
C o n s i d e r   X = [ x 1 , x 2 , x 3 , x 4 , x 5 , x 6 , x 7 ] = [ a , b , c , e , f , l , δ ]
Minimise:
f x = min z F k x , z + max z F k x , z
Subject to:
g 1 x = Y min + y x , Z max 0 , g 2 x = y x , Z max 0 , g 3 x = Y max y x , 0 0 , g 4 x = y x , 0 Y G 0 , g 5 x = l 2 + e 2 a + b 2 0 , g 6 x = b 2 a e 2 l Z max 2 0 , g 7 x = Z max l 0 ,
where:
0 e 50 , 100 c 200 , 10 f , a , b 150 , 1 δ 3.14 , 100 l 300 .
Other parameters are computed as follows:
α = cos 1 a 2 + g 2 b 2 2 a g + φ , g = e 2 + z l 2 , β = cos 1 b 2 + g 2 a 2 2 b g φ , φ = tan 1 e l z ,
y x , z = 2 f + e + c sin β + δ , F k = P b sin α + β 2 c cos α , Y min = 50 , Y max = 100 , Y G = 150 , Z max = 100 , P = 100 .
From Table 10, the best, mean, worst, and std of IAROA are all optimum and reach the theoretical optimum, which demonstrates that the solution performance of IAROA is superior, and that IAROA has strong dependability and robustness in tackling the robot gripper matter. From Table 11, the optimum solution vector of IAROA is (150.0000, 149.8828, 200.0000, 0.0000, 149.9999, 100.9430, 2.2974), and the corresponding optimum fitness value is 2.543790469.
Figure 11. Schematic diagram of the robot gripper.
Biomimetics 10 00628 g011

3.2.5. Himmelblau Function

The nonlinear planning problem was generalised by Himmelblau in the solution of a mechanical design issue [53], where the machine manufacturing problem is a minimisation problem with an optimisation goal equation, such that the consumption of steel is minimised. The problem includes five relevant design variables and six nonlinear inequality constraints. The specific mathematical model is shown below:
Minimise:
f x = 5.3578547 x 3 2 + 0.8356891 x 1 x 5 + 37.293239 x 1 40792.141
Subject to:
g 1 x = G 1 0 , g 2 x = G 1 92 0 , g 3 x = 90 G 2 0 , g 4 x = G 2 110 0 , g 5 x = 20 G 3 0 , g 6 x = G 3 25 0 ,
where:
78 x 1 102 , 33 x 2 45 , 27 x 3 45 , 27 x 4 45 , 27 x 5 45 , G 1 = 85.334407 + 0.0056858 x 2 x 5 + 0.0006262 x 1 x 4 0.0022053 x 3 x 5 , G 2 = 80.51249 + 0.0071317 x 2 x 5 + 0.0029955 x 1 x 2 + 0.0021813 x 3 2 , G 3 = 9.300961 + 0.0047026 x 3 x 5 + 0.00125447 x 1 x 3 + 0.0019085 x 3 x 4 .
As can be seen from Table 12, IAROA, AROA, SSA, and DBO all find the smallest best and reach the theoretical optimum. However, IAROA has the same mean and worst as best, while its standard deviation std is much smaller than that of AROA, SSA, and DBO. This indicates that the solutions obtained by IAROA are more stable and of better quality, and show strong stability and robustness in solving the Himmelblau nonlinear programming problem. From Table 13, the optimal solution vector derived by IAROA is (78.0000000, 33.0000000, 29.9952560, 45.0000000, 36.7758129) and the corresponding optimal fitness value is −30,665.538671784.

4. Conclusions and Expectations

In this study, we produce an improved Attraction–Repulsion Optimisation Algorithm based on multi-strategy, denoted as IAROA. Firstly, based on the original AROA, four improvement strategies, EDO, CDICP, DLH, and PAS, are introduced, aiming to increase the population diversity and the precision of optimisation search in AROA. Secondly, this paper selects four types of metaheuristic optimisation algorithms, namely classical algorithms, algorithms with outstanding performance in recent years, algorithms on the top list of the CEC competition, and improved classical algorithms, as the objects of comparison, and adopts the comprehensive CEC2017 test set to construct an experimental environment to examine the performance of IAROA. The experimental outcomes show that IAROA has excellent optimisation performance. Finally, in order to further evaluate the performance of IAROA in solving real-world problems, six real-world engineering constrained optimisation problems with varying degrees of complexity are also selected for experiments in this paper. The outcomes show that IAROA demonstrates significant superiority and robustness in engineering practice.
In our future work, we will apply the proposed IAROA algorithm to solve optimisation problems in more fields by selecting suitable strategies based on the characteristics of different optimisation problems or combining them with other algorithms, such as energy prediction [54] and path planning.

Supplementary Materials

The following supporting information can be downloaded at https://www.mdpi.com/article/10.3390/biomimetics10090628/s1, Figure S1: Line chart of various algorithms under 30-dimensional cec2017; Figure S2: Line chart of various algorithms under 50-dimensional cec2017; Figure S3: The boxplots of various algorithms under 30-dimensional cec2017; Figure S4: The boxplots of various algorithms under 50-dimensional cec2017; Figure S5: The radar images of various algorithms; Table S1: Comparison results of various algorithms under 30-dimensional cec2017; Table S2: Comparison results of various algorithms under 50-dimensional cec2017; Table S3: Comparison results of various algorithms under 100-dimensional cec2017; Table S4: The different variants of AROA under four different strategies; Table S5: Results of AROA ablation experiments based on four strategies.

Author Contributions

Conceptualisation, G.H., Z.J. and A.G.H.; Methodology, N.Z., G.H., Z.J. and A.G.H.; Software, N.Z. and Z.J.; Validation, G.H.; Formal analysis, N.Z., Z.J. and A.G.H.; Investigation, N.Z., G.H., Z.J. and A.G.H.; Resources, G.H.; Data curation, N.Z., G.H. and A.G.H.; Writing—original draft, N.Z., G.H., Z.J. and A.G.H.; Writing—review and editing, N.Z., G.H., Z.J. and A.G.H.; Visualisation, N.Z., Z.J. and A.G.H.; Supervision, G.H., Z.J. and A.G.H.; Project administration, G.H.; Funding acquisition, N.Z. All authors have read and agreed to the published version of the manuscript.

Funding

This work was supported in part by the Key Research and Development Program of Shaanxi (grant No. 2021GY-131).

Institutional Review Board Statement

Not applicable.

Informed Consent Statement

Not applicable.

Data Availability Statement

All data generated or analysed during this study were included in this published article.

Conflicts of Interest

The authors declare that they have no competing interests.

References

  1. Corriveau, G.; Guilbault, R.; Tahan, A.; Sabourin, R. Bayesian network as an adaptive parameter setting approach for genetic algorithms. Complex Intell. Syst. 2016, 2, 1–22. [Google Scholar] [CrossRef]
  2. Storn, R.; Price, K. Differential evolution–a simple and efficient heuristic for global optimization over continuous spaces. J. Glob. Optim. 1997, 11, 341–359. [Google Scholar] [CrossRef]
  3. Simon, D. Biogeography-based optimization. IEEE Trans. Evol. Comput. 2008, 12, 702–713. [Google Scholar] [CrossRef]
  4. Chun, J.S.; Jung, H.K.; Hahn, S.Y. A study on comparison of optimization performances between immune algorithm and other heuristic algorithms. IEEE Trans. Magn. 1998, 34, 2972–2975. [Google Scholar] [CrossRef]
  5. Rashedi, E.; Nezamabadi-Pour, H.; Saryazdi, S. GSA: A gravitational search algorithm. Inf. Sci. 2009, 179, 2232–2248. [Google Scholar] [CrossRef]
  6. Kirkpatrick, S.; Gelatt, C.D., Jr.; Vecchi, M.P. Optimization by simulated annealing. Science 1983, 220, 671–680. [Google Scholar] [CrossRef]
  7. Abdel-Basset, M.; Mohamed, R.; Azeem, S.A.A.; Jameel, M.; Abouhawwash, M. Kepler optimization algorithm: A new metaheuristic algorithm inspired by Kepler’s laws of planetary motion. Knowl.-Based Syst. 2023, 268, 110454. [Google Scholar] [CrossRef]
  8. Abdel-Basset, M.; Mohamed, R.; Sallam, K.M.; Chakrabortty, R.K. Light spectrum optimizer: A novel physics-inspired metaheuristic optimization algorithm. Mathematics 2022, 10, 3466. [Google Scholar] [CrossRef]
  9. Sayed, G.I.; Darwish, A.; Hassanien, A.E. Quantum multiverse optimization algorithm for optimization problems. Neural Comput. Appl. 2019, 31, 2763–2780. [Google Scholar] [CrossRef]
  10. Yuan, C.; Zhao, D.; Heidari, A.A.; Liu, L.; Chen, Y.; Chen, H. Polar lights optimizer: Algorithm and applications in image segmentation and feature selection. Neurocomputing 2024, 607, 128427. [Google Scholar] [CrossRef]
  11. Heidari, A.A.; Mirjalili, S.; Faris, H.; Aljarah, I.; Mafarja, M.; Chen, H. Harris hawks optimization: Algorithm and applications. Future Gener. Comput. Syst. 2019, 97, 849–872. [Google Scholar] [CrossRef]
  12. Abdollahzadeh, B.; Gharehchopogh, F.S.; Khodadadi, N.; Mirjalili, S. Mountain gazelle optimizer: A new nature-inspired metaheuristic algorithm for global optimization problems. Adv. Eng. Softw. 2022, 174, 103282. [Google Scholar] [CrossRef]
  13. Abdel-Basset, M.; Mohamed, R.; Jameel, M.; Abouhawwash, M. Nutcracker optimizer: A novel nature-inspired metaheuristic algorithm for global optimization and engineering design problems. Knowl.-Based Syst. 2023, 262, 110248. [Google Scholar] [CrossRef]
  14. Hashim, F.A.; Houssein, E.H.; Hussain, K.; Mabrouk, M.S.; Al-Atabany, W. Honey Badger Algorithm: New metaheuristic algorithm for solving optimization problems. Math. Comput. Simul. 2022, 192, 84–110. [Google Scholar] [CrossRef]
  15. Yang, X.S. Firefly algorithms for multimodal optimization. In Proceedings of the International Symposium on Stochastic Algorithms, Sapporo, Japan, 26–28 October 2009; Springer: Berlin/Heidelberg, Germany, 2009; pp. 169–178. [Google Scholar]
  16. Jia, H.; Peng, X.; Lang, C. Remora optimization algorithm. Expert Syst. Appl. 2021, 185, 115665. [Google Scholar] [CrossRef]
  17. Hu, G.; Cheng, M.; Houssein, E.H.; Hussien, A.G.; Abualigah, L. SDO: A novel sled dog-inspired optimizer for solving engineering problems. Adv. Eng. Inform. 2024, 62, 102783. [Google Scholar] [CrossRef]
  18. Trojovský, P. A new human-based metaheuristic algorithm for solving optimization problems based on preschool education. Sci. Rep. 2023, 13, 21472. [Google Scholar] [CrossRef] [PubMed]
  19. Rao, R.V.; Savsani, V.J.; Vakharia, D.P. Teaching–learning-based optimization: A novel method for constrained mechanical design optimization problems. Comput.-Aided Des. 2011, 43, 303–315. [Google Scholar] [CrossRef]
  20. Oladejo, S.O.; Ekwe, S.O.; Mirjalili, S. The Hiking Optimization Algorithm: A novel human-based metaheuristic approach. Knowl.-Based Syst. 2024, 296, 111880. [Google Scholar] [CrossRef]
  21. Truong, D.N.; Chou, J.S. Metaheuristic algorithm inspired by enterprise development for global optimization and structural engineering problems with frequency constraints. Eng. Struct. 2024, 318, 118679. [Google Scholar] [CrossRef]
  22. Tian, Z.; Gai, M. Football team training algorithm: A novel sport-inspired meta-heuristic optimization algorithm for global optimization. Expert Syst. Appl. 2024, 245, 123088. [Google Scholar] [CrossRef]
  23. Cymerys, K.; Oszust, M. Attraction-repulsion optimization algorithm for global optimization problems. Swarm Evol. Comput. 2024, 84, 101459. [Google Scholar] [CrossRef]
  24. Awad, N.H.; Ali, M.Z.; Liang, J.J.; Qu, B.Y.; Suganthan, P.N. Problem Definitions and Evaluation Criteria for the CEC 2017 Special Session and Competition on Single Objective Bound Constrained Real-Parameter Numerical Optimization; Technical Report; Nanyang Technological University Singapore: Singapore, 2016; pp. 1–34. [Google Scholar]
  25. Xu, Y.; Yang, Z.; Li, X.; Kang, H.; Yang, X. Dynamic opposite learning enhanced teaching-learning-based optimization. Knowl.-Based Syst. 2020, 188, 104966. [Google Scholar] [CrossRef]
  26. Li, Y.; Peng, T.; Hua, L.; Ji, C.; Ma, H.; Nazir, M.S.; Zhang, C. Research and application of an evolutionary deep learning model based on improved grey wolf optimization algorithm and DBN-ELM for AQI prediction. Sustain. Cities Soc. 2022, 87, 104209. [Google Scholar] [CrossRef]
  27. Wang, M.; Wang, J.S.; Li, X.D.; Zhang, M.; Hao, W.K. Harris hawk optimization algorithm based on Cauchy distribution inverse cumulative function and tangent flight operator. Appl. Intell. 2022, 52, 10999–11026. [Google Scholar] [CrossRef]
  28. Hayyolalam, V.; Kazem, A.A.P. Black widow optimization algorithm: A novel meta-heuristic approach for solving engineering optimization problems. Eng. Appl. Artif. Intell. 2020, 87, 103249. [Google Scholar] [CrossRef]
  29. Faramarzi, A.; Heidarinejad, M.; Mirjalili, S.; Gandomi, A.H. Marine Predators Algorithm: A nature-inspired metaheuristic. Expert Syst. Appl. 2020, 152, 113377. [Google Scholar] [CrossRef]
  30. Faramarzi, A.; Heidarinejad, M.; Stephens, B.; Mirjalili, S. Equilibrium optimizer: A novel optimization algorithm. Knowl.-Based Syst. 2020, 191, 105190. [Google Scholar] [CrossRef]
  31. Xue, J.; Shen, B. A novel swarm intelligence optimization approach: Sparrow search algorithm. Syst. Sci. Control. Eng. 2020, 8, 22–34. [Google Scholar] [CrossRef]
  32. Mirjalili, S.; Mirjalili, S.M.; Lewis, A. Grey wolf optimizer. Adv. Eng. Softw. 2014, 69, 46–61. [Google Scholar] [CrossRef]
  33. Hashim, F.A.; Hussain, K.; Houssein, E.H.; Mabrouk, M.S.; Al-Atabany, W. Archimedes optimization algorithm: A new metaheuristic algorithm for solving optimization problems. Appl. Intell. 2021, 51, 1531–1551. [Google Scholar] [CrossRef]
  34. Abdollahzadeh, B.; Gharehchopogh, F.S.; Mirjalili, S. African vultures optimization algorithm: A new nature-inspired metaheuristic algorithm for global optimization problems. Comput. Ind. Eng. 2021, 158, 107408. [Google Scholar] [CrossRef]
  35. Xue, J.; Shen, B. Dung beetle optimizer: A new meta-heuristic algorithm for global optimization. J. Supercomput. 2023, 79, 7305–7336. [Google Scholar] [CrossRef]
  36. Awad, N.H.; Ali, M.Z.; Suganthan, P.N. Ensemble sinusoidal differential covariance matrix adaptation with Euclidean neighborhood for solving CEC2017 benchmark problems. In Proceedings of the 2017 IEEE Congress on Evolutionary Computation (CEC), Donostia-San Sebastián, Spain, 5–8 June 2017; IEEE: New York, NY, USA, 2017; pp. 372–379. [Google Scholar]
  37. Mohamed, A.W.; Hadi, A.A.; Fattouh, A.M.; Jambi, K.M. LSHADE with semi-parameter adaptation hybrid with CMA-ES for solving CEC 2017 benchmark problems. In Proceedings of the 2017 IEEE Congress on Evolutionary Computation (CEC), Donostia-San Sebastián, Spain, 5–8 June 2017; IEEE: New York, NY, USA, 2017; pp. 145–152. [Google Scholar]
  38. He, Z.; Liu, T.; Liu, H. Improved particle swarm optimization algorithms for aerodynamic shape optimization of high-speed train. Adv. Eng. Softw. 2022, 173, 103242. [Google Scholar] [CrossRef]
  39. Tanweer, M.R.; Suresh, S.; Sundararajan, N. Improved SRPSO algorithm for solving CEC 2015 computationally expensive numerical optimization problems. In Proceedings of the 2015 IEEE Congress on Evolutionary Computation (CEC), Sendai, Japan, 25–28 May 2015; IEEE: New York, NY, USA, 2015; pp. 1943–1949. [Google Scholar]
  40. Xia, X.; Gui, L.; He, G.; Wei, B.; Zhang, Y.; Yu, F.; Wu, H.; Zhan, Z.-H. An expanded particle swarm optimization based on multi-exemplar and forgetting ability. Inf. Sci. 2020, 508, 105–120. [Google Scholar] [CrossRef]
  41. Xia, X.; Gui, L.; Yu, F.; Wu, H.; Wei, B.; Zhang, Y.L.; Zhan, Z.H. Triple archives particle swarm optimization. IEEE Trans. Cybern. 2019, 50, 4862–4875. [Google Scholar] [CrossRef] [PubMed]
  42. Nadimi-Shahraki, M.H.; Taghian, S.; Mirjalili, S. An improved grey wolf optimizer for solving engineering problems. Expert Syst. Appl. 2021, 166, 113917. [Google Scholar] [CrossRef]
  43. Derrac, J.; García, S.; Molina, D.; Herrera, F. A practical tutorial on the use of nonparametric statistical tests as a methodology for comparing evolutionary and swarm intelligence algorithms. Swarm Evol. Comput. 2011, 1, 3–18. [Google Scholar] [CrossRef]
  44. Supraba, A.; Musfirah, M.; Sjachrun, R.A.M.; Wahyono, E. The Students’ Response Toward Indirect Corrective Feedback Used By The Lecturer In Teaching Writing At Cokroaminoto Palopo University. DEIKTIS J. Pendidik. Bhs. Dan Sastra 2021, 1, 148–158. [Google Scholar] [CrossRef]
  45. Han, Z.; Han, C.; Lin, S.; Dong, X.; Shi, H. Flexible flow shop scheduling method with public buffer. Processes 2019, 7, 681. [Google Scholar] [CrossRef]
  46. Hu, G.; He, P.; Jia, H.; Houssein, E.H.; Abualigah, L. PDPSO: Priority-driven search particle swarm optimization with dynamic candidate solutions management strategy for solving higher-dimensional complex engineering problems. Comput. Methods Appl. Mech. Eng. 2025, 446, 118318. [Google Scholar] [CrossRef]
  47. Dehghani, M.; Hubálovský, Š.; Trojovský, P. Northern goshawk optimization: A new swarm-based algorithm for solving optimization problems. IEEE Access 2021, 9, 162059–162080. [Google Scholar] [CrossRef]
  48. Andrei, N. Nonlinear Optimization Applications Using the GAMS Technology; Springer: New York, NY, USA, 2013. [Google Scholar]
  49. Pant, M.; Thangaraj, R.; Singh, V.P. Optimization of mechanical design problems using improved differential evolution algorithm. Int. J. Recent Trends Eng. 2009, 1, 21. [Google Scholar]
  50. Hu, G.; Gong, C.; Li, X.; Xu, Z. CGKOA: An enhanced Kepler optimization algorithm for multi-domain optimization problems. Comput. Methods Appl. Mech. Eng. 2024, 425, 116964. [Google Scholar] [CrossRef]
  51. He, X.; Zhou, Y. Enhancing the performance of differential evolution with covariance matrix self-adaptation. Appl. Soft Comput. 2018, 64, 227–243. [Google Scholar] [CrossRef]
  52. Wang, K.; Guo, M.; Dai, C.; Li, Z. Information-decision searching algorithm: Theory and applications for solving engineering optimization problems. Inf. Sci. 2022, 607, 1465–1531. [Google Scholar] [CrossRef]
  53. Himmelblau, D.M. Applied Nonlinear Programming; McGraw-Hill: Columbus, OH, USA, 2018. [Google Scholar]
  54. Hu, G.; Song, K.; Abdel-salam, M. Sub-population evolutionary particle swarm optimization with dynamic fitness-distance balance and elite reverse learning for engineering design problems. Adv. Eng. Softw. 2025, 202, 103866. [Google Scholar] [CrossRef]
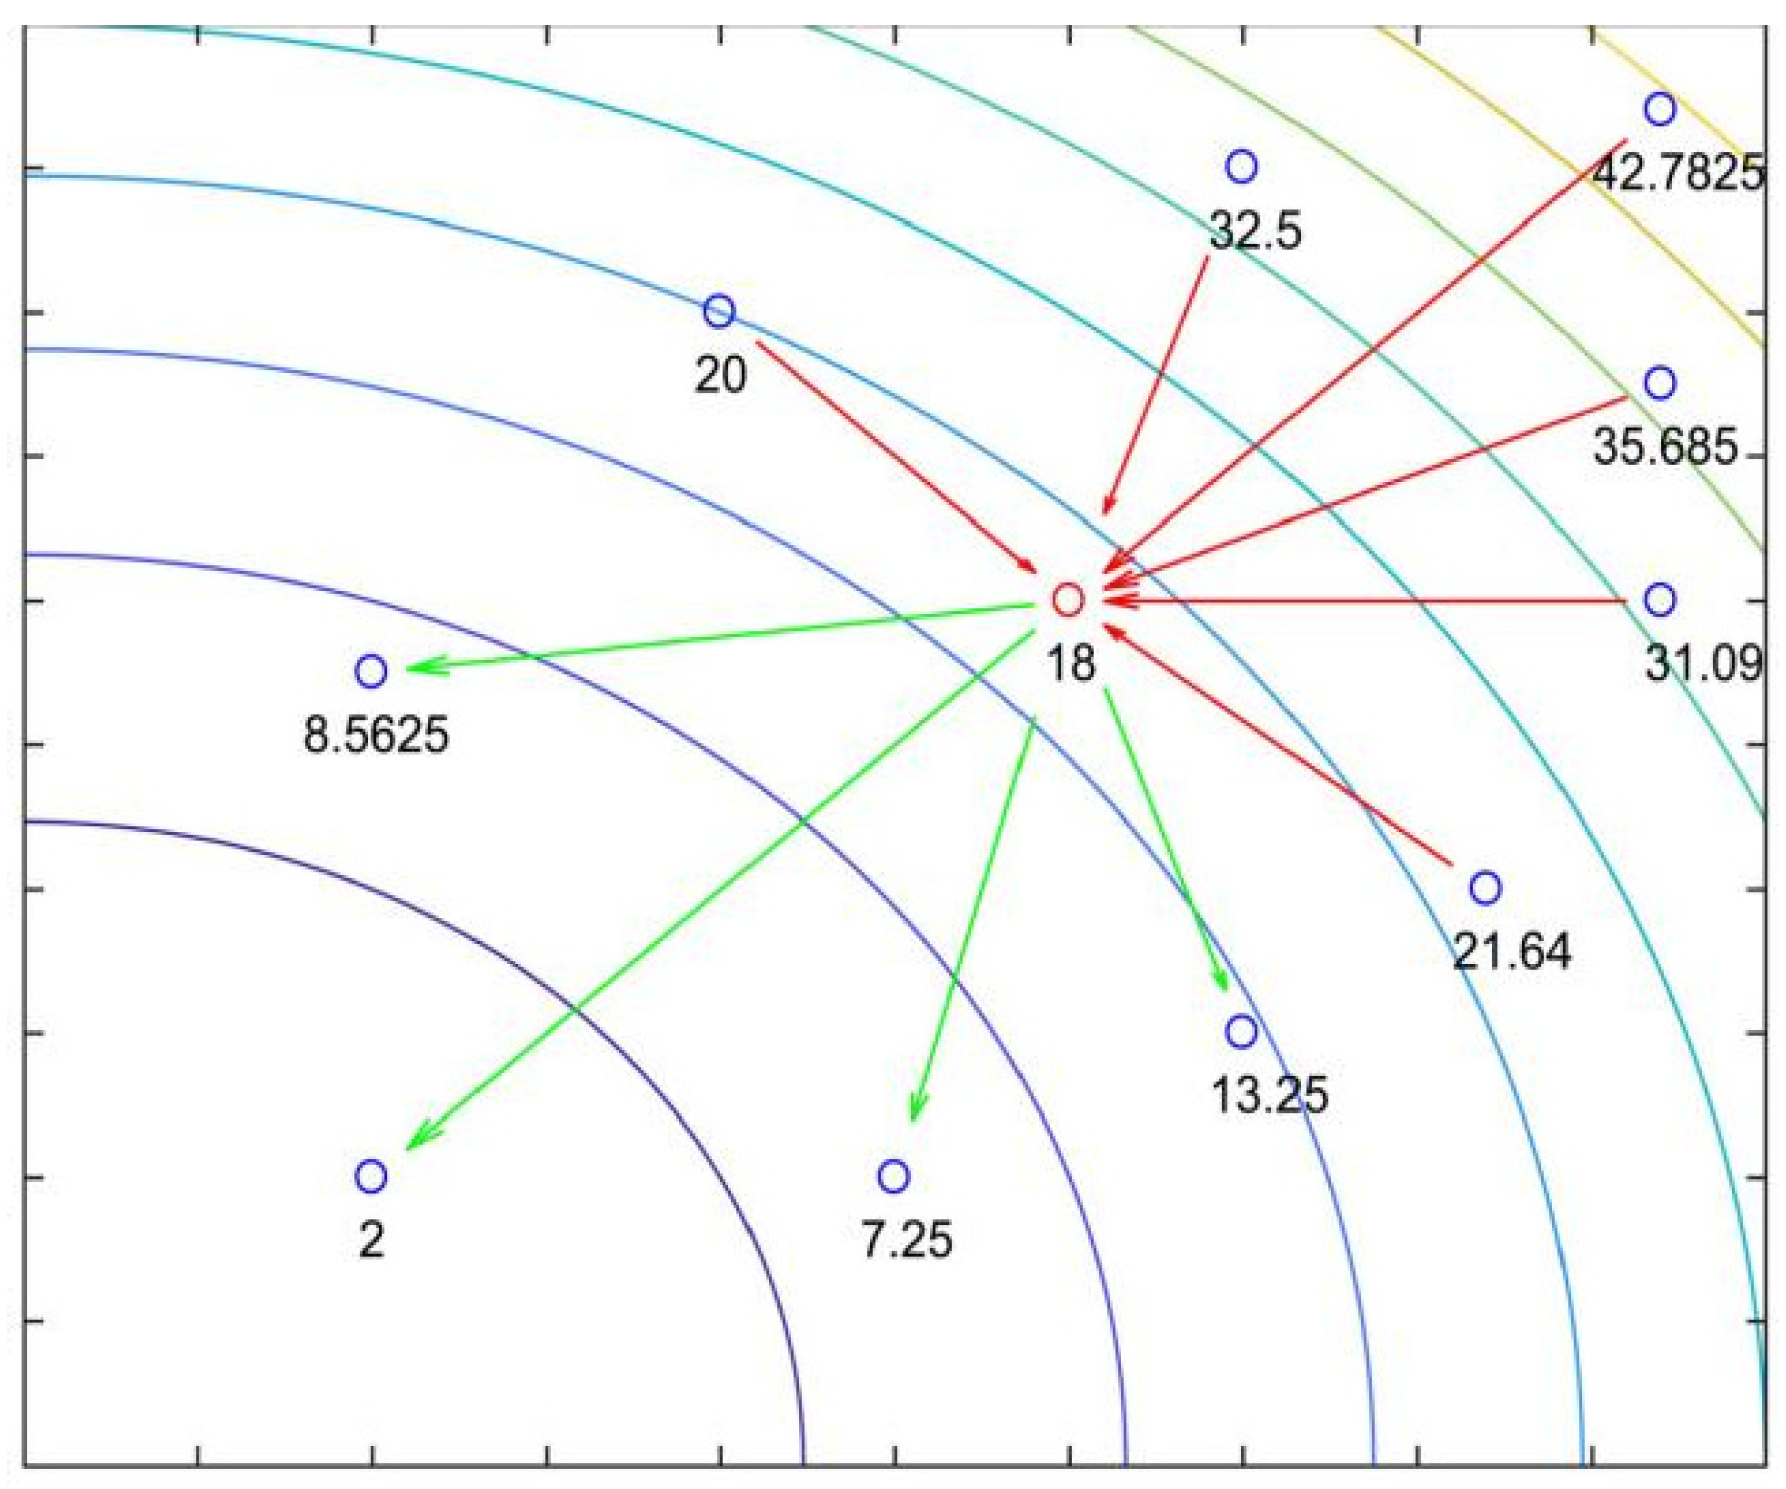
Figure 1. Attraction–repulsion schematic.
Biomimetics 10 00628 g001
Figure 2. Step size of the Cauchy inverse cumulative distribution operator.
Biomimetics 10 00628 g002
Figure 4. Convergence curves of IAROA with other algorithms for solving the 100D CEC2017.
Biomimetics 10 00628 g004aBiomimetics 10 00628 g004bBiomimetics 10 00628 g004c
Figure 5. Boxplot of IAROA versus other algorithms solving the 100-dimensional CEC2017.
Biomimetics 10 00628 g005aBiomimetics 10 00628 g005bBiomimetics 10 00628 g005c
Figure 6. Line graph of the results of the partial ablation experiments.
Biomimetics 10 00628 g006
Figure 10. Schematic diagram of a welded beam.
Biomimetics 10 00628 g010
Table 1. Parameter settings for some of the comparison algorithms.
ArithmeticParameterisation
AROAc = 0.95, fr1 = 0.15, fr2 = 0.15, p1 = 0.6, p2 = 0.8, ef = 0.4, tr1 = 0.9, tr2 = 0.85, tr3 = 0.9
IAROAc = 0.98, fr1 = 0.15, fr2 = 0.15, p1 = 0.6, p2 = 0.8, ef = 0.2, tr1 = 0.9, tr2 = 0.85, tr3 = 0.9
MPAFADs = 0.2, P = 0.5
EOa1 = 2, a2 = 1, GP = 0.5
SSAP_percent = 0.2
AVOAp1= 0.6, p2 = 0.4, p3 = 0.6, alpha = 0.8, betha = 0.2, gamma = 2.5
AOAMOA_max = 1, MOA_min = 0.2, µ = 0.5, a = 5
NOAAlpha = 0.05, Pa2 = 0.2, Prb = 0.2
DBOP_percent = 0.2,
LSHADE_SPACMAL_Rate = 0.8, num_prbs = 30
LSHADE_cnEpSinµF = 0.5, µCR = 0.5, H = 5, pb = 0.4, ps = 0.5
SRPSOϖmin = 0.5, ϖmax = 1.05, c1 = 1.49445, c2 = 1.49445
XPSOelite_ratio = 0.5
TAPSOtatio = 0.5
Table 2. Comparative results of optimal operation of Alkylation units.
ArithmeticBestMeanWorstStd
IAROA−4529.119739−4529.118781−4529.1049060.002852721
AROA−4529.119724−4333.335038321.1617524891.8735161
EO−4528.3366761.85265E+125.55795E+131.01474E+13
MPA−4529.119356−4528.975121−4526.3014320.532510698
SSA−4520.7367641.75014E+175.24861E+189.5825E+17
GWO−4507.6183541.22554E+181.41438E+193.43021E+18
AVOA−4339.8748921.71088E+175.1306E+189.36702E+17
AOA5.25688E+179.81415E+208.48024E+211.90575E+21
DBO−4526.3250049.45899E+182.47028E+204.49258E+19
NOA−4491.895714−4238.302978−2996.590641357.074788
SRPSO242.77513437.29395E+155.65979E+161.58177E+16
XPSO307.50086811.72755E+151.22294E+163.29314E+15
TAPSO95.765300055.64566E+191.63764E+212.98727E+20
Table 3. Optimal design for optimal operation of Alkylation units.
ArithmeticNormBest
x1x2x3x4x5x6x7
IAROA2000.00000.00002576.40030.000058.16071.260041.2298−4529.1197
AROA2000.00000.00002576.28140.000058.16021.259541.0656−4529.1197
EO2000.00000.00002520.78810.000057.92401.023641.0957−4528.3367
MPA2000.00000.00002576.69280.000058.16201.261341.6599−4529.1194
SSA2000.00000.00002393.81820.000057.39130.506239.3992−4520.7368
GWO2000.00000.00002846.69750.000059.37272.542945.0267−4507.6184
AVOA1978.12370.00003245.54270.000061.52375.222052.0448−4339.8749
AOA1370.20340.00002000.00000.000060.46922.9016118.37505.257E+17
DBO2000.00000.00002471.19940.000057.71480.818040.0673−4526.3250
NOA2000.00000.00002898.02940.000059.64682.801445.6220−4491.8957
SRPSO1546.528499.93862489.129989.143991.02585.2212141.4753242.7751
XPSO1255.224383.12512122.565088.985693.245612.9129145.2599307.5009
TAPSO1212.024699.98322000.000092.201094.366714.2142148.590795.7653
Table 4. Speed Reducer comparison results.
ArithmeticBestMeanWorstStd
IAROA2994.4244657572994.4244657572994.4244657578.27383E−13
AROA2994.4244657962994.4280429172994.4620093080.007962375
EO2994.4244674072994.9405609543007.3899391942.394794727
MPA2994.4329904142994.4643601542994.5528278180.032564995
SSA2994.4244657572994.4244657612994.4244658160.000000013
GWO3005.0815818133012.7995341763027.3617580886.172417742
AVOA2994.4854684133001.6005611043012.5848101064.779087615
AOA3089.6547738853168.8429901813227.78885738043.609182558
DBO2994.4244657573059.2336006553202.58218201061.362527570
NOA2994.4244784532994.4245607762994.4247738180.000072466
SRPSO2994.4245027552994.4245880912994.4248023930.000068117
XPSO3010.0855743313023.1400780153028.9623688804.128647703
TAPSO2994.4244657573084.2114663214302.119178611259.168749641
Table 5. Optimal design of Speed Reducer.
ArithmeticNormBest
x1x2x3x4x5x6x7
IAROA3.5000000.70000017.0000007.3000007.7153203.3505415.2866542994.424466
AROA3.5000000.70000017.0000007.3000007.7153203.3505415.2866542994.424466
EO3.5000000.70000017.0000007.3000007.7153203.3505415.2866542994.424467
MPA3.5000030.70000017.0000027.3000007.7155353.3505455.2866562994.432990
SSA3.5000000.70000017.0000007.3000007.7153203.3505415.2866542994.424466
GWO3.5035370.70000017.0000007.4674457.8514423.3520995.2935693005.081582
AVOA3.5000000.70000017.0000007.3020077.7172213.3505455.2866552994.485468
AOA3.6000000.70000017.0000008.3000008.3000003.3757625.3297213089.654774
DBO3.5000000.70000017.0000007.3000007.7153203.3505415.2866542994.424466
NOA3.5000000.70000017.0000007.3000007.7153203.3505415.2866542994.424478
SRPSO3.5000000.70000017.0000007.3000007.7153203.3505415.2866542994.424503
XPSO3.5019070.70032917.0029607.7150937.8856093.3571015.2926553010.085574
TAPSO3.5000000.70000017.0000007.3000007.7153203.3505415.2866542994.424466
Table 6. Comparative results for industrial refrigeration.
ArithmeticBestMeanWorstStd
IAROA0.0322130020.0367340920.1563211370.022643996
AROA0.0322322411.56031E+149.36186E+143.54861E+14
EO0.0322206729.36186E+139.36186E+142.85657E+14
MPA0.0331265780.0456392620.0708845670.009299800
SSA0.032216392.18444E+149.36186E+144.02732E+14
GWO0.040346392.19203E+149.42846E+144.04133E+14
AVOA0.0424344026.86537E+149.36187E+144.21075E+14
AOA5.0985326274.67991E+141.682E+155.97876E+14
DBO0.0447632037.79872E+143.38785E+157.14765E+14
NOA0.0326700280.0495930420.0785310710.014427310
SRPSO0.0509588489.36186E+139.36186E+142.85657E+14
XPSO0.4996127864.74863E+131.42459E+152.60093E+14
TAPSO0.0322265521.01416E+159.12181E+151.91438E+15
Table 7. Optimal design of industrial refrigeration.
ArithmeticNorm
x1x2x3x4x5x6x7
IAROA0.0010000.0010000.0010000.0010000.0010000.0010001.524000
AROA0.0010000.0010000.0010010.0010000.0010000.0010011.524129
EO0.0010000.0010000.0010000.0010030.0010000.0010001.524003
MPA0.0010000.0012380.0010150.0011090.0010880.0011441.524008
SSA0.0010000.0010000.0010000.0010000.0010000.0010001.524001
GWO0.0010000.0011290.0011230.0011950.0032700.0011811.524347
AVOA0.0010000.0010000.0010000.0020720.0010000.0021441.524001
AOA0.0010000.0010000.0010001.6794350.1694331.7275735.000000
DBO0.0010000.0010000.0010000.0010000.0010000.0010001.524000
NOA0.0010000.0010000.0010000.0010000.0010000.0010001.524038
SRPSO0.0010010.0010720.0017180.0014990.0013050.0010311.545509
XPSO0.0000000.0012930.0024400.0896290.8776260.0940482.783794
TAPSO0.0010000.0010000.0010000.0010000.0010000.0010001.524000
NormBest
x8x9x10x11x12x13x14
1.5240005.0000002.0000000.0010000.0010000.0072930.0875560.032213002
1.5242784.9999942.0003340.0010100.0010100.0073260.0879510.032232241
1.5240414.9999272.0000030.0010000.0010000.0072920.0875370.032220672
1.5240055.0000002.0001390.0010190.0010160.0073480.0882130.033126578
1.5240044.9999972.0000090.0010000.0010000.0072920.0875430.03221639
1.5249214.9850412.0130690.0053170.0050520.0153370.1837780.04034639
1.5240014.9335722.3286890.0079560.0056920.0177130.2126350.042434402
2.2772393.4167992.3746620.0010000.0010000.0021300.0088165.098532627
1.5240005.0000005.0000000.0020720.0020720.0158510.1902860.044763203
1.5286054.9701392.0155430.0010030.0010000.0073150.0873980.032670028
1.5340804.7448264.1912210.0052510.0049980.0212670.2529350.050958848
3.3996242.5244342.7788280.1491760.0308010.0247670.2045830.499612786
Table 8. Comparison results of welded beams.
ArithmeticBestMeanWorstStd
IAROA1.67021772631.6702177261.6702177263.81709E−13
AROA1.67021772641.6705092951.6742404770.000792958
EO1.67021799391.6715996351.6971864030.004923826
MPA1.67021855921.6702265071.6702421320.000006517
SSA1.67021785031.7798129442.2627971860.148506619
GWO1.67123847961.6762135701.6977834590.005098199
AVOA1.67365094031.7588715921.8168494750.051331019
AOA1.93383942642.3391732652.7420535300.191872482
DBO1.67023066491.7542279321.9028047690.072558174
NOA1.67021972531.6702448421.6703462722.93581E−05
SRPSO1.67021873081.6704110511.6736444280.000631020
XPSO1.67021772631.6702404911.6707170939.15251E−05
TAPSO1.67021782632.0141436795.4535278240.713119231
Table 9. Optimal design of welded beams.
ArithmeticNormBest
x1x2x3x4
IAROA0.198832307223.337365298659.192024322480.198832307221.67021772630
AROA0.198832307183.337365299359.192024322780.198832307221.67021772640
EO0.198832319223.337364785169.192025376000.198832325861.67021799390
MPA0.198831985193.337373792419.192025759820.198832300551.67021855920
SSA0.198832338823.337364928309.192023569920.198832339991.67021785030
GWO0.198216660383.351504852739.192474212850.198831043331.67123847960
AVOA0.199372723453.332550275939.172316147500.199687670891.67365094030
AOA0.125000000005.5054786069910.000000000000.195949705861.93383942640
DBO0.198831541063.337346060699.192151842030.198831713141.67023066490
NOA0.198831903773.337373547679.192022873010.198832534861.67021972530
SRPSO0.198831703503.337378193229.192024117410.198832336791.67021873080
XPSO0.198832307223.337365298659.192024322480.198832307221.67021772630
TAPSO0.198832314403.337365308659.192023790590.198832330241.67021782630
Table 12. Himmelblau function comparison results.
ArithmeticBestMeanWorstStd
IAROA−30,665.538671784−30,665.538671784−30,665.5386717848.9876841E−12
AROA−30,665.538671784−30,665.538661737−30,665.5385180813.5086010E−05
EO−30,665.538671783−30,665.524005855−30,665.3152172470.042360026
MPA−30,665.538566739−30,665.538095716−30,665.5373668490.000325091
SSA−30,665.538671784−30,665.538647089−30,665.5382855159.1271724E−05
GWO−30,662.724520364−30,657.279460554−30,641.1652980644.795902492
AVOA−30,665.537797521−30,661.905410462−30,609.04718783610.961911294
AOA−30,573.492828232−29,587.801638904−28,883.198992723405.704030987
DBO−30,665.538671784−30,659.523848894−30,491.11410174931.815822115
NOA−30,665.537122546−30,665.529190299−30,665.4957239350.011777849
SRPSO−30,665.535954249−30,659.819894304−30,495.69899049330.997549900
XPSO−30,644.778298218−30,612.308790981−30,529.96300322523.667554290
TAPSO−30,665.538671784−30,607.422932739−29,893.249053707189.359224254
Table 13. Optimal design of Himmelblau function.
ArithmeticNormBest
x1x2x3x4x5
IAROA78.000000033.000000029.995256045.000000036.7758129−30,665.5386718
AROA78.000000033.000000029.995256045.000000036.7758129−30,665.5386718
EO78.000000033.000000029.995256045.000000036.7758129−30,665.5386718
MPA78.000000033.000000029.995256545.000000036.7758122−30,665.5385667
SSA78.000000033.000000029.995256045.000000036.7758129−30,665.5386718
GWO78.000000033.000000030.006626045.000000036.7629096−30,662.7245204
AVOA78.000000033.000001529.995261645.000000036.7757988−30,665.5377975
AOA78.000000033.000000030.249828745.000000036.9272888−30,573.4928282
DBO78.000000033.000000029.995256045.000000036.7758129−30,665.5386718
NOA78.000000033.000000529.995260745.000000036.7758137−30,665.5371225
SRPSO78.000018433.000004529.995266445.000000036.7757842−30,665.5359542
XPSO78.013613033.071599530.081778544.970111336.6528608−30,644.7782982
TAPSO78.000000033.000000029.995256045.000000036.7758129−30,665.5386718
Table 10. Robot gripper comparison results.
ArithmeticBestMeanWorstStd
IAROA2.5437904692.5898785513.0360073300.097775114
AROA2.5439681302.8761286443.6519413250.303358096
EO2.5471738573.4980801505.9664333670.752739873
MPA2.5460312082.8388372733.1530077070.175297596
SSA2.7926119836.31379452872.68667713512.588411554
GWO3.0923741873.8239351714.5640370270.376625847
AVOA2.5919784214.1565811406.7674530710.931277604
AOA3.7057949595.11111354716.1014767092.264300497
DBO2.5525057034.7896985608.3385827271.435788140
NOA3.0616613023.4442722653.7815540590.175854864
SRPSO3.3540196273.9834587894.9413962830.351937577
XPSO3.0360563354.4251717905.3687831140.512379516
TAPSO2.6442738486.57960947749.6252448089.957733009
Table 11. Optimal design of robotic gripper.
ArithmeticNormBest
x1x2x3x4x5x6x7
IAROA150.0000149.8828200.00000.0000149.9999100.94302.29742.543790469
AROA150.0000149.8825200.00000.0003150.0000100.95282.29782.543968130
EO150.0000149.8810200.00000.0000150.0000101.13222.31722.547173857
MPA149.9669149.8394200.00000.0094149.1333101.03022.29822.546031208
SSA148.9886141.6340200.00007.0801136.4111110.82492.32442.792611983
GWO149.8509149.7731199.13930.000025.6465103.59581.69013.092374187
AVOA150.0000149.8724200.00000.0000150.0000102.31702.37022.591978421
AOA150.000098.6045200.000050.0000150.0000129.61422.89073.705794959
DBO150.0000149.8779200.00000.0000136.4369101.43062.23252.552505703
NOA148.1264139.7663199.85587.6498143.0177125.38452.41553.061661302
SRPSO149.9801123.2550184.116626.2918149.4296115.44282.77753.354019627
XPSO143.0801138.5940191.52184.195215.9860110.42471.68473.036056335
TAPSO150.0000142.5250200.00007.3194149.9913103.53582.42022.644273848
Disclaimer/Publisher’s Note: The statements, opinions and data contained in all publications are solely those of the individual author(s) and contributor(s) and not of MDPI and/or the editor(s). MDPI and/or the editor(s) disclaim responsibility for any injury to people or property resulting from any ideas, methods, instructions or products referred to in the content.