Figure 1.
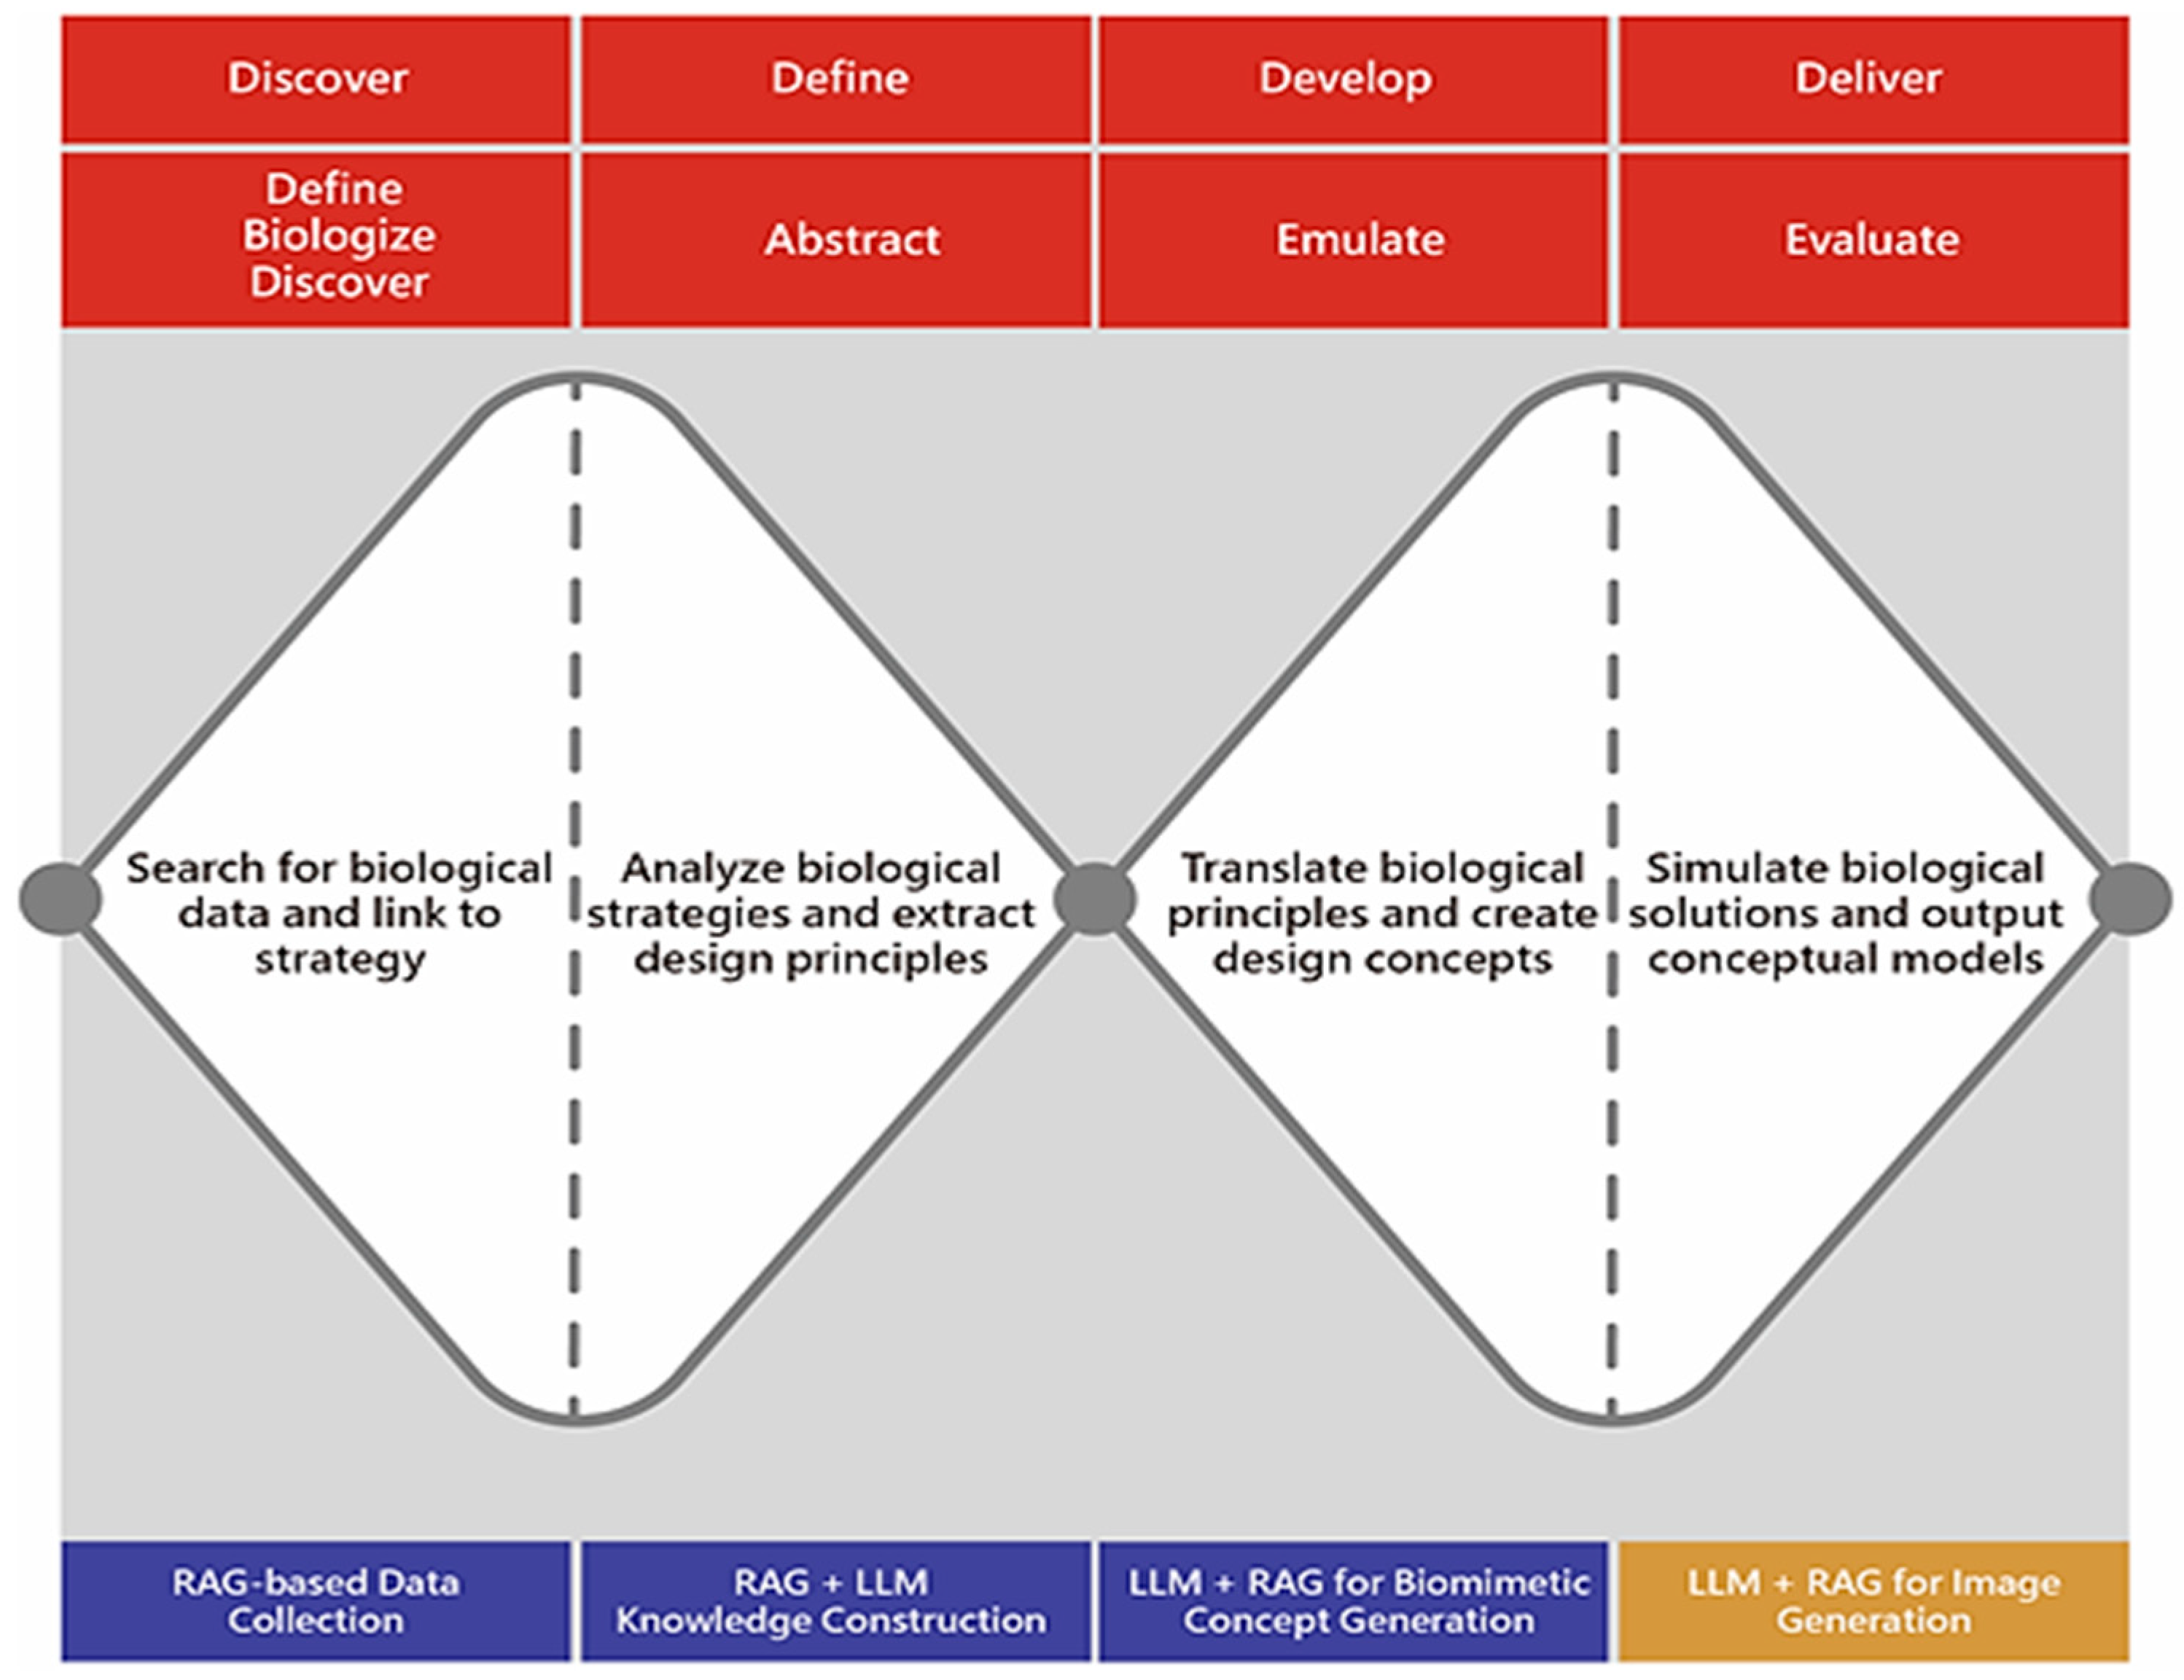
Integrated framework of BDS and DDM. The first diamond (left) aligns with the Define–Biologize–Discover and Abstract stages, while the second diamond (right) corresponds to Emulate and Evaluate. This integration highlights the divergence–convergence rhythm of the DDM combined with the stage-specific guidance of the BDS.
Figure 2.
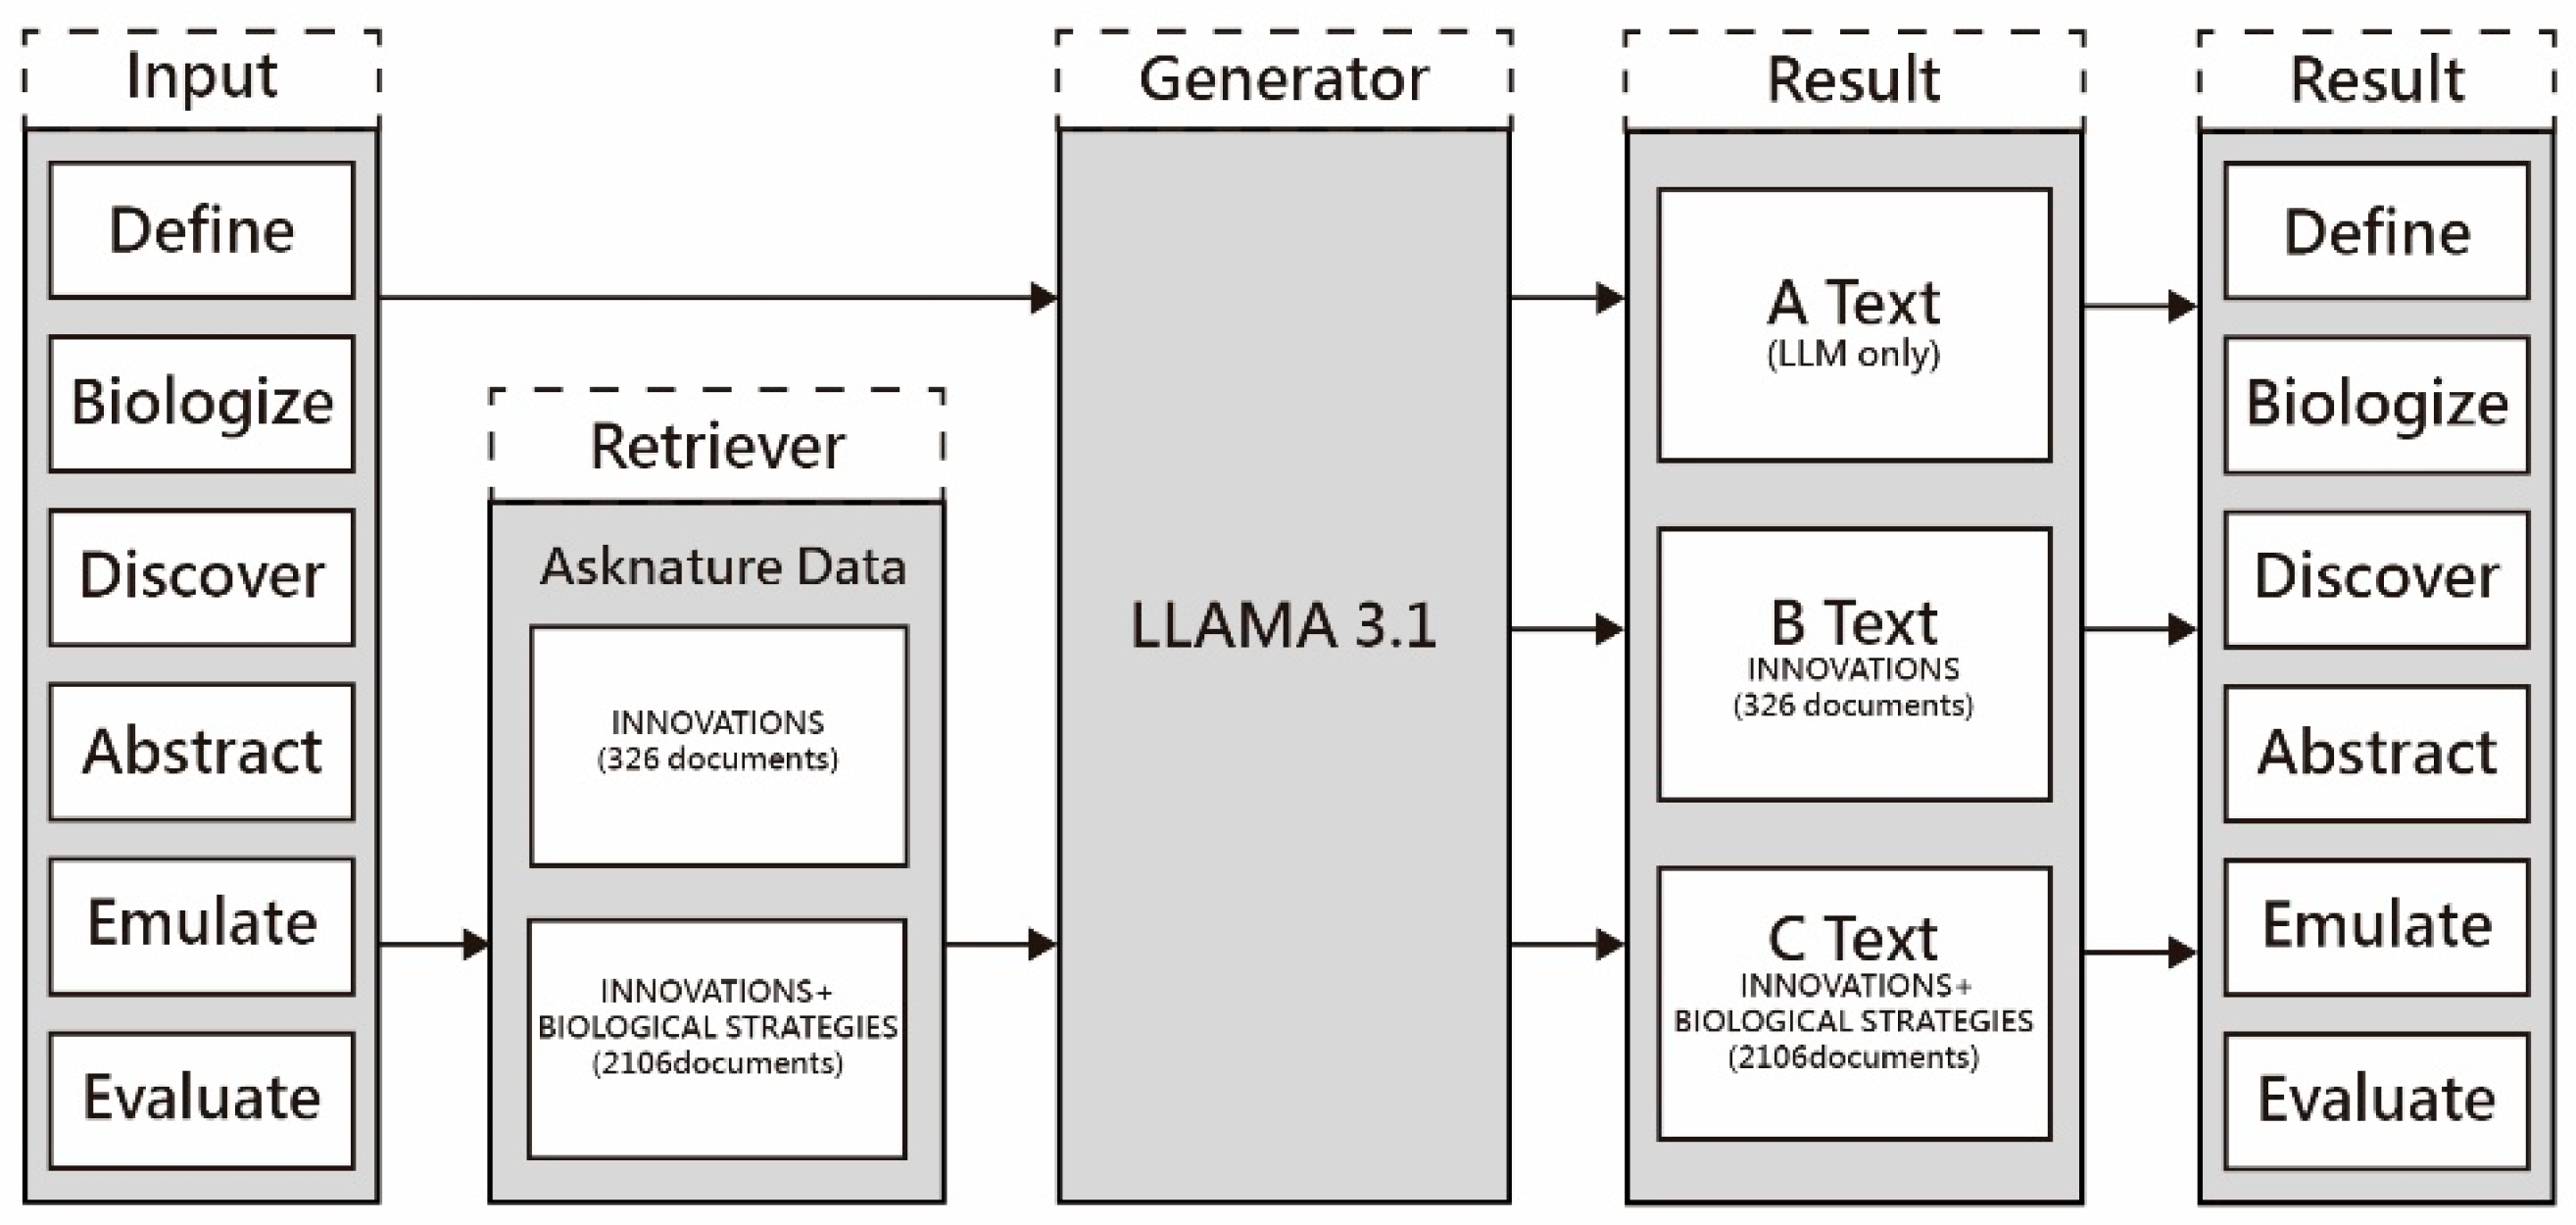
System Architecture of the RAG Application. The framework integrates a curated AskNature knowledge base, a vector database for semantic retrieval, and a locally executed LLM, with outputs connected to evaluation and visualization modules. This architecture illustrates how retrieval and generation components interact to support stage-specific biomimicry design tasks.
Figure 3.
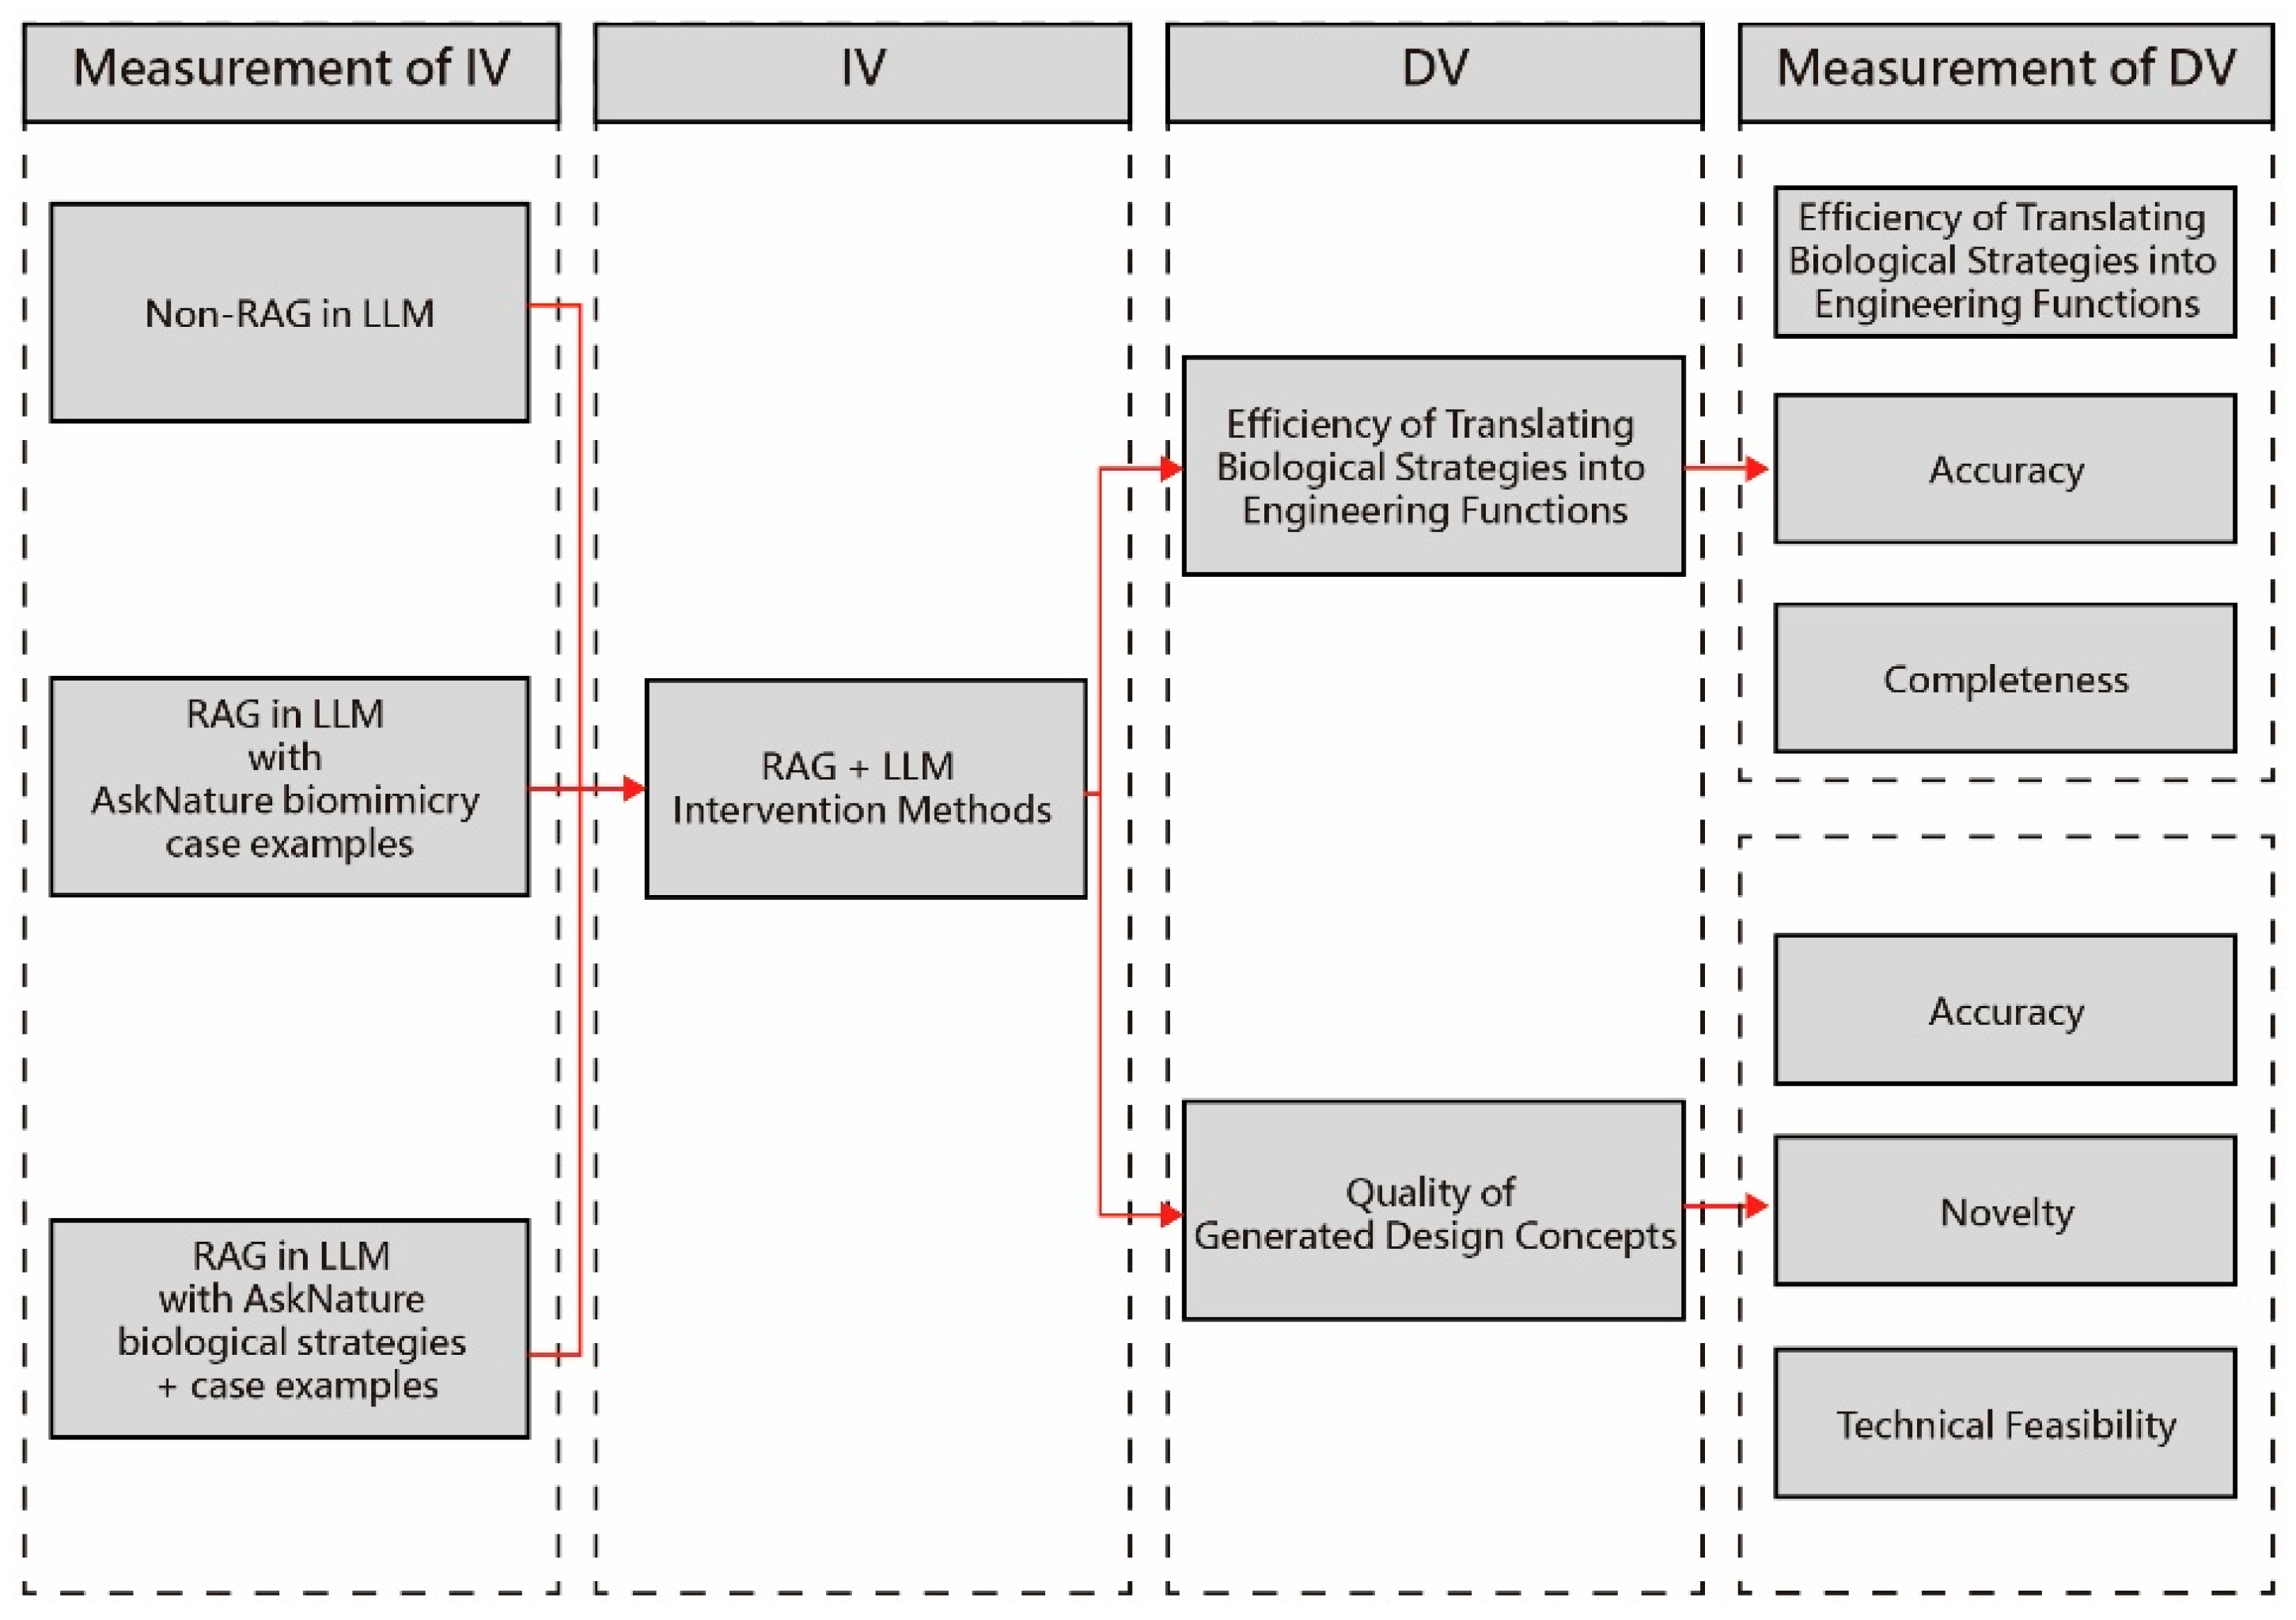
Experimental workflow and relationships between independent variables (IVs) and dependent variables (DVs). The three experimental conditions (LLM-only, RAG-Small, and RAG-Large) feed into a common evaluation pipeline. Each condition generates textual responses across the six BDS stages, with outputs assessed for efficiency, accuracy, completeness, and design concept quality. This workflow highlights how retrieval augmentation influences both knowledge translation and creative outcomes.
Figure 4.
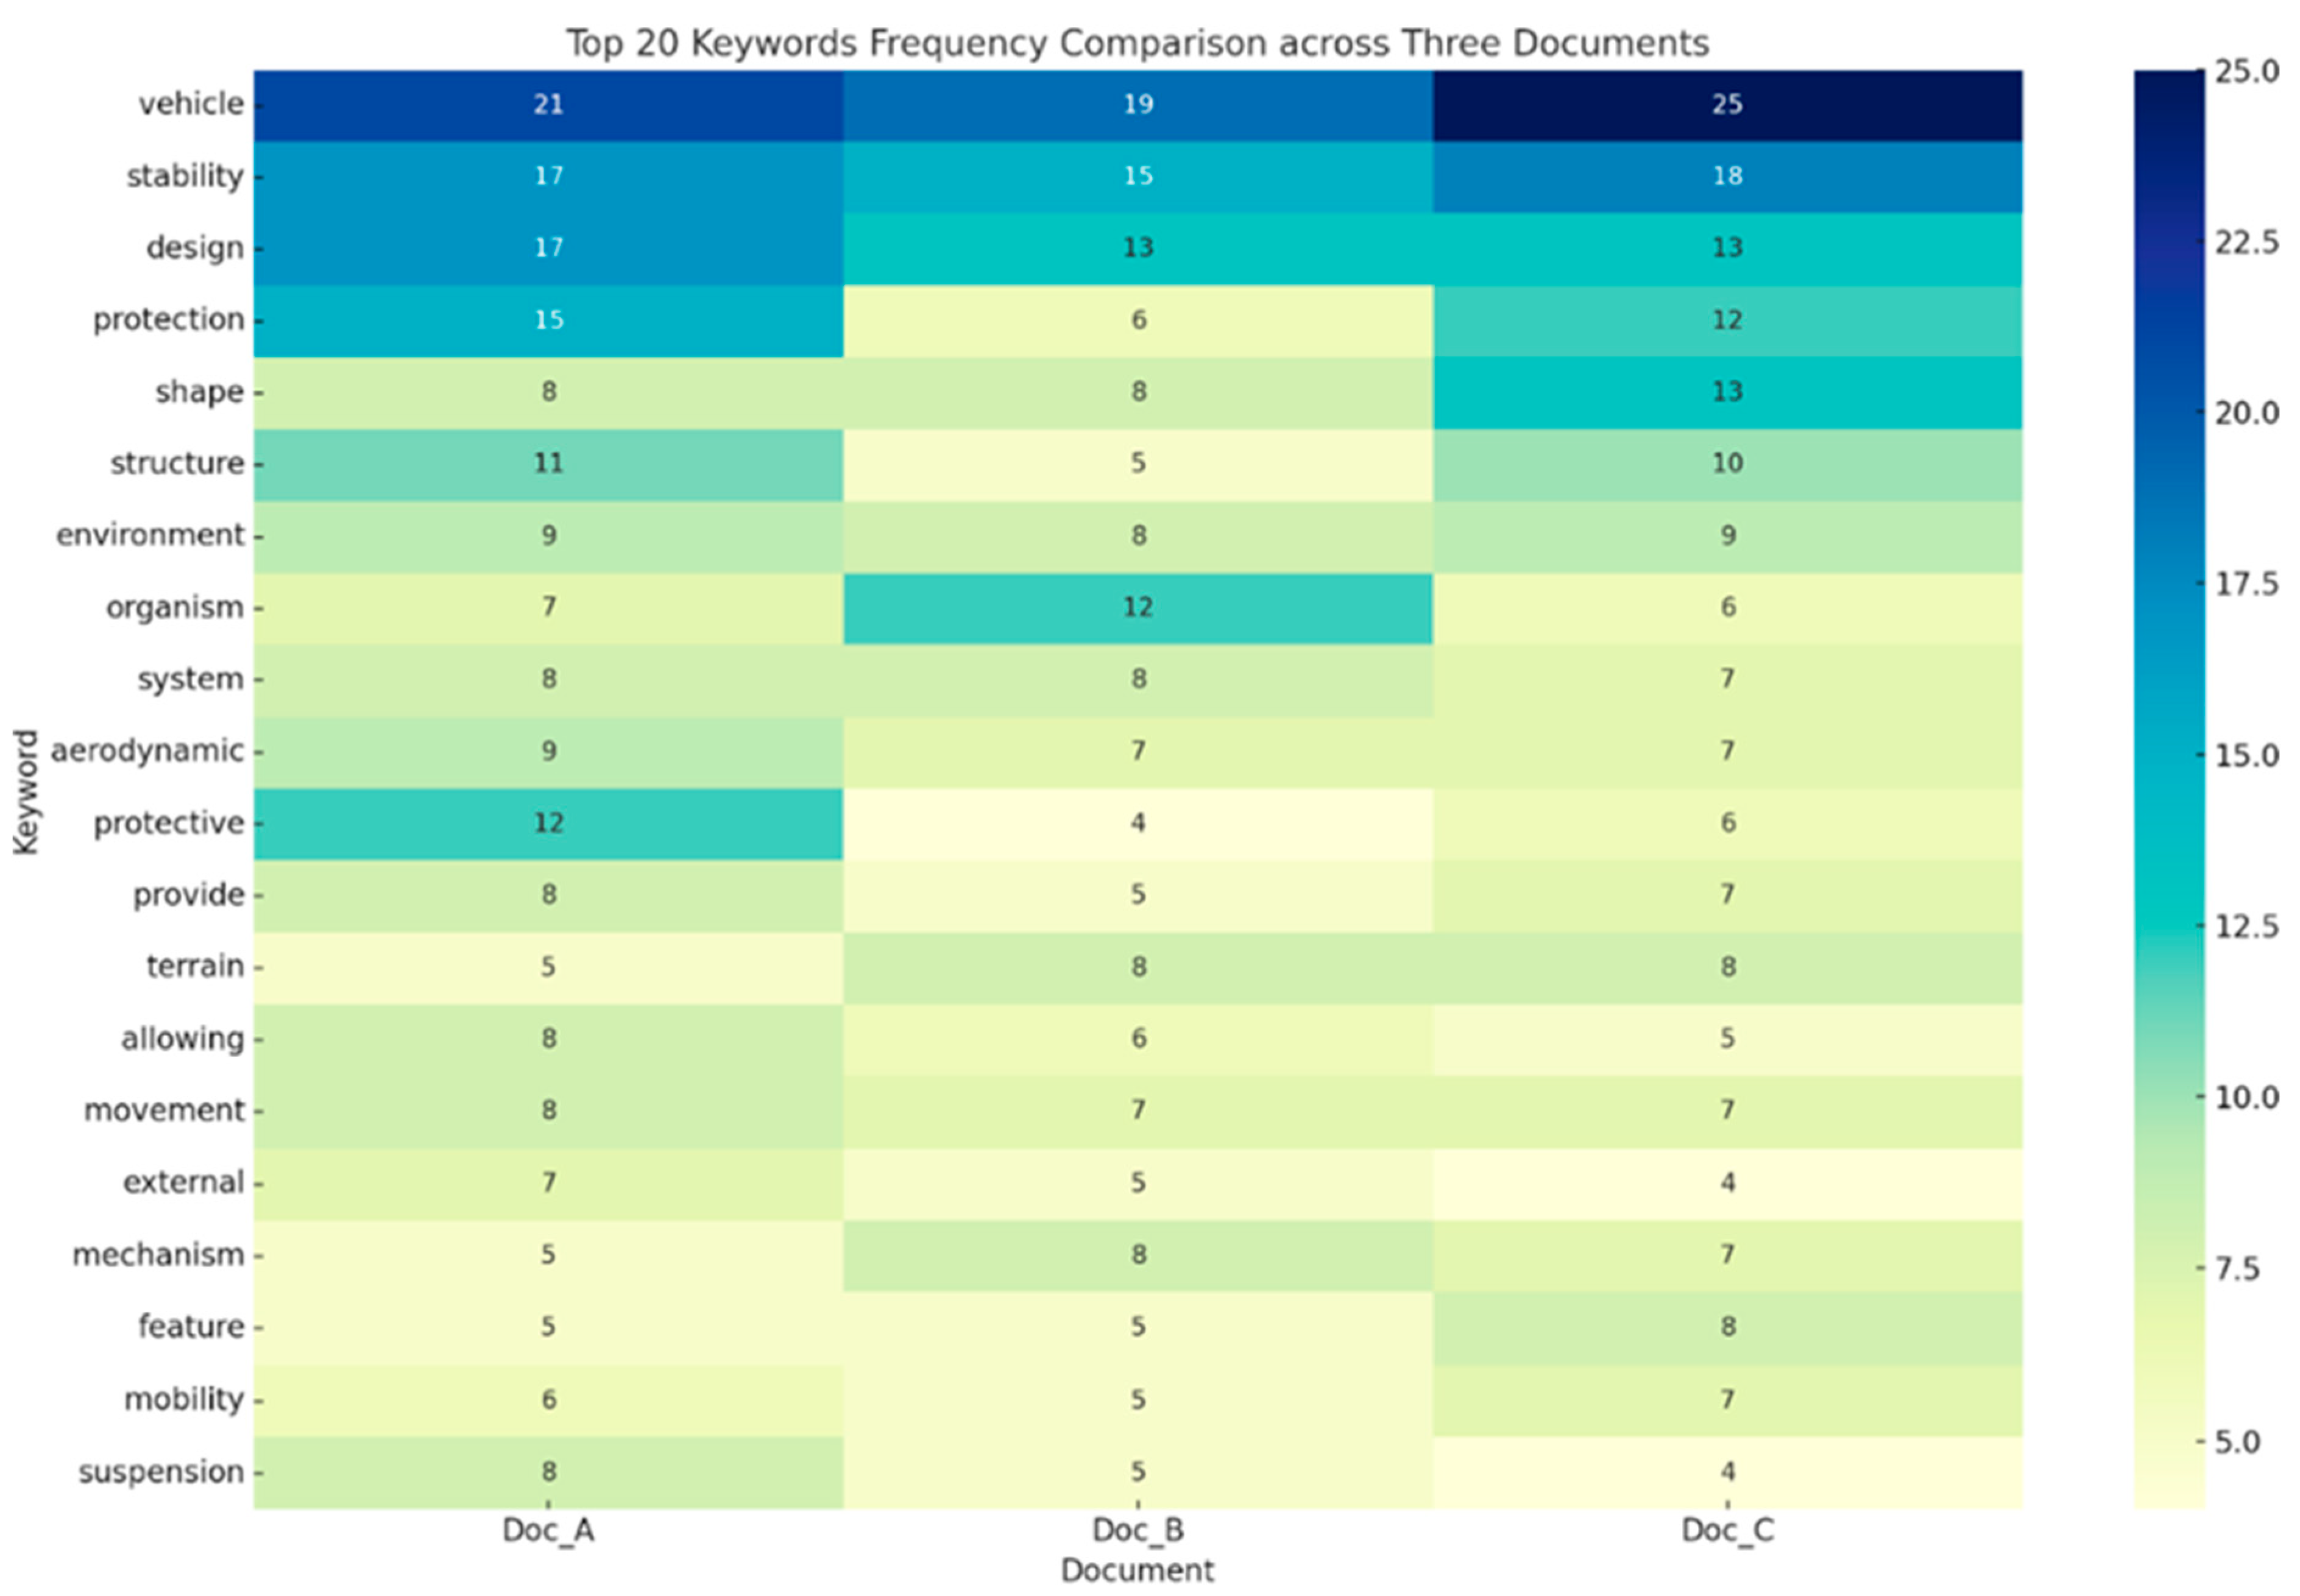
Keyword frequency heatmap of top 20 most frequently occurring terms across all conditions. Darker blue indicates higher relative frequency, while lighter yellow represents lower frequency. RAG-Large produced more domain-specific terms (e.g., “vehicle,” “stability,” “design”), whereas LLM-only relied on generic descriptors. This suggests that RAG enhances terminological precision.
Figure 5.
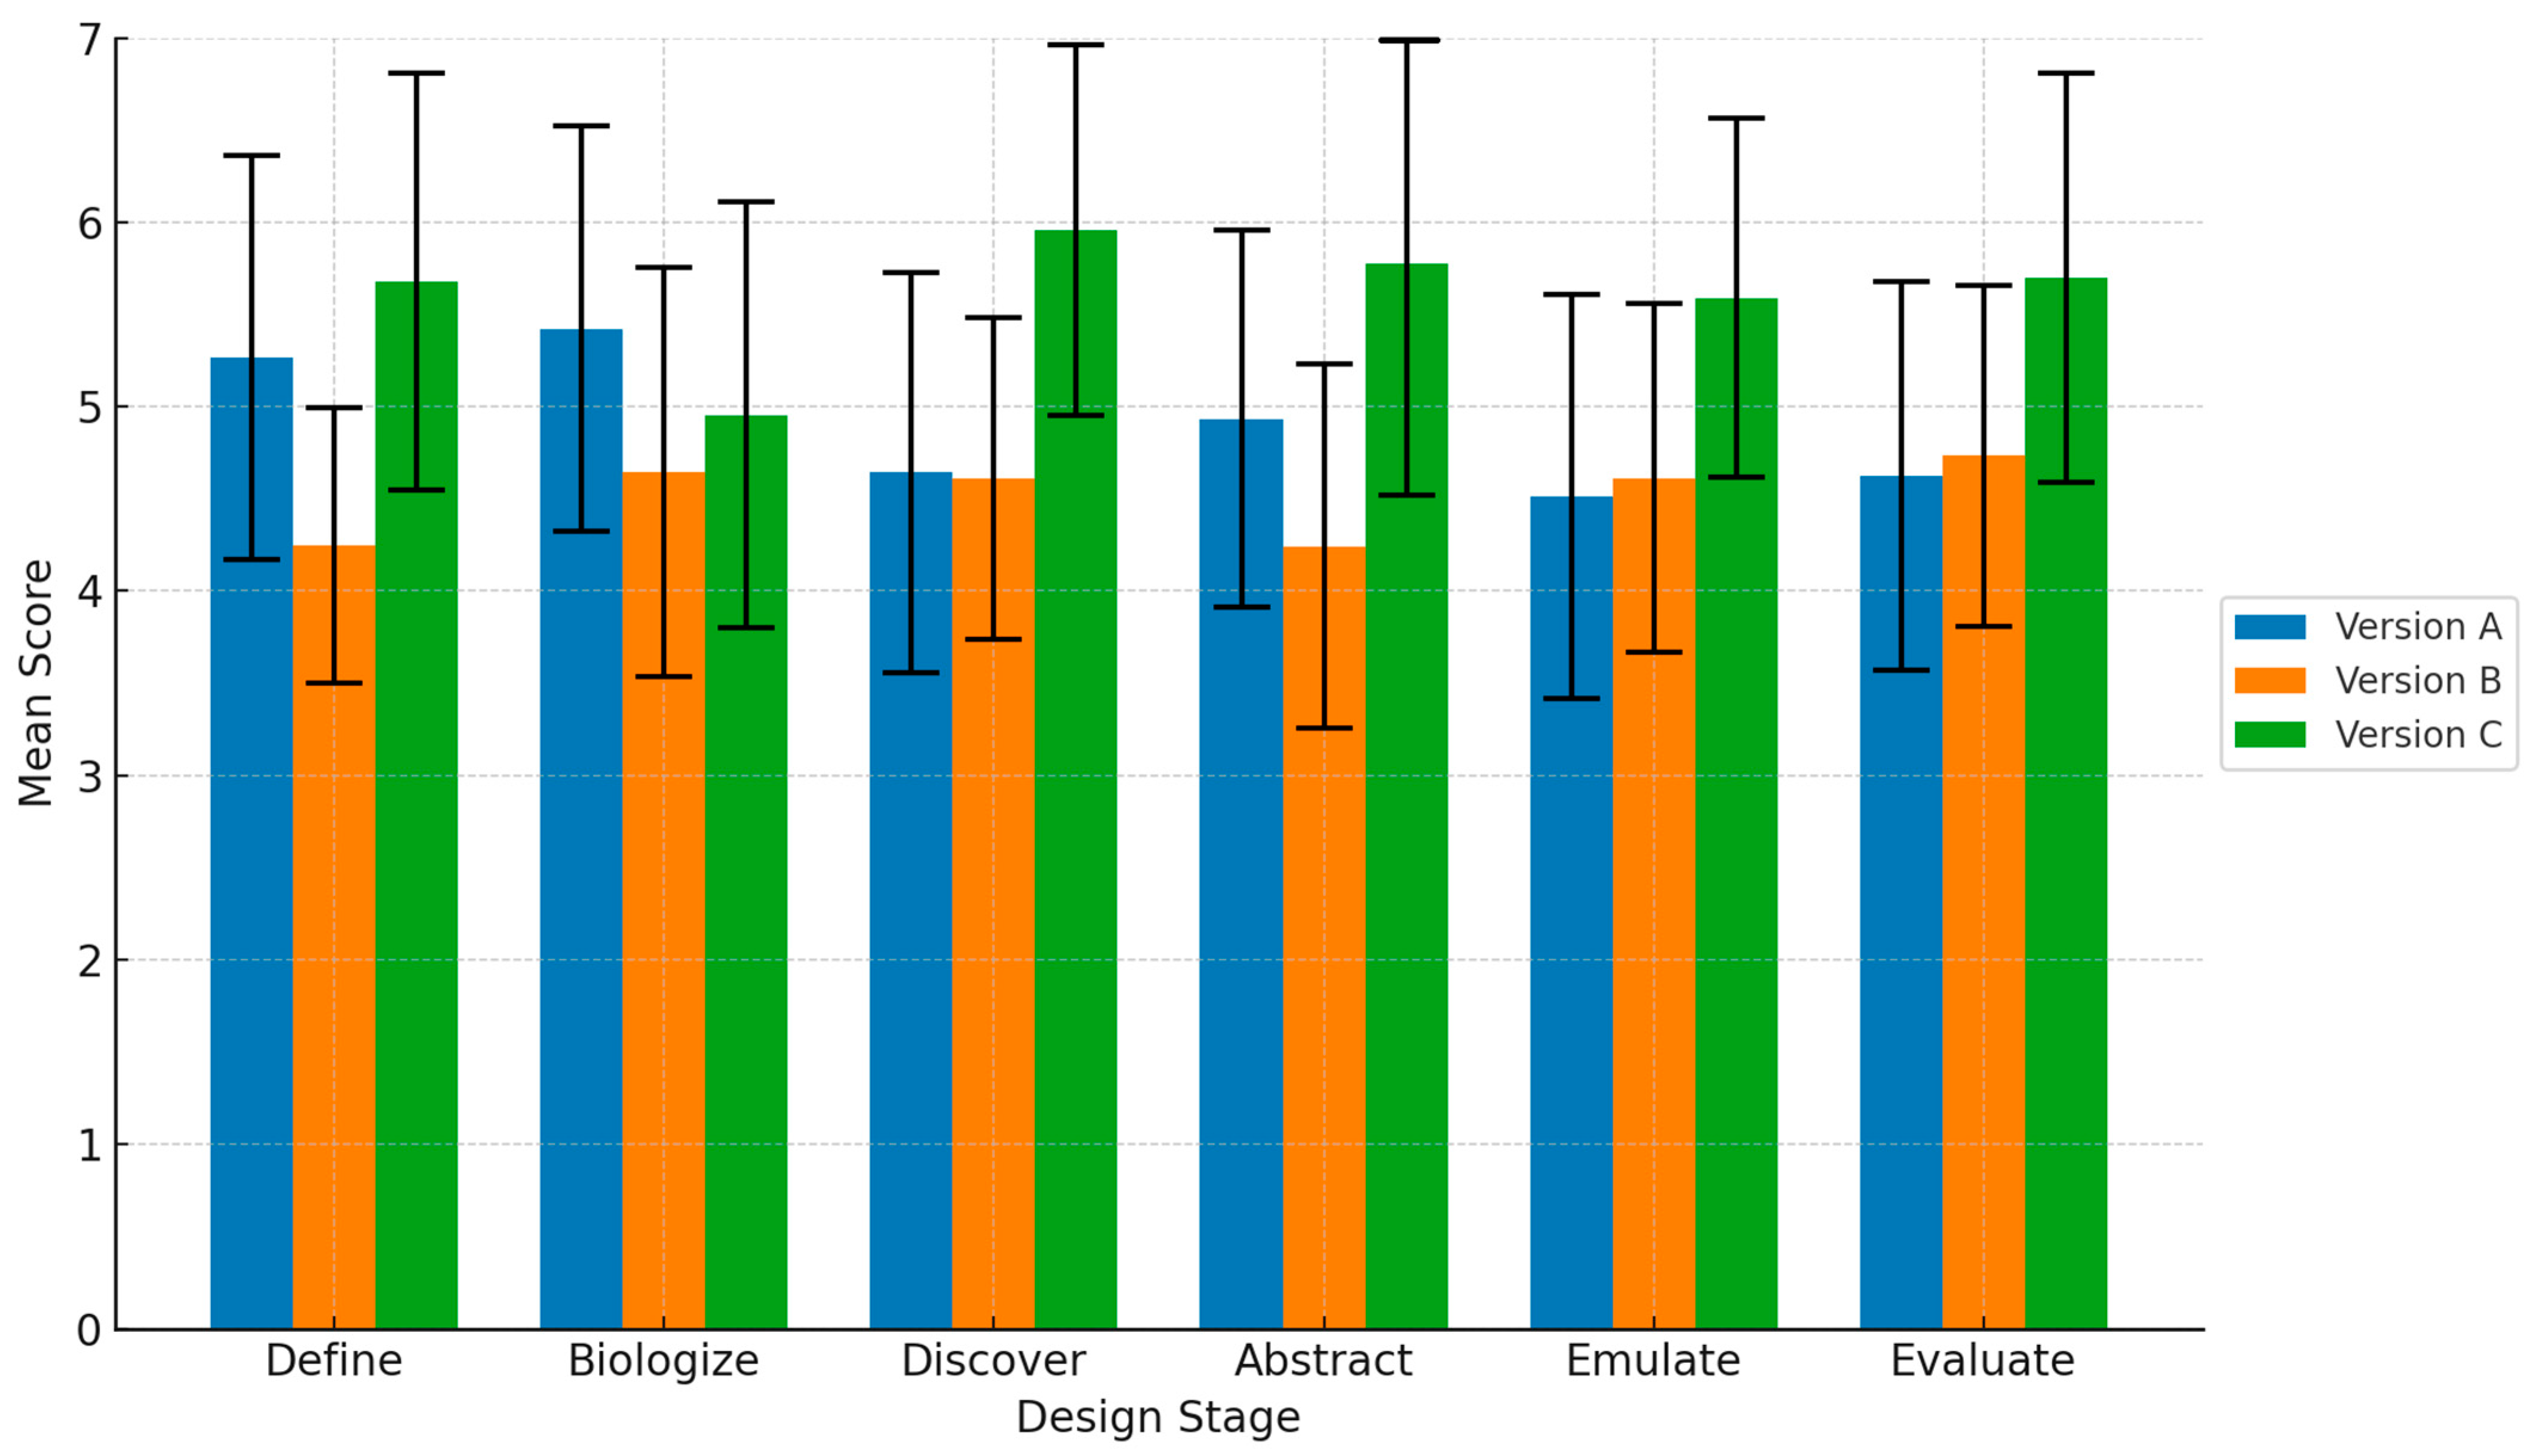
Comparison of mean scores across six BDS stages (Define–Evaluate). Error bars show standard deviations. RAG-Large outperformed other conditions, particularly during cognitively demanding stages such as Abstract and Emulate. This indicates that retrieval support is most beneficial in bridging the Discover–Abstract bottleneck.
Figure 6.
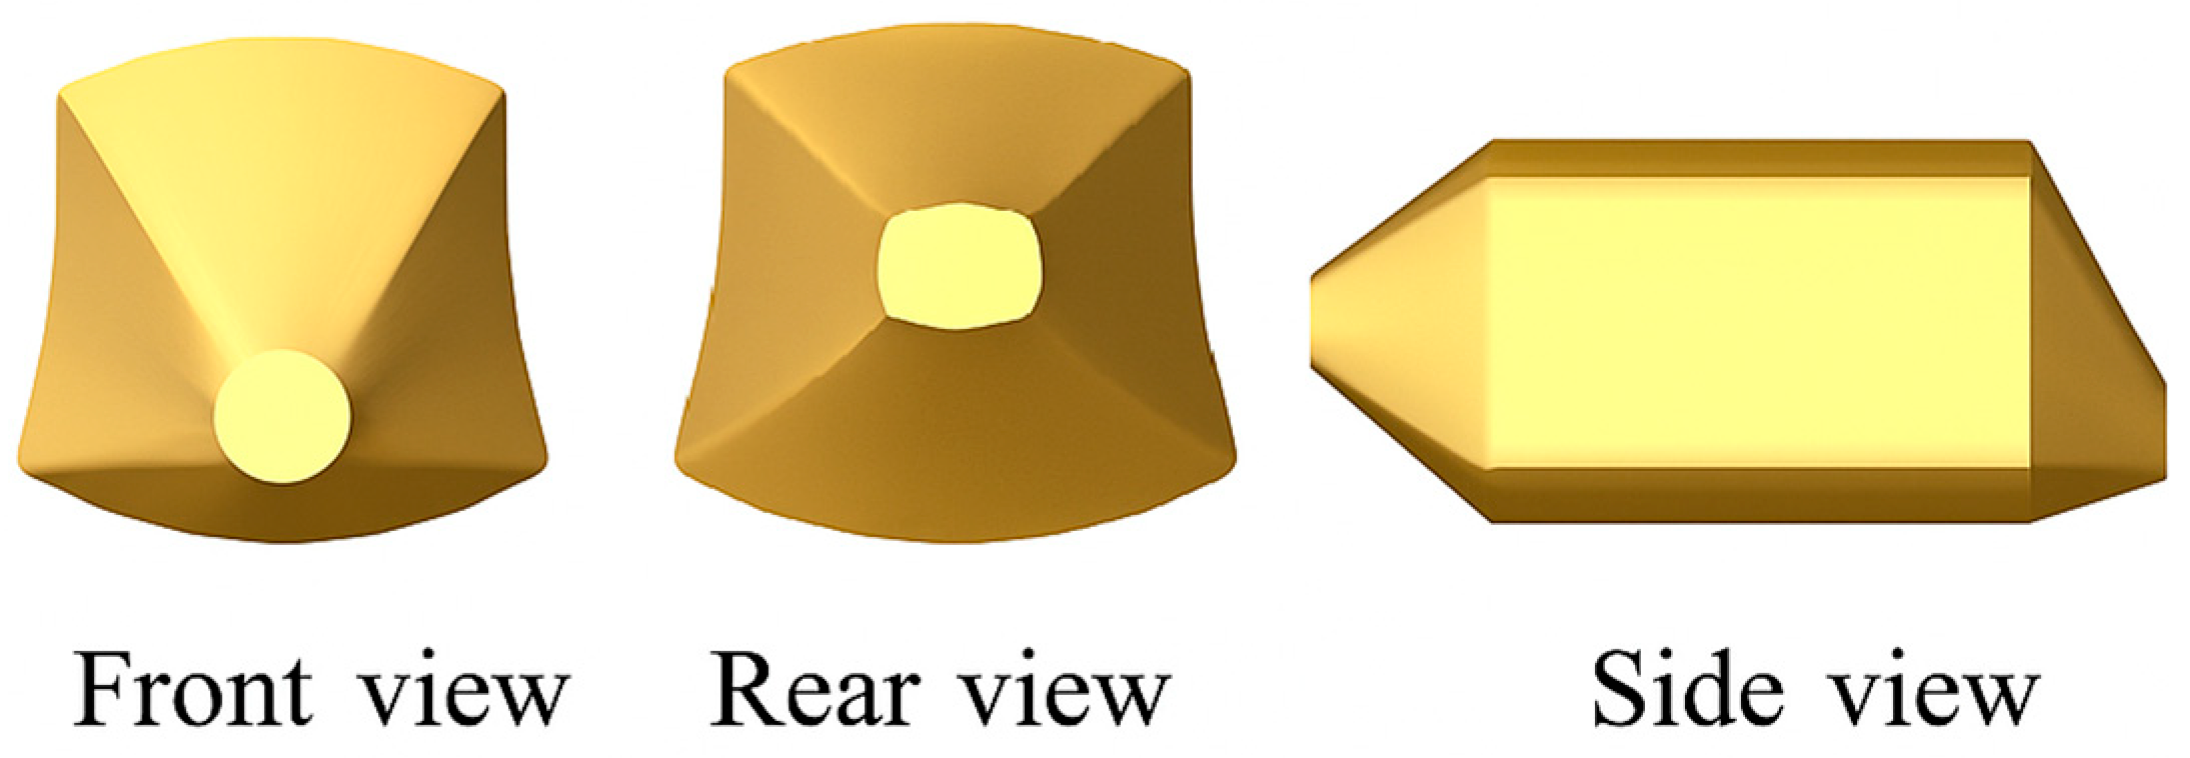
CAD models of Spotted boxfish, used as biological references. The streamlined morphology provided a baseline for evaluating AI-generated automotive concepts. This exemplar highlights how biological form can inform structural coherence and aerodynamic design. (redrawn from [
28], p. 111).
Figure 6.
CAD models of Spotted boxfish, used as biological references. The streamlined morphology provided a baseline for evaluating AI-generated automotive concepts. This exemplar highlights how biological form can inform structural coherence and aerodynamic design. (redrawn from [
28], p. 111).
Figure 7.
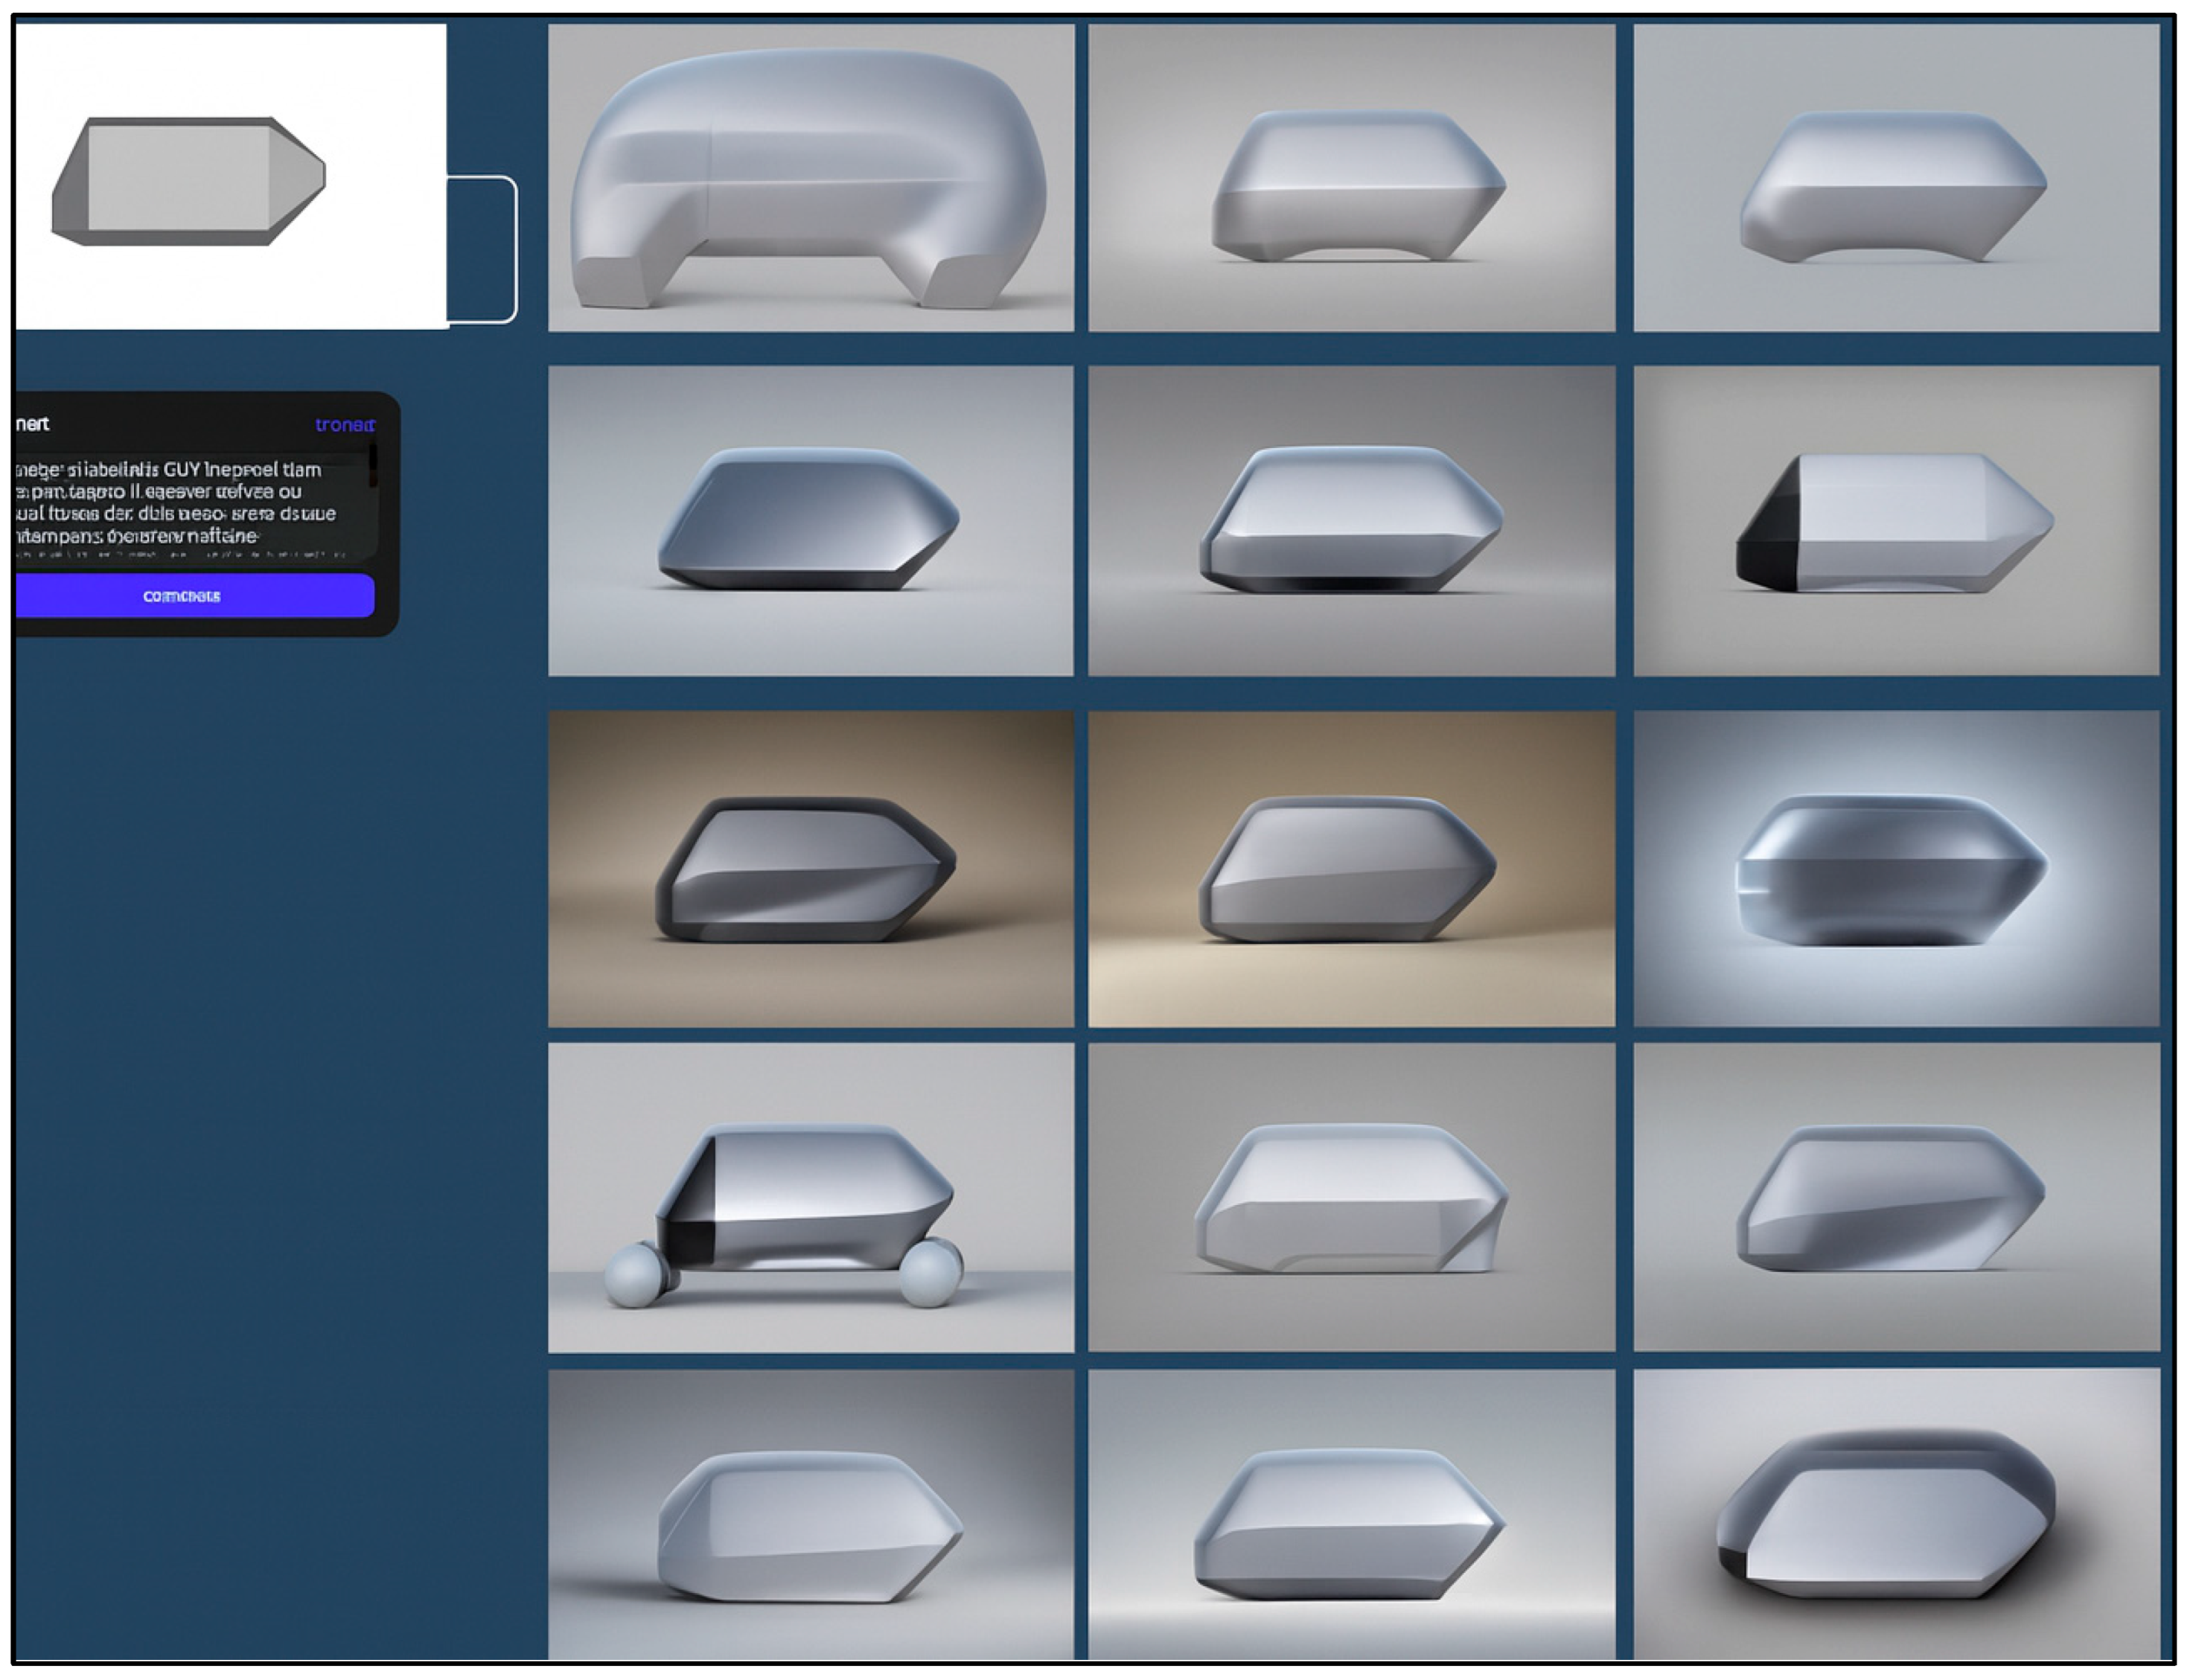
Phase 1 of concept generation: Basic image outputs derived from a boxfish CAD side-view silhouette using Vizcom’s “Car Shading” palette. Initial sketches emphasized overall proportion and surface flow, guided by aerodynamic and stability-focused prompts. This stage illustrates how biological morphology was visually translated into early-stage design proposals.
Figure 8.
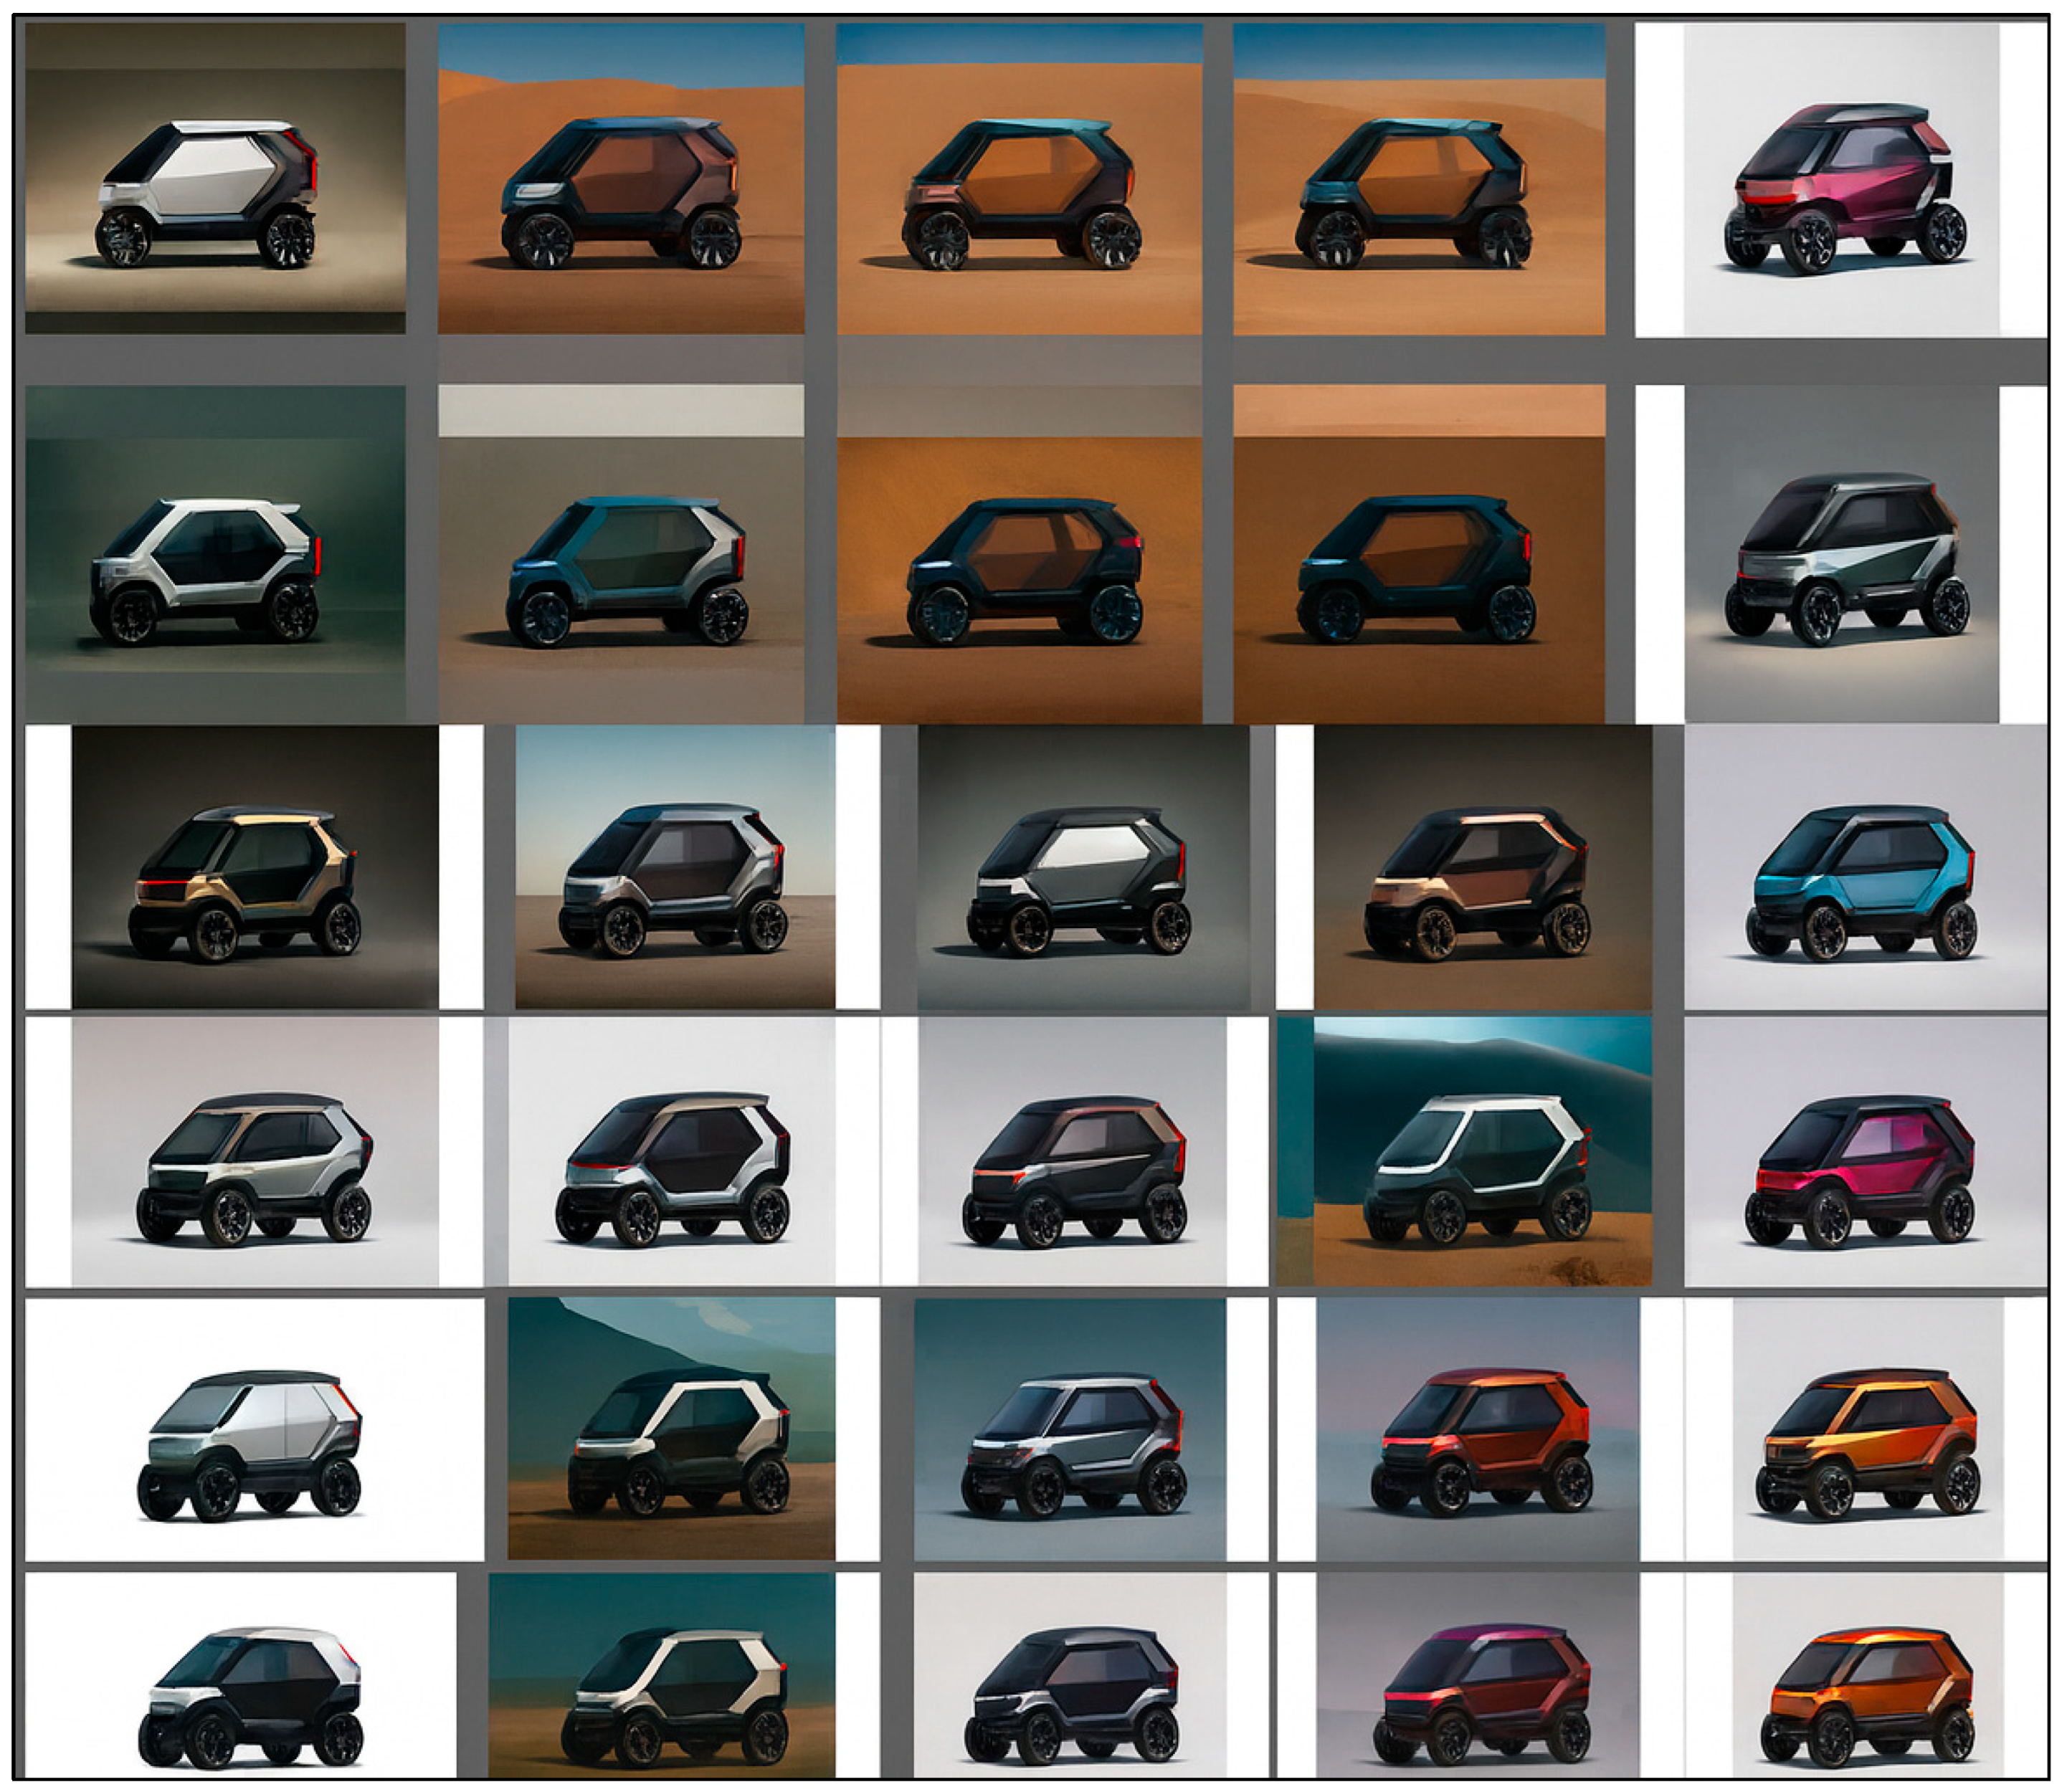
Phase 2 of concept generation: Integration of functional components (e.g., wheels, windows, structural panels) into preliminary sketches. These additions demonstrate how functional analogies from biology were embedded into evolving design concepts.
Figure 8.
Phase 2 of concept generation: Integration of functional components (e.g., wheels, windows, structural panels) into preliminary sketches. These additions demonstrate how functional analogies from biology were embedded into evolving design concepts.
Figure 9.
Phase 3 of concept generation: Enhanced design details emphasizing structural and aesthetic alignment with biological inspirations. Notably, surface segmentation was guided by beetle exoskeleton analogies, reinforcing functional and stylistic fidelity.
Figure 9.
Phase 3 of concept generation: Enhanced design details emphasizing structural and aesthetic alignment with biological inspirations. Notably, surface segmentation was guided by beetle exoskeleton analogies, reinforcing functional and stylistic fidelity.
Figure 10.
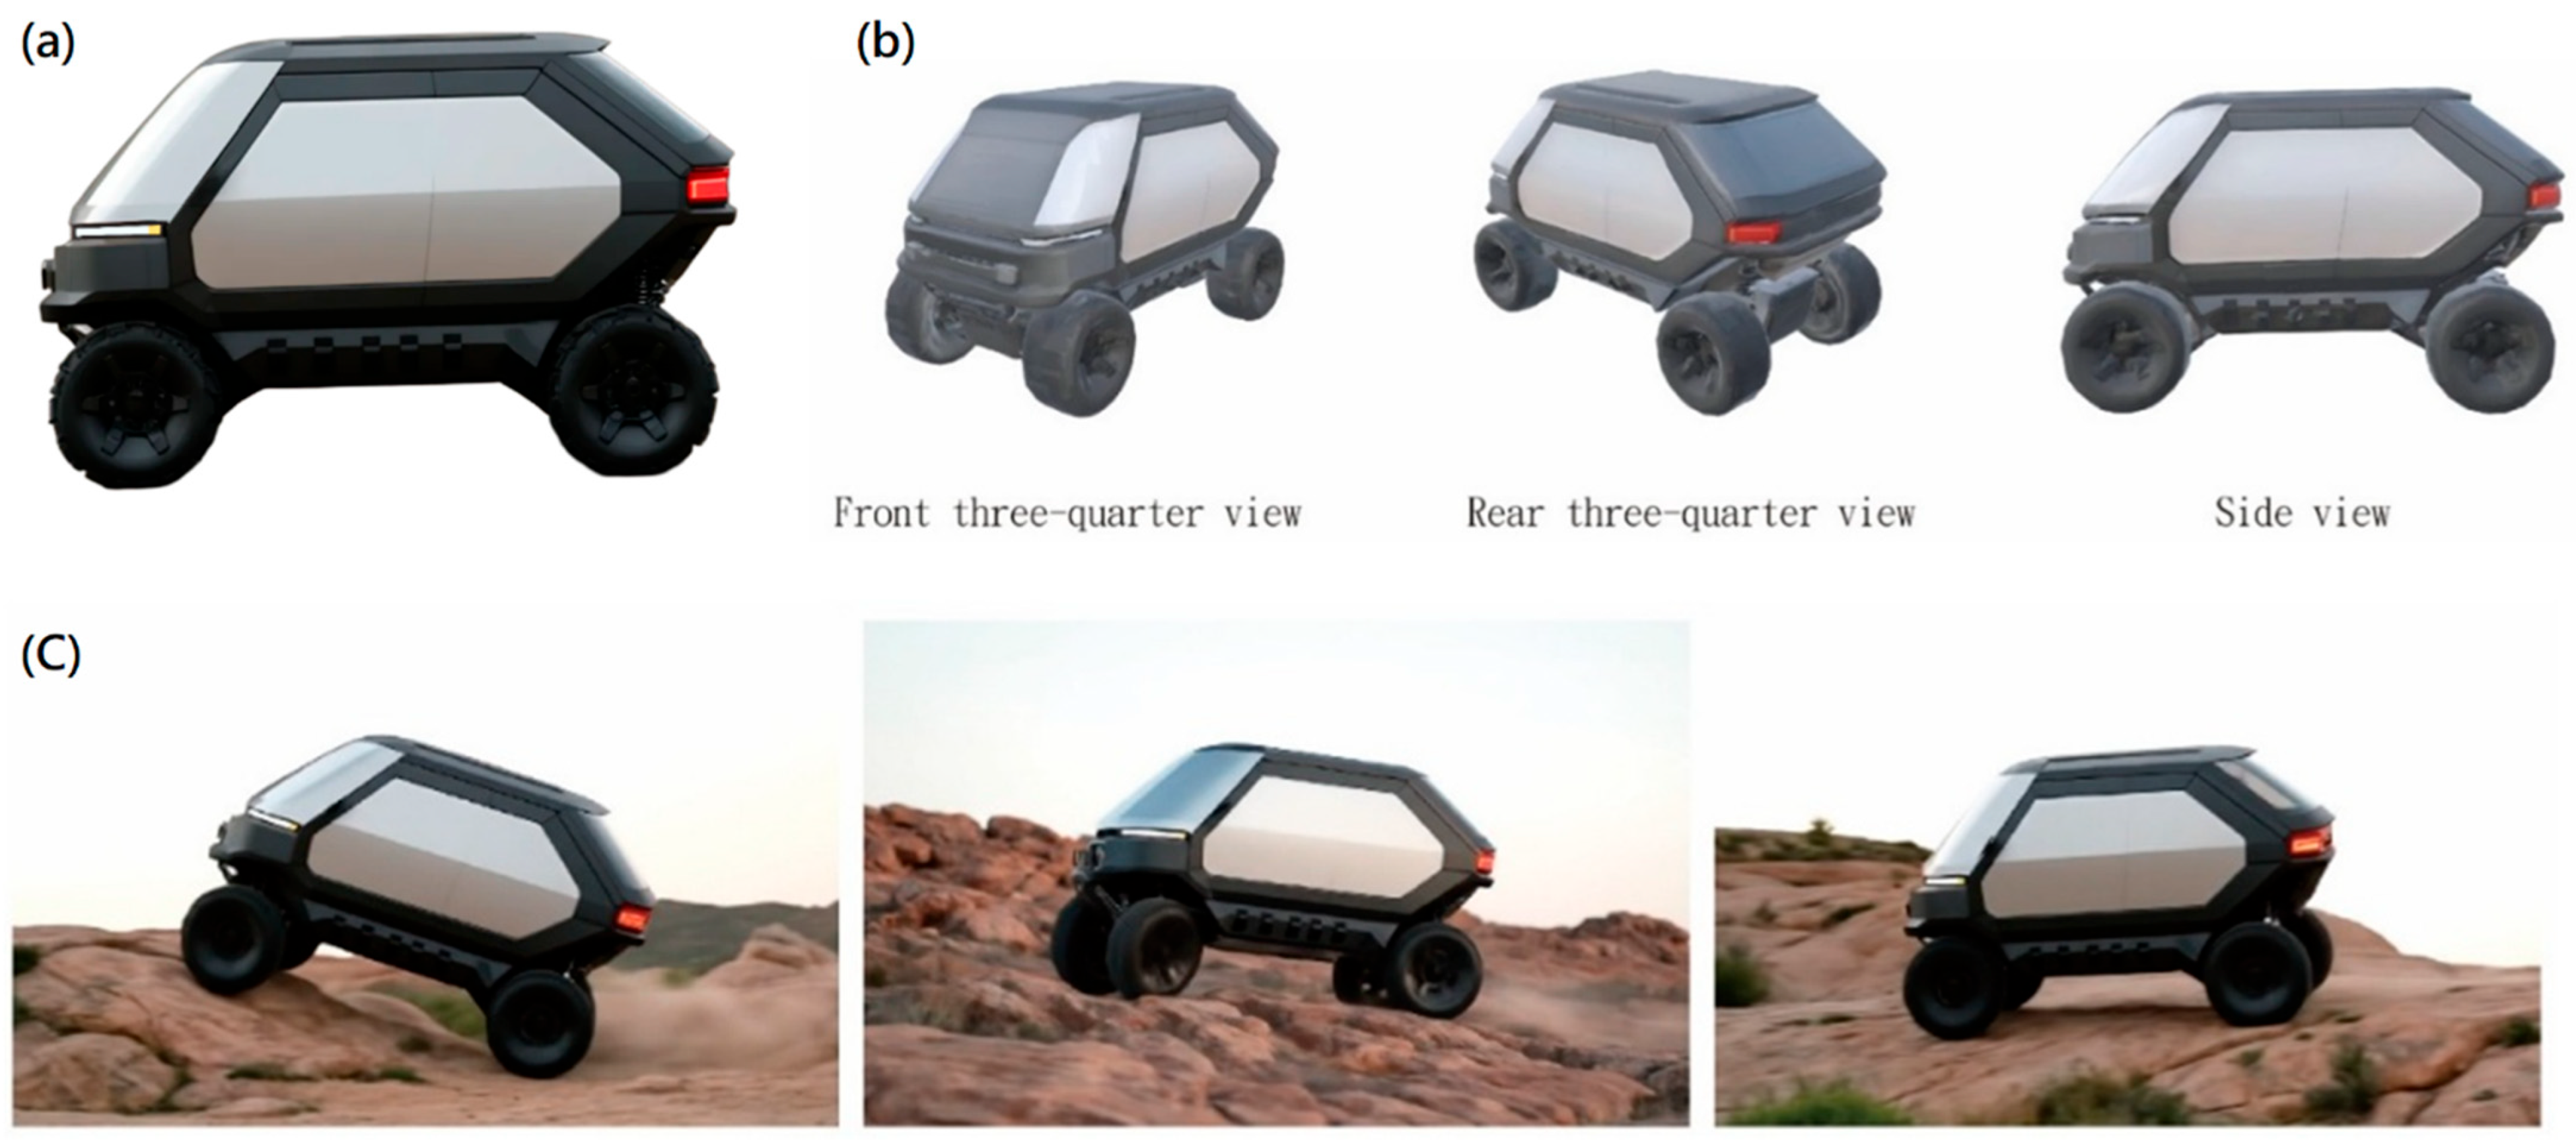
2D-to-3D model conversion and contextual visualization of the biomimetic vehicle. Vizcom-generated 3D models are shown from multiple perspectives: (a) front view and (b) side/isometric views. Panel (c) places the model in AI-generated backgrounds to support structural verification, scenario simulation, and design presentation. This stage demonstrates the feasibility of translating biological principles into manufacturable product semantics.
Figure 11.
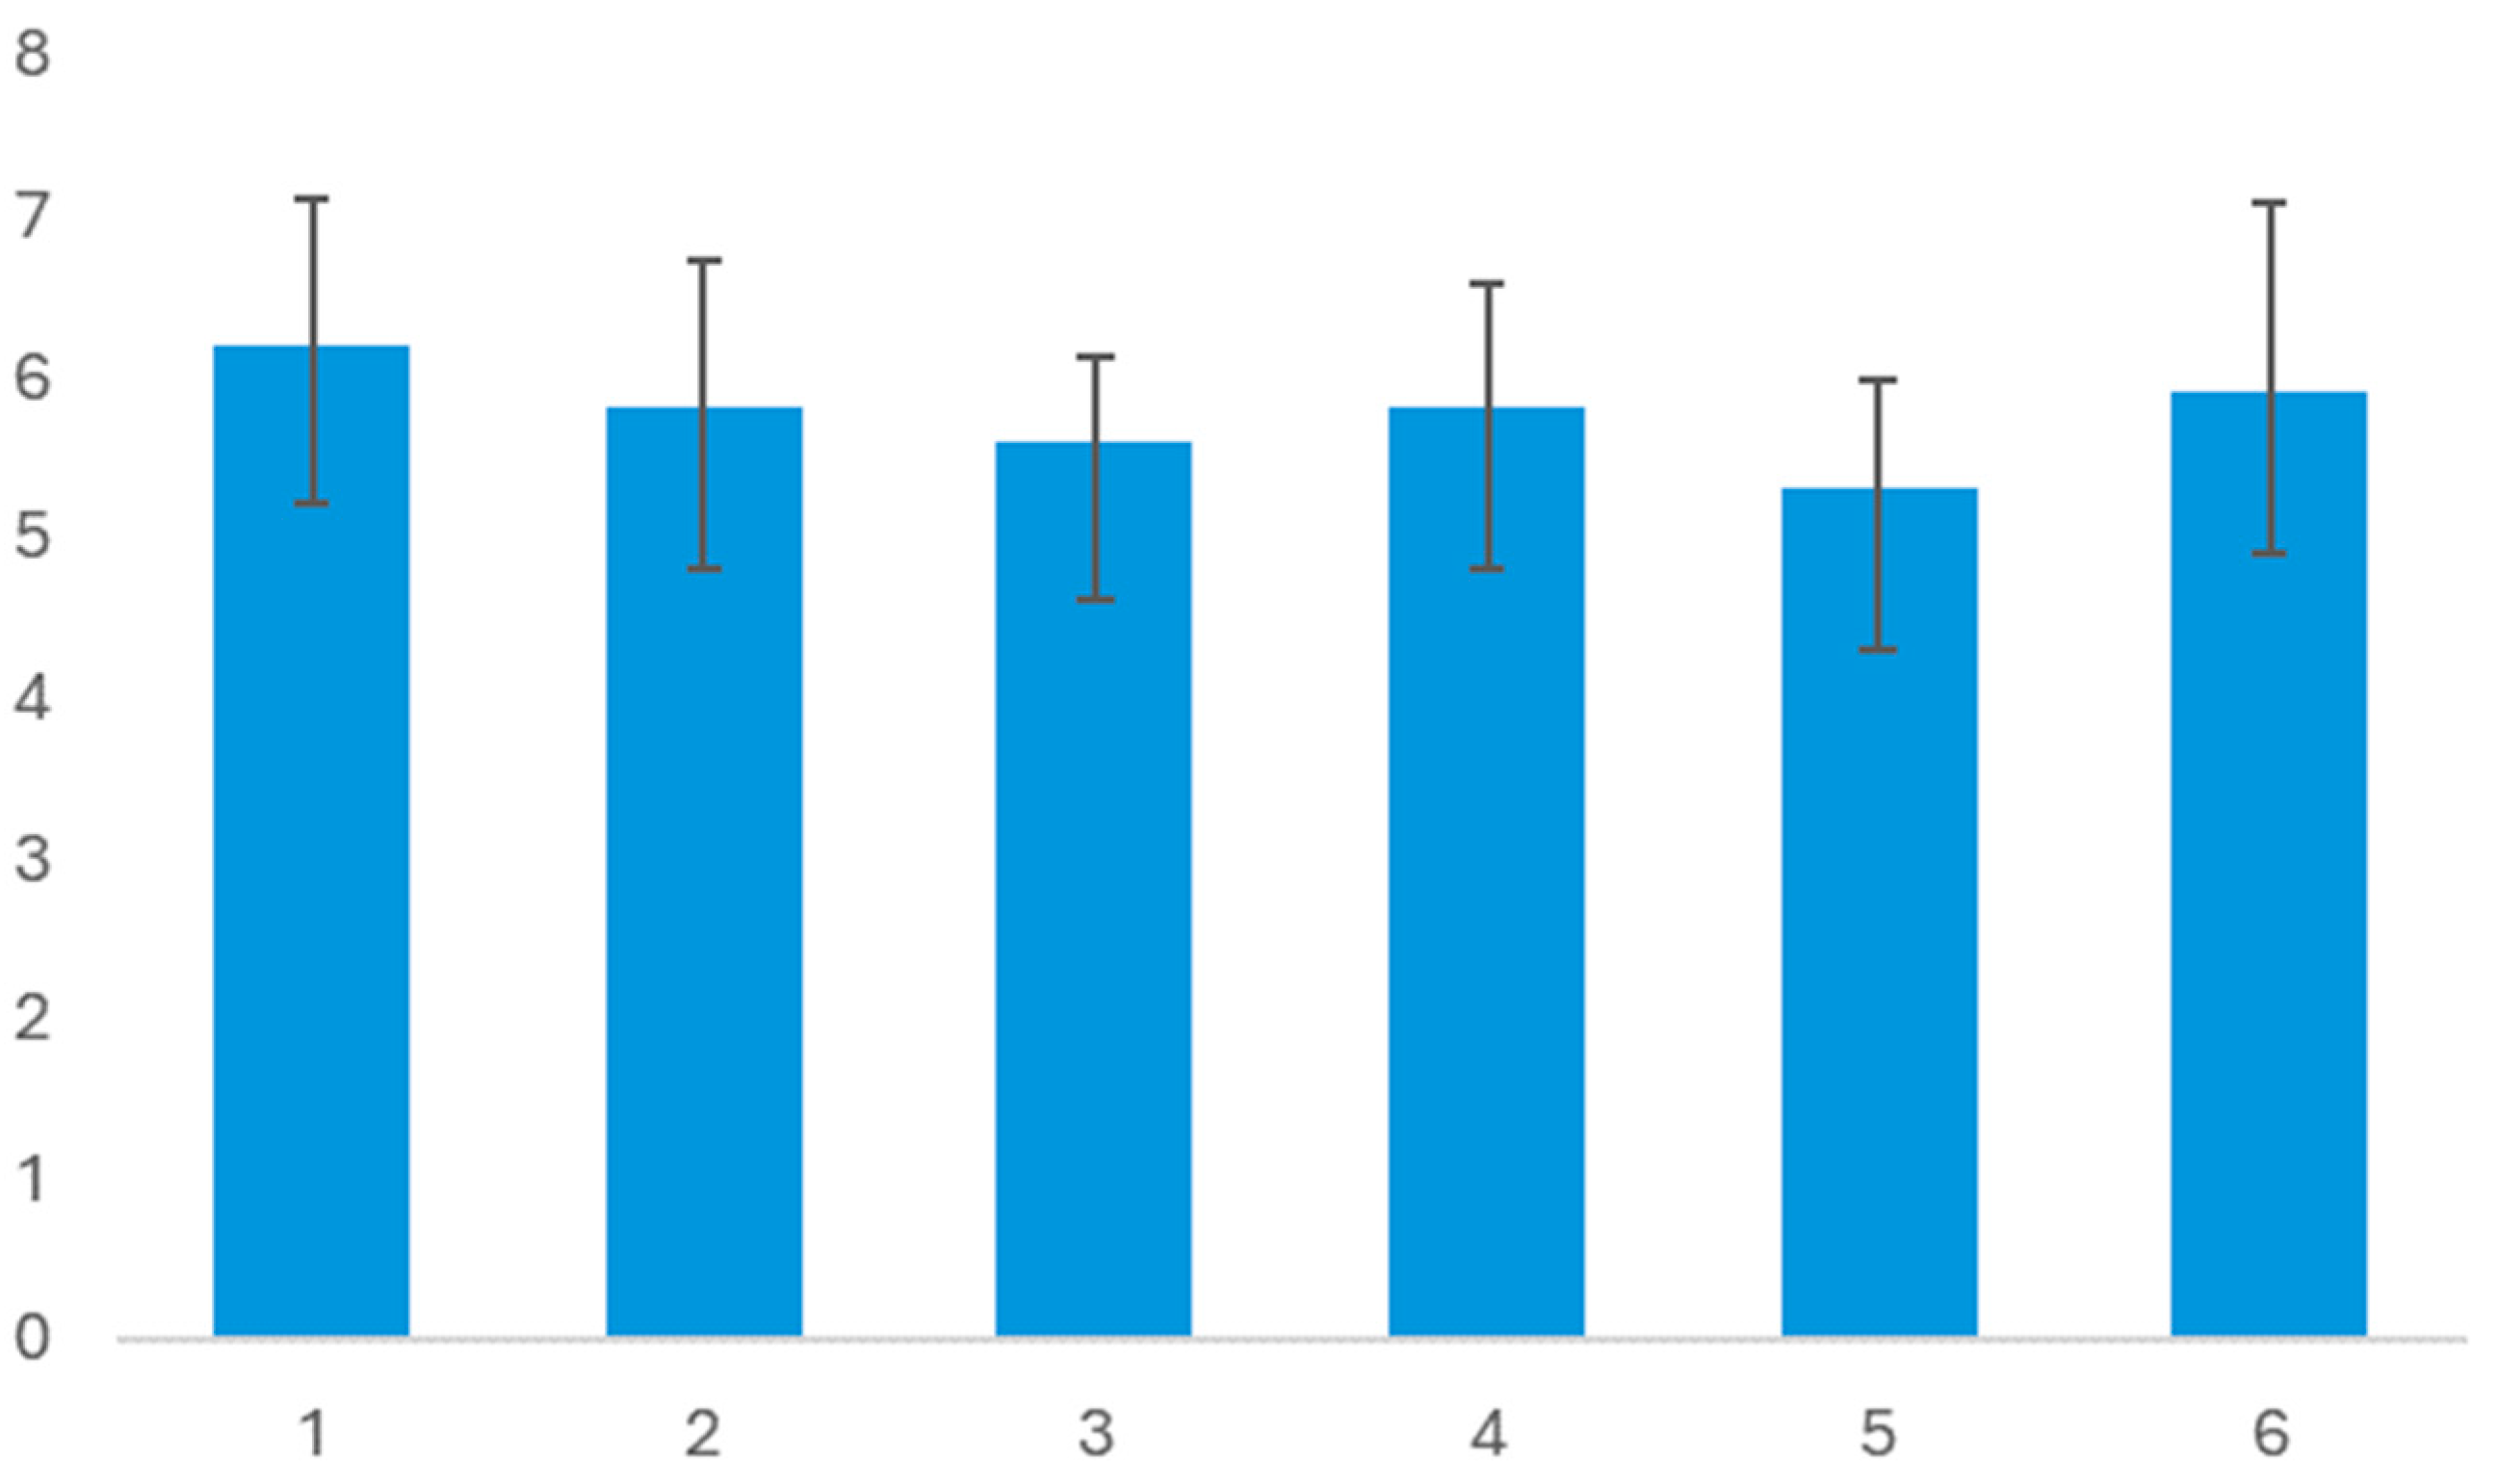
Comparison of mean scores of the six evaluation criteria for design quality (fidelity, discernibility, novelty, stylistic alignment, innovation, and potential to challenge conventions). Error bars represent standard deviations. RAG-Large achieved the highest ratings across most criteria. For example, beetle-inspired exoskeletal structures were rated highly for innovation and functional coherence.
Table 1.
Comparison of three representative biomimicry design models (BDS, BioTRIZ, and SAPPhIRE/BIDARA). While BioTRIZ and SAPPhIRE provide systematic reasoning, they require specialized expertise, whereas the BDS is more intuitive but limited by manual retrieval in the Discover–Abstract stage. This highlights the rationale for integrating BDS with AI-supported tools.
| Model | Knowledge and Process | Engineering Focus | Strengths | Limitations/Gaps | References |
|---|
| BDS | Stepwise process (Define →Biologize→Discover →Abstract→Emulate→Evaluate) translating biological strategies into design concepts | Broad applicability across product and system design; emphasizes sustainability and innovation | Intuitive and iterative; suitable for general design practice | Low computational support; inefficient knowledge retrieval; Discover–Abstract transition depends on biological expertise | [3,8,13] |
| BioTRIZ | TRIZ-based contradiction-solving mapped to biological analogies | Functional optimization and engineering conflict resolution | Structured engineering reasoning; effective for systems | Requires TRIZ expertise; limited support for complex biological systems | [9,10] |
| SAPPhIRE/BIDARA | Causal model (System–Action–Part–Phenomenon–Input–oRgan–Effect) for representing biological mechanisms | Computational reasoning; supports knowledge-based engineering and automated concept generation | Formalized knowledge modeling; scalable for database integration | High modeling complexity; requires detailed biological data; less intuitive for non-engineers | [6,11] |
Table 2.
Demographic characteristics of participants in the version comparison and image quality evaluation experiments. The sample included 30 postgraduate industrial design students, with a balanced mix of genders and varying levels of design background and AI experience. These characteristics provide context for interpreting evaluation outcomes and highlight the exploratory nature of the study.
| Category | Subcategory | Version Comparison Experiment (n) | Percentage (%) | Image Quality Evaluation (n) | Percentage (%) |
|---|
| Gender | Male | 17 | 56.7 | 3 | 75.0 |
| Female | 13 | 43.3 | 1 | 25.0 |
| Education | Bachelor’s degree | 6 | 20.0 | 0 | 0.0 |
| Master’s degree | 23 | 76.7 | 3 | 75.0 |
| Doctoral degree | 1 | 3.3 | 1 | 25.0 |
| Age | 18–25 years | 19 | 63.3 | 1 | 25.0 |
| 26–35 years | 10 | 33.3 | 2 | 50.0 |
| 36–55 years | 1 | 3.3 | 0 | 0.0 |
| Above 55 years | 0 | 0 | 1 | 25.0 |
Table 3.
Hardware specifications of the experimental system used for model execution and evaluation. The setup included a consumer-grade laptop with an RTX 4050 GPU, ensuring consistent performance across all conditions. These specifications contextualize the feasibility of running retrieval-augmented generation workflows on accessible, mid-range hardware rather than high-performance clusters.
| Component | Specification |
|---|
| Processor (CPU) | Intel® Core™ i9-12900 (14 cores/20 threads) |
| Graphics Card (GPU) | NVIDIA® GeForce RTX™ 3070 Ti Laptop GPU/8 GB, GDDR6 VRAM, 120 W TGP |
| Memory (RAM) | 48 GB DDR5-4800 |
Table 4.
Computational tools of the experimental system. The setup combined Python-based environments (e.g., Jupyter Notebook 7.0.8, Colab) with AI-specific platforms (Ollama, AnythingLLM, Vizcom) to enable retrieval, generation, and visualization. These tools ensured an integrated workflow for implementing and evaluating the RAG-based biomimicry design framework.
| Computational Tools | Version |
|---|
| Python | 3.11.5 |
| LLM | Llama 3.1:8b |
| Ollma | 0.5.11 |
| OpenWeb UI | V0.6.4 |
| Docker | 4.38.0 |
| Llama | 3.1 |
Table 5.
Seven-point rubric used to evaluate RAG-generated vehicle design images. The rubric covered six key criteria: fidelity to biomimicry, discernibility of biological inspiration, novelty of design, stylistic alignment with intended imagery, innovation of structures or functions, and potential to challenge conventional vehicle concepts. This structured evaluation framework enabled expert raters to assess both functional adherence and creative originality in the generated designs.
| Stage | Prompt Brief | Example Wording |
|---|
| Define | Frame the design problem | How can a vehicle be designed to adapt to extreme off-road exploration environments while ensuring stability, mobility and protection? How can rigid structures and aerodynamic characteristics enhance maneuverability? |
| Biologize | Identify relevant organisms and structures | Which organisms have square-like shapes with good stability and aerodynamic properties? Which organisms possess adaptive external protective mechanisms? |
| Discover | Retrieve biological strategies and precedents | Which organisms have been proven to influence fluid dynamics through their rigid frameworks? Which of these have already inspired vehicle design concepts in previous research? |
| Abstract | Translate biology into engineering principles | How can the identified strategies be translated into vehicle body design to ensure stability and adaptability? How can exoskeletal structures influence aerodynamics and be integrated with space-utilization design? |
| Emulate | Integrate principles into a concept | How can rigid exoskeletal structures, aerodynamic shapes and adaptive protective mechanisms be integrated to develop an initial off-road exploration vehicle design? What prototyping techniques (CAD simulations, materials, structural testing) can validate these concepts? |
| Evaluate | Assess feasibility and refine | Can the biomimetic design achieve stability, mobility and protection in real environments? How do materials, structures and fluid dynamics compare to natural systems? What manufacturing or commercial challenges might arise, and which stage of the BDS should be revisited to improve maturity? |
Table 6.
Seven-point rubric for evaluating RAG-generated vehicle design images. The rubric included six criteria: (1) adherence to biomimicry, (2) discernibility of the biological inspiration, (3) novelty of the design, (4) stylistic alignment with intended imagery, (5) innovation of structures or functions, and (6) potential to challenge conventional vehicle concepts. This structured scale enabled expert raters to assess both functional adherence and creative originality in the generated concepts.
| Criterion (Label) | Rater-Facing Item |
|---|
| Adherence to the bionic concept | 1. Whether the design adheres to the bionic concept? |
| Discernibility of the inspiration | 2. Whether the bionic inspiration is clearly discernible in the design? |
| Novelty of the design | 3. Whether the design is novel? |
| Stylistic alignment with intended imagery | 4. Whether the design style matches the image? |
| Innovation in structure or functionality | 5. Whether the vehicle exhibits innovative structure or functionality? |
| Potential to challenge conventional vehicle concepts | 6. Whether it offers a novel concept of vehicle design? |
Table 7.
Generation speed across experimental conditions (LLM-only, RAG-Small, and RAG-Large). Metrics include mean word count, total generation time, and average time per word during the Define–Abstract stages. Results show that retrieval augmentation (RAG-Small and RAG-Large) did not significantly reduce generation efficiency compared to LLM-only, while producing more information-rich outputs.
| Mode | Content Length | Total Generation Time | Average Time per Word |
|---|
| A (LLM-only) | 2227 words | 294 s | ~0.132 s/word |
| B (RAG-Small) | 1900 words | 231 s | ~0.121 s/word |
| C (RAG-Large) | 2029 words | 260 s | ~0.128 s/word |
Table 8.
IDF values of organisms appearing in the three Version ConditionsInverse document frequency (IDF) values of organisms retrieved across the three experimental conditions (LLM-only, RAG-Small, and RAG-Large). Higher IDF values indicate rarer and more specific inspirations (e.g., pangolin, boxfish, beetle), while lower values denote commonly retrieved organisms (e.g., shark). The results show that RAG-Large produced more diverse and unique inspirations, reflecting its broader knowledge base, whereas LLM-only leaned on familiar species. These findings highlight how RAG improves both diversity and specificity in biomimetic knowledge translation.
| Item No. | N | df | IDF |
|---|
| 1 | boxfish | 1 | 1.0986 |
| 2 | pangolin | 1 | 1.0986 |
| 3 | beetle | 1 | 1.0986 |
| 4 | jellyfish_family | 2 | 0.4055 |
| 5 | armadillo | 2 | 0.4055 |
| 6 | turtle | 2 | 0.4055 |
| 7 | shark | 3 | 0 |
Table 9.
Intraclass correlation coefficients (ICCs) for text quality ratings (N = 30). A two-way random-effects model with absolute agreement was used. Single-measure ICC(2,1) values indicated low agreement among individual raters (ICC = 0.213, 95% CI [0.118, 0.400]), while average-measure ICC(2,k) values demonstrated high reliability when ratings were aggregated (ICC = 0.890, 95% CI [0.801, 0.952]). These results suggest that although individual judgments varied considerably, consensus ratings across multiple raters provided a stable and reliable assessment of text quality.
| Measure type | ICC | 95% CI (Lower, Upper) | F | df1 | df2 | p |
|---|
| Single measures (ICC[2,1]) | 0.213 | 0.118, 0.400 | 11.063 | 16 | 464 | <0.001 |
| Average measures (ICC[2,k]) | 0.890 | 0.801, 0.952 | 11.063 | 16 | 464 | <0.001 |
Table 10.
Descriptive Statistics for Each Design Stage by Version (N = 30).
Table 10.
Descriptive Statistics for Each Design Stage by Version (N = 30).
| Design Stage | Text | Mean | SD | 95% CI (Lower, Upper) |
|---|
| Define | A | 5.266 | 1.099 | 4.856, 5.677 |
| B | 4.244 | 0.747 | 3.965, 4.523 |
| C | 5.678 | 1.132 | 5.255, 6.101 |
| Biologize | A | 5.422 | 1.100 | 5.011, 5.833 |
| B | 4.644 | 1.111 | 4.229, 5.059 |
| C | 4.954 | 1.157 | 4.522, 5.386 |
| Discover | A | 4.644 | 1.086 | 4.238, 5.050 |
| B | 4.610 | 0.870 | 4.285, 4.935 |
| C | 5.957 | 1.008 | 5.580, 6.333 |
| Abstract | A | 4.932 | 1.022 | 4.550, 5.314 |
| B | 4.243 | 0.986 | 3.875, 4.612 |
| C | 5.778 | 1.257 | 5.308, 6.247 |
| Emulate | A | 4.511 | 1.096 | 4.101, 4.920 |
| B | 4.611 | 0.947 | 4.257, 4.965 |
| C | 5.589 | 0.974 | 5.225, 5.953 |
| Evaluate | A | 4.622 | 1.055 | 4.228, 5.016 |
| B | 4.733 | 0.924 | 4.388, 5.078 |
| C | 5.700 | 1.109 | 5.286, 6.114 |
Table 11.
Analysis of variance (ANOVA) results for text quality across the six stages of the BDS. The analysis compares performance across the three conditions (LLM-only, RAG-Small, and RAG-Large). Significant differences emerged in the Abstract and Emulate stages, where RAG-Large outperformed the other conditions. These results indicate that retrieval augmentation is particularly effective in supporting stages that require higher levels of knowledge translation and creative synthesis.
| | Sum of Squares | df | Mean Square | F | Sig. |
|---|
| Stage 1 | Between Groups | 32.684 | 2 | 16.342 | 16.082 | <0.001 |
| Within Groups | 88.404 | 87 | 1.016 | | |
| Total | 121.088 | 89 | | | |
| Stage 2 | Between Groups | 9.195 | 2 | 4.598 | 3.647 | 0.030 |
| Within Groups | 109.689 | 87 | 1.261 | | |
| Total | 118.884 | 89 | | | |
| Stage 3 | Between Groups | 35.277 | 2 | 17.638 | 17.901 | <0.001 |
| Within Groups | 85.722 | 87 | 0.985 | | |
| Total | 120.999 | 89 | | | |
| Stage 4 | Between Groups | 35.388 | 2 | 17.694 | 14.749 | <0.001 |
| Within Groups | 104.370 | 87 | 1.200 | | |
| Total | 139.758 | 89 | | | |
| Stage 5 | Between Groups | 21.277 | 2 | 10.638 | 10.478 | <0.001 |
| Within Groups | 88.333 | 87 | 1.015 | | |
| Total | 109.610 | 89 | | | |
| Stage 6 | Between Groups | 21.084 | 2 | 10.542 | 9.886 | <0.001 |
| Within Groups | 92.774 | 87 | 1.066 | | |
| Total | 113.858 | 89 | | | |
Table 12.
Tukey HSD post hoc comparisons between experimental conditions (LLM-only, RAG-Small, and RAG-Large) for each stage of the BDS. Significant pairwise differences were primarily observed in the Abstract and Emulate stages, where RAG-Large scored higher than both LLM-only and RAG-Small. These results complement the ANOVA findings (
Table 10), confirming that retrieval augmentation has its greatest impact in stages requiring abstraction and design translation.
| Stage | Comparison | Mean Difference | p-Value | 95% CI (Lower, Upper) |
|---|
| Stage 1 | A–B | 1.022 *** | <0.001 | 0.402, 1.643 |
| | A–C | –0.411 | 0.26 | −1.032, 0.210 |
| | B–C | –1.433 *** | <0.001 | −2.054, −0.813 |
| Stage 2 | A–B | 0.778 * | 0.024 | 0.086, 1.469 |
| | A–C | 0.467 | 0.247 | −0.225, 1.158 |
| | B–C | −0.311 | 0.533 | −1.002, 0.380 |
| Stage 3 | A–B | 0.033 | 0.991 | −0.578, 0.644 |
| | A–C | −1.311 *** | <0.001 | −1.922, −0.700 |
| | B–C | −1.344 *** | <0.001 | −1.956, −0.733 |
| Stage 4 | A–B | 0.689 * | 0.044 | 0.015, 1.363 |
| | A–C | −0.844 * | 0.01 | −1.519, −0.170 |
| | B–C | −1.533 *** | <0.001 | −2.208, −0.859 |
| Stage 5 | A–B | −0.1 | 0.922 | −0.720, 0.520 |
| | A–C | −1.078 *** | <0.001 | −1.698, −0.457 |
| | B–C | −0.978 ** | 0.001 | −1.598, −0.357 |
| Stage 6 | A–B | −0.111 | 0.909 | −0.747, 0.525 |
| | A–C | −1.078 *** | <0.001 | −1.714, −0.442 |
| | B–C | −0.967 ** | 0.001 | −1.602, −0.331 |
Table 13.
Summary of the three-phase image generation process, highlighting distinct objectives, AI usage levels, and outputs.
Table 13.
Summary of the three-phase image generation process, highlighting distinct objectives, AI usage levels, and outputs.
| Phase | Primary Inputs | Key Tools and Settings | AI Usage Level | Primary Outputs |
|---|
| 1: Basic Image Generation | Boxfish CAD side-view silhouette; design prompts emphasizing form flow and stability | Vizcom ‘Car Shading’ palette; adjusted prompt weighting | High: LLM-RAG used to generate descriptive prompts guiding form variation | Conceptual form exploration: Multiple stylized body design sketches translating natural forms into industrial vocabulary |
| 2: Functional Component Integration | Phase 1 outputs; manual addition of essential vehicle structures (windows, wheels) | Vizcom ‘Car Shading’ palette for configuration extension | Low: minimal reliance on LLM-RAG; emphasis on manual functional integration | Functional feasibility: Feasible vehicle body designs with integrated functional components |
| 3: Design Detail Enhancement | Phase 2 outputs; descriptive prompts referencing biomimetic materials and finishes | Vizcom ‘Realistic Product’ and ‘Exterior’ palettes; varied ‘style influence’ | Moderate: LLM-RAG used for targeted material and appearance descriptions | Visual and material refinement: High-fidelity, presentation-ready concept sketches with varied colors, proportions, and details |
Table 14.
Intraclass correlation coefficients (ICCs) for design quality ratings (N = 4). A two-way random-effects model with absolute agreement was applied. Single-measure ICC(2,1) values indicated low to moderate consistency among individual raters, while average-measure ICC(2,k) values showed strong reliability when ratings were aggregated. These results suggest that although design quality judgments varied across individual experts, consensus scores provided a stable and reliable basis for evaluation.
| Measure Type | ICC | 95% CI (Lower, Upper) | F | df1 | df2 | p |
|---|
| Single measures (ICC[2,1]) | 0.440 | 0.038, 0.865 | 4.143 | 5 | 15 | 0.015 |
| Average measures (ICC[2,k]) | 0.759 | 0.137, 0.962 | 4.143 | 5 | 15 | 0.015 |
Table 15.
Descriptive statistics for the questionnaire items (N = 4). Results include means and standard deviations across items evaluating participants’ perceptions of AI-assisted biomimicry design. The small sample size reflects the expert group involved, and the statistics provide preliminary but valuable insights into usability, perceived creativity support, and system reliability.
| Item | N | Mean | SD | 95% CI (Lower, Upper) |
|---|
| 1. Adherence to the bionic concept | 4 | 6.500 | 0.580 | 5.580, 7.420 |
| 2. Discernibility of the inspiration | 4 | 6.000 | 0.820 | 4.700, 7.300 |
| 3. Novelty of the design | 4 | 5.500 | 0.580 | 4.580, 6.420 |
| 4. Stylistic alignment with intended imagery | 4 | 6.250 | 0.500 | 5.450, 7.050 |
| 5. Innovation of structures or functions | 4 | 5.250 | 0.960 | 3.730, 6.770 |
| 6. Potential to challenge conventional vehicle concepts | 4 | 5.500 | 1.290 | 3.510, 7.490 |
