
µ-Raman Spectroscopic Temperature Dependence Study of Biomimetic Lipid 1,2-Diphytanoyl-sn-glycero-3-phosphocholine

 ,
,  , and
, and
Abstract
1. Introduction
2. Materials and Methods
3. Results and Discussion
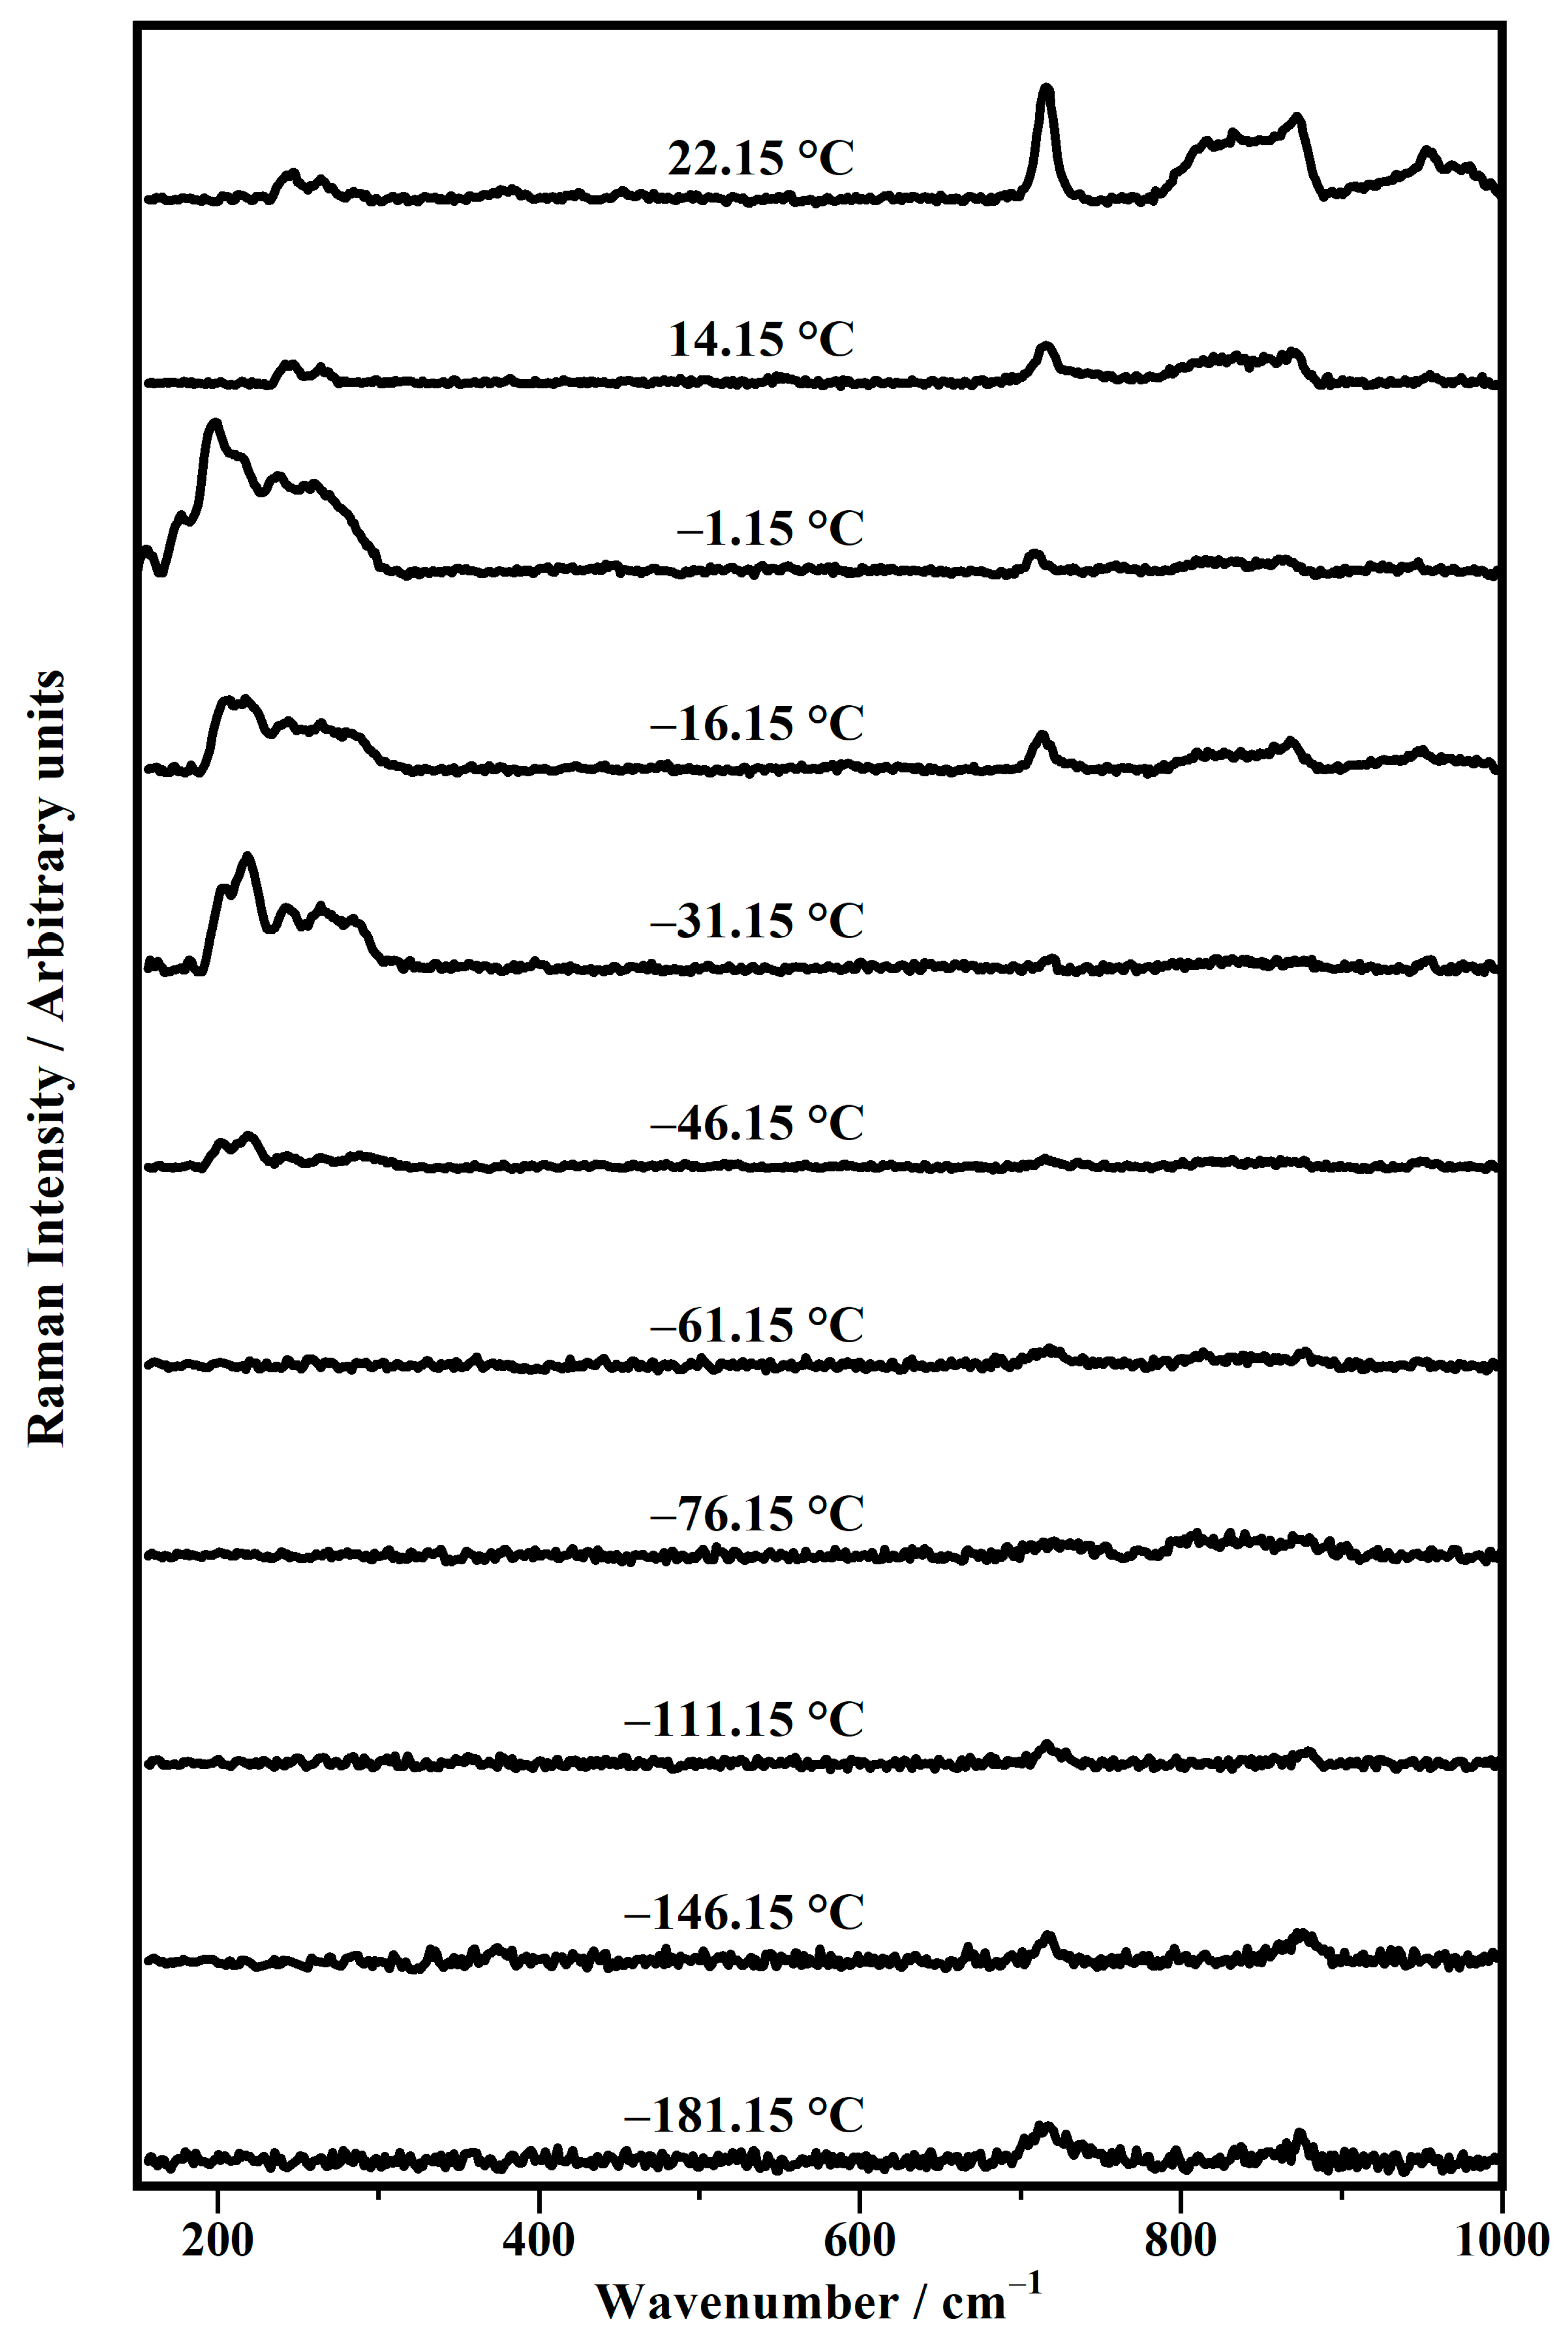
T = −46.15 °C, T = −16.15 °C → Class (d) T = −1.15 °C → Class (e) T = +14.15 °C
4. Conclusions
Author Contributions
Funding
Institutional Review Board Statement
Informed Consent Statement
Data Availability Statement
Acknowledgments
Conflicts of Interest
Abbreviations
| DPhPC | 1,2-diphytanoyl-sn-glycero-3-phosphocholine. |
References
- Tsopelas, F.; Stergiopoulos, C.; Danias, P.; Tsantili-Kakoulidou, A. Biomimetic Separations in Chemistry and Life Sciences. Microchim. Acta 2025, 192, 133. [Google Scholar] [CrossRef]
- Suresh Kumar, N.; Padma Suvarna, R.; Chandra Babu Naidu, K.; Banerjee, P.; Ratnamala, A.; Manjunatha, H. A Review on Biological and Biomimetic Materials and Their Applications. Appl. Phys. A 2020, 126, 445. [Google Scholar] [CrossRef]
- Naik, R.R.; Singamaneni, S. Introduction: Bioinspired and Biomimetic Materials. Chem. Rev. 2017, 117, 12581–12583. [Google Scholar] [CrossRef] [PubMed]
- Rothemund, P.W.K. Folding DNA to Create Nanoscale Shapes and Patterns. Nature 2006, 440, 297–302. [Google Scholar] [CrossRef] [PubMed]
- Jones, M.R.; Seeman, N.C.; Mirkin, C.A. Programmable Materials and the Nature of the DNA Bond. Science 2015, 347, 1260901. [Google Scholar] [CrossRef] [PubMed]
- Sarikaya, M.; Tamerler, C.; Jen, A.K.-Y.; Schulten, K.; Baneyx, F. Molecular Biomimetics: Nanotechnology through Biology. Nat. Mater. 2003, 2, 577–585. [Google Scholar] [CrossRef]
- Coppage, R.; Slocik, J.M.; Ramezani-Dakhel, H.; Bedford, N.M.; Heinz, H.; Naik, R.R.; Knecht, M.R. Exploiting Localized Surface Binding Effects to Enhance the Catalytic Reactivity of Peptide-Capped Nanoparticles. J. Am. Chem. Soc. 2013, 135, 11048–11054. [Google Scholar] [CrossRef]
- Montero De Espinosa, L.; Meesorn, W.; Moatsou, D.; Weder, C. Bioinspired Polymer Systems with Stimuli-Responsive Mechanical Properties. Chem. Rev. 2017, 117, 12851–12892. [Google Scholar] [CrossRef]
- Chien, C.-T.H.; Helfinger, L.R.; Bostock, M.J.; Solt, A.; Tan, Y.L.; Nietlispach, D. An Adaptable Phospholipid Membrane Mimetic System for Solution NMR Studies of Membrane Proteins. J. Am. Chem. Soc. 2017, 139, 14829–14832. [Google Scholar] [CrossRef]
- Fasanella, A.; Cosentino, K.; Beneduci, A.; Chidichimo, G.; Cazzanelli, E.; Barberi, R.C.; Castriota, M. Thermal Structural Evolutions of DMPC-Water Biomimetic Systems Investigated by Raman Spectroscopy. Biochim. Biophys. Acta BBA Biomembr. 2018, 1860, 1253–1258. [Google Scholar] [CrossRef]
- Nair, K.S.; Bajaj, H. Advances in Giant Unilamellar Vesicle Preparation Techniques and Applications. Adv. Colloid Interface Sci. 2023, 318, 102935. [Google Scholar] [CrossRef] [PubMed]
- Karamdad, K.; Law, R.V.; Seddon, J.M.; Brooks, N.J.; Ces, O. Preparation and Mechanical Characterisation of Giant Unilamellar Vesicles by a Microfluidic Method. Lab Chip 2015, 15, 557–562. [Google Scholar] [CrossRef]
- Kühnel, R.M.; Grifell-Junyent, M.; Jørgensen, I.L.; Kemmer, G.C.; Schiller, J.; Palmgren, M.; Justesen, B.H.; Günther Pomorski, T. Short-Chain Lipid-Conjugated pH Sensors for Imaging of Transporter Activities in Reconstituted Systems and Living Cells. Analyst 2019, 144, 3030–3037. [Google Scholar] [CrossRef] [PubMed]
- Uzun, H.D.; Malysenko, E.; Justesen, B.H.; Pomorski, T.G. Functional Reconstitution of Plant Plasma Membrane H+-ATPase into Giant Unilamellar Vesicles. Sci. Rep. 2025, 15, 8541. [Google Scholar] [CrossRef]
- Andreopoulos, D.; Kasi, L.P. 99mTc-Labelled Diphytanoylphosphatidylcholine Liposomes: In Vitro and in Vivo Studies. J. Microencapsul. 1997, 14, 427–436. [Google Scholar] [CrossRef] [PubMed]
- Kitt, J.P.; Harris, J.M. Confocal Raman Microscopy of Hybrid-Supported Phospholipid Bilayers within Individual C18-Functionalized Chromatographic Particles. Langmuir 2016, 32, 9033–9044. [Google Scholar] [CrossRef]
- Zaytseva, Y.V.; Surovtsev, N.V. Raman Scattering in Protonated and Deuterated 1,2-Dipalmitoyl-Sn-Glycero-3-Phosphatidylcholine (DPPC): Indicators of Conformational and Lateral Orders. Spectrochim. Acta Part A Mol. Biomol. Spectrosc. 2022, 267, 120583. [Google Scholar] [CrossRef]
- Wong, P.T.T.; Mantsch, H.H. A Low-Temperature Structural Phase Transition of 1,2-Dipalmitoyl-Sn-Glycero-3-Phosphocholine Bilayers in the Gel Phase. Biochim. Biophys. Acta BBA Biomembr. 1983, 732, 92–98. [Google Scholar] [CrossRef]
- Gaber, B.P.; Yager, P.; Peticolas, W.L. Interpretation of Biomembrane Structure by Raman Difference Spectroscopy. Nature of the Endothermic Transitions in Phosphatidylcholines. Biophys. J. 1978, 21, 161–176. [Google Scholar] [CrossRef]
- Gaber, B.P.; Yager, P.; Peticolas, W.L. Deuterated Phospholipids as Nonperturbing Components for Raman Studies of Biomembranes. Biophys. J. 1978, 22, 191–207. [Google Scholar] [CrossRef]
- Gaber, B.P.; Peticolas, W.L. On the Quantitative Interpretation of Biomembrane Structure by Raman Spectroscopy. Biochim. Biophys. Acta BBA Biomembr. 1977, 465, 260–274. [Google Scholar] [CrossRef]
- Snyder, R.G.; Cameron, D.G.; Casal, H.L.; Compton, D.A.C.; Mantsch, H.H. Studies on Determining Conformational Order in n-Alkanes and Phospholipids from the 1130 Cm−1 Raman Band. Biochim. Biophys. Acta BBA Biomembr. 1982, 684, 111–116. [Google Scholar] [CrossRef]
- Tsuchikawa, H.; Ono, T.; Yamagami, M.; Umegawa, Y.; Shinoda, W.; Murata, M. Conformation and Orientation of Branched Acyl Chains Responsible for the Physical Stability of Diphytanoylphosphatidylcholine. Biochemistry 2020, 59, 3929–3938. [Google Scholar] [CrossRef] [PubMed]
- Kara, S.; Afonin, S.; Babii, O.; Tkachenko, A.N.; Komarov, I.V.; Ulrich, A.S. Diphytanoyl Lipids as Model Systems for Studying Membrane-Active Peptides. Biochim. Biophys. Acta BBA Biomembr. 2017, 1859, 1828–1837. [Google Scholar] [CrossRef]
- Sunder, S.; Cameron, D.; Mantsch, H.H.; Bernstein, H.J. Infrared and Laser Raman Studies of Deuterated Model Membranes: Phase Transition in 1,2-Perdeuterodipalmitoyl-Sn-Glycero-3-Phosphocholine. Can. J. Chem. 1978, 56, 2121–2126. [Google Scholar] [CrossRef]
- Hsieh, C.H.; Sue, S.C.; Lyu, P.C.; Wu, W.G. Membrane Packing Geometry of Diphytanoylphosphatidylcholine Is Highly Sensitive to Hydration: Phospholipid Polymorphism Induced by Molecular Rearrangement in the Headgroup Region. Biophys. J. 1997, 73, 870–877. [Google Scholar] [CrossRef] [PubMed]
- Politano, G.G.; Cazzanelli, E.; Versace, C.; Castriota, M.; Desiderio, G.; Davoli, M.; Vena, C.; Bartolino, R. Micro-Raman Investigation of Ag/Graphene Oxide/Au Sandwich Structure. Mater. Res. Express 2019, 6, 075605. [Google Scholar] [CrossRef]
- Politano, G.G.; Cazzanelli, E.; Versace, C.; Vena, C.; De Santo, M.P.; Castriota, M.; Ciuchi, F.; Bartolino, R. Graphene Oxide on Magnetron Sputtered Silver Thin Films for SERS and Metamaterial Applications. Appl. Surf. Sci. 2018, 427, 927–933. [Google Scholar] [CrossRef]
- Politano, G.G.; Versace, C.; Vena, C.; Castriota, M.; Ciuchi, F.; Fasanella, A.; Desiderio, G.; Cazzanelli, E. Physical Investigation of Electrophoretically Deposited Graphene Oxide and Reduced Graphene Oxide Thin Films. J. Appl. Phys. 2016, 120, 195307. [Google Scholar] [CrossRef]
- Cazzanelli, E.; Platania, E.; De Santo, G.; Fasanella, A.; Castriota, M. Micro-spectroscopic Raman Investigation on the Canvas Oil Painting ‘Rebecca at the Well’ of Neapolitan Anonymous. J. Raman Spectrosc. 2012, 43, 1694–1698. [Google Scholar] [CrossRef]
- De Luca, O.; Grillo, R.; Castriota, M.; Policicchio, A.; De Santo, M.P.; Desiderio, G.; Fasanella, A.; Agostino, R.G.; Cazzanelli, E.; Giarola, M.; et al. Different Spectroscopic Behavior of Coupled and Freestanding Monolayer Graphene Deposited by CVD on Cu Foil. Appl. Surf. Sci. 2018, 458, 580–585. [Google Scholar] [CrossRef]
- Rizzuto, C.; Teeters, D.C.; Barberi, R.C.; Castriota, M. Plasticizers and Salt Concentrations Effects on Polymer Gel Electrolytes Based on Poly (Methyl Methacrylate) for Electrochemical Applications. Gels 2022, 8, 363. [Google Scholar] [CrossRef]
- Rizzuto, C.; Barberi, R.C.; Castriota, M. Development of Electrochromic Devices, Based on Polymeric Gel, for Energy Saving Applications. Polymers 2023, 15, 3347. [Google Scholar] [CrossRef]
- Rizzuto, C.; Barberi, R.C.; Castriota, M. Tungsten and Titanium Oxide Thin Films Obtained by the Sol-Gel Process as Electrodes in Electrochromic Devices. Front. Mater. 2022, 9, 912013. [Google Scholar] [CrossRef]
- Grimaldi, I.; Gerace, T.; Pipita, M.M.; Perrotta, I.D.; Ciuchi, F.; Berger, H.; Papagno, M.; Castriota, M.; Pacilé, D. Structural Investigation of InSe Layered Semiconductors. Solid State Commun. 2020, 311, 113855. [Google Scholar] [CrossRef]
- Politano, G.G.; Castriota, M.; De Santo, M.P.; Pipita, M.M.; Desiderio, G.; Vena, C.; Versace, C. Variable Angle Spectroscopic Ellipsometry Characterization of Spin-Coated MoS2 Films. Vacuum 2021, 189, 110232. [Google Scholar] [CrossRef]
- Candreva, A.; Crea, R.; Nucera, A.; Barberi, R.C.; Castriota, M.; La Deda, M. Fibronectin-Derived Protein Forms a Protein Corona on Gold Nanoparticles: Synthesis, Raman and Optical Properties of a New Plasmonic Nanocarrier. J. Mater. Sci. 2023, 58, 9618–9632. [Google Scholar] [CrossRef]
- Policastro, D.; Giorno, E.; Scarpelli, F.; Godbert, N.; Ricciardi, L.; Crispini, A.; Candreva, A.; Marchetti, F.; Xhafa, S.; De Rose, R.; et al. New Zinc-Based Active Chitosan Films: Physicochemical Characterization, Antioxidant, and Antimicrobial Properties. Front. Chem. 2022, 10, 884059. [Google Scholar] [CrossRef] [PubMed]
- Pingitore, G.; Cerchiara, T.; Chidichimo, G.; Castriota, M.; Gattuso, C.; Marino, D. Structural Characterization of Corrosion Product Layers on Archaeological Iron Artifacts from Vigna Nuova, Crotone (Italy). J. Cult. Herit. 2015, 16, 372–376. [Google Scholar] [CrossRef]
- Cazzanelli, E.; Grande, D.; Rizzuto, C.; Nucera, A.; Barberi, R.C.; Castriota, M. Micro-Raman Analysis of the Pigments on a Crucifix in Calabria. Appl. Sci. 2022, 12, 6715. [Google Scholar] [CrossRef]
- Saggio, F.; Rizzuto, C.; Teeters, D.; Didik, J.; Barberi, R.C.; Castriota, M. Raman Investigations on the Frame of the Painting “White Man’s Buffalo” by the Artist Charles M. Russell. Appl. Sci. 2023, 13, 3654. [Google Scholar] [CrossRef]
- Candreva, A.; Di Maio, G.; Parisi, F.; Scarpelli, F.; Crispini, A.; Godbert, N.; Ricciardi, L.; Nucera, A.; Rizzuto, C.; Barberi, R.C.; et al. Luminescent Self-Assembled Monolayer on Gold Nanoparticles: Tuning of Emission According to the Surface Curvature. Chemosensors 2022, 10, 176. [Google Scholar] [CrossRef]
- Nucera, A.; Grillo, R.; Rizzuto, C.; Barberi, R.C.; Castriota, M.; Bürgi, T.; Caputo, R.; Palermo, G. Effect of the Combination of Gold Nanoparticles and Polyelectrolyte Layers on SERS Measurements. Biosensors 2022, 12, 895. [Google Scholar] [CrossRef] [PubMed]
- Rizzuto, C.; Ferraro, A.; Nucera, A.; Lio, G.E.; Barberi, R.C.; Castriota, M. Surface-Enhanced Raman Spectroscopy on an As-Deposited Fano Resonance Multilayer Substrate. J. Phys. Chem. C 2023, 127, 12751–12759. [Google Scholar] [CrossRef]
- Caligiuri, V.; Nucera, A.; Patra, A.; Castriota, M.; De Luca, A. Raman Scattering Enhancement through Pseudo-Cavity Modes. Nanomaterials 2024, 14, 875. [Google Scholar] [CrossRef]
- Garg, A.; Mejia, E.; Nam, W.; Vikesland, P.; Zhou, W. Biomimetic Transparent Nanoplasmonic Meshes by Reverse-Nanoimprinting for Bio-Interfaced Spatiotemporal Multimodal SERS Bioanalysis. Small 2022, 18, 2204517. [Google Scholar] [CrossRef]
- Wan, Y.; Wei, Q.; Sun, H.; Wu, H.; Zhou, Y.; Bi, C.; Li, J.; Li, L.; Liu, B.; Wang, D.; et al. Machine Learning Assisted Biomimetic Flexible SERS Sensor from Seashells for Pesticide Classification and Concentration Prediction. Chem. Eng. J. 2025, 507, 160813. [Google Scholar] [CrossRef]
- Lin, L.L.; Alvarez-Puebla, R.; Liz-Marzán, L.M.; Trau, M.; Wang, J.; Fabris, L.; Wang, X.; Liu, G.; Xu, S.; Han, X.X.; et al. Surface-Enhanced Raman Spectroscopy for Biomedical Applications: Recent Advances and Future Challenges. ACS Appl. Mater. Interfaces 2025, 17, 16287–16379. [Google Scholar] [CrossRef]
- Xin, L.; Liu, Y.; Wang, L.; Li, Z. Graphene-Based SERS-Active Substrates for Environmental Detection: Nanoarchitectonics and Applications. J. Mater. Sci. 2025, 60, 4559–4592. [Google Scholar] [CrossRef]
- Shi, L.; Liu, Y.; Li, X.; Zhang, H.; Wang, Z.; He, S.; Fan, D.; Huang, X.; Zi, Y.; Han, Y.; et al. Advances in Functional Nucleic Acid SERS Sensing Strategies. ACS Sensors 2025, 10, 1579–1599. [Google Scholar] [CrossRef]
- Czamara, K.; Majzner, K.; Pacia, M.Z.; Kochan, K.; Kaczor, A.; Baranska, M. Raman Spectroscopy of Lipids: A Review. J Raman Spectrosc. 2015, 46, 4–20. [Google Scholar] [CrossRef]
- Koyama, Y.; Toda, S.; Kyogoku, Y. Raman Spectra and Conformation of the Glycerophosphorylcholine Headgroup. Chem. Phys. Lipids 1977, 19, 74–92. [Google Scholar] [CrossRef] [PubMed]
- Lippert, J.L.; Peticolas, W.L. Raman Active Vibrations in Long-Chain Fatty Acids and Phospholipid Sonicates. Biochim. Biophys. Acta (BBA) Biomembr. 1972, 282, 8–17. [Google Scholar] [CrossRef]
- Orendorff, C.J.; Ducey, M.W.; Pemberton, J.E. Quantitative Correlation of Raman Spectral Indicators in Determining Conformational Order in Alkyl Chains. J. Phys. Chem. A 2002, 106, 6991–6998. [Google Scholar] [CrossRef]
- Movasaghi, Z.; Rehman, S.; Rehman, I.U. Raman Spectroscopy of Biological Tissues. Appl. Spectrosc. Rev. 2007, 42, 493–541. [Google Scholar] [CrossRef]
- Wallach, D.F.H.; Verma, S.P.; Fookson, J. Application of Laser Raman and Infrared Spectroscopy to the Analysis of Membrane Structure. Biochim. Biophys. Acta (BBA) Rev. Biomembr. 1979, 559, 153–208. [Google Scholar] [CrossRef]
- Walrafen, G.E.; Yang, W.-H.; Chu, Y.C.; Hokmabadi, M.S. Raman OD-Stretching Overtone Spectra from Liquid D2O between 22 and 152 °C. J. Phys. Chem. 1996, 100, 1381–1391. [Google Scholar] [CrossRef]
- Mudalige, A.; Pemberton, J.E. Raman Spectroscopy of Glycerol/D2O Solutions. Vib. Spectrosc. 2007, 45, 27–35. [Google Scholar] [CrossRef]
- Braziel, S.; Sullivan, K.; Lee, S. Quantitative Raman Microspectroscopy for Water Permeability Parameters at a Droplet Interface Bilayer. Analyst 2018, 143, 747–755. [Google Scholar] [CrossRef]
- Lindsey, H.; Petersen, N.O.; Chan, S.I. Physicochemical Characterization of 1,2-Diphytanoyl-Sn-Glycero-3-Phosphocholine in Model Membrane Systems. Biochim. Biophys. Acta BBA Biomembr. 1979, 555, 147–167. [Google Scholar] [CrossRef]
- Salvador-Castell, M.; Demé, B.; Oger, P.; Peters, J. Structural Characterization of an Archaeal Lipid Bilayer as a Function of Hydration and Temperature. Int. J. Mol. Sci. 2020, 21, 1816. [Google Scholar] [CrossRef]
- Bhattacharjee, A.; Alapati, P.R.; Verma, A.L. Dynamics of Phase Transitions in a Liquid Crystal Probed by Raman Spectroscopy. Liq. Cryst. 2001, 28, 1315–1320. [Google Scholar] [CrossRef]
- Basumatary, J.; Gangopadhyay, D.; Nath, A.; Devi, T.K. Temperature Dependent Raman Spectroscopy of a Nematic Liquid Crystal Compound 6CHBT. J. Mol. Liq. 2019, 288, 111065. [Google Scholar] [CrossRef]
- Koynova, R.; Caffrey, M. Phases and Phase Transitions of the Phosphatidylcholines. Biochim. Biophys. Acta BBA Rev. Biomembr. 1998, 1376, 91–145. [Google Scholar] [CrossRef] [PubMed]
- Hung, W.C.; Chen, F.Y.; Huang, H.W. Order–Disorder Transition in Bilayers of Diphytanoyl Phosphatidylcholine. Biochim. Biophys. Acta (BBA) Biomembr. 2000, 1467, 198–206. [Google Scholar] [CrossRef]
- Villanueva, M.E.; Bar, L.; Porcar, L.; Gerelli, Y.; Losada-Pérez, P. Resolving the Interactions between Hydrophilic CdTe Quantum Dots and Positively Charged Membranes at the Nanoscale. J. Colloid Interface Sci. 2025, 677, 620–631. [Google Scholar] [CrossRef]
- Kučerka, N.; Nagle, J.F.; Sachs, J.N.; Feller, S.E.; Pencer, J.; Jackson, A.; Katsaras, J. Lipid Bilayer Structure Determined by the Simultaneous Analysis of Neutron and X-Ray Scattering Data. Biophys. J. 2008, 95, 2356–2367. [Google Scholar] [CrossRef]
- Disalvo, E.A.; Lairion, F.; Martini, F.; Tymczyszyn, E.; Frías, M.; Almaleck, H.; Gordillo, G.J. Structural and Functional Properties of Hydration and Confined Water in Membrane Interfaces. Biochim. Biophys. Acta BBA Biomembr. 2008, 1778, 2655–2670. [Google Scholar] [CrossRef]


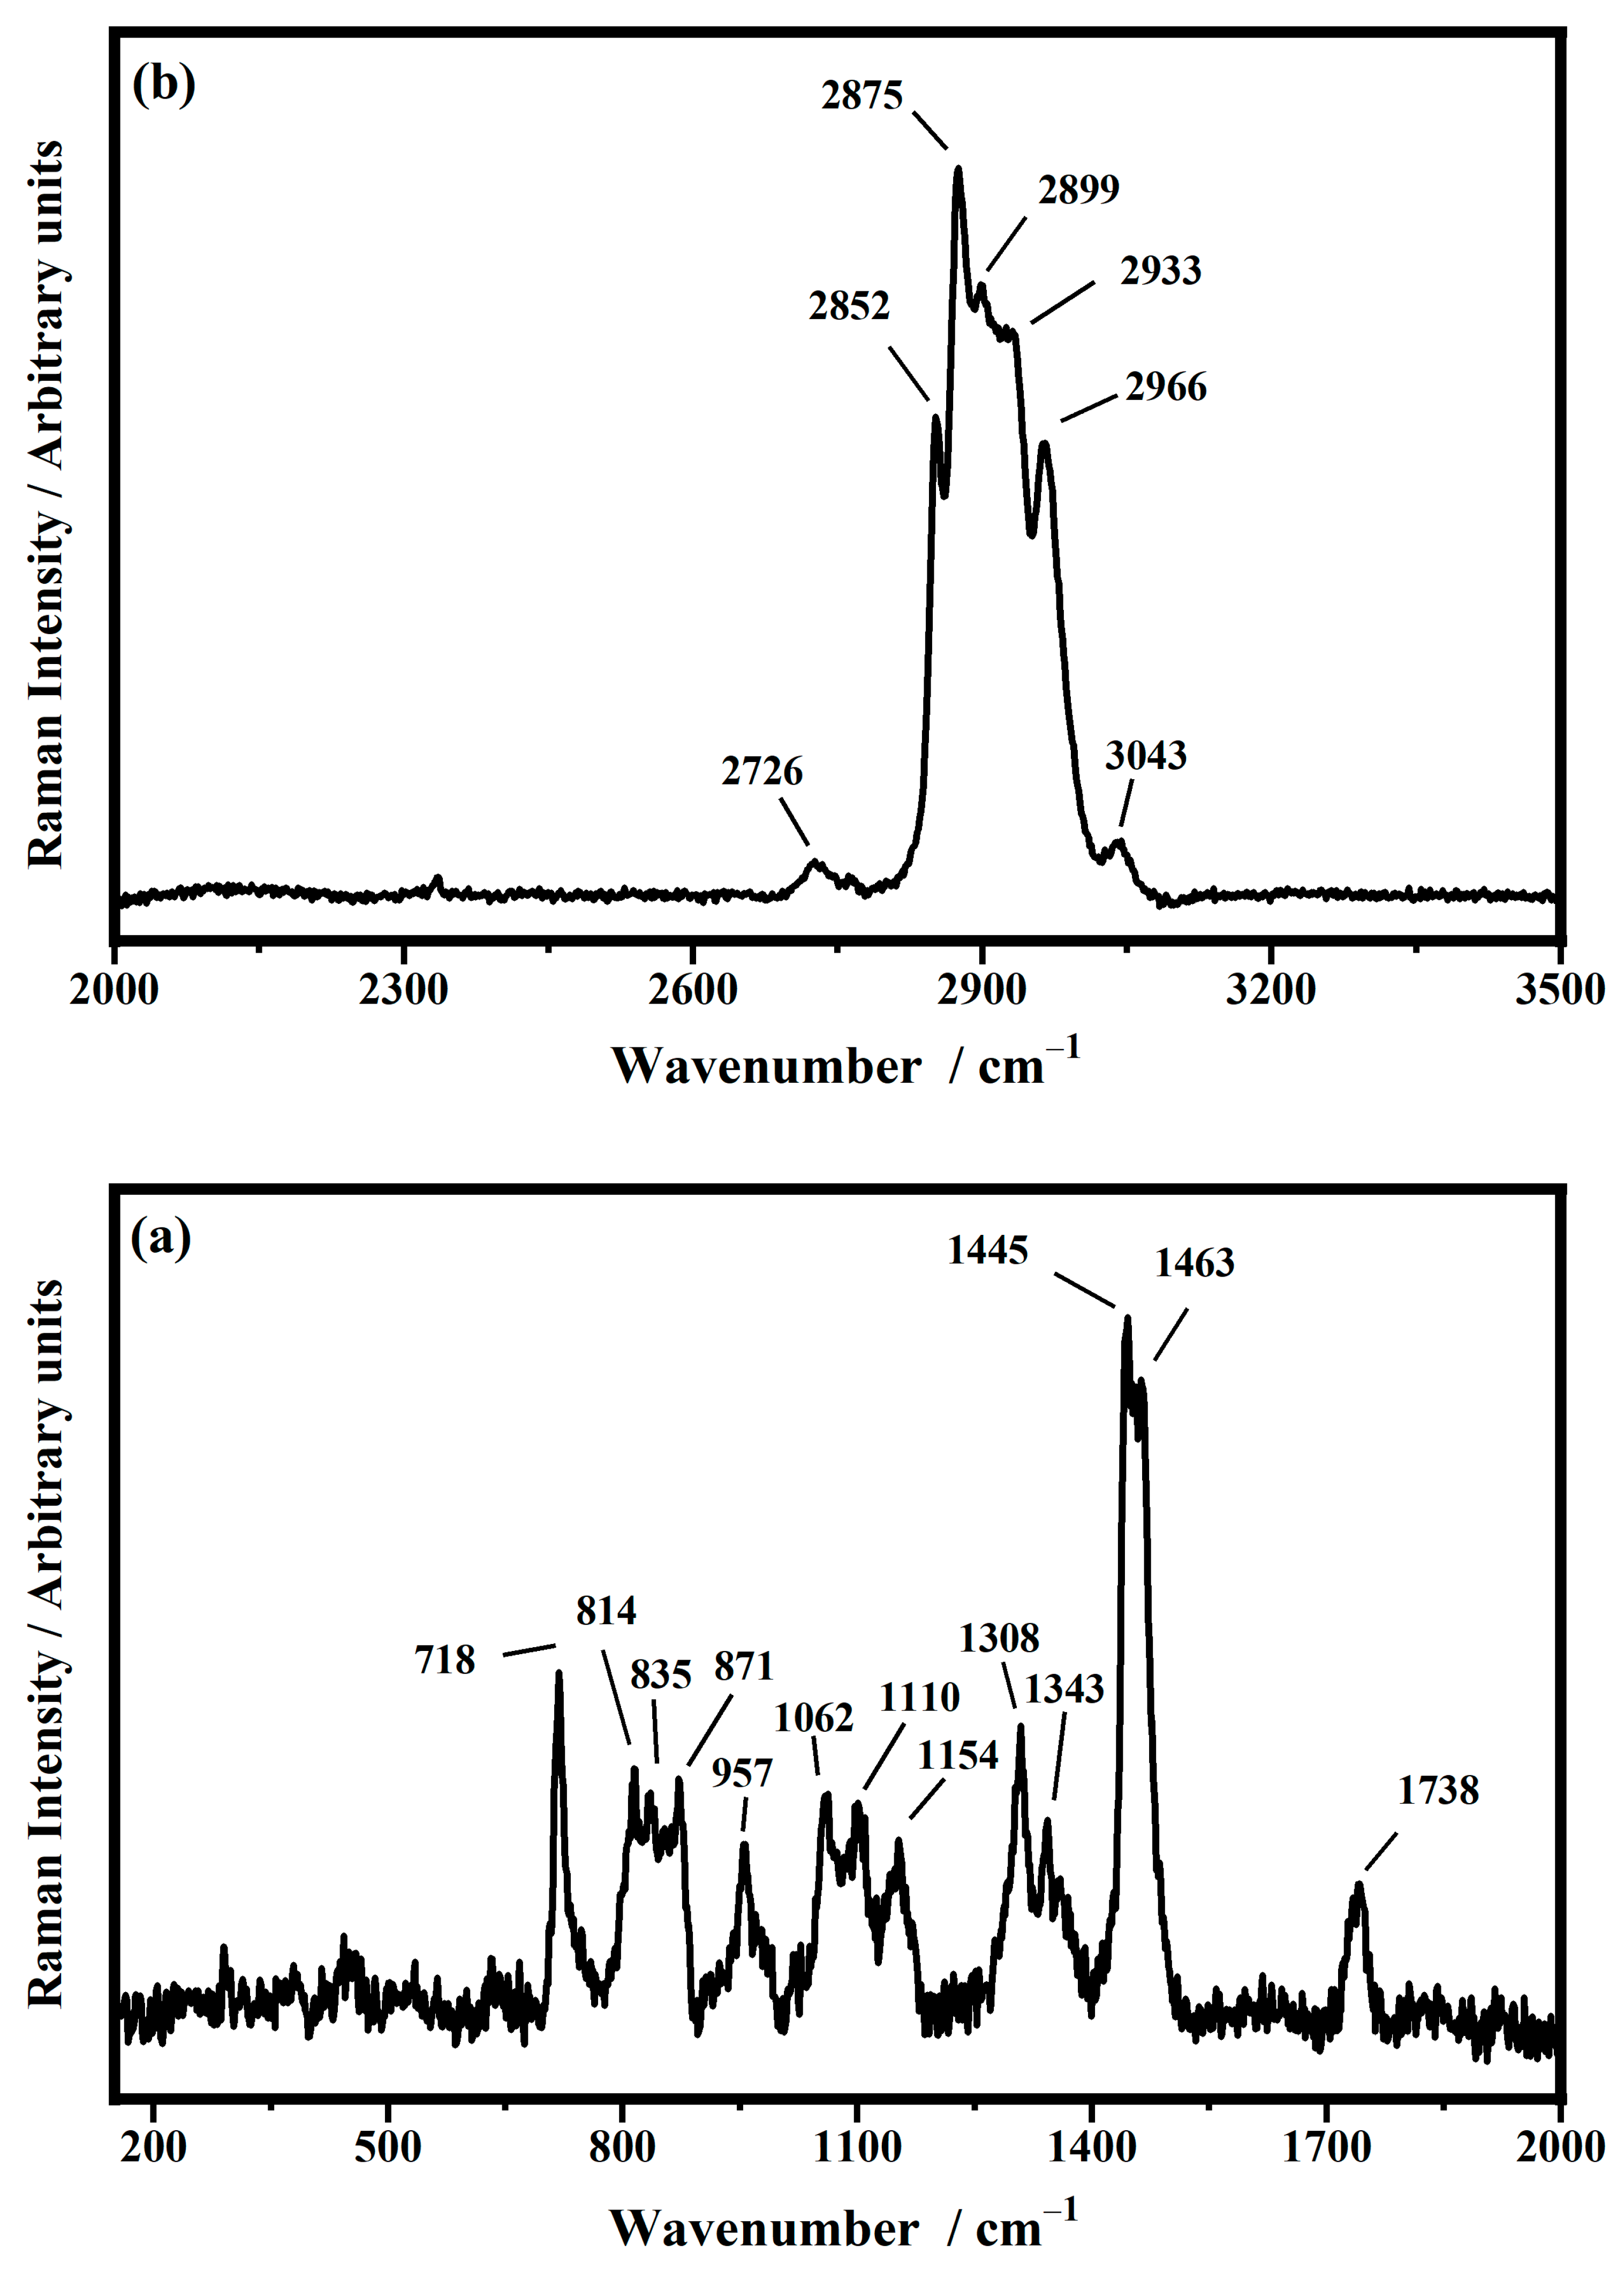
| Band Position/cm−1 | Raman Modes |
|---|---|
| 718 | Stretching C−N (choline gauche conformation) |
| 835 | Asymmetric stretching O−P−O |
| 853 | Asymmetric stretching O−P−O |
| 871 | Stretching C−N (choline gauche conformation) |
| 957 | Rocking CH2 |
| 1062 | Skeletal vibration C−C (asymmetric C−C) of the acyl chains |
| 1097 | Stretching C−C (gauche C−C conformation)/Symmetric stretching PO2- |
| 1110 | Skeletal C−C vibration (trans-C−C conformation) |
| 1154 | Stretching C−C |
| 1308 | Scissoring CH2/Twisting CH2 |
| 1445 | Twisting CH2 |
| 1463 | Scissoring CH2 |
| 1738 | Stretching C=O (ester group) |
| 2726 | Stretching C−H (CH2 group) |
| 2852 | Symmetric stretching CH2 |
| 2875 | Asymmetric stretching CH2 |
| 2899 | Asymmetric stretching CH2 |
| 2933 | Stretching CH3 terminal |
| 2966 | Asymmetric stretching CH3 (choline head group) |
| 3043 | Asymmetric stretching CH3 (choline head group) |
| Temperature/°C | ν (C−N) Choline (Gauche) | νas (O−P−O) | ν (C−N) Choline (Gauche) | ρ CH2 |
|---|---|---|---|---|
| −181.15 | 718 | / | 874 | / |
| −146.15 | 716 | / | 875 | / |
| −111.15 | 716 | / | 874 | / |
| −76.15 | 721 | 831 | 879 | / |
| −61.15 | 718 | 831 | 877 | / |
| −46.15 | 715 | 831 | 876 | 949 |
| −31.15 | 719 | 828 | 875 | 954 |
| −16.15 | 717 | 830 | 872 | 955 |
| −1.15 | 709 | 831 | 865 | 947 |
| 14.15 | 717 | 834 | 869 | 955 |
| 22.15 | 717 | 834 | 874 | 950 |
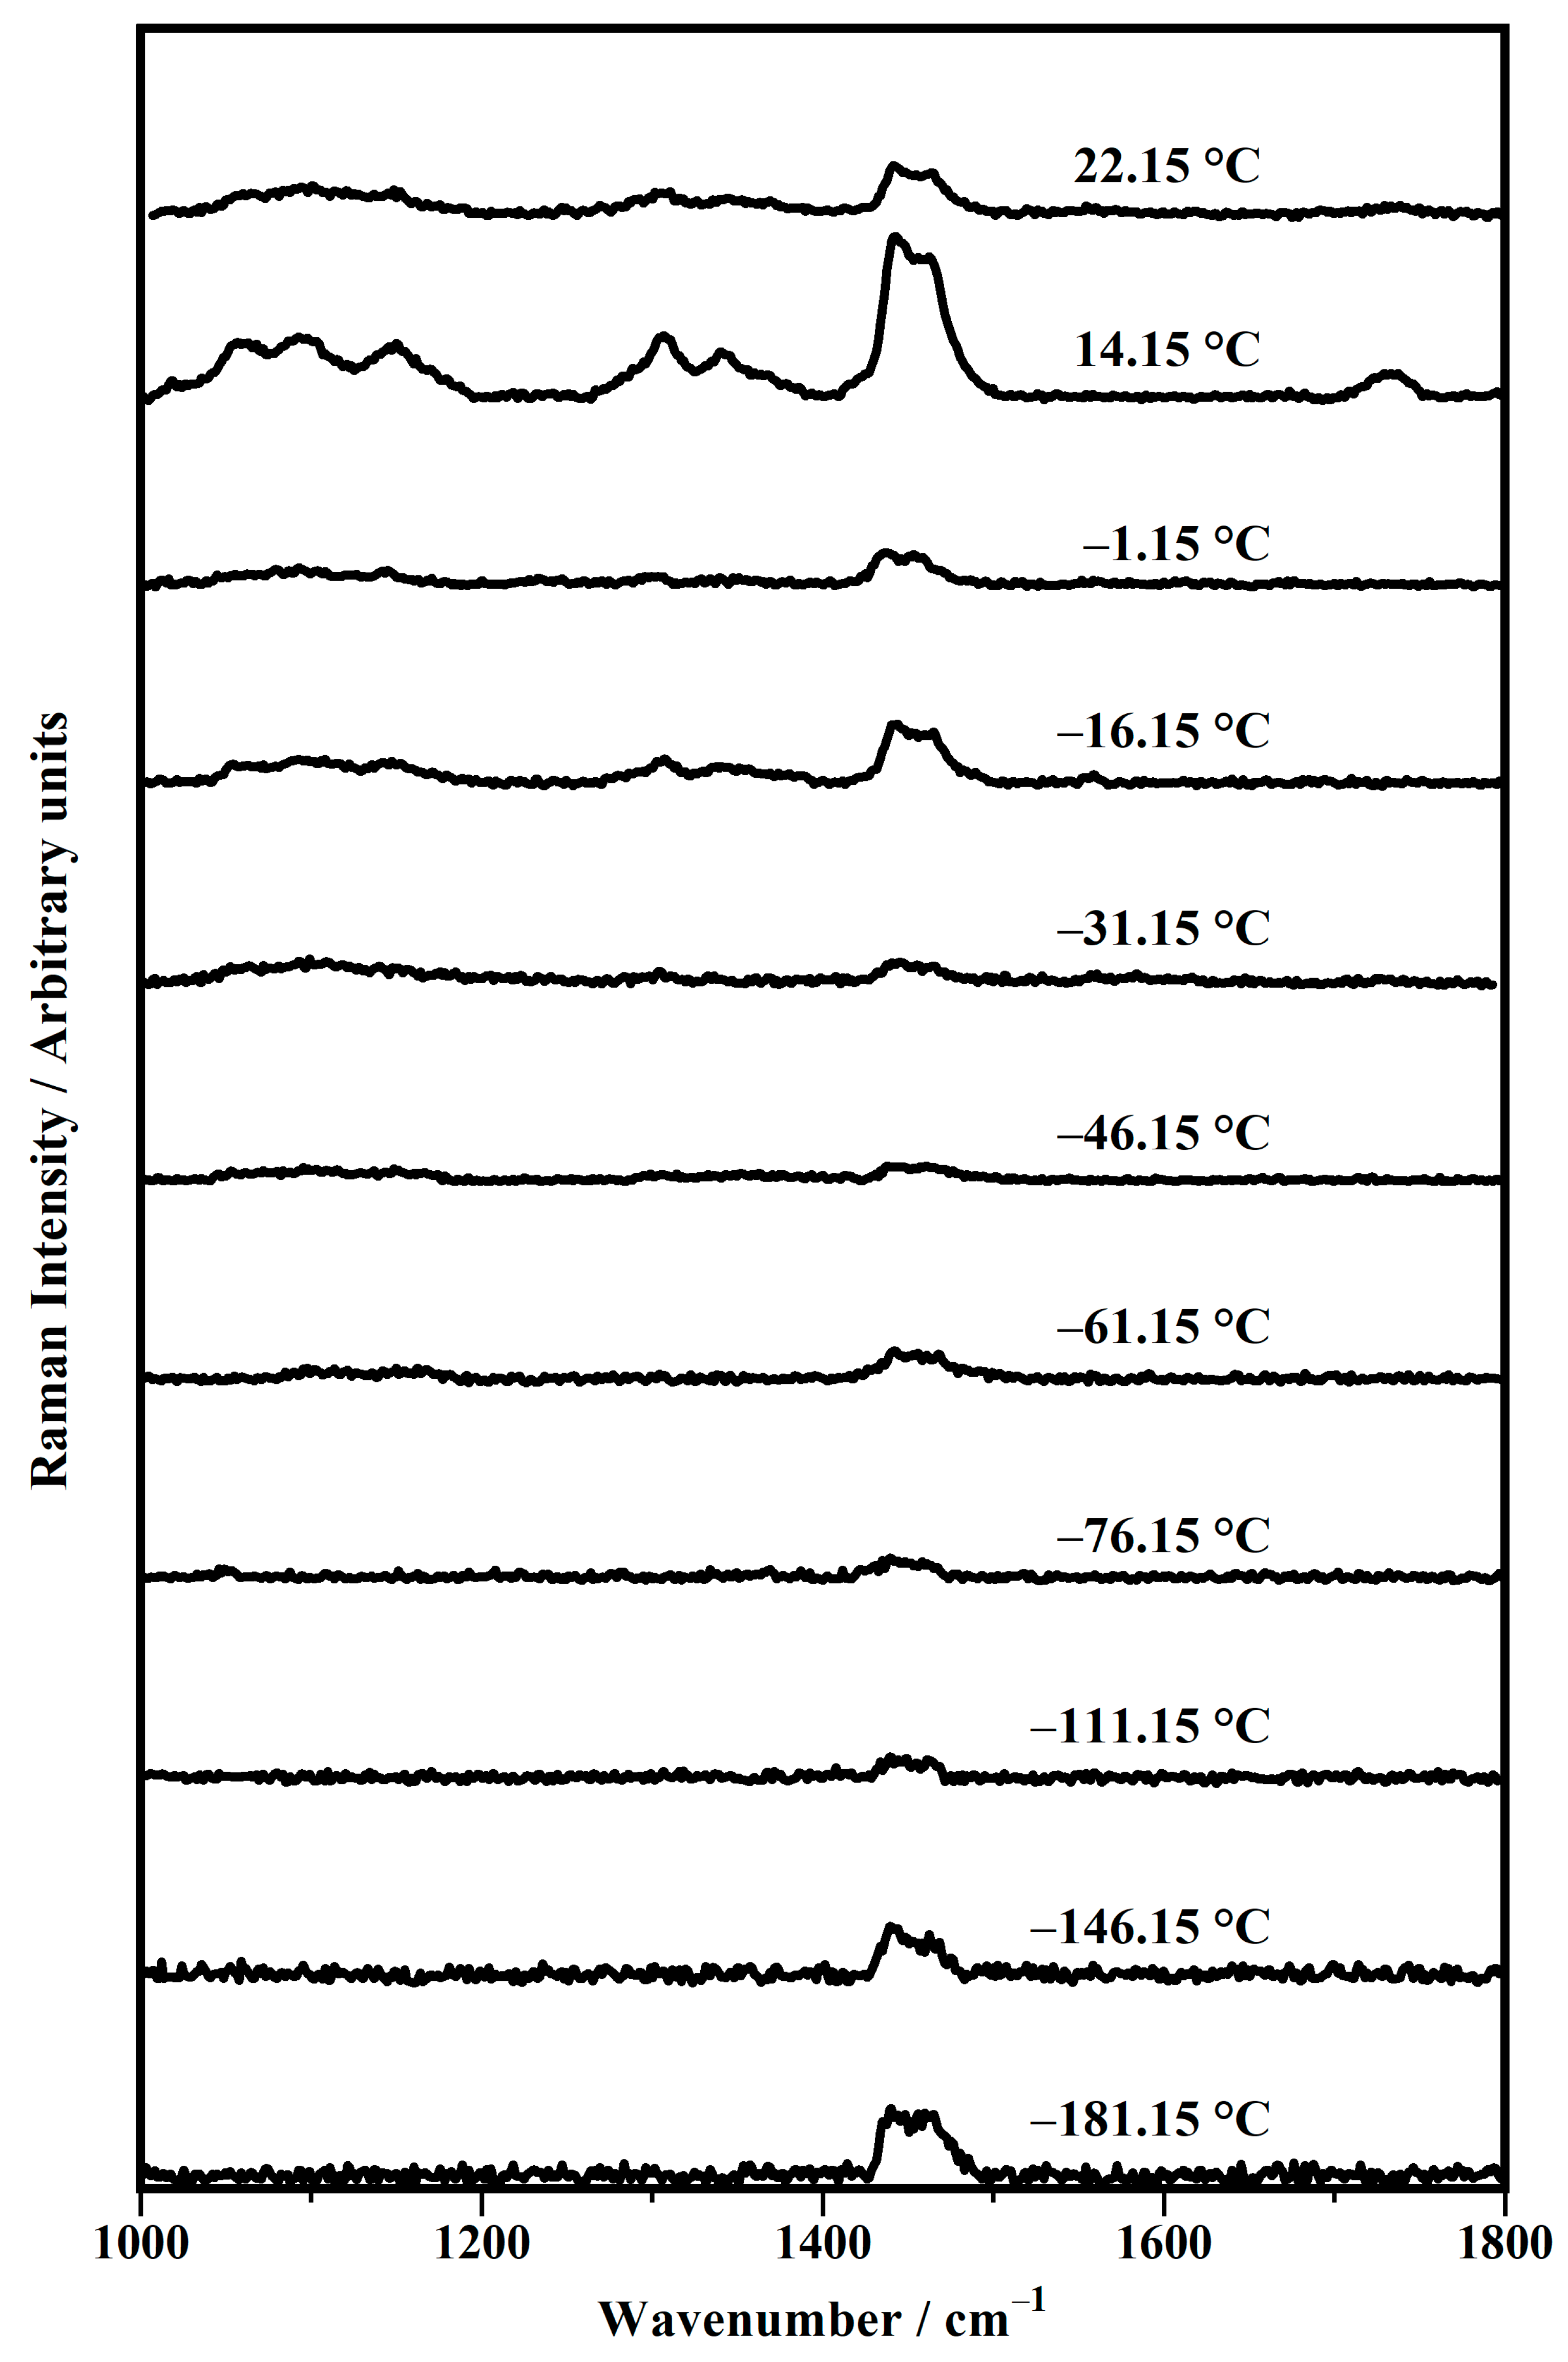
| Temperature/°C | σ (CH2) | τ (CH2) |
|---|---|---|
| −181.15 | 1440 | 1464 |
| −146.15 | 1440 | 1462 |
| −111.15 | 1440 | 1461 |
| −76.15 | 1440 | 1458 |
| −61.15 | 1443 | 1469 |
| −46.15 | 1444 | 1460 |
| −31.15 | 1440 | 1465 |
| −16.15 | 1444 | 1465 |
| −1.15 | 1437 | 1455 |
| 14.15 | 1440 | 1465 |
| 22.15 | 1443 | 1463 |
| Temperature/°C | ν (C−C) (Trans) | νs (C−C) (Gauche) | ν (C−C) (Trans) | νofp (C−C) |
|---|---|---|---|---|
| −46.15 | 1060 | 1095 | 1110 | 1148 |
| −31.15 | 1063 | 1092 | 1110 | 1145 |
| −16.15 | 1062 | 1091 | 1110 | 1147 |
| −1.15 | 1063 | 1092 | 1110 | 1145 |
| 14.15 | 1064 | 1094 | 1110 | 1148 |
| 22.15 | 1060 | 1093 | / | 1151 |
| Temperature/°C | σ (CH2) | ω (CH2) | ν (C=O) |
|---|---|---|---|
| −46.15 | 1307 | 1343 | / |
| −31.15 | 1304 | 1336 | / |
| −16.15 | 1304 | 1338 | / |
| −1.15 | 1306 | 1339 | / |
| 14.15 | 1310 | 1345 | 1732 |
| 22.15 | 1307 | 1339 | 1732 |
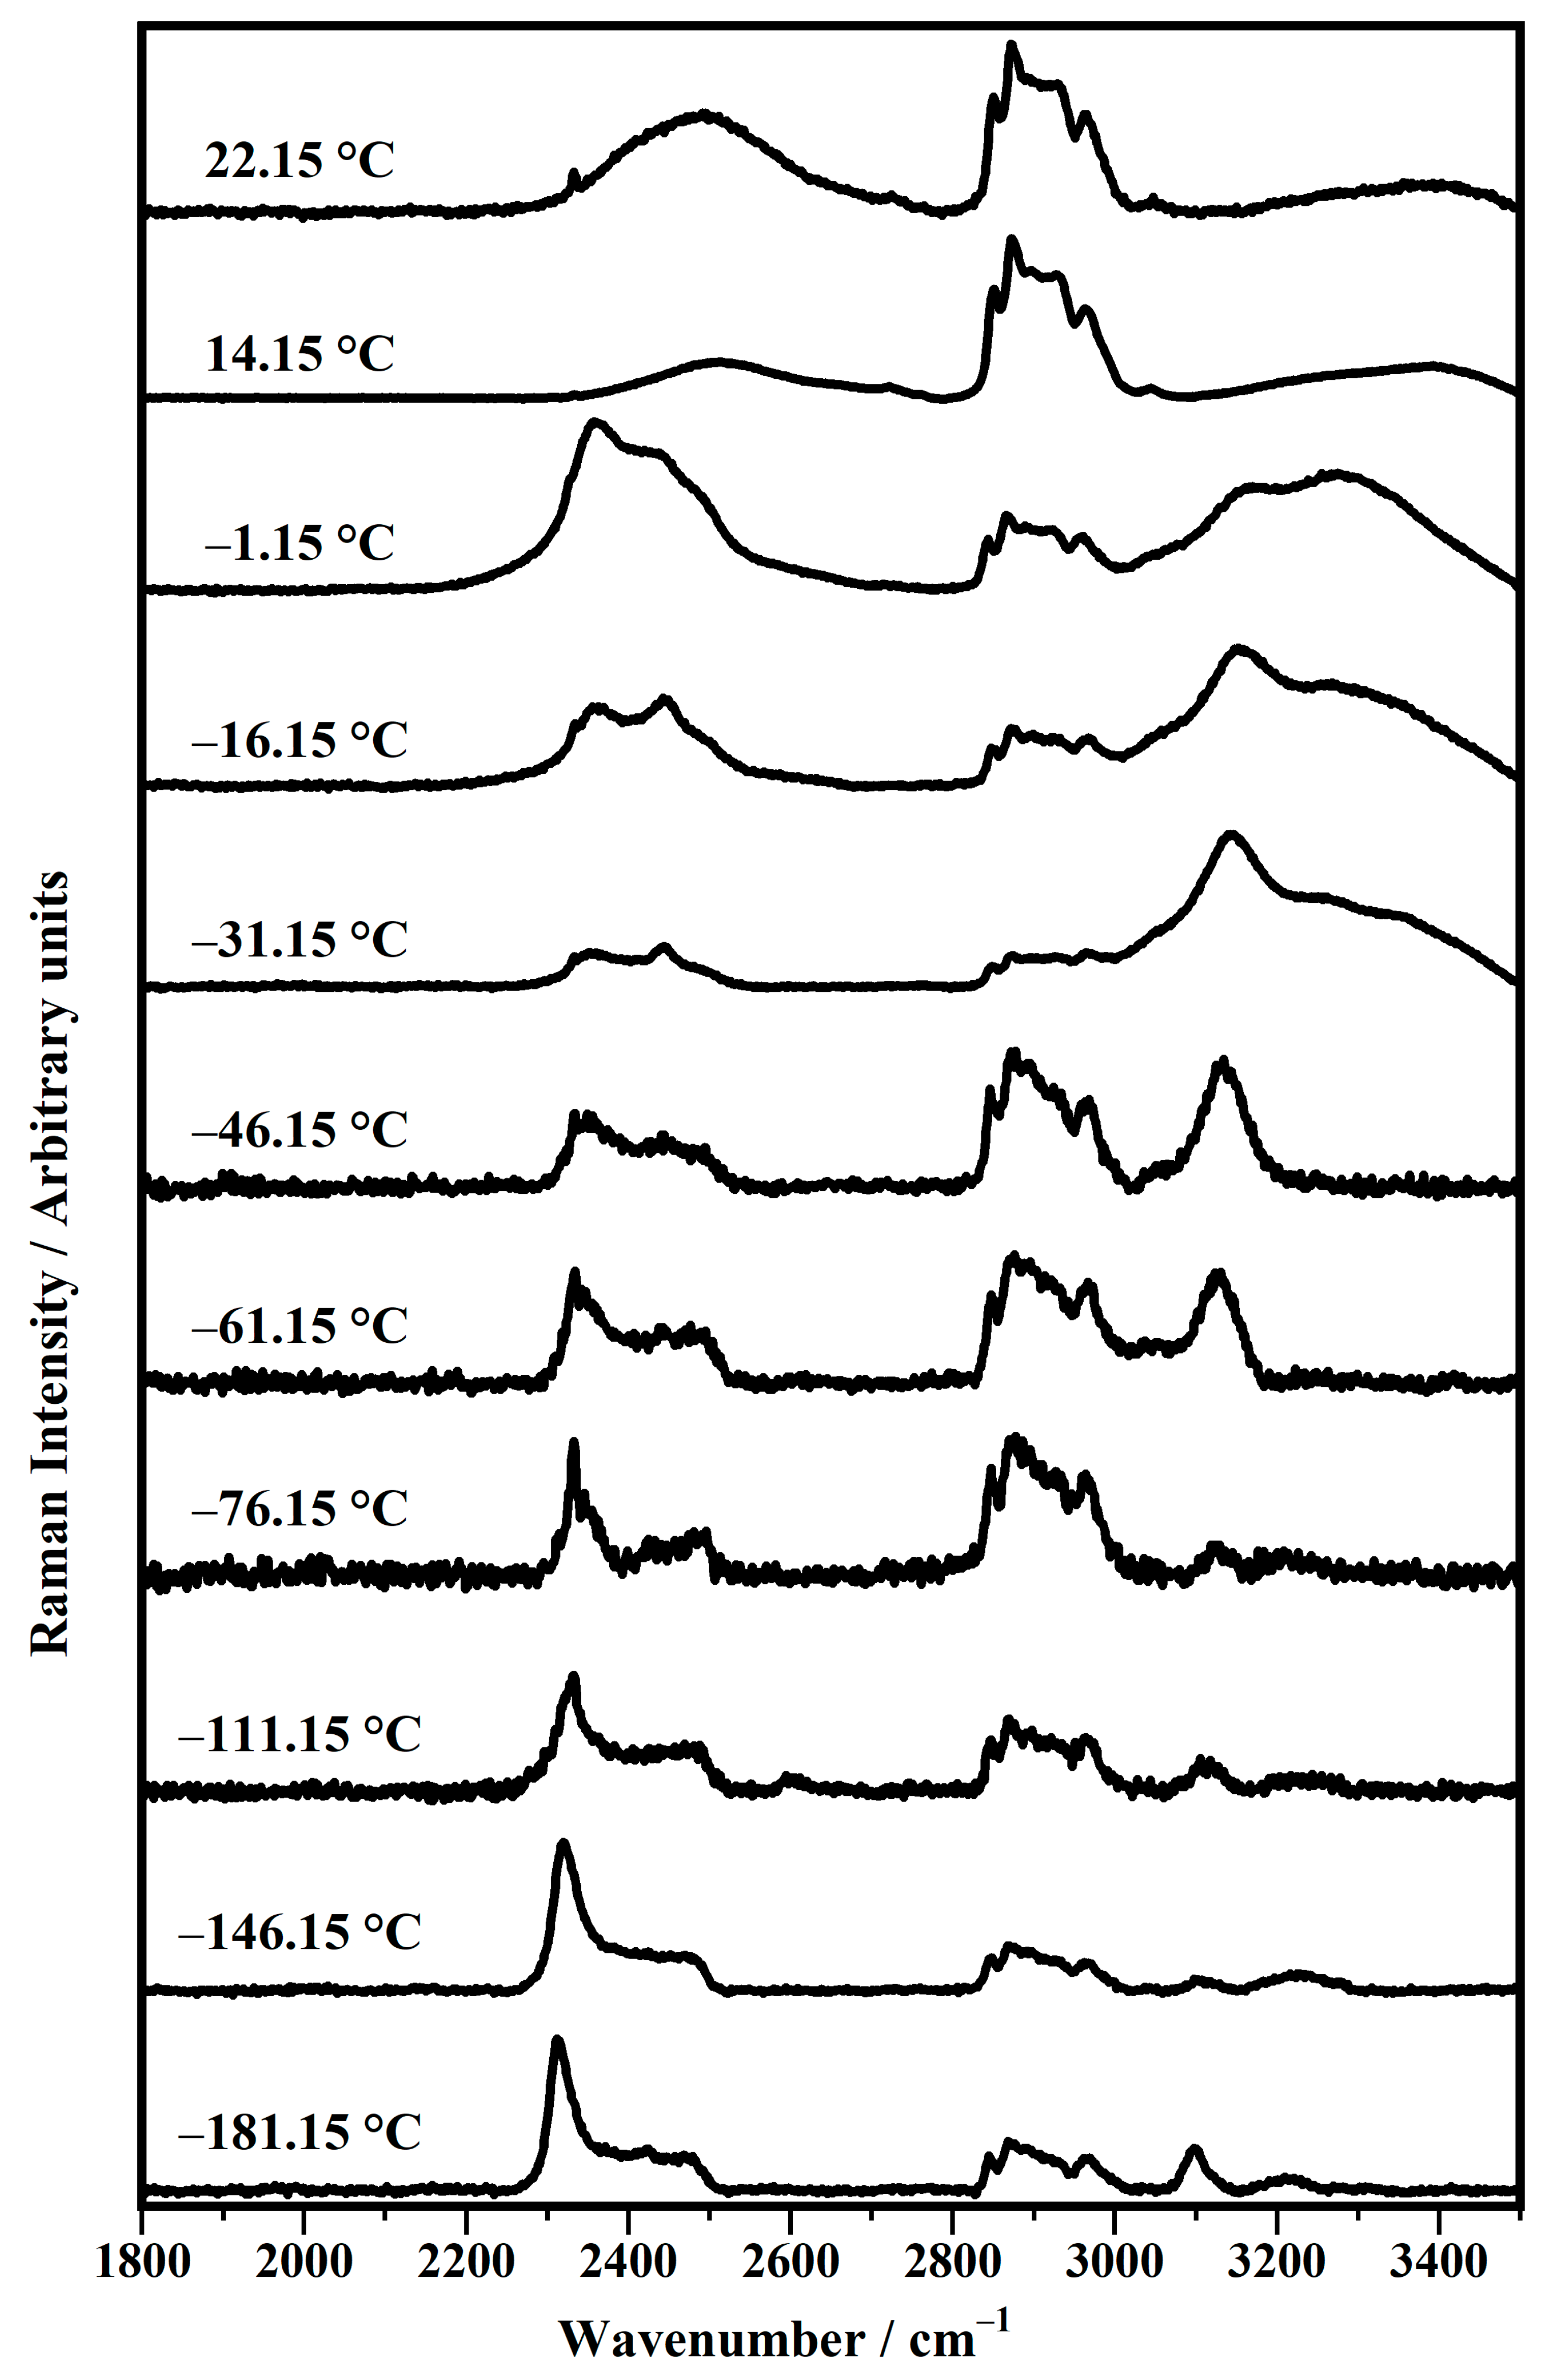
| Temperature/°C | νs (O−D) | νs (O−D) | νs (O−D) | νs (CH2) | νas (CH2) | νas (CH3) | νas [N-(CH3)3] | νs (O−H &N−H) |
|---|---|---|---|---|---|---|---|---|
| −181.15 | 2312 | 2420 | 2476 | 2844 | 2868 | 2969 | 3093 | 3210 |
| −146.15 | 2320 | 2419 | 2482 | 2847 | 2866 | 2968 | 3098 | / |
| −111.15 | 2332 | 2424 | 2478 | 2847 | 2869 | 2964 | 3105 | / |
| −76.15 | 2333 | 2425 | 2496 | 2847 | 2877 | 2964 | 3118 | / |
| −61.15 | 2334 | 2438 | 2490 | 2847 | 2876 | 2967 | 3124 | / |
| −46.15 | 2333 | 2444 | 2495 | 2846 | 2872 | 2968 | 3134 | / |
| −31.15 | 2353 | 2444 | 2493 | 2850 | 2875 | 2965 | 3143 | 3257 |
| −16.15 | 2356 | 2443 | 2495 | 2847 | 2877 | 2968 | 3153 | 3268 |
| −1.15 | 2357 | 2438 | 2494 | 2844 | 2866 | 2961 | 3165 | 3272 |
| 14.15 | / | / | 2502 | 2848 | 2875 | 2967 | / | / |
| 22.15 | / | / | 2498 | 2851 | 2873 | / | / | / |
Disclaimer/Publisher’s Note: The statements, opinions and data contained in all publications are solely those of the individual author(s) and contributor(s) and not of MDPI and/or the editor(s). MDPI and/or the editor(s) disclaim responsibility for any injury to people or property resulting from any ideas, methods, instructions or products referred to in the content. |
© 2025 by the authors. Licensee MDPI, Basel, Switzerland. This article is an open access article distributed under the terms and conditions of the Creative Commons Attribution (CC BY) license (https://creativecommons.org/licenses/by/4.0/).
Share and Cite
Rizzuto, C.; Nucera, A.; Barba Castagnaro, I.; Barberi, R.C.; Castriota, M. µ-Raman Spectroscopic Temperature Dependence Study of Biomimetic Lipid 1,2-Diphytanoyl-sn-glycero-3-phosphocholine. Biomimetics 2025, 10, 308. https://doi.org/10.3390/biomimetics10050308
Rizzuto C, Nucera A, Barba Castagnaro I, Barberi RC, Castriota M. µ-Raman Spectroscopic Temperature Dependence Study of Biomimetic Lipid 1,2-Diphytanoyl-sn-glycero-3-phosphocholine. Biomimetics. 2025; 10(5):308. https://doi.org/10.3390/biomimetics10050308
Chicago/Turabian StyleRizzuto, Carmen, Antonello Nucera, Irene Barba Castagnaro, Riccardo C. Barberi, and Marco Castriota. 2025. "µ-Raman Spectroscopic Temperature Dependence Study of Biomimetic Lipid 1,2-Diphytanoyl-sn-glycero-3-phosphocholine" Biomimetics 10, no. 5: 308. https://doi.org/10.3390/biomimetics10050308
APA StyleRizzuto, C., Nucera, A., Barba Castagnaro, I., Barberi, R. C., & Castriota, M. (2025). µ-Raman Spectroscopic Temperature Dependence Study of Biomimetic Lipid 1,2-Diphytanoyl-sn-glycero-3-phosphocholine. Biomimetics, 10(5), 308. https://doi.org/10.3390/biomimetics10050308