Article

mESC: An Enhanced Escape Algorithm Fusing Multiple Strategies for Engineering Optimization

1
Faculty of Mechanical Engineering, Shaanxi University of Technology, Hanzhong 723000, China
2
Faculty of Art and Design, Xi’an University of Technology, Xi’an 710054, China
3
Department of Applied Mathematics, Xi’an University of Technology, Xi’an 710054, China
*
Author to whom correspondence should be addressed.
Biomimetics 2025, 10(4), 232; https://doi.org/10.3390/biomimetics10040232
Submission received: 3 March 2025 / Revised: 1 April 2025 / Accepted: 4 April 2025 / Published: 8 April 2025

Abstract

:
A multi-strategy enhanced version of the escape algorithm (mESC, for short) is proposed to address the challenges of balancing exploration and development stages and low convergence accuracy in the escape algorithm (ESC). Firstly, an adaptive perturbation factor strategy was employed to maintain population diversity. Secondly, introducing a restart mechanism to enhance the exploration capability of mESC. Finally, a dynamic centroid reverse learning strategy was designed to balance local development. In addition, in order to accelerate the global convergence speed, a boundary adjustment strategy based on the elite pool is proposed, which selects elite individuals to replace bad individuals. Comparing mESC with the latest metaheuristic algorithm and high-performance winner algorithm in the CEC2022 testing suite, numerical results confirmed that mESC outperforms other competitors. Finally, the superiority of mESC in handling problems was verified through several classic real-world optimization problems.

1. Introduction

1.1. Research Background

The optimization problem is a type of problem that optimizes the objective function that meets the constraints [1]. This type of problem involves many fields, such as physical chemistry [2], biomedical [3], economics and finance [4], logistics and operations management [5], science and technology, and machine learning [6]. Optimization problems are commonly present in the real world, such as path planning, image processing, feature selection, etc. Through optimization, specific excellent parts can be extracted to achieve the goal of improving overall performance.

1.2. Literature Review

The traditional methods for solving optimization problems such as the conjugate gradient method and momentum method have obvious disadvantages such as low efficiency and unsatisfactory optimization results. In this regard, metaheuristic algorithms can provide a novel and efficient approach. Metaheuristic algorithms include some classic algorithms inspired by the concept of selective elimination, such as particle swarm optimization (PSO) [7], differential evolution (DE) [8], etc. It also includes some algorithms inspired by animals, such as the zebra optimization algorithm (ZOA) proposed based on zebra foraging and predator avoidance behavior [9], the moth flame optimization (MFO) inspired by the nature of moths [10], spider wasp optimization (SWO) inspired by the survival behavior of spider bees [11], the seahorse optimization (SHO) [12] proposed based on the biological habits of seahorses in the ocean, the artificial hummingbird algorithm (AHA) [13] proposed based on the flight and foraging of hummingbirds, and the dwarf mongoose optimization algorithm (DMOA) [14] proposed based on the collective foraging behavior of dwarf mongoose. Metaheuristic algorithms also include algorithms inspired by physics and chemistry, such as the multi-verse optimization (MVO) proposed based on the concept of physical motion of celestial bodies in the universe, and the planetary optimization algorithm (POA) inspired by Newton’s law of gravity [15], algorithms proposed under the influence of human development behavior, such as the imperialist competition algorithm (ICA) inspired by weak strong cannibalism between countries [16], teaching–learning based optimization (TLBO) that simulates the process of human “teaching” and “learning” [17], in addition to sled dog optimization (SDO) [18], gray wolf optimization (GWO) [19], osprey optimization algorithm (OOA) [20], dung beetle optimization (DBO) [21], gravity search algorithm (GSA) [22], big bang big crunch (BBBC) [23], and other algorithms. In addition, there are also algorithms that have been improved on existing algorithms, such as the enhanced bottlenose dolphin optimization (namely EMBDO) for drone path planning with four constraints [24], the improved Kepler optimization algorithm (namely CGKOA) for handling engineering optimization problems [25], the superior eagle optimization algorithm (namely SEOA) for path planning [26], and the artificial rabbit optimization (namely MNEARO) for optimizing several engineering problems [27].
However, it is unrealistic to use one algorithm to solve all problems, and constantly proposing new algorithms and improving them is the most effective approach. The proposal of ESC to compound this demand was inspired by crowd evacuation behavior, and ESC [28] simulated three types of crowd behavior. ESC validates its superiority and competitiveness by comparing it with other competitors on two testing suites and several optimization problems. However, when balancing exploration and development, as well as handling high-dimensional situations, ESC may fall into local optima due to insufficient performance. Therefore, in order to better unleash the potential of ESC and further improve its performance, this article proposes mESC.
In mESC, the proposed adaptive perturbation factor strategy, boundary adjustment strategy based on the elite pool, dynamic centroid reverse learning strategy, and a proposed restart mechanism are used to enhance the overall performance of ESC. Use an adaptive perturbation factor strategy to balance population diversity during algorithm iteration. The restart mechanism enhances the exploration capability of mESC and prevents excessive convergence in the later stages of iteration. The boundary adjustment strategy based on an elite pool can screen more outstanding individuals as candidate solutions and accelerate convergence speed. Local development of dynamic centroid can reverse learning strategy balance algorithm to improve convergence accuracy and enhance local optimization.

1.3. Research Contribution

This study proposes a multi-strategy-based escape algorithm, mESC. This algorithm improves the original algorithm and its performance is validated through multiple experimental metrics on a test suite with 26 competitors. In addition, mESC is used for truss topology optimization and five engineering design optimization problems to affirm its superiority. The proposal of this improved algorithm provides more methods for optimizing problems, greatly improving the accuracy of optimization problems.

1.4. Chapter Arrangement

Section 2 first describes the concept of ESC, then presents the proposed improvement strategy for mESC, and finally presents relevant numerical experiments to verify the performance of the proposed algorithm. Section 3 confirms the practicality of the proposed algorithm through truss topology optimization and 5 engineering optimizations. Section 4 provides a summary of the entire text.

2. Related Work

2.1. Inspiration Source

The escape algorithm is proposed based on the response of the crowd during evacuation in emergency situations. This algorithm simulates various survival states and behaviors of crowds during an emergency evacuation, dividing them into three groups: calm, gathered, and panicked. A calm crowd can steadily move towards a safe zone, while a gathering crowd is in a hesitant state, and a panic crowd cannot smoothly move towards a safe zone.

2.2. Mathematical Modeling of ESC

(1) Initialization
Using random initialization in ESC,
y i , d = L d + R a n d i , d × ( U d L d ) ,
In the formula, L d ,   U d represent the lower and upper bounds of the d th dimension, the value of the random variable R a n d i , d follows a uniform distribution between 0 and 1.
Then, calculate the fitness values of the population and arrange them in ascending order. Store the optimal individuals in the elite pool Epool, where these elites are the best possible solutions that have been discovered, The specific expression is as follows:
E p o o l = y ( 1 ) , y ( 2 ) , , y ( e x ) .
(2) Panic index
This value represents the panic level of the crowd during the evacuation process, expressed as follows:
p a n i c ( i t ) = cos ( π i t / 6 T max ) ,
The larger the value, the more chaotic the behavior becomes. As the iteration progresses, the panic level decreases and the crowd gradually adapts to the environment. In the equation, i t represents the current iteration count and T max represents the maximum iteration count.
(3) Exploration stage
The three states of calmness, gathering, and panic are grouped according to the a = 0.15 ,   b = 0.35 ,   c = 0.5 ratio, which is in line with the actual behavioral state of the crowd in emergency situations. Most people are in a state of panic, and only a small number of people are calm.
Calm down group update:
y i , d n e w = y i , d + m 1 × ( ω 1 × ( C d y i , d ) + V e c a , d ) × p a n i c ( i t ) ,
in the formula, C d represents the mean of all calm groups in the d th dimension, V e c a , d is obtained according to the following equation,
V e c a , d = R a , d y i , d + σ d ,
In the formula, R a , d = r min , d a + r i , d × ( r max , d a r min , d a ) represents the group position of the calm group, r max , d a ,   r min , d a represents the maximum and minimum values of the calm group in the d th dimension, respectively, σ d = z d / 50 represents the individual’s adjustment value that satisfies z d N ( 0 , 1 ) , m 1 is a random value of 0 or 1, and ω 1 is the adaptive Levy weight.
Aggregation group update:
y i , d n e w = y i , d + m 1 × ( ω 1 × ( C d y i , d ) + m 2 × ω 2 × ( y b , d y i , d )                                                                           + V e c b , d × p a n i c ( i t ) ) ,
In the equation, y b , d is a random individual within the panic group, and the vector V e c b , d is obtained according to the following equation,
V e c b , d = R b , d y i , d + σ d ,
In the formula, R b , d = r min , d b + r i , d × ( r max , d b r min , d b ) is a random position, r max , d b ,   r min , d b is the maximum and minimum values of the cooling group, and m 2 , ω 2 is similar to m 1 , ω 1 .
Panic Group Update:
The impact of random indications on the fertilization pool of individuals in the panic group and other individuals,
y i , d n e w = y i , d + m 1 × ( ω 1 × ( E p o o l d y i , d ) + m 2 × ω 2 × ( y r a n d , d y i , d )                                                                                         + V e c c , d × p a n i c ( i t ) ) ,
In the formula, E p o o l d represents individuals in the elite pool, y r a n d , d represents randomly selected individuals in the population, and the vector V e c c , d is obtained according to the following equation,
V e c c , d = R c , d y i , d + σ d ,
In the formula, R c , d = r min , d c + r i , d × ( r max , d c r min , d c ) is the group position of the panic group, and r max , d c ,   r min , d c is the upper and lower bounds of the panic group.
(4) Development stage
At this stage, all individuals remain calm and improve their position by approaching members of the elite pool. This process simulates the crowd gradually gathering towards the determined optimal exit,
y i , d n e w = y i , d + m 1 × ω 1 × ( E p o o l d y i , d ) + m 2 × ω 2 × ( y r a n d , d y i , d ) ,
In the formula, y i , d represents the individual’s position, and E p o o l d represents the currently obtained best solution or exit.

2.3. The Proposed mESC Algorithm

ESC performs well in solving simple problems in low dimensions, but its performance significantly decreases when solving complex multimodal and combinatorial functions. This means that it is more prone to getting stuck in local solution spaces, and the continuous reduction in population diversity makes it difficult for the algorithm to maintain synchronous exploration and development, ultimately leading to overall performance degradation. Therefore, this article proposes some improvement strategies and develops the mESC algorithm to address these shortcomings. The specific improvement strategies are as follows.

2.3.1. Adaptive Perturbation Factor Strategy

Generally speaking, the population diversity of algorithms will decrease as the algorithm runs, and the significant reduction in diversity in the later stages of iteration is not conducive to the full exploration of the population. This article proposes an adaptive perturbation factor to overcome this drawback, which adjusts the perturbation probability of individuals in the population as the iteration progresses; furthermore, it enriches the diversity of the population. The specific expression is as follows:
A D F = 0.5 + 0.2 × R A N D × ( 1 i t T max ) ( 2 × i t T max ) .
R A N D is a random number in the equation.
As A D F increases, it enhances the global search capability and avoids falling into local optima. However, as A D F gradually decreases, it improves the local search accuracy and accelerates convergence. For continuous functions, when an individual has not yet found the optimal solution, there are better solutions nearby. The adaptive perturbation factor can adjust the individual extremum, global extremum, and position term to increase the possibility of finding the global optimal solution.

2.3.2. Restart Mechanism

ESC has the drawbacks of premature stagnation and getting stuck in local space, and this article uses a restart mechanism [29] to improve this. This mechanism can enhance the robustness of ESC while improving the global search capability, and effectively eliminating some poor individuals, thereby achieving the goal of enhancing algorithm convergence.
We set the worst individual factor in this article to 0.05, select the worst quantity as 0.1   N u m , and N u m as the population size. The position update equation for these worst individuals is as follows:
y i = G a u s s i a n   ( Y b e s t , τ ) + ( R A N D × y i R A N D × Y b e s t ) .
τ satisfies the formula in the equation,
τ = log ( i t + 1 ) i t + 1 × ( y i Y b e s t ) ,
In the formula, G a u s s i a n   ( Y b e s t , τ ) follows a Gaussian distribution, Y b e s t represents the optimal individual, and R A N D is a random number.
In this strategy, the restart mechanism gives the algorithm the opportunity to jump out of local optima and explore other solution spaces, thereby increasing the probability of finding the global optimum. In addition, as the iteration progresses, the convergence speed may slow down. However, the restart mechanism is equivalent to using the fast convergence characteristics of the population in the initial stage of the iteration, and this mechanism can prompt the algorithm to continue optimization when facing local stagnation.

2.3.3. Boundary Adjustment Strategy Based on Elite Pool

According to Equation (10), we have obtained the position of the entire population. Next, we will perform boundary processing on the obtained positions to ensure the correctness and robustness of the algorithm by applying specific processing methods to the boundaries or extreme cases. Generally, when an individual exceeds the population boundary, they are indiscriminately assigned a critical value to the boundary, which can lead to local aggregation of individuals on the boundary and affect the search for the global optimal solution. This article introduces the boundary adjustment strategy of the elite pool, which updates the boundaries of individuals in the population based on the selected members in the elite pool.
y i , d n e w = ( E p o o l d + y i , d ) / 2 , y i , d ( i t + 1 ) > U   o r   y i , d ( i t + 1 ) < L y i , d                                                 e l s e .
Therefore, the position formula of the population is updated to,
y i , d n e w = ( y i , d n e w × ¬   ( F l a g U + F l a g L ) ) + U × F l a g U + L × F l a g L ,
In the formula, F l a g U = y i , d n e w > U , F l a g L = y i , d n e w < L .
In this strategy, the elite pool ensures that the optimal solutions of each iteration are not eliminated by storing them, and these elite solutions reduce invalid searches by concentrating on the search potential area. By retaining diverse elite solutions, it is possible to prevent the population from prematurely falling into local solutions and enhance global search capabilities. Because elite solutions come from different regions of the population, this can maintain a balance between exploration and development for the algorithm. After mastering the position of the elite solution, the boundary can be adjusted to search in the area that is most likely to find the global optimal solution.

2.3.4. Dynamic Centroid Reverse Learning Strategy

This article proposes a random centroid reverse learning strategy to improve ESC. Based on the idea of reverse learning, while considering existing solutions, opposite solutions are also taken into account. By comparing with the reverse solution, choose the better solution to guide other individuals in the population to seek optimization. While balancing the concepts of adversarial learning and centroids, the robustness of mESC is improved by introducing randomness elements, in the following specific form:
Generate integer B [ 2 ,   N u m ] , which is the number of randomly selected populations. Then, randomly select B individuals from the current population and calculate their centroids, expressed as follows:
M = a = 1 B V a B .
Then, generate the population’s ortho solutions about the centroid, as shown below:
V a = 2 × M V a .   a = 1 ,   2 ,   ,   N u m .
Finally, using the greedy rule, the top N u m individuals with the best fitness values were selected from the original improved population and the population V a V a that underwent random centroid reverse learning as the new generation population. The random centroid reverse learning strategy utilizes the excellent solutions obtained from the previous generation to guide population initialization, improve algorithm accuracy, accelerate convergence speed, and enable faster search near potentially optimal positions.
In this strategy, the centroid will dynamically update with changes in the population to ensure that the algorithm can respond to changes in the population in a timely manner to avoid premature convergence. After integrating reverse learning, the reverse solution expands the search space and increases the diversity of the population, which helps to escape from local optima

2.3.5. Specific Steps of mESC

The pseudocode of the improved escape algorithm incorporating adaptive perturbation factor, restart mechanism, boundary adjustment strategy based on elite pool, and dynamic centroid reverse learning strategy, is listed in Algorithm 1. 
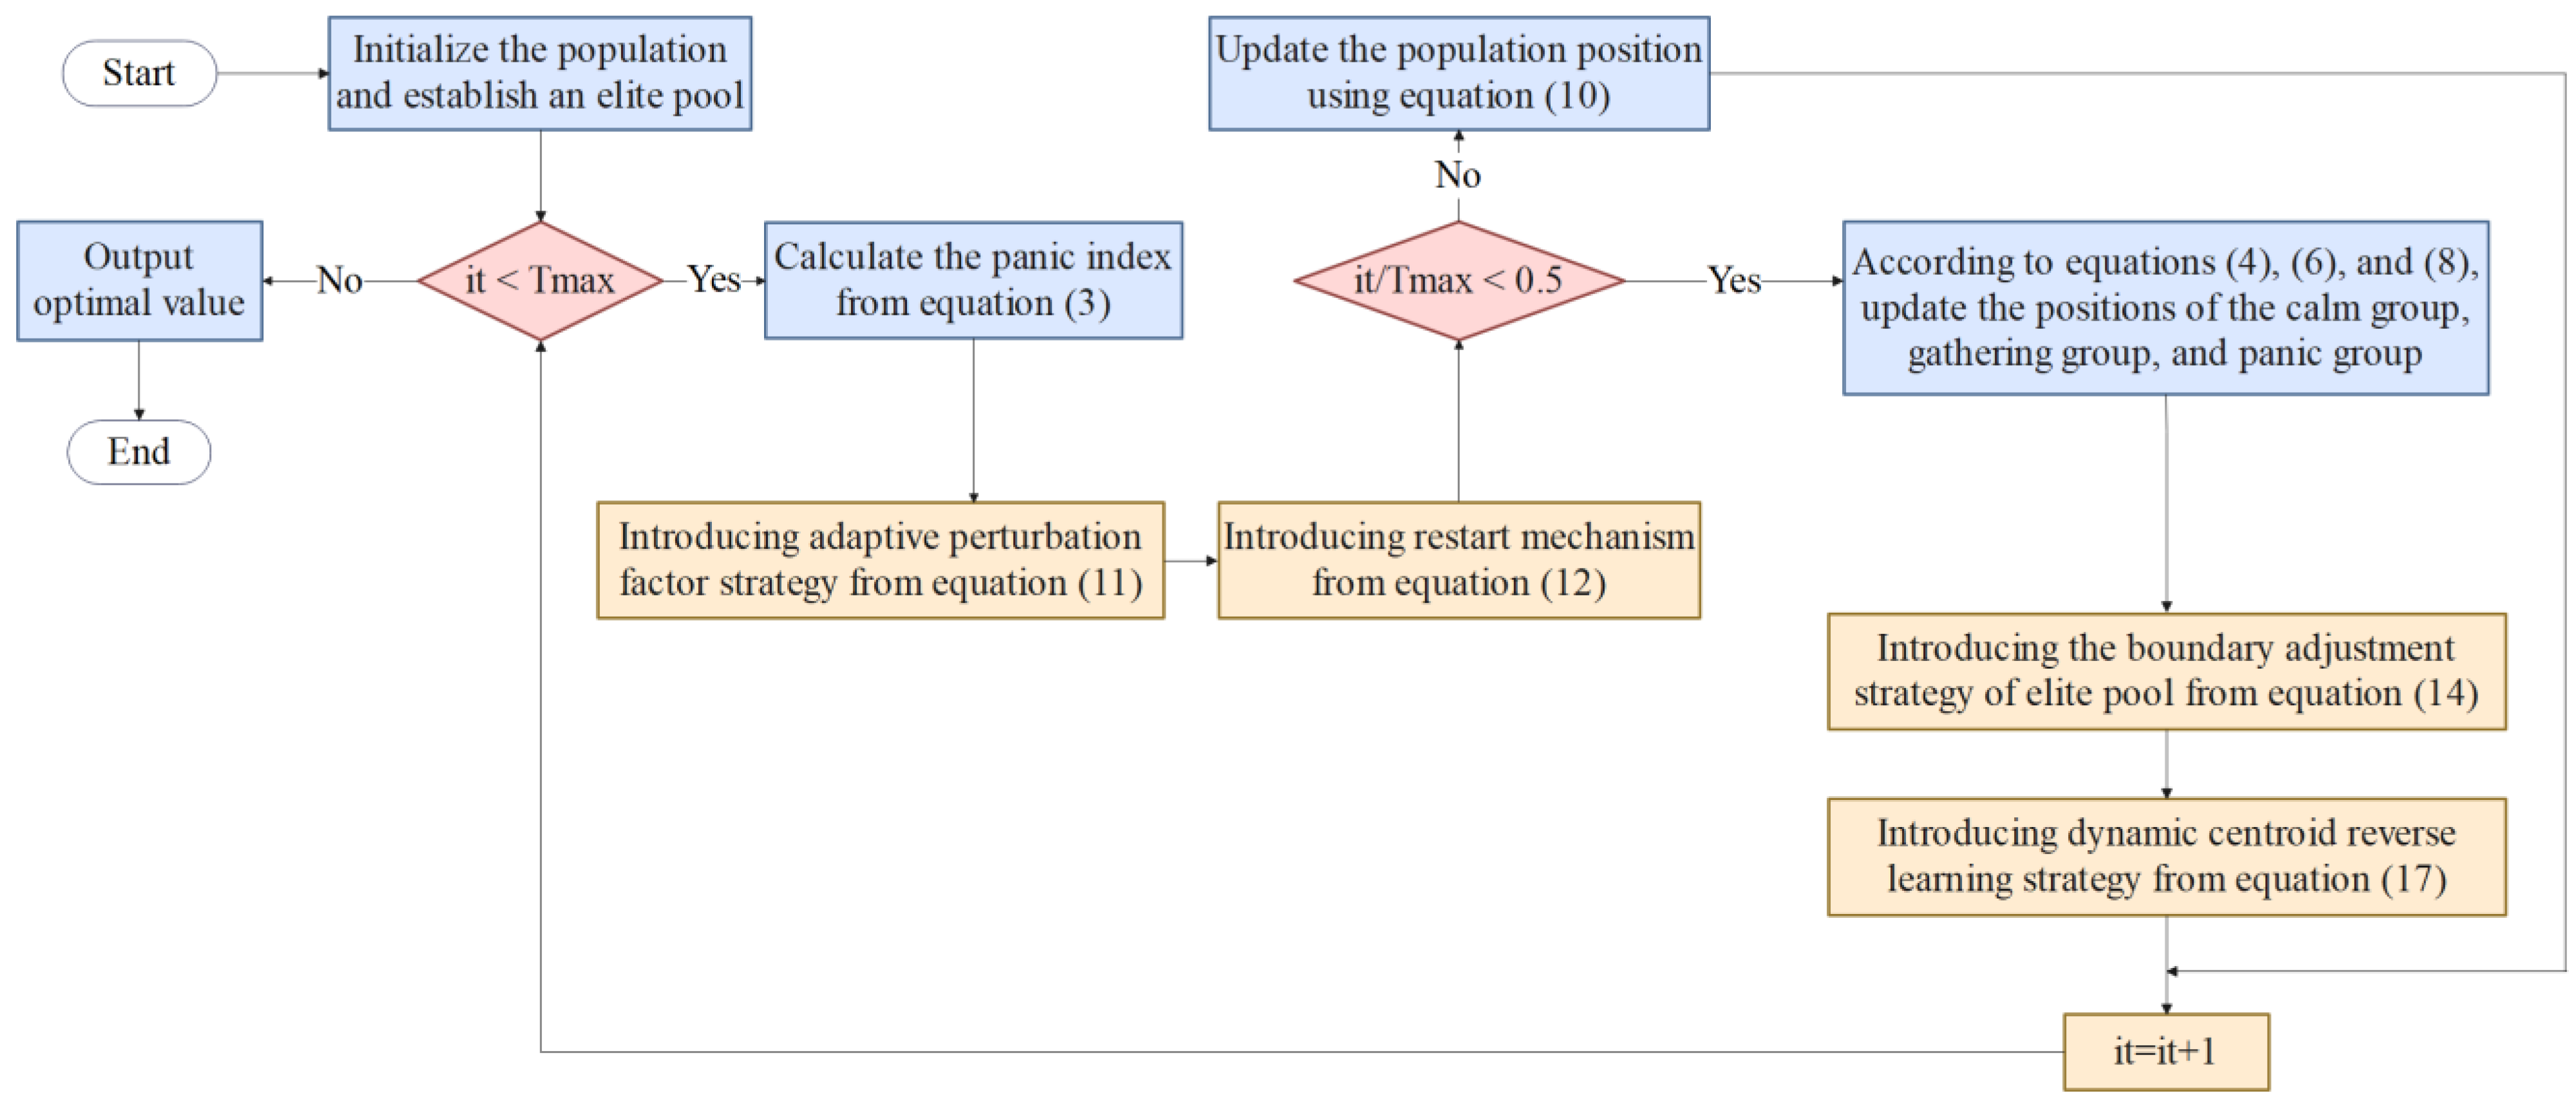
Figure 1 shows the flowchart of mESC.
Algorithm 1 The proposed mESC
Input: Dimension D , Population y i ( i = 1 , 2 , , N u m ) , Population size N u m , Maximum number of iterations T max , The worst individual ratio Pworst is 0.1
Output: Optimal fitness value f i t b e s t
1:  Randomly initialize the individual positions of the population using Equation (1)
2:  Sort the fitness values of the population in ascending order and record the current optimal individual
3:  Store the refined individuals in the elite pool of Equation (2)
4:  while ( i t < T max ) do
5:      Calculate the panic index from Equation (3)
6:       A D F = 0.5 + 0.2 × R A N D × ( 1 i t T max ) ( 2 × i t T max ) .
7:      for i = 1 : N u m do
8:          for j = 1 : D do
9:               τ = log ( i t + 1 ) i t + 1 × ( y i Y b e s t ) ,
10:             y i = G a u s s i a n   ( Y b e s t , τ ) + ( R A N D × y i R A N D × Y b e s t ) .
11:         end for
12:      end for
13:      if i t / T max 0.5 then
14:          Divide the population into three groups and update the three groups according to Equations (4), (6) and (8)
15:      else
16:          Equation (10) updates the population
17:      end
18:      for i = 1 : N u m do
19:           y i , d n e w = ( E p o o l d + y i , d ) / 2 , y i , d ( i t + 1 ) > U   o r   y i , d ( i t + 1 ) < L , y i , d ,                                               e l s e .
20:           y i , d n e w = ( y i , d n e w × ¬   ( F l a g U + F l a g L ) ) + U × F l a g U + L × F l a g L .
21:      end
22:       V a = 2 × M V a .   a = 1 ,   2 ,   ,   N u m
23:  Calculate individual fitness values and update the elite pool based on the optimal value
24:   i t = i t + 1
25:  end while
26:  Return the optimal solution from the elite pool

2.4. Complexity Analysis of mESC

The time complexity of mESC consists of three parts: initialization, main iteration process, and dynamic centroid reverse learning: population size of N , number of iterations of T max , dimension of D , restart times of R , and elite pool size of K . The time complexity of mESC is as follows:
O ( m E S C ) = O ( i n i t i a l i z a t i o n ) + T max ( O ( i t e r a t i v e p r o c e s s )                                           + O ( e l i t e   P o o l ) + O ( r e s t a r t   m e c h a n i s m ) )                                   = O ( N D + T max ( ( N D + N log N ) + ( N D + K D )                                           + ( N D + R N D ) )                                   = O ( T max N ( log N + k + R + D ) ) .
The spatial complexity of an algorithm refers to the trend of the required storage space during its runtime. The time complexity of mESC consists of population storage, fitness value storage, and elite pool storage. However, the spatial complexity corresponding to other strategies is O ( N D ) . The time complexity of mESC is as follows:
O ( m E S C ) = O ( p o p u l a t i o n   s t o r a g e ) + O ( f i t n e s s   v a l u e   s t o r a g e )                                                                               + O ( e l i t e   P o o l   s t o r a g e )                                   = O ( N D + N D + ( N D + K D ) )                                   = O ( N D + K D ) .

2.5. Experimental Setup

We conducted two sets of comparative experiments to validate the performance of the proposed algorithm. The first set compared mESC with 16 other newly proposed metaheuristic algorithms, including some competitive algorithms proposed in 2023 and 2024, which showed excellent performance in solving some problems. The second group conducted comparative experiments between mESC and 11 high-performance, winner algorithms, including 3 winner algorithms from CEC competitions, 4 variant algorithms from DE, and 3 variant algorithms from PSO. These algorithms have generally strong performance and are often used as competitors in comparative experiments. By comparing with current new algorithms and powerful algorithms in the past, the superiority of mESC is highlighted.
This article will include some experimental tables and images in the Supplementary Materials. Among them, Tables S1 and S2 and Tables S3 and S4, respectively, show the results of two types of parameters in the 10 and 20 dimensions. Tables S5 and S6 and Tables S7 and S8 show the experimental results and Wilcoxon results of mESC and the novel metaheuristic algorithm in 10 and 20 dimensions, respectively. Tables S9 and S14 show the running times of mESC, the new metaheuristic algorithm, and the high-performance, winner algorithm, respectively. Tables S10 and S11 and Tables S12 and S13, respectively, show the experimental results and Wilcoxon results of mESC and high-performance, winner algorithm in 10 and 20 dimensions. Figures S1 and S2 show the convergence curves and boxplots of mESC and the novel metaheuristic algorithm, respectively. Figures S3 and S4 show the convergence curves and boxplots of mESC and high-performance, winner’s algorithm, respectively.

2.5.1. Benchmark Test Function

Use the CEC2022 (D = 10, 20) test kit to evaluate the performance of mESC for two comparative experiments. Set the population size of mESC to 30, with a maximum iteration of 500, and run it independently 30 times as a whole.

2.5.2. Parameter Settings

The new metaheuristic algorithms compared in the first set of experiments include Parrot Optimization (PO) [30], Geometric Mean Optimization (GMO) [31], Fata Morgana Algorithm (FATA) [32], Moss Growth Optimization (MGO) [33], Crown Pig Optimization (CPO) [34], Polar Lights Optimization (PLO) [35], Newton–Raphson-based Optimizer (NRBO) [36], Information Acquisition Optimization (IAO) [37], Love Evolutionary Algorithm (LEA) [38], Escape Algorithm (ESC), Improved Artificial Rabbit Optimization (MNEARO), Artificial Hummingbird Algorithm (AHA), Dwarf Mongoose Optimization Algorithm (DMOA), Zebra Optimization Algorithm (ZOA), and Seahorse Optimization (SHO). The high performance compared in the second set of experiments, the winning algorithm includes Autonomous Particle Groups for Particle Dwarm Optimization (AGPSO) [39], Integrating Particle Swarm Optimization and Gravity Search Algorithm (CPSOGSA) [40], Improved Particle Swarm Optimization (TACPSO) [41], Bernstein–Levy Differential Evolution (BDE) [42], Bezier Search Differential Evolution (BeSD) [43], Multi Population Differential Evolution (MDE) [44], Improving Differential Evolution through Bayesian Hyperparameter Optimization (MadDE) [45], Improved LSHADE Algorithm (LSHADE-cnEpSin) [46], Improvement of L-SHADE Using Semi-parametric Adaptive Method (LSHADE-SPACMA) [47], and Improving SHADE with Linear Population Size Reduction (LSHADE) [48]. All parameters are given in Table 1.

2.5.3. Empirical Test

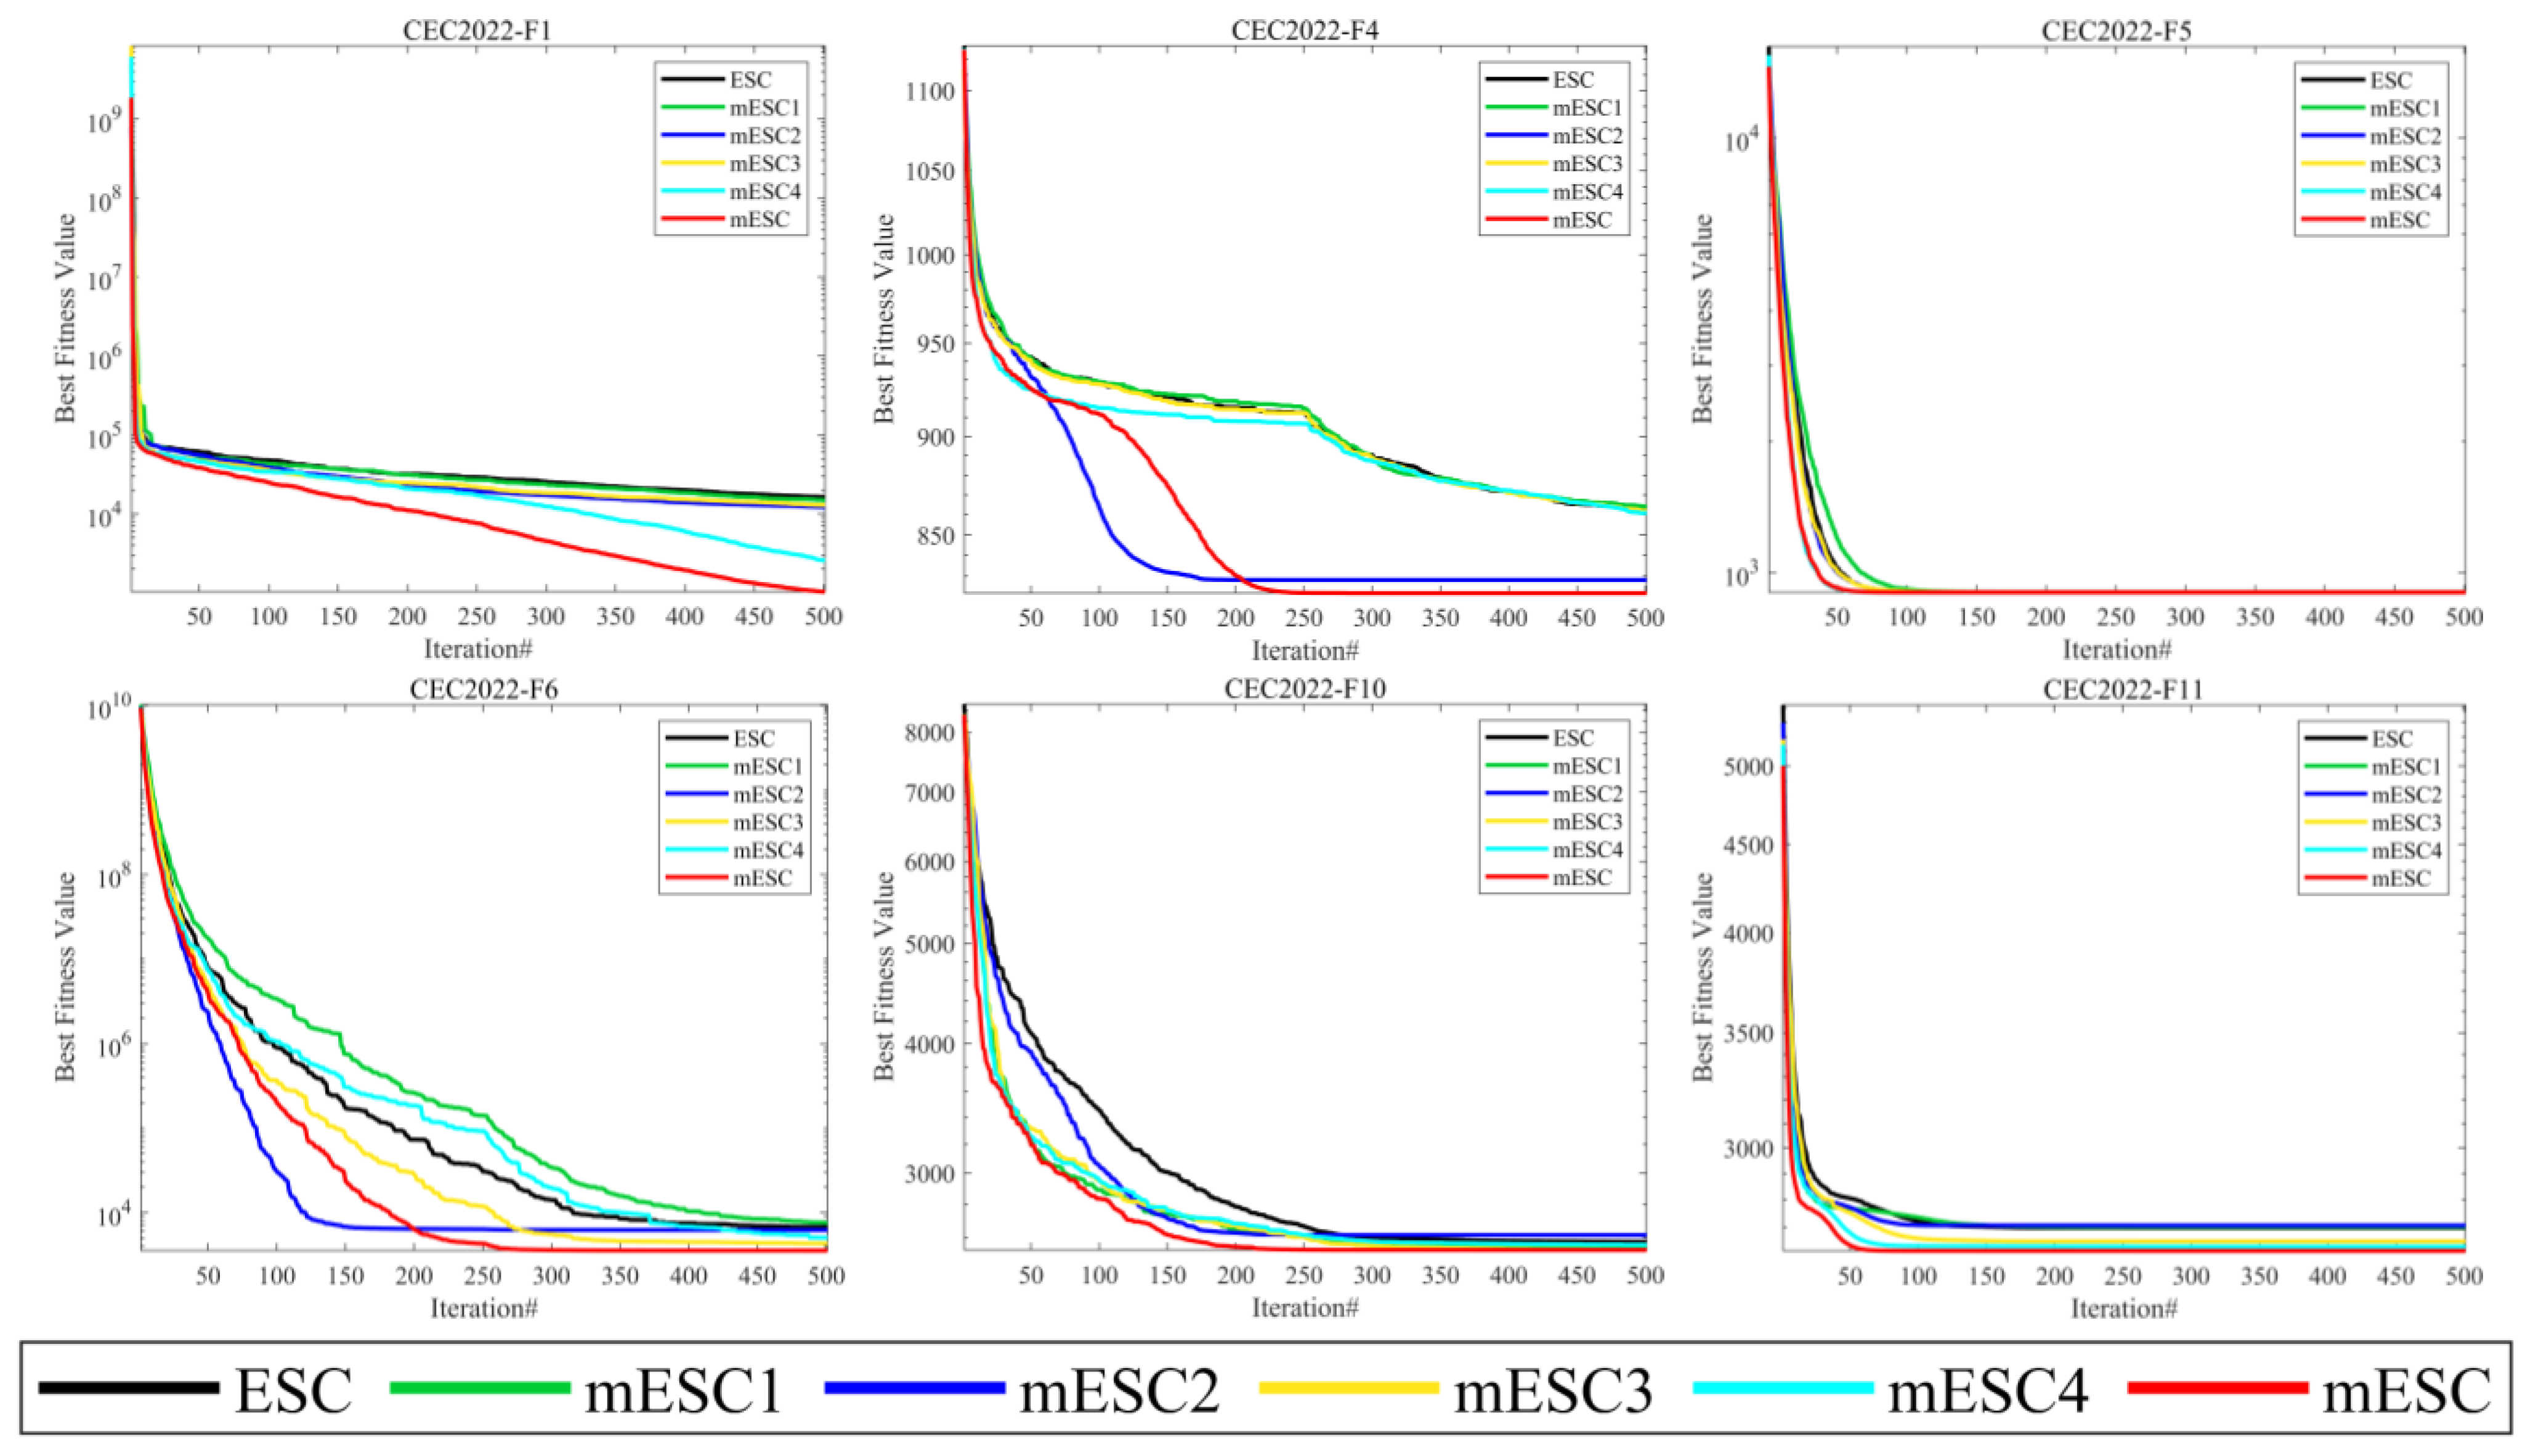
Before starting this section, we defined mESC1, mESC2, mESC3, and mESC4 as algorithms that separately introduce adaptive perturbation factors, restart mechanisms, boundary adjustment strategies based on elite pools, and dynamic centroid reverse learning strategies for mESC. Subsequently, we conducted impact analysis on mESC, ESC, mESC1, mESC2, mESC3, and mESC4, and discussed the degree of impact of the proposed individual strategies on the original ESC and mESC.
Given the convergence of six algorithms from Figure 2, when solving the F1 problem, mESC and mESC4 have the best convergence effect, while other competitors have all fallen into local optima after a mid-term operation. However, mESC has a convergence effect that is 1 or 2 orders of magnitude better than mESC4. For F4, mESC and mESC2 have the closest convergence effects. For F5, visually speaking, the convergence of the six algorithms is very close, but mESC has the fastest convergence speed. For F6, mESC has the highest convergence accuracy, while mESC2 converges faster than mESC. For F10, mESC1, mESC3, mESC4, and mESC, their convergence is very close at the beginning of the operation, but mESC has a higher convergence accuracy. The convergence of F11, mESC, and mESC4 are very similar, while the convergence accuracy of other algorithms is inferior to mESC. The four strategies play different roles in improving the algorithm, which is related to their different mechanisms, and combining them will produce better results.
Table 2 presents the 12 experimental results on the CEC2022 test suite, and according to this table, mESC has the best overall performance. MESC has the optimal mean on 10 questions and the optimal standard deviation on four questions, indicating that the combination of these four improvement strategies is effective. MESC is optimal on unimodal functions and can also achieve optimality on fundamental functions. The performance of mESC3 is optimal on the mixed function F6, while mESC reaches its optimum on F7 and F8. MESC1 performs the best on F10, outperforming mESC, while mESC performs better on other functions. Overall, we can demonstrate that mESC performs the best and validates the effectiveness of the four strategies.

2.5.4. Sensitivity of the Parameters

In the proposed mESC, the main strategies introduced are the proportion of worst-performing individuals α in the restart mechanism and the parameter adaptive disturbance factor adjustment range β in the adaptive disturbance factor strategy, which affect the performance of the algorithm. In this section, we determine the relevant parameters on the CEC2022 test set. The variable dimensions in the experiment are the standard dimensions 10 and 20 of the test set, with a maximum iteration of 500. The average values obtained from different parameters are shown in Tables S1–S4 and the ranking is given in the last row of the table.
The worst individual ratio α determines the proportion of individuals replaced after each restart. A smaller value will make it easier to fall into local optima while accelerating convergence, while a larger value will significantly slow down convergence while making global search stronger. The parameter ranges from 0.05 to 0.20 and increases by 0.05. As shown in Tables S1 and S2, α = 0.05 achieves better performance and performance in both 10 and 20 dimensions based on the final ranking.
The adaptive interference factor adjustment range β determines the variation range of the interference factor. When the problem to be solved requires a high convergence speed, this range can be appropriately reduced. However, for scenarios with high solution quality, the variation range should be increased. In Tables S3 and S4, values are selected between 0.9 and 0.5 in increments gradually decreasing by 0.01. The results indicate that the most promising range is when the parameter decreases between 0.7 and 0.5.

2.6. Experimental Analysis of mESC and New Metaheuristic Algorithm

As shown in Figure S1, mESC has good convergence performance compared to other competitors when dealing with different dimensional problems on CEC2022. Given MESC in F1 on the 10 dimensions, F3, F5, F7, the convergence speed in the early stage is the fastest, and it can quickly find the global optimum. ZOA has the fastest convergence speed in the early stage on F4, while LEA and CPO fall into local optima prematurely on multiple functions. The optimization accuracy of mESC is much better than other algorithms. On the 20-dimensional F4 problem, ZOA, SHO, and NRBO converge slightly faster than the proposed algorithm in the early stages of iteration, but mESC has the best convergence accuracy. On F3, F4, and F11, AHA, MNEARO, ESC, and mESC have very similar convergence accuracy in the middle and later stages of iteration, but mESC has higher convergence accuracy.
From Tables S5 and S6, it can be seen that mESC’s overall average ranking and ranking on various benchmark functions are superior to other competitors, demonstrating superior performance. The overall ranking in 10 dimensions is 1.83, ranking first on 5 benchmark functions. MNEARO’s overall ranking is second only to mESC. The overall ranking in 20 dimensions is 1.50, ranking first on 8 benchmark functions, while MGO ranks worst in two dimensions.
Tables S7 and S8 present the statistical results of the Wilcoxon rank sum test on different dimensions of CEC2022. On the 10 dimensions, mESC outperforms PO, FATA, MGO, ECO, CPO, PLO, NRBO, LEA, SHO, ZOA, and MNEARO on all 12 benchmark functions. On the 20 dimensions, mESC outperforms PO, FATA, MGO, NRBO, ECO, CPO, PLO, LEA, SHO, ZOA, and MNEARO on 12 benchmark functions, and also outperforms mESC on five functions.
Figure S2 shows the boxplots of mESC and other competitors in different dimensions of CEC2022. Overall, mESC has shorter boxes on different functions, especially F1, F3, F5, and F7 on the 10 dimensions and F2 on the 20 dimensions, F9, F10, and F11, This demonstrates the superiority and stability of mESC.
The running time of an algorithm is also an indicator for evaluating its performance. As shown in Table S9, CPO has the shortest running time and ranks first, while mESC ranks very low in both dimensions of running time, which is in line with our expectations. Because it is inevitable that the algorithm will run for too long while ensuring its performance, we allow this phenomenon to occur.

2.7. Experimental Analysis of mESC and High-Performance, Winner Algorithm

The experimental results of mESC and high-performance, winner algorithm on CEC2022 are presented in Tables S10 and S11. On the 10 dimensions, mESC outperforms other competitors on 8 benchmark functions, ranking first overall with an average ranking of 1.58. MadDE, ranked second overall, outperforms the proposed algorithm on two benchmark functions with an average ranking of 3.50. MDE performs better than mESC on two benchmark functions, but its overall ranking is only fourth. Overall, mESC’s testing with these competitors has validated its superior performance.
Tables S12 and S13 show the Wilcoxon rank sum test of mESC and high-performance, winner algorithm on the CEC2022 test suite (symbol ♢ = 3.0199 × 10⁻¹¹ in the table). On the 10 dimensions, BDE, BeSD, MDE, and MadDE have better p-values than mESC on 2, 2, 2, and 3 benchmark functions, respectively. The p-values of mESC on 12 functions are completely superior to AGPSO, TACPSO, LSAHDE cnEpSin, and LSHADE. On the 20 dimensions, mESC outperforms the other seven competitors on 12 benchmark functions and only has approximate performance on one function compared to CPSOGSA, TACPSO, and MDE. Therefore, we can say that the proposed strategy significantly improves the algorithm.
Figure S3 shows the convergence curve of mESC and high-performance, winner algorithm on CEC2022. In terms of 10 dimensions, the convergence of mESC is superior to other competitors. LSAHDE-SPACMA, LSAHDE, and CPSOGSA began to fall into local optima in the mid-iteration of F1 and F4. On the 20th dimension, as the dimension increases, the convergence speed of mESC improves. The accuracy of mESC on F1 and F4 is significantly better than other competitors, and some algorithms fall into local optima early on F3, F7, and F11 while mESC can maintain stability for optimization.
Table S14 presents the comparison results of the running time between mESC and high-performance, winner algorithms. The running time ranking of mESC is 12th in both dimensions, which is in line with our initial expectations. LSHADE has the shortest running time and ranks first.
Figure S4 shows the boxplots of mESC and other algorithms in different dimensions of CEC2022. Overall, mESC has shorter boxes for the vast majority of functions, especially F1, F5, F7, F1 in the 10 dimensions, and F1 in the 20 dimensions, F2, F4, F8. This indicates the stability of mESC.

3. Real World Application Solving

Next, we apply the proposed mESC to five engineering optimizations and two truss topology optimizations, highlighting its superiority through the results of solving these problems with mESC and other competitors.

3.1. mESC Optimization of Truss Topology Design Problem

Structural optimization design refers to the design of a scheme with the goals of minimizing volume, minimizing cost, and maximizing stiffness under given constraints. Meanwhile, truss optimization is aimed at reducing weight as much as possible to achieve resource recycling efficiency. The specific constraints are as follows:
Find
x = A 1 , A 2 , , A n .
Minimize
f ( x ) = i = 1 n B i A i ρ i L i + j = 1 m b j ,   B i = 0 ,   if   A i <   critical   area 1 ,   if   A i   critical   area .
A i is the cross-sectional area, b j is the mass value, ρ i is the mass density, and L i is the length of the rod.
Limitation
g 1 ( x ) : B i σ i σ i 0 ,   g 2 ( x ) : δ i δ j max 0 ,   g 3 ( x ) : f r f r min 0 g 4 ( x ) : B i σ i c o m p σ i c r 0 ,   σ i c r = k i A i E i L i 2 ,   g 5 ( x ) : A r min A A r max   g 6 : c h e c k   o n   v a l i d i t y   o f   s t r u c t u r e ,   g 7 : c h e c k   o n   k i n e m a t i c   s t a b i l i t y ,
In the formula, i = 1 , 2 , , n ,   j = 1 , 2 , , m ,   σ i represents stress, g 1 ( x ) represents stress constraint, and B i represents binary bits, g 2 ( x ) , g 3 ( x ) and g 4 ( x ) are displacement constraints, natural frequency constraints, and Euler buckling constraints, respectively; g 5 ( x ) is a cross-sectional area constraint, and without truss connections, this truss topology is invalid, i.e., g 6 . The consideration of motion stability will ensure the smooth use of the truss, i.e., g 7 .
In the truss topology optimization, if the solved cross-sectional area is less than the critical area, it is assumed that the member is removed from the Truss; otherwise, the member is retained. If the loading node, the supporting node, and the non-erasable node are not connected through any Truss pole, the generated Truss topology is invalid (g6). In order to ensure the generation of a motion stable Truss structure, motion stability (g7) is included in the design constraints, which are mainly divided into the following two criteria:
(1) The degrees of freedom of the structure calculated using the Grubler criterion should be less than 1;
(2) The motion stability of the structure is checked by the positive definiteness of the stiffness matrix created by component connections, and the global stiffness matrix should be positive definite.
To evaluate whether the design scheme meets the constraints, a penalty letter [49] needs to be introduced, as follows:
Punishment
f ( x ) = 10 9                                             if   g 7   is   violated 10 8                                             if   g 6   is   violated   with   degree   of   freedom 10 7                                             if   g 6   is   violated   with   positive   definiteness f ( x ) F p e n a l t y               otherwise ,
In the formula, F p e n a l t y = ( 1 + α C ) β ,   C = i = 1 q C i ,   C i = 1 p i / p i * , p i represent the level of constraint violation, q represents the activity constraint, and α and β are 2. The Euler buckling coefficient is set to 4.0 kg and the mass is set to 5.0 kg.

3.1.1. Optimization of 24 Bar 2D Truss

In the experiment, we selected nine algorithms including NRBO, MPSO [50], CPO, MFO, BWO, WOA, HHO [51], BSD [52], and TSA [53] as competitors. The relevant structure is shown in Figure 3, and the design variables are the segmental members of the truss. The parameters required for the experiment are described in Table 1. The experimental results of all algorithms after 20 runs are shown in Table 3, where the optimal weights and the optimal values of the average are marked with black bold graphs to evaluate the superiority and inferiority of the algorithm.
The data in Table 4 proves that the optimal weight and overall average value found by mESC are generally the best, with a minimum weight of 121.5840 and an overall average value of 140.5701. This indicates that mESC’s performance in solving this problem is the most stable compared to other competitors. Figure 4 shows the convergence graph of optimizing the problem among competitors. CPO begins to fall into local optima in the early and middle stages of iteration; MESC performed even better. Overall, the comprehensive performance of mESC has been validated in solving this optimization problem. Figure 5 shows the truss diagrams of each algorithm after removing the rods based on experimental results, with mESC having the highest number of rods removed.

3.1.2. Optimization of 72 Bar 3D Truss

Figure 6 shows the 72 bar structural diagram. The truss components are divided into 16 groups, with the top four nodes representing mass concentration points. Set the data and parameters for minimum weight optimization in Table 5. The minimum weights and average values obtained by each algorithm are shown in Table 6. The optimal weight and overall average value of mESC are generally the best, with an optimal weight of 443.7325 being the smallest among all comparison algorithms, which confirms the superiority of the proposed algorithm’s performance. Figure 7 shows the optimization design convergence graphs of all algorithms, with mESC having the highest convergence accuracy. Figure 8 shows the truss structure diagram optimized by various algorithms.
mESC can achieve the optimal structure by removing six rods; mESC needs to excel in solving such problems.

3.2. Engineering Problem

We use mESC to solve five engineering optimizations, namely minimizing the weight of the reducer, designing the welding beam, the problem of the stepper cone pulley, the problem of robot clamping, and the rolling element bearing. This article uses static penalty methods to handle constraints in the above engineering optimization problems, with the specific formula being:
ϕ ( r ) = f ( r ) ± j = 1 m h j max ( 0 ,   z j ( r ) ) ε + k = 1 n i j W j ( r ) φ .
In Formula (22), ϕ ( r ) is the objective function, h j and i j are positive penalty constants, W j and z j are constraints, and parameters ε and φ are 1 or 2.

3.2.1. Minimize the Weight of the Reducer

This question is about the design of a small aircraft engine reducer, which involves seven variables: surface width ( c 1 ) , tooth pattern ( c 2 ) , number of teeth ( c 3 ) of the small gear, the size of the first axis is ( c 4 ) , size ( c 5 ) of the other shaft, first shaft diameter ( c 6 ) , and another shaft diameter ( c 7 ) . Its characteristics are as follows:
Minimize
f ( c ¯ ) = 0.7854   c 2 2 c 1 ( 14.9334   c 3 43.0934 + 3.3333   c 3 2 )                       + 0.7854   ( c 5 c 7 2 + c 4 c 6 2 ) 1.508   c 1 ( c 7 2 + c 6 2 ) + 7.477   ( c 7 3 + c 6 3 ) .
Constraints:
g 1 ( c ¯ ) = c 1 c 2 2 c 3 + 27 0 , g 2 ( c ¯ ) = c 1 c 2 2 c 3 2 + 397.5 0 , g 3 ( c ¯ ) = c 2 c 6 4 c 3 c 4 2 + 1.93 0 , g 4 ( c ¯ ) = c 2 c 7 4 c 3 c 5 3 + 1.93 0 , g 5 ( c ¯ ) = 10 c 6 3 16.91 × 10 6 + ( 745 c 4 c 2 1 c 3 1 ) 2 1100 0 , g 6 ( c ¯ ) = 10 c 7 3 157.5 × 10 6 + ( 745 c 5 c 2 1 c 3 1 ) 2 850 0 , g 7 ( c ¯ ) = c 2 c 3 40 0 , g 8 ( c ¯ ) = c 1 c 2 1 + 5 0 , g 9 ( c ¯ ) = c 1 c 2 1 12 0 , g 10 ( c ¯ ) = 1.5 c 6 c 4 + 1.9 0 , g 11 ( c ¯ ) = 1.1 c 7 c 5 + 1.9 0 .
Range:
0.7 c 2 0.8 ,   17 c 3 28 ,   2.6 c 1 3.6 , 5 c 7 5.5 ,   7.3 c 5 ,   c 4 8.3 ,   2.9 c 6 3.9 .
To solve this problem, mESC conducted comparative experiments with NRBO, MPSO, CPO, BWO, WOA, HHO, TSA, AO [54], and GWO. According to Table 7, mESC provides the optimal design with an optimal value of 2994.506339787.

3.2.2. Welding Beam Design

This design aims to minimize the cost of welding beams [55], involving weld seam width h ( c 1 ) , clamping rod length l ( c 2 ) , rod height t ( c 3 ) , and rod thickness b ( c 4 ) . The schematic diagram is shown in Figure 9, and the features are as follows:
Minimize
f ( c ¯ ) = 1.10471 c 1 2 c 2 + 0.04811 c 3 c 4 ( 14.0 + c 2 ) .
Constraints:
g 1 ( c ¯ ) = c 1 c 4 0 , g 2 ( c ¯ ) = δ ( c ) δ max 0 , g 3 ( c ¯ ) = P P c ( c ) , g 4 ( c ¯ ) = τ max τ ( c ) , g 5 ( c ¯ ) = σ ( c ) σ max 0 .
Range:
0.1 c 3 , c 2 10 , 0.1 c 4 2 , 0.125 c 1 2 , δ max = 0.25 i n , τ = τ 2 + τ 2 + 2 τ τ c 2 2 R , τ = R M J , τ = P 2 c 2 c 1 , M = P ( c 2 2 + L ) , R = c 2 2 4 + ( c 1 + c 3 2 ) 2 , σ ( c ¯ ) = 6 P L 3 E c 3 2 c 4 , J = 2 ( ( c 2 2 4 + ( c 1 + c 3 2 ) 2 ) 2 c 1 c 2 ) , P x ( c ¯ ) = 4.013 E c 3 c 4 3 6 L 2 ( 1 c 3 2 L E 4 G ) , L = 14 i n , P = 6000 l b , E = 30.10 p s i , σ max = 13600 p s i , G = 12 · 10 6 p s i .
To solve this problem, mESC conducted comparative experiments with NRBO, MPSO, CPO, BWO, WOA, HHO, TSA, AO, and GWO. The optimal value obtained by mESC on this problem in Table 8 is 1.670306973.

3.2.3. Step Cone Pulley Problem

The problem is to minimize the weight of the stepping cone pulley [56], involving five variables: pulley diameter and pulley width. Figure 10 shows its design diagram:
Minimize
f ( c ¯ ) = ρ ω d 1 2 11 + ( N 1 N ) 2 + d 2 2 1 + ( N 2 N ) 2 + d 3 2 1 + ( N 3 N ) 2 + d 4 2 1 + ( N 4 N ) 2 .
Constraints:
h 1 ( c ¯ ) = X 1 X 2 = 0 , h 2 ( c ¯ ) = X 1 X 3 = 0 , h 3 ( c ¯ ) = X 1 X 4 = 0 , g i = 1 , 2 , 3 , 4 ( c ¯ ) = R 2 , g i = 5 , 6 , 7 , 8 ( c ¯ ) = ( 0.75 × 745.6998 ) P i 0 .
Among them,
X i = π d i 2 ( 1 + N i N ) + ( N i N ) 2 4 a + 2 a , i = ( 1 , 2 , 3 , 4 ) , R i = exp μ π 2 sin 1 ( N i N 1 ) d i 2 a , i = ( 1 , 2 , 3 , 4 ) , P i = s t ω ( 1 R i ) π d i N i 60 , i = ( 1 , 2 , 3 , 4 ) , t = 8 mm , s = 1.75 MPa , μ = 0 . 35 , ρ = 7200 kg / m 3 , a = 3 mm .
To address this issue, comparative experiments were conducted in Table 9 between mESC and competitors such as MPSO, CPO, AVOA [57], BWO, WOA, HHO, TSA, AO, and GWO. The results showed that mESC achieved the best performance with an optimal value of 16.983218316.

3.2.4. Robot Clamping Problem

This task studies the force that robot grippers can generate when grasping objects, while ensuring that the objects are not damaged and the grasping is stable [58]. Figure 11 is a structural diagram, characterized by the following:
Minimize
f ( c ¯ ) = min z F k ( c , z ) + max z F k ( c , z ) .
Constraints:
g 1 ( c ¯ ) = Y min + y ( c ¯ , Z max ) 0 , g 2 ( c ¯ ) = y ( c , Z max ) 0 , g 3 ( c ¯ ) = Y max y ( c ¯ , 0 ) 0 , g 4 ( c ¯ ) = y ( c ¯ , 0 ) Y G 0 , g 5 ( c ¯ ) = l 2 + e 2 ( a + b ) 2 < 2 , g 6 ( c ¯ ) = b 2 ( a e ) 2 ( l Z max ) 2 0 , g 7 ( c ¯ ) = Z max l 0 .
Among them,
α = cos 1 ( a 2 + g 2 b 2 2 a g ) + φ , g = e + ( z 2 l ) 2 , β = cos 1 ( b 2 + g 2 a 2 2 b g ) φ , φ = tan 1 ( e l z ) , y ( c , z ) = 2 ( f + e + x sin ( β + δ ) ) , F k = P b sin ( α + β ) / 2 x cos ( α ) , Y min = 50 , Y max = 100 , Y G = 150 , Z max = 100 , P = 100 .
Range:
0 e 50 , 100 x 200 , 10 f , a , b 150 , 1 δ 3.14 , 100 l 300 .
To address this issue, mESC conducted comparative experiments with MPSO, CPO, AVOA, BWO, WOA, HHO, TSA, AO, and GWO. Table 10 presents the design results, and mESC achieved the best performance with an optimal value of 16.983218316.

3.2.5. Rolling Element Bearings

This article applies mESC to optimize the design of rolling bearings. The schematic diagram is shown in Figure 12, with a total of 10 optimization parameters and the following characteristics:
Minimize
f ( c ¯ ) = f x Z 2 / 3 D b 1.8                       ,   i f   D b 25.4   m m , 3.647 f x Z 2 / 3 D b 1.4     ,   o t h w e w i s e .
Constraints:
g 1 ( c ¯ ) = Z φ 0 / 2 sin 1 ( D b / D m ) 1 0 , g 2 ( c ¯ ) = K D min ( D d ) 2 D b 0 , g 3 ( c ¯ ) = 2 D b K D min ( D d ) 0 , g 4 ( c ¯ ) = D b w 0 , g 5 ( c ¯ ) = 0.5 ( D + d ) D m 0 , g 6 ( c ¯ ) = D m ( 0.5 + e ) ( D + d ) 0 , g 7 ( c ¯ ) = ε D b 0.5 ( D D m D b ) 0 , g 8 ( c ¯ ) = 0.515 f i 0 , g 9 ( c ¯ ) = 0.515 f 0 0 .
where
f x = 37.91 1 + 1.04 ( 1 γ 1 + γ ) 1.72 ( f i ( 2 f 0 1 ) f 0 ( 2 f i 1 ) ) 0.41 10 / 3 0.3 , γ = D b cos ( α ) D m , f i = r i D b , f 0 = r 0 D b , φ 0 = 2 π 2 cos 1 ( ( D d ) / 2 3 ( T / 4 ) 2 + D / 2 ( T / 4 ) D b 2 2 ( D b ) / 2 3 ( T / 4 ) d / 2 + ( T / 4 ) 2 D / 2 ( T / 4 ) D b ) , T D d 2 D b , D = 160 , d = 90 , B w = 30 .
Range:
0.5 ( D + d ) < D m < 0.6 ( D + d ) , 0.15 ( D d ) < D b < 0.45 ( D d ) , 4 Z 50 , 0.515 f 0 0.6 , 0.4 K D min 0.5 , 0.6 K D max 0.7 , 0.3 ε 0.4 , 0.02 e 0.1 , 0.6 ζ 0.85 .
To solve this problem, mESC was compared with MPSO, CPO, AVOA, BWO, WOA, HHO, TSA, AO, and GWO in experimental experiments. mESC can achieve optimal performance levels, and the optimal value of 16,958.202286941 is given in Table 11.

4. Summarize

This study proposes an improved version of mESC based on multi-strategy enhancement, which maintains population diversity through adaptive perturbation factor strategy, restarts the mechanism to improve the global exploration of mESC, and balances local development of the algorithm through dynamic centroid reverse learning strategy. Finally, the elite pool boundary adjustment strategy is used to accelerate population convergence. mESC conducted performance tests on the test suite and six optimized designs to demonstrate its strong superiority. In the future, we will further expand mESC, research new population update mechanisms, and apply them in areas such as feature selection, image segmentation, and information processing.

Supplementary Materials

The following supporting information can be downloaded at: https://www.mdpi.com/article/10.3390/biomimetics10040232/s1.

Author Contributions

Conceptualization, J.L. and L.C.; Methodology, J.L. and J.Y.; Software, J.L., J.Y. and L.C.; Validation, J.Y. and L.C.; Formal analysis, J.L. and L.C.; Investigation, J.L. and J.Y.; Resources, J.L., J.Y. and L.C.; Data curation, J.L. and L.C.; Writing—original draft, J.L., J.Y. and L.C.; Writing—review & editing, J.L., J.Y. and L.C.; Visualization, J.Y. and L.C.; Supervision, J.L. and L.C.; Project administration, J.L.; Funding acquisition, J.L. All authors have read and agreed to the published version of the manuscript.

Funding

This work is supported by the Natural Science Research Program of the Shaanxi Education Department in China (grant No. 24JC021). This work is also supported by the 2024 Shaanxi Provincial Key R&D Program project in China (grant No. 2024GX-YBXM-529).

Institutional Review Board Statement

Not applicable.

Informed Consent Statement

Not applicable.

Data Availability Statement

All data generated or analyzed during the study are included in this published article.

Conflicts of Interest

The authors declare no conflicts of interest.

References

  1. Krentel, M.W. The complexity of optimization problems. In Proceedings of the Eighteenth Annual ACM Symposium on Theory of Computing, Berkeley, CA, USA, 28–30 May 1986; pp. 69–76. [Google Scholar] [CrossRef]
  2. Zhao, Y.; vom Lehn, F.; Pitsch, H.; Pelucchi, M.; Cai, L. Mechanism optimization with a novel objective function: Surface matching with joint dependence on physical condition parameters. Proc. Combust. Inst. 2024, 40, 105240l. [Google Scholar] [CrossRef]
  3. Alireza, M.N.; Mohamad, S.A.; Rana, I. Optimizing a self-healing gelatin/aldehyde-modified xanthan gum hydrogel for extrusion-based 3D printing in biomedical applications. Mater. Today Chem. 2024, 40, 102208. [Google Scholar] [CrossRef]
  4. Ehsan, B.; Peter, B. A simulation-optimization approach for integrating physical and financial flows in a supply chain under economic uncertainty. Oper. Res. Perspect. 2023, 10, 100270. [Google Scholar] [CrossRef]
  5. Xie, D.W.; Qiu, Y.Z.; Huang, J.S. Multi-objective optimization for green logistics planning and operations management: From economic to environmental perspective. Comput. Ind. Eng. 2024, 189, 109988. [Google Scholar] [CrossRef]
  6. Ibham, V.; Aslan, D.K.; Sener, A.; Martin, S.; Muhammad, I. Machine learning of weighted superposition attraction algorithm for optimization diesel engine performance and emission fueled with butanol-diesel biofuel. Ain Shams Eng. J. 2024, 12, 103126. [Google Scholar] [CrossRef]
  7. Kennedy, J.; Eberhart, R. Particle swarm optimization. In Proceedings of the ICNN’95−International Conference on Neural Networks, Perth, WA, Australia, 27 November–1 December 1995; Volume 4, pp. 1942–1948. [Google Scholar] [CrossRef]
  8. Storn, R.; Price, K. Differential evolution–a simple and efficient heuristic for global optimization over continuous spaces. J. Glob. Optim. 1997, 11, 341–359. [Google Scholar] [CrossRef]
  9. Trojovská, E.; Dehghani, M.; Trojovský, P. Zebra Optimization Algorithm: A New Bio-Inspired Optimization Algorithm for Solving Optimization Algorithm. IEEE Access 2022, 10, 49445–49473. [Google Scholar] [CrossRef]
  10. Seyedali, M. Moth-flame optimization algorithm: A novel nature-inspired heuristic paradigm. Knowl.-Based Syst. 2015, 89, 228–249. [Google Scholar] [CrossRef]
  11. Abdel-Basset, M.; Mohamed, R.; Jameel, M. Spider wasp optimizer: A novel meta-heuristic optimization algorithm. Artif. Intell. Rev. 2023, 56, 11675–11738. [Google Scholar] [CrossRef]
  12. Zhao, S.; Zhang, T.; Ma, S.; Chen, M. Sea-horse optimizer: A novel nature-inspired meta-heuristic for global optimization problems. Appl. Intell. 2023, 53, 11833–11860. [Google Scholar] [CrossRef]
  13. Hao, W.G.; Wang, L.Y.; Mirjalili, S. Artificial hummingbird algorithm: A new bio-inspired optimizer with its engineering applications. Comput. Methods Appl. Mech. Eng. 2022, 388, 114194. [Google Scholar] [CrossRef]
  14. Agushaka, J.O.; Ezugwu, A.E.; Abualigah, L. Dwarf Mongoose Optimization Algorithm: A New Bio-Inspired Metaheuristic Method for Engineering Optimization. Comput. Methods Appl. Mech. Eng. 2022, 391, 114570. [Google Scholar] [CrossRef]
  15. Sang-To, T.; Hoang-Le, M.; Wahab, M.A. An efficient Planet Optimization Algorithm for solving engineering problems. Sci. Rep. 2022, 12, 8362. [Google Scholar] [CrossRef]
  16. Atashpaz-Gargari, E.; Lucas, C. Imperialist competitive algorithm: An algorithm for optimization inspired by imperialistic competition. In Proceedings of the 2007 IEEE Congress on Evolutionary Computation, Singapore, 25–28 September 2007; pp. 4661–4667. [Google Scholar] [CrossRef]
  17. Rao, R.V.; Savsani, V.J.; Vakharia, D.P. Teaching–learning-based optimization: An optimization method for continuous non-linear large scale problems. Inf. Sci. 2012, 183, 1–15. [Google Scholar] [CrossRef]
  18. Hu, G.; Cheng, M.; Houssein, E.H.; Hussien, A.G.; Abualigah, L. SDO: A novel sled dog-inspired optimizer for solving engineering problems. Adv. Eng. Inform. 2024, 62, 102783. [Google Scholar] [CrossRef]
  19. Mirjalili, S.; Mirjalili, S.M.; Lewis, A. Grey Wolf Optimizer. Adv. Eng. Softw. 2014, 69, 46–61. [Google Scholar] [CrossRef]
  20. Dehghani, M.; Trojovský, P. Osprey optimization algorithm: A new bio-inspired metaheuristic algorithm for solving engineering optimization problems. Front. Mech. Eng. 2023, 8, 1126450. [Google Scholar] [CrossRef]
  21. Xue, J.; Shen, B. Dung beetle optimizer: A new meta-heuristic algorithm for global optimization. J. Supercomput. 2023, 79, 7305–7336. [Google Scholar] [CrossRef]
  22. Rashedi, E.; Nezamabadi-Pour, H.; Saryazdi, S. GSA: A gravitational search algorithm. Inf. Sci. 2009, 179, 2232–2248. [Google Scholar] [CrossRef]
  23. Hakki, M.G.; Eksin, I.; Erol, O.K. A new optimization method: Big Bang-Big Crunch. Adv. Eng. Softw. 2006, 37, 106–111. [Google Scholar] [CrossRef]
  24. Hu, G.; Huang, F.Y.; Seyyedabbasi, A.; Wei, G. Enhanced multi-strategy bottlenose dolphin optimizer for UAVs path planning. Appl. Math. Model. 2024, 130, 243–271. [Google Scholar] [CrossRef]
  25. Hu, G.; Gong, C.S.; Li, X.X.; Xu, Z.Q. CGKOA: An enhanced Kepler optimization algorithm for multi-domain optimization problems. Comput. Methods Appl. Mech. Eng. 2024, 425, 116964. [Google Scholar] [CrossRef]
  26. Hu, G.; Du, B.; Chen, K.; Wei, G. Super eagle optimization algorithm based three-dimensional ball security corridor planning method for fixed-wing UAVs. Adv. Eng. Inform. 2024, 59, 102354. [Google Scholar] [CrossRef]
  27. Hu, G.; Huang, F.Y.; Chen, K.; Wei, G. MNEARO: A meta swarm intelligence optimization algorithm for engineering applications. Comput. Methods Appl. Mech. Eng. 2024, 419, 116664. [Google Scholar] [CrossRef]
  28. Ouyang, K.; Fu, S.; Chen, Y.; Cai, Q.; Heidari, A.A.; Chen, H. Escape: An Optimizer based on crowd evacuation behaviors. Artif. Intell. Rev. 2024, 58, 19. [Google Scholar] [CrossRef]
  29. Zhang, G.Z.; Fu, S.W.; Li, K.; Huang, H.S. Differential evolution with multi-strategies for UAV trajectory planning and point cloud registration. Appl. Soft Comput. 2024, 167 Pt C, 112466. [Google Scholar] [CrossRef]
  30. Lian, J.B.; Hui, G.H.; Ma, L.; Zhu, T.; Wu, X.C.; Heidari, A.A.; Chen, Y.; Chen, H.L. Parrot optimizer: Algorithm and applications to medical problems. Comput. Biol. Med. 2024, 172, 108064. [Google Scholar] [CrossRef]
  31. Rezaei, F.; Safavi, H.R.; Abd Elaziz, M. GMO: Geometric mean optimizer for solving engineering problems. Soft Comput. 27 2023, 15, 10571–10606. [Google Scholar] [CrossRef]
  32. Qi, A.; Zhao, D.; Heidari, A.A. FATA: An Efficient Optimization Method Based on Geophysics. Neurocomputing 2024, 607, 128289. [Google Scholar] [CrossRef]
  33. Zheng, B.; Chen, Y.; Wang, C. The moss growth optimization (MGO): Concepts and performance. J. Comput. Des. Eng. 2024, 11, 184–221. [Google Scholar] [CrossRef]
  34. Abdel-Basset, M.; Mohamed, R.; Abouhawwash, M. Crested Porcupine Optimizer: A new nature-inspired metaheuristic. Knowl.-Based Syst. 2024, 284, 111257. [Google Scholar] [CrossRef]
  35. Yuan, C.; Dong, Z.; Heidari, A.A.; Liu, L.; Chen, Y.; Chen, H.l. Polar lights optimizer: Algorithm and applications in image segmentation and feature selection. Neurocomputing 2024, 607, 128427. [Google Scholar] [CrossRef]
  36. Sowmya, R.; Premkumar, M.; Jangir, P. Newton-Raphson-based optimizer: A new population-based metaheuristic algorithm for continuous optimization problems. Eng. Appl. Artif. Intell. 2024, 128, 107532. [Google Scholar] [CrossRef]
  37. Wu, X.; Li, S.; Jiang, X. Information acquisition optimizer: A new efficient algorithm for solving numerical and constrained engineering optimization problems. J. Supercomput. 2024, 80, 25736–25791. [Google Scholar] [CrossRef]
  38. Gao, Y.; Zhang, J.; Wang, Y.; Wang, J.; Qin, L. Correction to: Love evolution algorithm: A stimulus–value–role theory-inspired evolutionary algorithm for global optimization. J. Supercomput. 2024, 80, 15097–15099. [Google Scholar] [CrossRef]
  39. Mirjalili, S.; Lewis, A.; Sadiq, A.S. Autonomous Particles Groups for Particle Swarm Optimization. Arab. J. Sci. Eng. 2014, 39, 4683–4697. [Google Scholar] [CrossRef]
  40. Rather, S.A.; Bala, P.S. Constriction coefficient based particle swarm optimization and gravitational search algorithm for multilevel image thresholding. Expert Syst. 2021, 38, 12717. [Google Scholar] [CrossRef]
  41. Vinodh, G.; Kathiravan, K.; Mahendran, G. Distributed Network Reconfiguration for Real Power Loss Reduction Using TACPSO. Int. J. Adv. Res. Electr. Electron. Instrum. Eng. 2017, 6, 7517–7525. [Google Scholar] [CrossRef]
  42. Civicioglu, P.; Besdok, E. Bernstein-Levy differential evolution algorithm for numerical function optimization. Neural Comput. Appl. 2023, 35, 6603–6621. [Google Scholar] [CrossRef]
  43. Akgungor, A.P.; Korkmaz, E. Bezier Search Differential Evolution algorithm based estimationmodels of delay parameter k for signalized intersections. Concurr. Comput. Pract. Exp. 2022, 34, e6931. [Google Scholar] [CrossRef]
  44. Emin, K.A. Detection of object boundary from point cloud by using multi-population based differential evolution algorithm. Neural Comput. Appl. 2023, 35, 5193–5206. [Google Scholar] [CrossRef]
  45. Biswas, S.; Saha, D.; De, S.; Cobb, A.D.; Jalaian, B.A. Improving Differential Evolution through Bayesian Hyperparameter Optimization. In Proceedings of the 2021 IEEE Congress on Evolutionary Computation (CEC), Krakow, Poland, 28 June–1 July 2021. [Google Scholar] [CrossRef]
  46. Awad, N.H.; Ali, M.Z.; Suganthan, P.N. Ensemble sinusoidal differential covariance matrix adaptation with Euclidean neighborhood for solving CEC2017 benchmark problems. In Proceedings of the 2017 IEEE Congress on Evolutionary Computation (CEC), Donostia/San Sebastian, Spain, 5–8 June 2017. [Google Scholar] [CrossRef]
  47. Mohamed, A.W.; Hadi, A.A.; Fattouh, A.M.; Jambi, K.M. Jambi: L-SHADE with Semi Parameter Adaptation Approach for Solving CEC 2017 Benchmark Problems. In Proceedings of the 2017 IEEE Congress on Evolutionary Computation (CEC), Donostia/San Sebastian, Spain, 5–8 June 2017; pp. 1456–1463. [Google Scholar] [CrossRef]
  48. Tanabe, R.; Fukunaga, A. Improving the search performance of SHADE using linear population size reduction. In Proceedings of the 2014 IEEE Congress on Evolutionary Computation, Beijing, China, 6–11 July 2014; pp. 1658–1665. [Google Scholar] [CrossRef]
  49. Tejani, G.G.; Savsani, V.J.; Bureerat, S.; Patel, V.K. Topology and size optimization of trusses with static and dynamic bounds by modified symbiotic organisms search. J. Comput. Civ. Eng. 2018, 32, 04017085. [Google Scholar] [CrossRef]
  50. Bansal, A.K.; Gupta, R.A.; Kumar, R. Optimization of hybrid PV/wind energy system using Meta Particle Swarm Optimization (MPSO). In Proceedings of the India International Conference on Power Electronics, New Delhi, India, 28–30 January 2011. [Google Scholar] [CrossRef]
  51. Heidari, A.A.; Mirjalili, S.; Faris, H.; Aljarah, I.; Mafarja, M.; Chen, H.L. Harris hawks optimization: Algorithm and applications. Future Gener. Comput. Syst. 2019, 97, 849–872. [Google Scholar] [CrossRef]
  52. Civicioglu, P.; Besdok, E. Bernstain-search differential evolution algorithm for numerical function optimization. Expert Syst. Appl. 2019, 138, 112831. [Google Scholar] [CrossRef]
  53. Kaur, S.; Awasthi, L.K.; Sangal, A.L.; Dhiman, G. Tunicate Swarm Algorithm: A new bio-inspired based metaheuristic paradigm for global optimization. Eng. Appl. Artif. Intell. 2020, 90, 103541. [Google Scholar] [CrossRef]
  54. Abualigah, L.; Yousri, D.; Abd Elaziz, M.; Ewees, A.A.; Al-qaness, M.A.A.; Gandomi, A.H. Aquila optimizer: A novel meta-heuristic optimization algorithm. Comput. Ind. Eng. 2021, 157, 107250. [Google Scholar] [CrossRef]
  55. Hu, G.; Zhu, X.N.; Wei, G.; Chang, C.T. An improved marine predators algorithm for shape optimization of developable Ball surfaces. Eng. Appl. Artif. Intell. 2021, 105, 104417. [Google Scholar] [CrossRef]
  56. Siddall, J.N. Optimal Engineering Design: Principles and Applications; CRC Press: Boca Raton, FL, USA, 1982. [Google Scholar]
  57. Abdollahzadeh, B.; Gharehchopogh, F.S.; Mirjalili, S. African vultures optimization algorithm: A new nature-inspired metaheuristic algorithm for global optimization problems. Comput. Ind. Eng. 2021, 158, 107408. [Google Scholar] [CrossRef]
  58. Ekrem, Ö.; Aksoy, B. Trajectory planning for a 6-axis robotic arm with particle swarm optimization algorithm. Eng. Appl. Artif. Intell. 2023, 122, 106099. [Google Scholar] [CrossRef]
Figure 1. Proposed mESC flowchart.
Biomimetics 10 00232 g001
Figure 2. Convergence curves of mESC, ESC, mESC1, mESC2, mESC3, and mESC4 on CEC2022.
Biomimetics 10 00232 g002
Figure 3. 24 Pole truss structure.
Biomimetics 10 00232 g003
Figure 4. Comparison of convergence of various algorithms on 24 bars.
Biomimetics 10 00232 g004
Figure 5. Topology optimization of 24 bar truss using various algorithms.
Biomimetics 10 00232 g005aBiomimetics 10 00232 g005b
Figure 6. 72 bar truss.
Biomimetics 10 00232 g006
Figure 7. Convergence diagram of 72 bar truss.
Biomimetics 10 00232 g007
Figure 8. Topology optimization of 72 bar truss using various algorithms.
Biomimetics 10 00232 g008aBiomimetics 10 00232 g008b
Figure 9. Welded beam structure.
Biomimetics 10 00232 g009
Figure 10. Stepping cone pulley.
Biomimetics 10 00232 g010
Figure 11. Robot clamping structure.
Biomimetics 10 00232 g011
Figure 12. Rolling element bearing structure.
Biomimetics 10 00232 g012
Table 1. Parameter settings.
AlgorithmsParameterValue
PO r : random number r [ 0 ,   1 ]
GMO lim v e l : the ratio of distance to speed lim v e l = 0.1
ε : parameter ε = 0
FATA θ : parameter θ [ 0 ,   1 ]
α : the transformation mode of individual light α [ 0 ,   1 ]
MGO d n : number of divisions d n = D / 4   a n d   d n 1
r 1 6 : random number r 1 6 ( 0 , 1 )
d 1 : constant parameter d 1 = 0.2
w , d 2 : constant parameter w = 2 , d 2 = 0.5
CPO r : random number r [ 0 ,   1 ]
τ 1 , τ 2 , τ 3 r 1 ,   r 2 : random number τ 1 : random numbers based on normal distribution, τ 2 [ 0 ,   1 ] , τ 3 [ 0 ,   1 ] , r 1 ,   r 2 [ 1 , N u m ]
PLO r 5 : parameter r 5 < 0.05
NRBO r : random number r ( 0 ,   1 )
δ : balance parameter δ [ 1 ,   1 ]
IAO θ , r a n d , σ , ε , ς , κ , ω : random number θ , r a n d , σ , ε , ς , κ , ω [ 0 , 1 ]
LEA λ c : acceptance rate λ c = 0.5
ESC R a n d i , d : random number R a n d i , d ( 0 ,   1 )
a : proportion of calm group a = 0.15
b : proportion of aggregation groups b = 0.35
c : proportion of panic group c = 0.5
m 1 ,   m 2 : binary variable m 1 ,   m 2 = 0   o r   1
AGPSO C 1 ,   C 2 : learning factor C 1 = C 2 = 2
ω max , ω min : maximum/minimum weight value ω max = 0.9 , ω min = 0.4
CPSOGSA p h i 1 , p h i 2 : shrinkage coefficient p h i 1 = 2.05 , p h i 2 = 2.05
p h i p h i 1 + p h i 2
ω : weight ω = 2 / ( p h i 2 + p h i 2 4 p h i )
ω d a m p : weight damping ratio ω d a m p = 1
C 1 , C 2 : learning factor C 1 = ω p h i 1 , C 2 = ω p h i 2
TACPSO ω max , ω min : maximum/minimum weight value ω max = 0.9 , ω min = 0.4
C 1 ,   C 2 : learning factor C 1 = C 2 = 2
BDEC: crossover probabilityC = 0.2
F: scale factorF = 0.5
BeSD K : parameter K = 5
U p : upper boundary U p = 100
L ow : lower boundary L ow = - 100
MDE C : crossover probability C = 0.2
F : scale factor F = 0.5
MadDE q r a t e : optimal cross probability in personal history q r a t e = 0.01
p b r a t e : optimal probability of personal history p b r a t e = 0.18
a r c r a t e : archiving rate a r c r a t e = 2.3
m e m o r y s i z e : size m e m o r y s i z e = 2.3
max p o p s i z e : maximum population size max p o p s i z e = 30
min p o p s i z e : minimum population size min p o p s i z e = 4
LSHADE-cnEpSin μ F ,   μ C R ,   μ f r e q μ F = μ C R = μ f r e q = 0.5
r : parameter r = 1.4
p p = 0.11
H H = 0.5
G l s G l s = 250
LSHADE-SPACMA F : scale factor F = 0.5
H : historical memory size H = 5
C : crossover probability C = 0.8
p : probability of initial control mutation strategy p = 0.3
p : probability of minimum control mutation strategy p = 0.15
LSHADE p : probability of controlling mutation strategy p = 0.11
H : historical memory size H = 5
M a x P o p s i z e : maximum population M a x P o p s i z e = 30
M i n P o p s i z e : minimum population M i n P o p s i z e = 4
MPSO ω max , ω min : maximum/minimum weight value ω max = 0.9 , ω min = 0.4
C 1 , C 2 : learning factor C 1 = 2 , C 2 = 2
MFO t : randomly generated number t [ 1 ,   1 ]
BWO B 0 Random numbers between (0, 1)
p Random numbers between [ 0 ,   D ]
r 1 7 Random numbers between ( 0 , 1 )
W f : probability of fallingDecrease from 0.1 to 0.05
WOA r a n d : random number r a n d ( 0 , 1 )
a : parameter a : reduce from 2 to 0
A : contraction unit A [ a , a ]
l : parameter l [ 1 , 1 ]
HHO R : random number R [ 0 , 1 ]
J : random number J [ 0 , 2 ]
BSD r : random number r [ 0 ,   1 ]
TSA r a n d : random number r a n d ( 0 , 1 )
AO r a n d : random number r a n d ( 0 , 1 )
s : random number s = 0.01
u , v : parameter u and v follow the Gaussian distribution of N ( 0 , σ 2 ) and N ( 0 , 1 ) random numbers
β : random number s = 1.5
GWO a : parameter a : reduce from 2 to 0
r 1 ,   r 2 : parameter r 1 ,   r 2 ( 0 , 1 )
AVOA L 1 ,   L 2 : parameter L 1 ,   L 2 ( 0 , 1 )
z : random number z [ 1 , 1 ]
h : random number h [ 2 , 2 ]
k 1 , k 2 , k 3 , k 4 , k 5 , k p 1 , k p 2 : random number k 1 , k 2 , k 3 , k 4 , k 5 , k p 1 , k p 2 [ 0 , 1 ]
MNEARO L : step factor L = 0.1
AHA N : flight step length N = 0.1
M : memory coefficient M = 0.5
DMOA M S : moving step size M S = 0.1
V f : warning factor V f = 0.5
SHO F f : foraging parameters F f = 0.5
λ : random number λ ( 0 , 2 )
ZOA C F : ethnic cognition C F = 0.5
Table 2. Experimental results of ESC, mESC, mESC1, mESC2, mESC3, and mESC4 on CEC2022.
FIndexESCmESC1mESC2mESC3mESC4mESC
1Mean1.5042 × 1041.5805 × 1041.4008 × 1041.2580 × 1042.7391 × 1031.2049 × 103
Std6.4060 × 1036.9949 × 1037.5581 × 1033.2190 × 1031.7844 × 1031.1660 × 103
2Mean4.6222 × 1024.5643 × 1024.5313 × 1024.6310 × 1024.5293 × 1024.5191 × 102
Std1.3323 × 1019.5756 × 1001.3892 × 1011.3851 × 1018.8945 × 1009.6902 × 100
3Mean6.0001 × 1026.0001 × 1026.0001 × 1026.0000 × 1026.0000 × 1026.0000 × 102
Std1.6406 × 10−22.6841 × 10−21.9361 × 10−21.5377 × 10−21.2641 × 10−48.2641 × 10⁻⁵
4Mean8.6415 × 1028.6447 × 1028.3105 × 1028.6223 × 1028.6080 × 1028.2202 × 102
Std9.3537 × 1007.6704 × 1001.1628 × 1018.5616 × 1001.0106 × 1018.9211 × 100
5Mean9.0083 × 1029.0082 × 1029.0279 × 1029.0069 × 1029.0013 × 1029.0005 × 102
Std8.7322 × 10−11.2167 × 1007.1340 × 1001.2801 × 1005.1178 × 10−11.7219 × 10⁻¹
6Mean4.7675 × 1035.6998 × 1034.7194 × 1034.1786 × 1034.4762 × 1034.8843 × 103
Std3.7426 × 1033.3620 × 1033.7923 × 1032.8831 × 1032.4457 × 1032.8294 × 103
7Mean2.0357 × 1032.0386 × 1032.0532 × 1032.0357 × 1032.0340 × 1032.0292 × 103
Std8.8387 × 1007.7590 × 1003.7749 × 1019.6595 × 1005.8826 × 1001.0311 × 101
8Mean2.2311 × 1032.2310 × 1032.2307 × 1032.2300 × 1032.2351 × 1032.2218 × 103
Std2.0788 × 1001.7741 × 1003.2975 × 1011.6037 × 1002.1735 × 1011.0352 × 100
9Mean2.4830 × 1032.4822 × 1032.4808 × 1032.4837 × 1032.4810 × 1032.4806 × 103
Std2.7814 × 1001.5672 × 1001.6116 × 10−22.2597 × 1007.2857 × 10−16.7340 × 10⁻¹
10Mean2.5808 × 1032.5217 × 1032.6196 × 1032.5283 × 1032.5924 × 1032.5219 × 103
Std1.1585 × 1026.1119 × 1011.7712 × 1028.6926 × 1011.4213 × 1028.7564 × 101
11Mean2.9083 × 1032.9001 × 1032.9033 × 1032.9012 × 1032.9162 × 1032.9000 × 103
Std3.1664 × 1013.9569 × 10−26.6868 × 1016.4979 × 1014.6994 × 1016.4327 × 101
12Mean2.9494 × 1032.9460 × 1032.9545 × 1032.9533 × 1032.9441 × 1032.9437 × 103
Std9.0245 × 1006.4685 × 1001.0251 × 1017.6731 × 1007.2801 × 1007.6958 × 100
Table 3. Conditions for 24 bar truss structure.
ParameterValue
Design variable A i , i = 1 ,   2 ,   ,   24
Two types of load conditionsCondition 1: F 1 = 5 × 10 4   N ,   F 2 = 0
Condition 2: F 1 = 0 ,   F 2 = 5 × 10 4   N
Centralized quality of node 3500 kg
Stress constraint σ i max = 173.43   M P a
Displacement constraint δ 5 y & 6 y max = 10   m m
Natural frequency constraint f 1 30   H z
Continuous cross-sectional area [ A l o w e r ,   A u p p e r ] = [ 40 ,   40 ]   c m 2 , Key areas: 1   c m 2
Material characteristics E = 6.9 × 10 10   P a   a n d   ρ = 2740   k g / m 3
Table 4. Optimization results of 24 bars.
VariablemESCNRBOMPSOCPOMFOBWOWOAHHOBSDTSA
A1 (cm2)-1.1809-21.7301-11.8313-9.9764-5.6128
A2 (cm2)--0.125318.6976-18.7441--8.0505-
A3 (cm2)---25.8991-7.070527.03944.8722-0.9070
A4 (cm2)---0.17802-20.5284----
A5 (cm2)------16.2991--1.4330
A6 (cm2)-22.7865-31.76490.29299.77761.500911.17585.34443.3680
A7 (cm2)19.705425.424521.376913.151022.419815.989120.711018.317024.626419.1069
A8 (cm2)3.437210.23963.09646.53047.268213.664613.259813.68936.26424.7147
A9 (cm2)2.2248--27.015315.98918.5750----
A10 (cm2)-2.49591.398439.3547-15.999834.4416-1.74614.7910
A11 (cm2)----------
A12 (cm2)4.0914--25.963121.175114.0195-3.2835--
A13 (cm2)13.838620.435717.8990--11.700619.062915.641624.150317.4419
A14 (cm2)-1.0096-2.7350---6.675511.63203.4732
A15 (cm2)3.73699.53233.85403.69317.62067.473912.71738.37686.13464.1225
A16 (cm2)23.871723.503835.0153428.381426.311718.934332.247723.516325.130324.2617
A17 (cm2)-1.4094-10.5085-13.3664-14.3179--
A18 (cm2)-1.1537---7.4196----
A19 (cm2)-0.1521-----2.8833-0.5071
A20 (cm2)-----4.8082----
A21 (cm2)---14.4812-19.39184.3067---
A22 (cm2)0.93653.874713.1986-2.40498.2420-11.58276.78453.0967
A23 (cm2)-0.57661.841818.2226--13.91501.89682.13762.6050
A24 (cm2)0.9666--18.226417.9944-2.024310.4043-2.3582
Optimal weight121.5840182.1442149.3737357.1651150.0160308.8677309.0326206.3347185.6925159.9285
Mean140.5701247.1569207.97515576.3910198.1633366.5999492.0880315.3927233.8727309.2789
Table 5. Setting of 72 bar truss structure.
ParameterValue
Design variable G i , i = 1 ,   2 ,   ,   16
Two types of load conditionsCondition 1: F 1 x = F 1 y = 22.25   k N , F 1 z = 22.25   k N
Condition 2: F 1 z = F 2 z = F 3 z = F 4 z = 22.25   k N
Centralized quality of nodes 1, 2, 3, and 42270 kg
Stress constraint σ i max = 172.375   M P a
Displacement constraint δ 1 x & 1 y & 2 x & 2 y & 3 x & 3 y & 4 x & 4 y max = 6.35   m m
Natural frequency constraint f 1 4   H z   a n d   f 3 6   H z
Continuous cross-sectional area [ A l o w e r ,   A u p p e r ] = [ 30 ,   30 ]   c m 2 , Key areas: 1   c m 2
Material characteristics E = 6.895 × 10 10   P a   a n d   ρ = 2767.99   k g / m 3
Table 6. Optimization of 72 bar truss structure.
GroupMembermESCNRBOMPSOCPOMFOBWOWOAHHOBSDTSA
G1 (cm2)A1~A45.454910.457430.00004.50104.84959.828716.38274.70084.75765.3634
G2 (cm2)A5~A1211.025510.611811.127622.86477.92187.78106.31318.265711.443013.2010
G3 (cm2)A13~A16---10.9710-8.47826.50495.0809--
G4 (cm2)A17~A18----9.60467.904618.17877.5606--
G5 (cm2)A19~A229.20639.29866.35484.21466.85089.144410.28188.05969.40204.6674
G6 (cm2)A23~A307.40376.87588.140811.52618.61748.120111.50437.51268.870913.1645
G7 (cm2)A31~A34-5.4373-2.7353-7.0007----
G8 (cm2)A35~A363.812116.301630.000011.2471-8.0223-3.47834.4508-
G9 (cm2)A37~A4011.846115.421130.000026.169130.000011.555310.241715.788412.665216.6723
G10 (cm2)A41~A488.06488.53487.58428.81678.61857.98498.83189.44548.050810.2219
G11 (cm2)A49~A52---27.3933-8.0350----
G12 (cm2)A53~A54-17.4406---7.409912.07650.2841-9.9491
G13 (cm2)A55~A5815.572018.797012.273111.298712.411114.630015.615215.210714.213122.4342
G14 (cm2)A59~A668.00856.84808.486515.77998.83288.50228.98457.81038.47837.1551
G15 (cm2)A67~A701.8446----8.2163---4.1077
G16 (cm2)A71~A72---16.0972-7.5293----
Optimal weight 443.7325541.6204567.3181833.1809479.0954605.2332554.6159466.3894450.38803261.9035
Mean 447.1184547.7935575.53734305.5896495.9691611.5502677.8491469.2699452.075323,188.7348
Table 7. Optimization results of reducer design.
AlgorithmsOptimize Variables Optimal Cost
C1C2C3C4C5C6C7
NRBO3.5762932840.70000000017.0000000008.0953313448.1281720083.3521045935.2874718433041.390312214
MPSO3.6000000000.80000000017.0000000007.3000000007.7156084153.3489670585.2863510023568.813527023
CPO3.5898885810.71686561017.3507439237.9415945347.9742870143.3747380835.3002983553200.926055200
BWO3.5178890780.70000000017.0000000007.3000000007.9791929903.4050741095.2891434253022.944192861
WOA3.5000000000.70000000017.5947076708.0508554058.0604858133.8010666135.3334594193275.837132091
HHO3.5988081550.70000000017.0000000007.4442294058.1189946683.3590344125.2867973913045.625326530
TSA3.5134669520.70000000017.0000000007.3000000008.1299146763.3696854115.3233695933037.320035061
AO3.5091081620.70000000017.0100981258.2360443438.2453583943.3630035445.3021389263032.817963447
GWO3.5020629070.70000000017.0000000007.5122624437.8699836763.3532225915.2870047173001.411114536
mESC3.5000632210.70001264417.0000000007.3000000007.7153199533.3505407035.2866544182994.506339787
Table 8. Optimization results of welded beam design.
AlgorithmsOptimize Variables Optimal Cost
C1C2C3C4
NRBO0.1953536233.1978431129.9999295740.1953536231.751139663
MPSO0.1988323073.3373652999.1920243220.1988323071.670217726
CPO0.1743159324.8528843419.0700207750.2748678532.424133890
BWO0.1250000005.9099536698.9793934530.2088383261.898245842
WOA0.1254245425.6839074799.4512231900.1976510981.867802825
HHO0.1920393623.4671594349.2041389130.1994584361.683996291
TSA0.1985168923.3677892519.1834538420.1994282251.676904155
AO0.1250000005.4826936199.5738507130.1978585891.870158707
GWO0.1983187293.3464290189.1947117800.1988219781.671023180
mESC0.1988568183.3370564039.1914577820.1988568191.670306973
Table 9. Optimization results of stepping cone pulley.
AlgorithmsOptimize Variables Optimal Cost
C1C2C3C4C5
MPSO60.0000000060.0000000090.00000000090.00000000084.4853772671.843733 × 1013
CPO42.48478531551.84085406781.25974038088.64632383289.4998649897.621411 × 1011
AVOA40.91041742556.29655652875.05585044689.98590767789.95376247318.240889727
BWO40.17064568355.18663939973.53075981488.35614197088.4446475833.093407 × 108
WOA42.08987741859.51914603177.29273724190.00000000084.4803697826.663866 × 1010
HHO40.80528531756.15176631374.86284400989.75472152584.82237990619.535605020
TSA41.10178249156.51869000875.34585193190.00000000090.0000000008.861758 × 108
AO40.92473748756.30896758075.08798975790.00000000089.9515060332.468629 × 106
GWO40.87794416356.24894847174.99458866889.90847121587.3562700073.104622 × 105
mESC40.55037789755.80071837074.39484205389.19411848985.24592868416.983218316
Table 10. Optimization of robot gripping.
AlgorithmsOptimize Variables Optimal Cost
C1C2C3C4C5C6C7
MPSO150.00000000095.759902552200.00000000050.000000000150.000000000150.6051881853.1400000004.153373986
CPO137.294003282105.373760292137.52363955728.46397552683.002354501150.0655612172.6316853137.097144505
AVOA149.706361538100.150569369176.07279027149.183239911104.041261757108.5212706162.5354883683.617699429
BWO126.906726514106.159011456164.70797717819.928074374118.764459960117.1909535652.5419942134.557386267
WOA149.999959796122.837277782161.53648162521.759499781120.981821722164.5979923732.8116520164.782923603
HHO149.899324642142.921278615158.7041805120.00540794082.922639703176.8462693502.2971266054.705109515
TSA150.000000000146.228369030186.2443598923.51875603632.108921190111.3742960801.7715803853.028724915
AO149.793012269149.485909987193.7797954550.00000000010.242012018114.5693615901.6309622742.939182773
GWO149.840044164138.061632796197.17381969011.623821088145.092241881102.9109525272.4091187162.710770687
mESC149.999999988138.941007919199.99999955910.918737851147.641681524101.8266371612.3677873422.641270695
Table 11. Optimization of rolling element bearings.
AlgorithmsOptimize Variables Optimal Cost
C1C2C3C4C5C6C7C8C9C10
MPSO125.000031.500050.49000.60000.60000.50000.70000.40000.10000.85002.041186421 × 1018
CPO126.751519.25166.21310.59190.55990.49400.65670.33660.02040.626322,969.355311515
AVOA127.920018.00005.02720.60000.60000.49990.69980.39070.06520.60007012.353939168
BWO129.109618.02514.51000.60000.60000.50000.70000.30000.02000.600017,038.621657089
WOA129.999318.00004.51000.60000.57130.40240.70000.30000.02000.600017,302.364139520
HHO131.199218.00004.52110.60000.60000.48790.69800.30000.09100.600016,958.215169212
TSA130.327418.00964.51000.60000.60000.43860.60000.30000.08040.600016,990.260539260
AO129.136718.00974.64520.60000.60000.40000.61890.30000.10000.600017,010.229234223
GWO129.549318.00304.91830.60000.60000.41010.63580.32890.04590.600016,991.198492525
mESC131.200018.00005.18770.60000.60000.47640.62460.30000.07930.600016,958.202286941
Disclaimer/Publisher’s Note: The statements, opinions and data contained in all publications are solely those of the individual author(s) and contributor(s) and not of MDPI and/or the editor(s). MDPI and/or the editor(s) disclaim responsibility for any injury to people or property resulting from any ideas, methods, instructions or products referred to in the content.

